Introduction
Renal cell carcinoma (RCC) is the most common cancer
of the human urinary system and accounts for 2–3% of all
malignancies in adults (1). In the
United States alone, there were ~62,700 new cases of RCC and 14,240
mortalities in 2016 (2). Due to
the introduction of novel therapeutic strategies, including
prevention, early detection and targeted treatments, such as
sunitinib, which obtained an 11-month progression-free survival as
compared to 5 months for the INF-α group (3). There has been a steady decline in the
mortality rates of cancer over the past 20 years (4). Current study is focused on developing
effective methods of treating metastatic RCC (mRCC), which is one
of the most treatment-resistant malignancies. The prognosis of
patients with mRCC is poor; the 5-year survival rate is <10%
(5,6) and the median overall survival time is
<1 year (7). Therefore, it is
imperative to explore the underlying mechanisms of RCC metastasis
to identify biomarkers that predict metastasis and patient
prognosis, and enable the development of effective treatment
strategies to treat RCC.
Polypyrimidine tract-binding protein 1 (PTBP1), a
heterogeneous nuclear ribonucleoprotein (hnRNP), is a
multi-functional RNA-binding protein (8). Previous studies have demonstrated
that it is involved in mRNA transport and stabilization, as well as
the initiation of translation at the internal ribosome entry site
(9). PTBP1 also participates in a
number of biological processes, including cell structure and
motility maintanence, immunity, protein metabolism and the cell
cycle (10,11). The overexpression of PTBP1 has been
detected in several different types of cancer, including brain
(12,13), colorectal (14), ovarian (15), gastric (16) and breast cancer (17). In glioma, high PTBP1 expression is
associated with increased malignancy and poor patient prognosis
(18). Furthermore, the expression
of PTBP1 is increased in advanced ovarian tumors compared with
benign tumors and a correlation between PTBP1 expression and the
degree of malignancy has been identified (15). Studies have demonstrated that PTBP1
serves an important role in regulating the pyruvate kinase muscle
(PKM)1/PKM2 ratio and the generation of PKM2, which is universally
overexpressed in cancer to promote aerobic glycolysis and the
development of drug resistance (19–21).
Furthermore, PTBP1 regulates the stability of hypoxia inducible
factor (HIF)-1α mRNA (22) and the
B-cell lymphoma extra large alternative 5′-splice site (23). However, the expression of PTBP1 in
RCC and its potential mechanism of action remain unclear.
The present study used tissue microarrays (TMA) to
measure the expression of PTBP1 expression in tissues from 307
patients with renal cancer and 34 normal renal tissues (NRT). It
was subsequently assessed whether there was an association between
PTBP1 expression and the clinical features of RCC, including 5-year
overall survival and disease-specific survival rates. It was also
determined whether PTBP1 regulates RCC proliferation, migration,
invasion and angiogenesis in vitro and metastasis in
vivo.
Materials and methods
Patients and specimens
RCC cohorts from the Department of Pathology of
Affiliated Hospital of Xuzhou Medical University (Xuzhou, China)
recruited between February, 2005 and December, 2008 containing 34
normal renal tissues (from subjects aged between 20 to 75 years;
female/male ratio, 13/21) and 307 RCC tissues (from patients aged
between 11 to 80 years; female/male ratio, 102/205) were assessed
in the present study. The RCC tissues were obtained from patients
with RCC and the healthy tissues were obtained from healthy
participants. Patients were enrolled in the current study from
February, 2005 to December, 2013. Informed consent was obtained
from all patients and institutional approval for the current study
was obtained from the Review Board of the Affiliated Hospital of
Xuzhou Medical University. Data from the TCGA database (https://cancergenome.nih.gov/) were also cited. The
samples were graded according to the AJCC staging system: I–II,
T1–2N0M0; III–IV,
T3N0–2M0,
T1–2N1–2M0,
T1–4N2M0 and
T1–4N0–2M1 (24).
TMA immunohistochemistry (IHC)
A standard streptavidin-peroxidase kit
(Biotin-Streptavidin HRP Detection Systems, Beijing Zhongshan
Golden Bridge Biotechnology, Beijing, China) was utilized for IHC,
following the manufacturer's protocol. TMA slides were dewaxed at
55°C for 2 h, followed by two 20-min washes with xylene and were
then treated using a graded series of ethanol and distilled water
for antigen retrieval. Endogenous peroxidases were inhibited by 3%
H2O2 for 30 min at room temperature. This was
followed by blocking with 5% normal goat serum for 30 min at room
temperature. Subsequently, the sections were incubated with goat
polyclonal PTBP1 antibody (1:100; sc-16547; Santa Cruz
Biotechnology, Inc., Dallas, TX USA) overnight at 4°C and then with
a biotin-labeled secondary antibody (1:500; ZB-2050; Beijing
Zhongshan Golden Bridge Biotechnology, Beijing, China) for 1 h at
room temperature followed by horseradish peroxidase reagent.
Sections were then stained using diaminobenzidine (Beijing
Zhongshan Golden Bridge Biotechnology) for 30 sec at room
temperature and positive expression of PTBP1 was identified by
brown staining using a microscope (Nikon ECLIPSE 80i; Nikon Corp.,
Tokyo, Japan) at ×100 and ×400 magnification. NIS-Elements F
4.00.00 software was used to acquire images and for analysis.
Slides that were incubated without primary antibody were used as a
negative control.
Immunostaining evaluation
Positive PTBP1 immunostaining was defined as
staining that primarily occurred in the nucleus with little
staining occurring in the cytoplasm. Two pathologists blinded to
the clinical data evaluated immunostaining intensity and determined
the proportion of immune-reactive cells. Staining intensity was
scored using the following scoring system: 0, negative; 1, weak; 2,
moderate; or 3, strong. The proportion of protein-positive stained
cells was graded as: 1, 0-25%; 2, 26-50%; 3, 51-75%; or 4, 76-100%.
The final semiquantitative immunoreactivity score (IRS) was
calculated by multiplying the staining intensity score by the
percentage of positive cells (25). The average score from two tissue
cores was taken as the final score. According to the IRS, PTBP1
staining patterns were defined as negative, IRS 0; weak, IRS 1–2;
moderate, IRS 3–6; or strong, IRS 8–12.
Animals
A total of 12 8-week-old female BALB/c nude mice
weighing 16–17 g used in the current study were purchased from the
Charles River Laboratories (Beijing, China) and all experiments
involving animals were approved by the Animal Care Committee of
Xuzhou Medical University. The animals were maintained in a
controlled environment with controlled temperature (~25°C),
humidity (50-70%) and (light, 07:00; dark, 22:00). The water and
mouse feed were sterilized by uperization and were freely
available.
Cell lines
The human RCC cell lines 786-O and ACHN and human
umbilical vein endothelial cells (HUVECs) were all obtained from
the Shanghai Institute of Biochemistry and Cell Biology, Chinese
Academy of Sciences (Shanghai, China). The RCC cell lines were
cultured in Dulbecco's modified Eagle's medium (DMEM) supplemented
with 10% fetal calf serum (both from Invitrogen, Shanghai, China)
at 37°C in a humidified incubator at 5% CO2. HUVECs were
cultured in RPMI-1640 supplemented with 10% fetal calf serum (both
from Invitrogen) at 37°C in a humidified incubator with 5%
CO2 (26).
Transfection with short hairpin
(sh)RNA
HIF-1α plasmid and vector were obtained from Dr Rui
Chen (Southeast University, Nanjing, China). Transfection of the
HIF-1α plasmid and vector into the 786-O and ACHN cells
(transfected with shPTBP1) was carried out using Lipofectamine 2000
transfection reagent (Invitrogen) following the manufacturer's
instructions. Human PTBP1 shRNA was cloned into the pEN-hH1c vector
and then transferred into the pDSL-hpUGIP (Invitrogen) destination
vector using LR-clonase (Invitrogen; Thermo Fisher Scientific,
Inc., Waltham, MA, USA). Lentiviruses were produced by
co-transfecting 293T cells [American Type Culture Collection
(ATCC), Manassas, VA, USA] with the shRNA expression plasmids and
packaging plasmids (psPAX2 and pMD2.G), and then the supernatants
were collected 48 h later, filtered through 0.45-mm filters and
concentrated using Amicon Ultra centrifugal filters (Millipore
100KD MWCO) (both from Millipore, Temecula, CA, USA). The
concentrated virus was used to infect the 786-O and ACHN cells.
Stable cells were selected using the 2 µg/ml puromycin for 2
weeks. The PTBP1 shRNA sequence was derived from the
shPTBP1-forward,
5′-GATCCCCGCACAGTGTTGAAGATCATCATTCAAGAGATGATGATCTTCAACACTGTGCTTTTTC-3′;
shPTBP1-reverse,
5′-TCGAGAAAAAGCACAGTGTTGAAGATCATCATCTCTTGAATGATGATCTTCAACACTGTGCGGG-3′
and the control shRNA sequence was: shCtrl-forward,
5′-GATCCCCTTCTCCGAACGTGTCACGTTTCAAGAGAACGTGACACGTTCGGAGAATTTTTC-3′;
shCtrl-reverse,
5′-TCGAGAAAAATTCTCCGAACGTGTCACGTTCTCTTGAAACGTGACACGTTCGGAGAAGGG-3′.
Cell migration and invasion assays
Cell migration and invasion assays were performed
using modified Transwell inserts (Corning, Inc., Corning, NY, USA)
with a pore size of 8 µm. The chamber was coated with
Matrigel (BD Biosciences, San Jose, CA, USA) for the invasion
assay. A total of 2×10⁴ 786-O or 4×10⁴ ACHN
cells for the migration assay; and 4×10⁴ 786-O or
8×10⁴ ACHN cells for the invasion assay, were seeded in
serum-free medium in the upper chamber. The lower chamber was
supplemented DMEM with 20% fetal calf serum. Following incubation
at 37°C for 12 h for the migration assay and 24 h for the invasion
assay, cells in the upper chamber were carefully removed using a
cotton swab. Cells that had traversed the membrane were fixed with
90% methanol at room temperature for 30 min, and then stained with
crystal violet and counted under a microscope (Olympus, DP80;
Olympus, Tokyo, Japan) at ×200 magnificatoin in 5 random fields.
SPSS 19.0 software was used for analysis.
Cell proliferation assay
A WST-8 cell counting kit-8 (CCK-8; Dojindo
Molecular Technologies, Inc., Shanghai, China) was used to assess
cell proliferation. A total of 100 µl complete medium,
containing 4×10³ stable PTBP1-knockdown 786-O or ACHN
cells or corresponding controls were seeded in a 96-well plate,
washed with PBS and cultured at 37°C in a humidified incubator for
24, 48, 72 and 96 h. A total of 10 µl CCK-8 solution mixed
with 100 µl serum-free medium was added to each well, and
cells were incubated at 37°C for 1 h. Subsequently, absorbance was
measured at 450 nm using an Epoch 2 Microplate spectrophotometer
(BioTek Instruments, Inc, Winooski, VT, USA).
Tube formation assay
A 48-well plate was coated with 100 µl
Matrigel and maintained at 37°C for 2 h. A total of
1×10⁶ 786-O and ACHN control cells, stable PTBP1
knockdown cells and stable PTBP1 knockdown cells transfected with
vector or HIF-1α plasmid were cultured with 2 ml fresh serum-free
medium in 60-mm plates for 24 h, and the supernatants were then
collected and centrifuged at a speed of 2,000 rpm for 10 min at
room temperature. A total of 20,000 HUVECs were suspended in 100
µl conditioned medium, plated in the pre-coated 48-well
plate and cultured at 37°C for 4 h. Subsequently, complete tubular
structures were visualized in 5 random fields using a microscope
(Olympus, DP80) at ×200 magnification
Western blotting
Western blotting was carried out as previously
described (27). The following
primary antibodies were used for western blotting: Goat polyclonal
hnRNPI (PTBP1) antibody (1:1,000, cat. no. sc-16547; Santa Cruz
Biotechnology, Inc.), rabbit monoclonal HIF-1α (1:1,000, cat. no.
ab1068; Abcam, Cambridge, MA, USA), rabbit polyclonal vascular
endothelial growth factor (VEGF)A (1:1,000, cat. no. I9003-1-AP;
Proteintech Group, Inc., Rosemont, IL, USA) and mouse anti-GAPDH
(1:5,000; sc-365062; Santa Cruz Biotechnology, Inc.). Protein bands
were detected using the Tanon 5200 automatic chemiluminescence
imaging analysis system using ECL reagent (Tanon, Shanghai,
China).
Tail vein metastasis model in vivo
To generate the in vivo model of metastasis,
BALB/c nude mice were randomly divided into two groups consisting
of 6 mice each. A total of 3×10⁶ luciferase
lentivirus-infected stable PTBP1-knockdown and control 786-O cells
(27) were suspended in 200
µl PBS and injected intravenously via the tail vein,
respectively. After 6 weeks, 150 µl 15 mg/ml fluorescein and
pentobarbital sodium were intraperitoneally injected into each
mouse at a dose of 100 mg/kg to induce anesthesia. A standard
bioluminescence imaging protocol was used following the
manufacturer's protocol (Night OWL II LB983; Berthold Technologies,
Bad Wildbad, Germany). The weights of the mice were 20-21 g at
sacrifice at 6 weeks.
Statistical analysis
Statistical analyses were performed using SPSS 19.0
software (IBM SPSS, Armonk, NY, USA). For TMA, two-sided Fisher's
exact tests were used to determine the association between PTBP1
expression and clinicopathological parameters. The Kaplan-Meier
method and log-rank tests were used to determine the association
between PTBP1 expression and patient survival. Univariate and
multivariate Cox regression models were generated to estimate the
crude hazard ratios (HRs), adjusted HRs and 95% confidence interval
(CI) of the HRs. Student's t-test (for pairwise comparison) and
one-way analysis of variance followed by Tukey's and Dunnett's
post-hoc tests of ANOVA (for multiple comparisons) were used to
assess differences between groups in the proliferation, migration,
invasion and angiogenesis assays. P<0.05 was determined to
indicate a significant difference.
Results
PTBP1 expression is increased in RCC
tissues
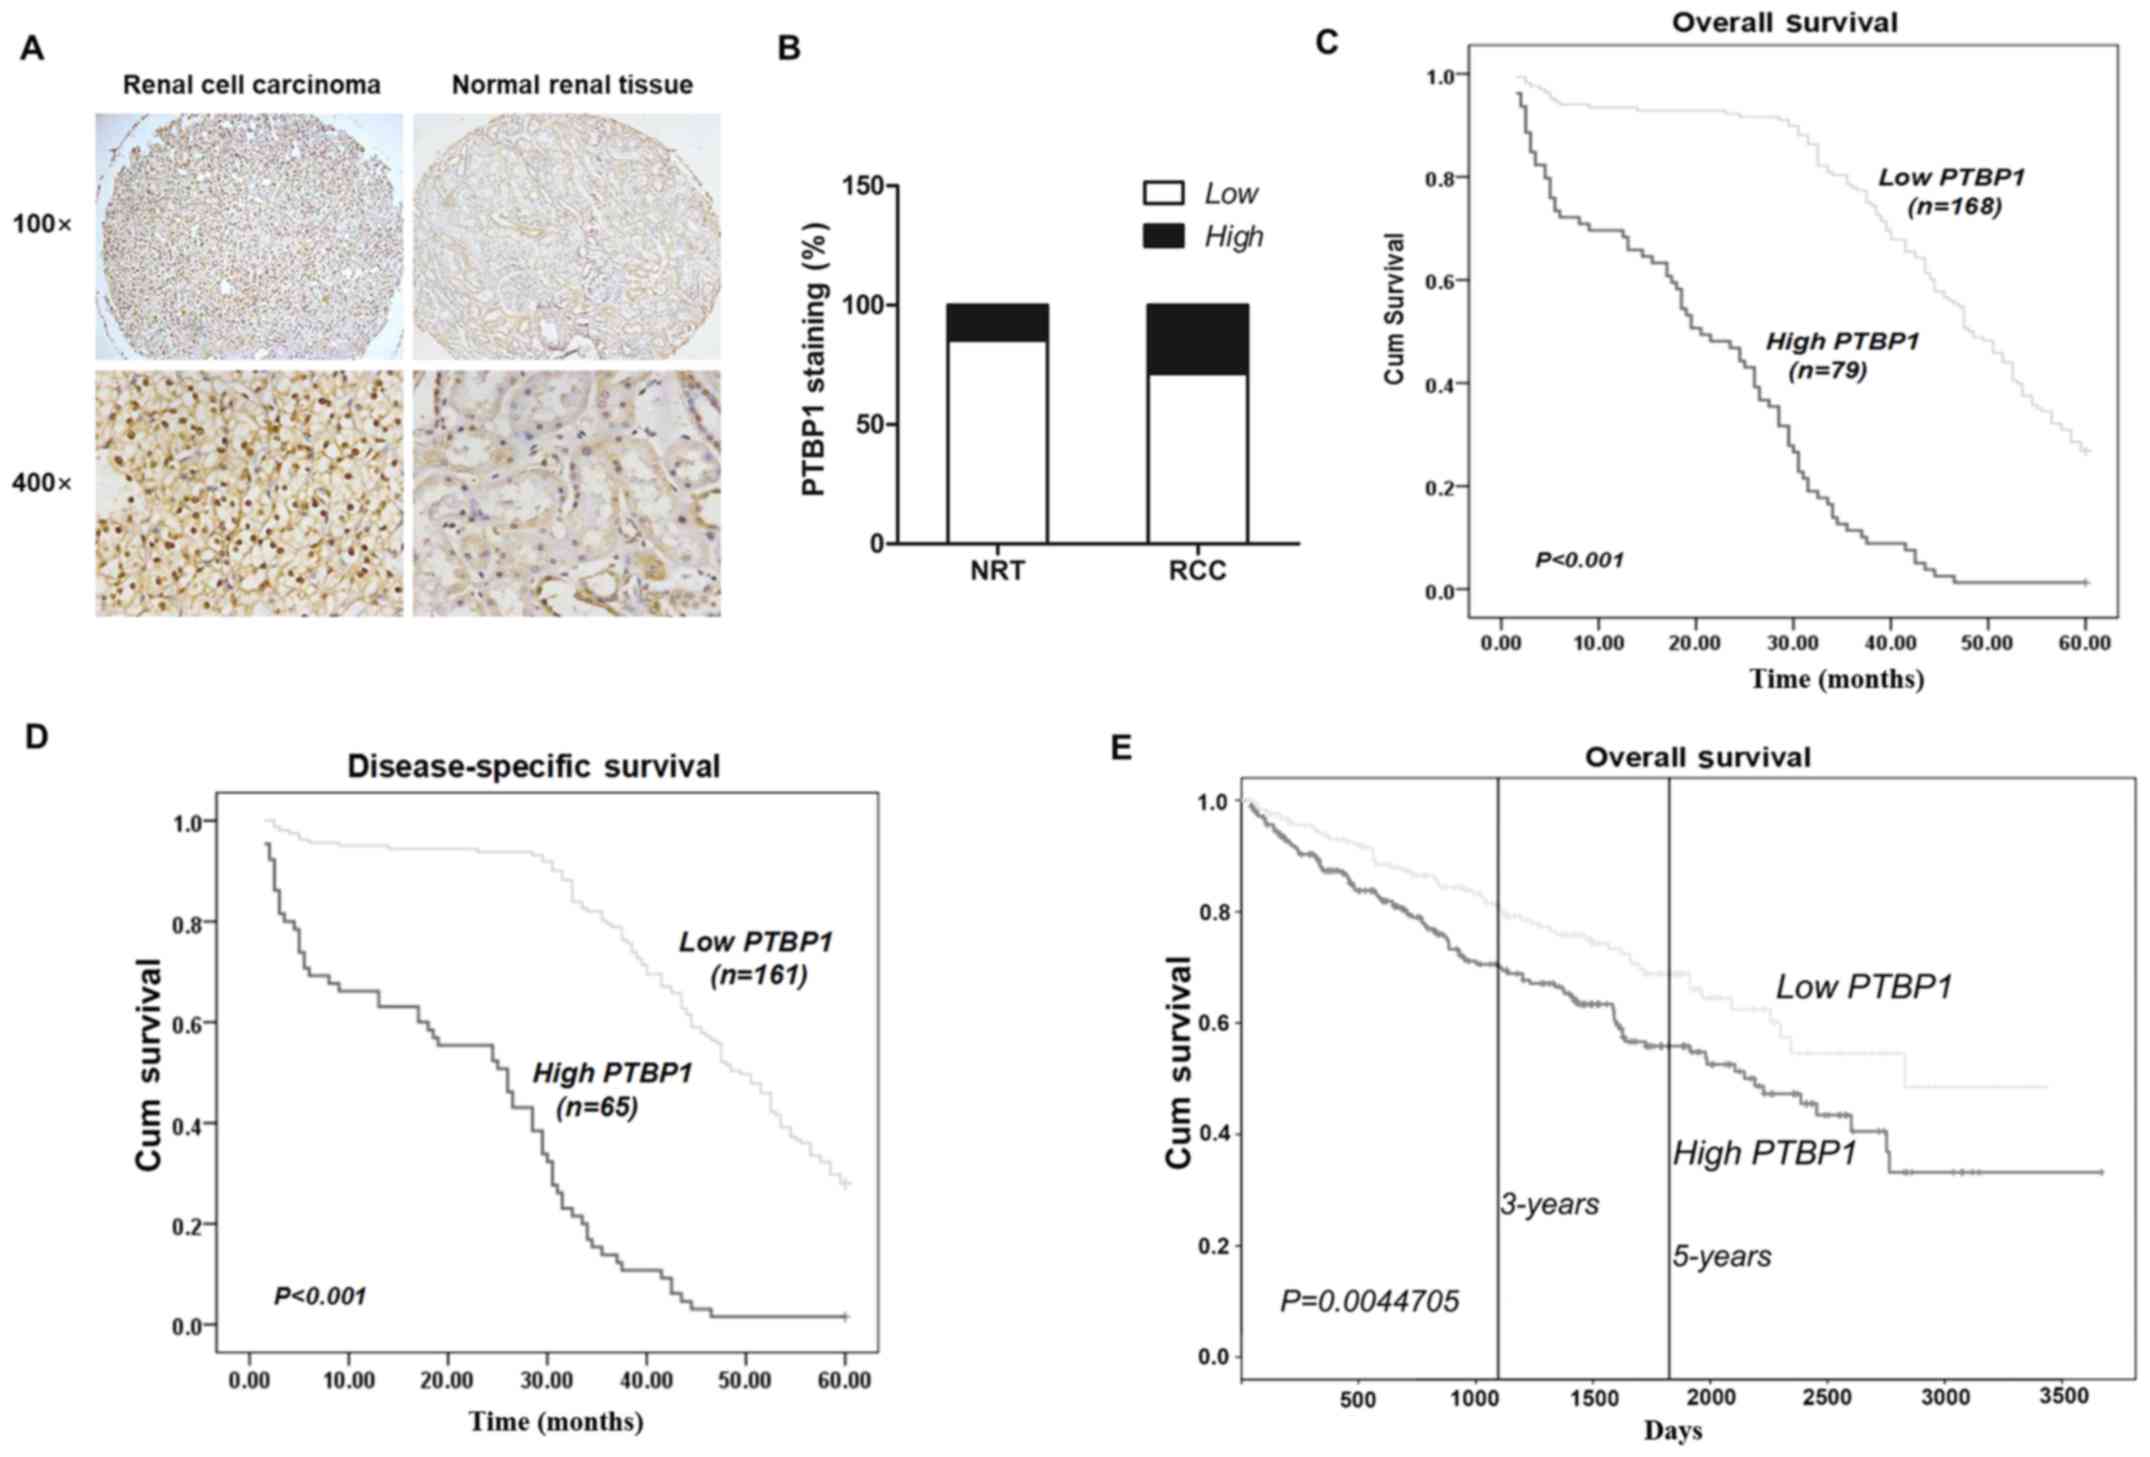
To detect PTBP1 expression in RCC, IHC was performed
using a TMA consisting of 307 RCC and 34 NRTs. The results
demonstrated that PTBP1 was primarily expressed in the nucleus and
that its expression was markedly higher in RCC tissues than in NRTs
(Fig. 1A). Positive PTBP1
expression was identified in 5 of 34 (14.7%) NRTs and 88 of 307
(25.4%) RCC tissues, indicating that the expression of PTBP1 is
significantly higher in RCC compared with NRTs (P=0.021) (Fig. 1B).
PTBP1 expression is associated with the
clinicopathological characteristics of RCC and the survival rates
of patients
Fisher's exact test was used to determine the
association between PTBP1 expression and the clinicopathological
characteristics of patients with RCC. As presented in Table I, there was a significant
association n between PTBP1 expression and tumor size (P<0.001),
pT status (P=0.002), pM status (P<0.001) and TNM stage
(P<0.001). There were no significant differences between PTBP1
expression and patient age, sex or pN status. The fact that
patients with higher TNM stages exhibited higher expression of
PTBP1 suggests that there is a positive association between PTBP1
expression and advanced tumor stage and metastasis in RCC.
 | Table IPTBP1 staining and
clinicopathological characteristics of 307 renal cancer
patients. |
Table I
PTBP1 staining and
clinicopathological characteristics of 307 renal cancer
patients.
| Variables | PTBP1 staining
|
|---|
| Low (%) | High (%) | Total | P-values |
|---|
| Age, years | | | | |
| ≤56 | 101 (68.2) | 47 (31.8) | 148 | 0.258 |
| >56 | 118 (74.2) | 41 (25.8) | 159 | |
| Sex | | | | |
| Male | 149 (72.7) | 56 (27.3) | 205 | 0.506 |
| Female | 71 (69.6) | 32 (31.4) | 102 | |
| Tumor size, cm | | | | |
| ≤7 | 136 (78.6) | 37 (21.4) | 173 | <0.001a |
| >7 | 83 (61.9) | 51 (38.1) | 134 | |
| pT status | | | | |
|
pT1-pT2 | 174 (81.3) | 40 (18.7) | 214 | 0.002a |
|
pT3-pT4 | 45 (48.4) | 48 (51.6) | 93 | |
| pN status | | | | |
| N0 | 162 (74.0) | 57 (26.0) | 219 | 0.125 |
|
N1-N2 | 57 (64.8) | 31 (35.2) | 88 | |
| pM status | | | | |
| M0 | 192 (79.7) | 49 (20.3) | 241 | <0.001a |
| M1 | 27 (40.9) | 39 (59.1) | 66 | |
| TNM stage | | | | |
| I–II | 165 (82.1) | 36 (17.9) | 201 | <0.001a |
| III–IV | 54 (50.9) | 52 (49.1) | 106 | |
To determine whether PTBP1 expression was associated
with the prognosis of patients with RCC, Kaplan-Meier survival
curves were constructed and a log-rank test was performed to
investigate the association between PTBP1 expression and 5-year
overall or disease-specific survival. The results demonstrated that
high PTBP1 expression was associated with lower overall and
disease-specific survival in RCC; high PTBP1 expression predicted
poor overall (P<0.001; Fig. 1C)
and disease-specific survival (P<0.001; Fig. 1D). Furthermore, data from the
Cancer Genome Atlas (TCGA), which contained 506 RCC patients, and
the data were examined by the Kaplan-Meier method and it
demonstrated that high PTBP1 expression is associated with lower 3-
and 5-year overall survival rates (P=0.0045; Fig. 1E).
Subsequently, univariate and multivariate Cox
regression analyses were performed to determine whether PTBP1
expression is an important prognostic factor for RCC. The results
of the univariate Cox regression analysis (Table II) demonstrated that PTBP1
expression is an important prognostic marker for RCC patient
disease-specific survival (HR=6.491; 95% CI, 4.595–9.170;
P<0.001) and overall survival (HR=6.590; 95% CI, 4.750–9.143;
P<0.001). The results of the multivariate Cox regression
analysis (Table III) confirmed
that PTBP1 expression is an important prognostic marker for RCC
patient disease-specific survival (HR=3.872; 95% CI, 2.399-6.251;
P<0.001) and overall survival (HR=3.304; 95% CI, 2.065–5.286;
P<0.001). Thus, it was determined that PTBP1 may be a molecular
prognostic marker for RCC.
| Table IIUnivariate Cox regression analysis
assessing the 5-year overall and disease-specific survival of
patients with RCC. |
Table II
Univariate Cox regression analysis
assessing the 5-year overall and disease-specific survival of
patients with RCC.
| Variable | Overall survival
| Disease-specific
survival
|
|---|
| HR | 95% CI | P-values | HR | 95% CI | P-values |
|---|
| PTBP1 (2 vs.
1) | 6.590 | 4.750–9.143 | <0.001 | 6.491 | 4.595–9.170 | <0.001a |
| M (M1
vs. M0) | 3.778 | 20282–6.225 | <0.001 | 2.860 | 1.449–5.646 | 0.002a |
| N (N1–2
vs. N0) | 3.421 | 1.842–6.352 | <0.001 | 0.597 | 0.048–4.267 | 0.607 |
| Age (2 vs. 1) | 1.069 | 0.810–1.410 | 0.637 | 1.503 | 0.786–1.411 | 0.728 |
| Tumor size (2 vs.
1) | 1.676 | 1.194–2.352 | 0.003 | 1.549 | 1.069–2.244 | 0.021a |
| T (2 vs. 1) | 1.574 | 1.178–1.102 | 0.002 | 1.473 | 1.081–2.007 | 0.014a |
| TNM stage (2 vs.
1) | 6.147 | 4.516–8.367 | <0.001 | 5.557 | 3.994–7.732 | <0.001a |
| Table IIIMultivariate Cox regression analysis
on 5-year overall and disease specific survival of patients with
RCC. |
Table III
Multivariate Cox regression analysis
on 5-year overall and disease specific survival of patients with
RCC.
| Variable | Overall survival
| Disease-specific
survival
|
|---|
| HR | 95% CI | P-values | HR | 95% CI | P-values |
|---|
| PTBP1 (2 vs.
1) | 3.304 | 2.065–5.286 | <0.001 | 3.872 | 2.399–6.251 | <0.001a |
| Age (2 vs. 1) | 0.895 | 0.646–1.144 | 0.299 | 1.129 | 0.841–1.515 | 0.421 |
| Tumor size (2 vs.
1) | 0.905 | 0.627–1.307 | 0.595 | 1.156 | 1.039–2.212 | 0.031a |
| TNM stage (2 vs.
1) | 2.992 | 1.911–4.684 | <0.001 | 2.292 | 1.440–3.648 | <0.001a |
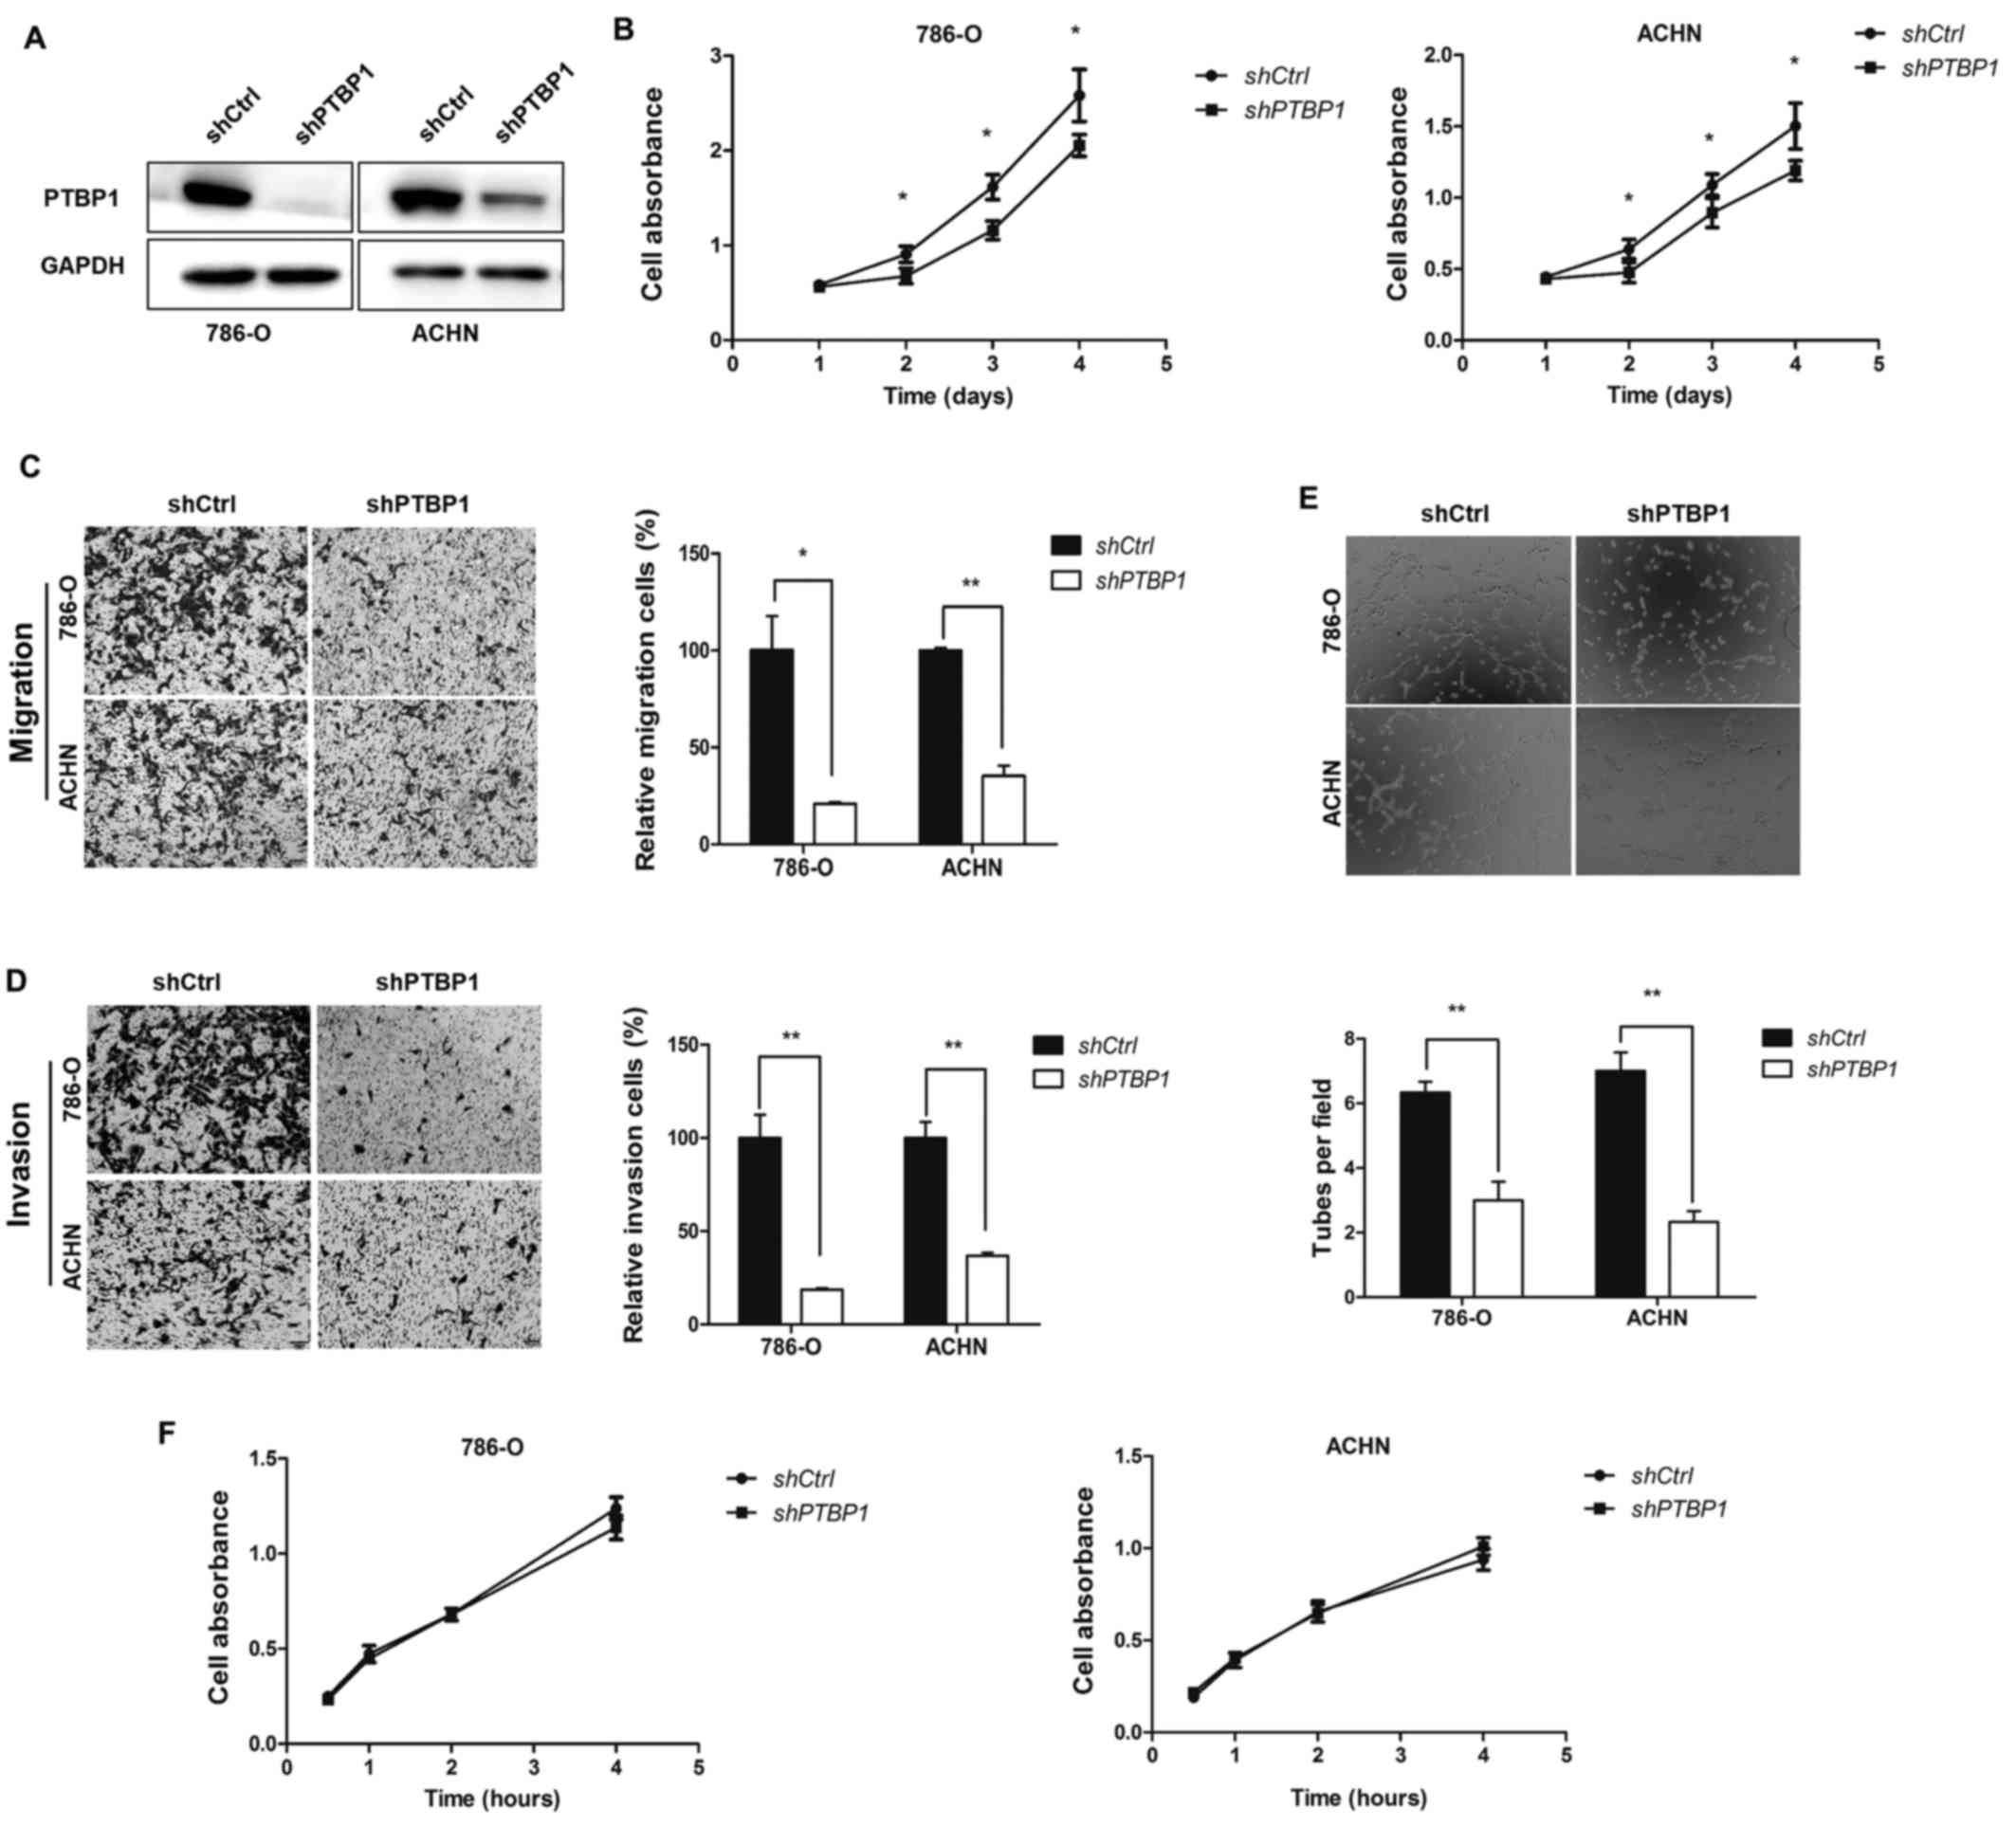
PTBP1 knockdown inhibits RCC cell
migration, invasion, proliferation and angiogenesis in vitro
To determine the role of PTBP1 in RCC, 786-O and
ACHN cells were stably transfected with lentivirus vector-mediated
control shRNA or PTBP1 shRNA to perform PTBP1 knockdown (Fig. 2A). To determine the role of PTBP1
in cell proliferation, a CCK8 assay was performed, which
demonstrated that PTBP1 knockdown significantly decreased the
proliferation of the two RCC cell lines (P<0.05; Fig. 2B). Subsequently, Transwell assays
were used to detect the effect of PTBP1 on the metastasis of RCC
cells. The results revealed that PTBP1 silencing significantly
decreased 786-O and ACHN cell migration compared with the
respective controls (P<0.05; Fig.
2C). The cell invasion assay indicated that the invasive
abilities of 786-O and ACHN cells were significantly decreased
following PTBP1 silencing (P<0.01; Fig. 2D).
As PTBP1 knockdown suppressed the proliferation,
migration and invasion of the RCC cell lines, it was speculated
that PTBP1 knockdown would decrease the rate of angiogenesis in RCC
cells. To determine whether this was the case, a tube formation
assay was performed. The results indicated that the average number
of complete tubular structures formed by HUVECs in conditioned
medium from PTBP1-silenced 786-O and ACHN cells was significantly
decreased compared with corresponding controls (P<0.01; Fig. 2E), however the proliferation of
HUVECs following culture in conditioned medium was unaffected
(Fig. 2F).
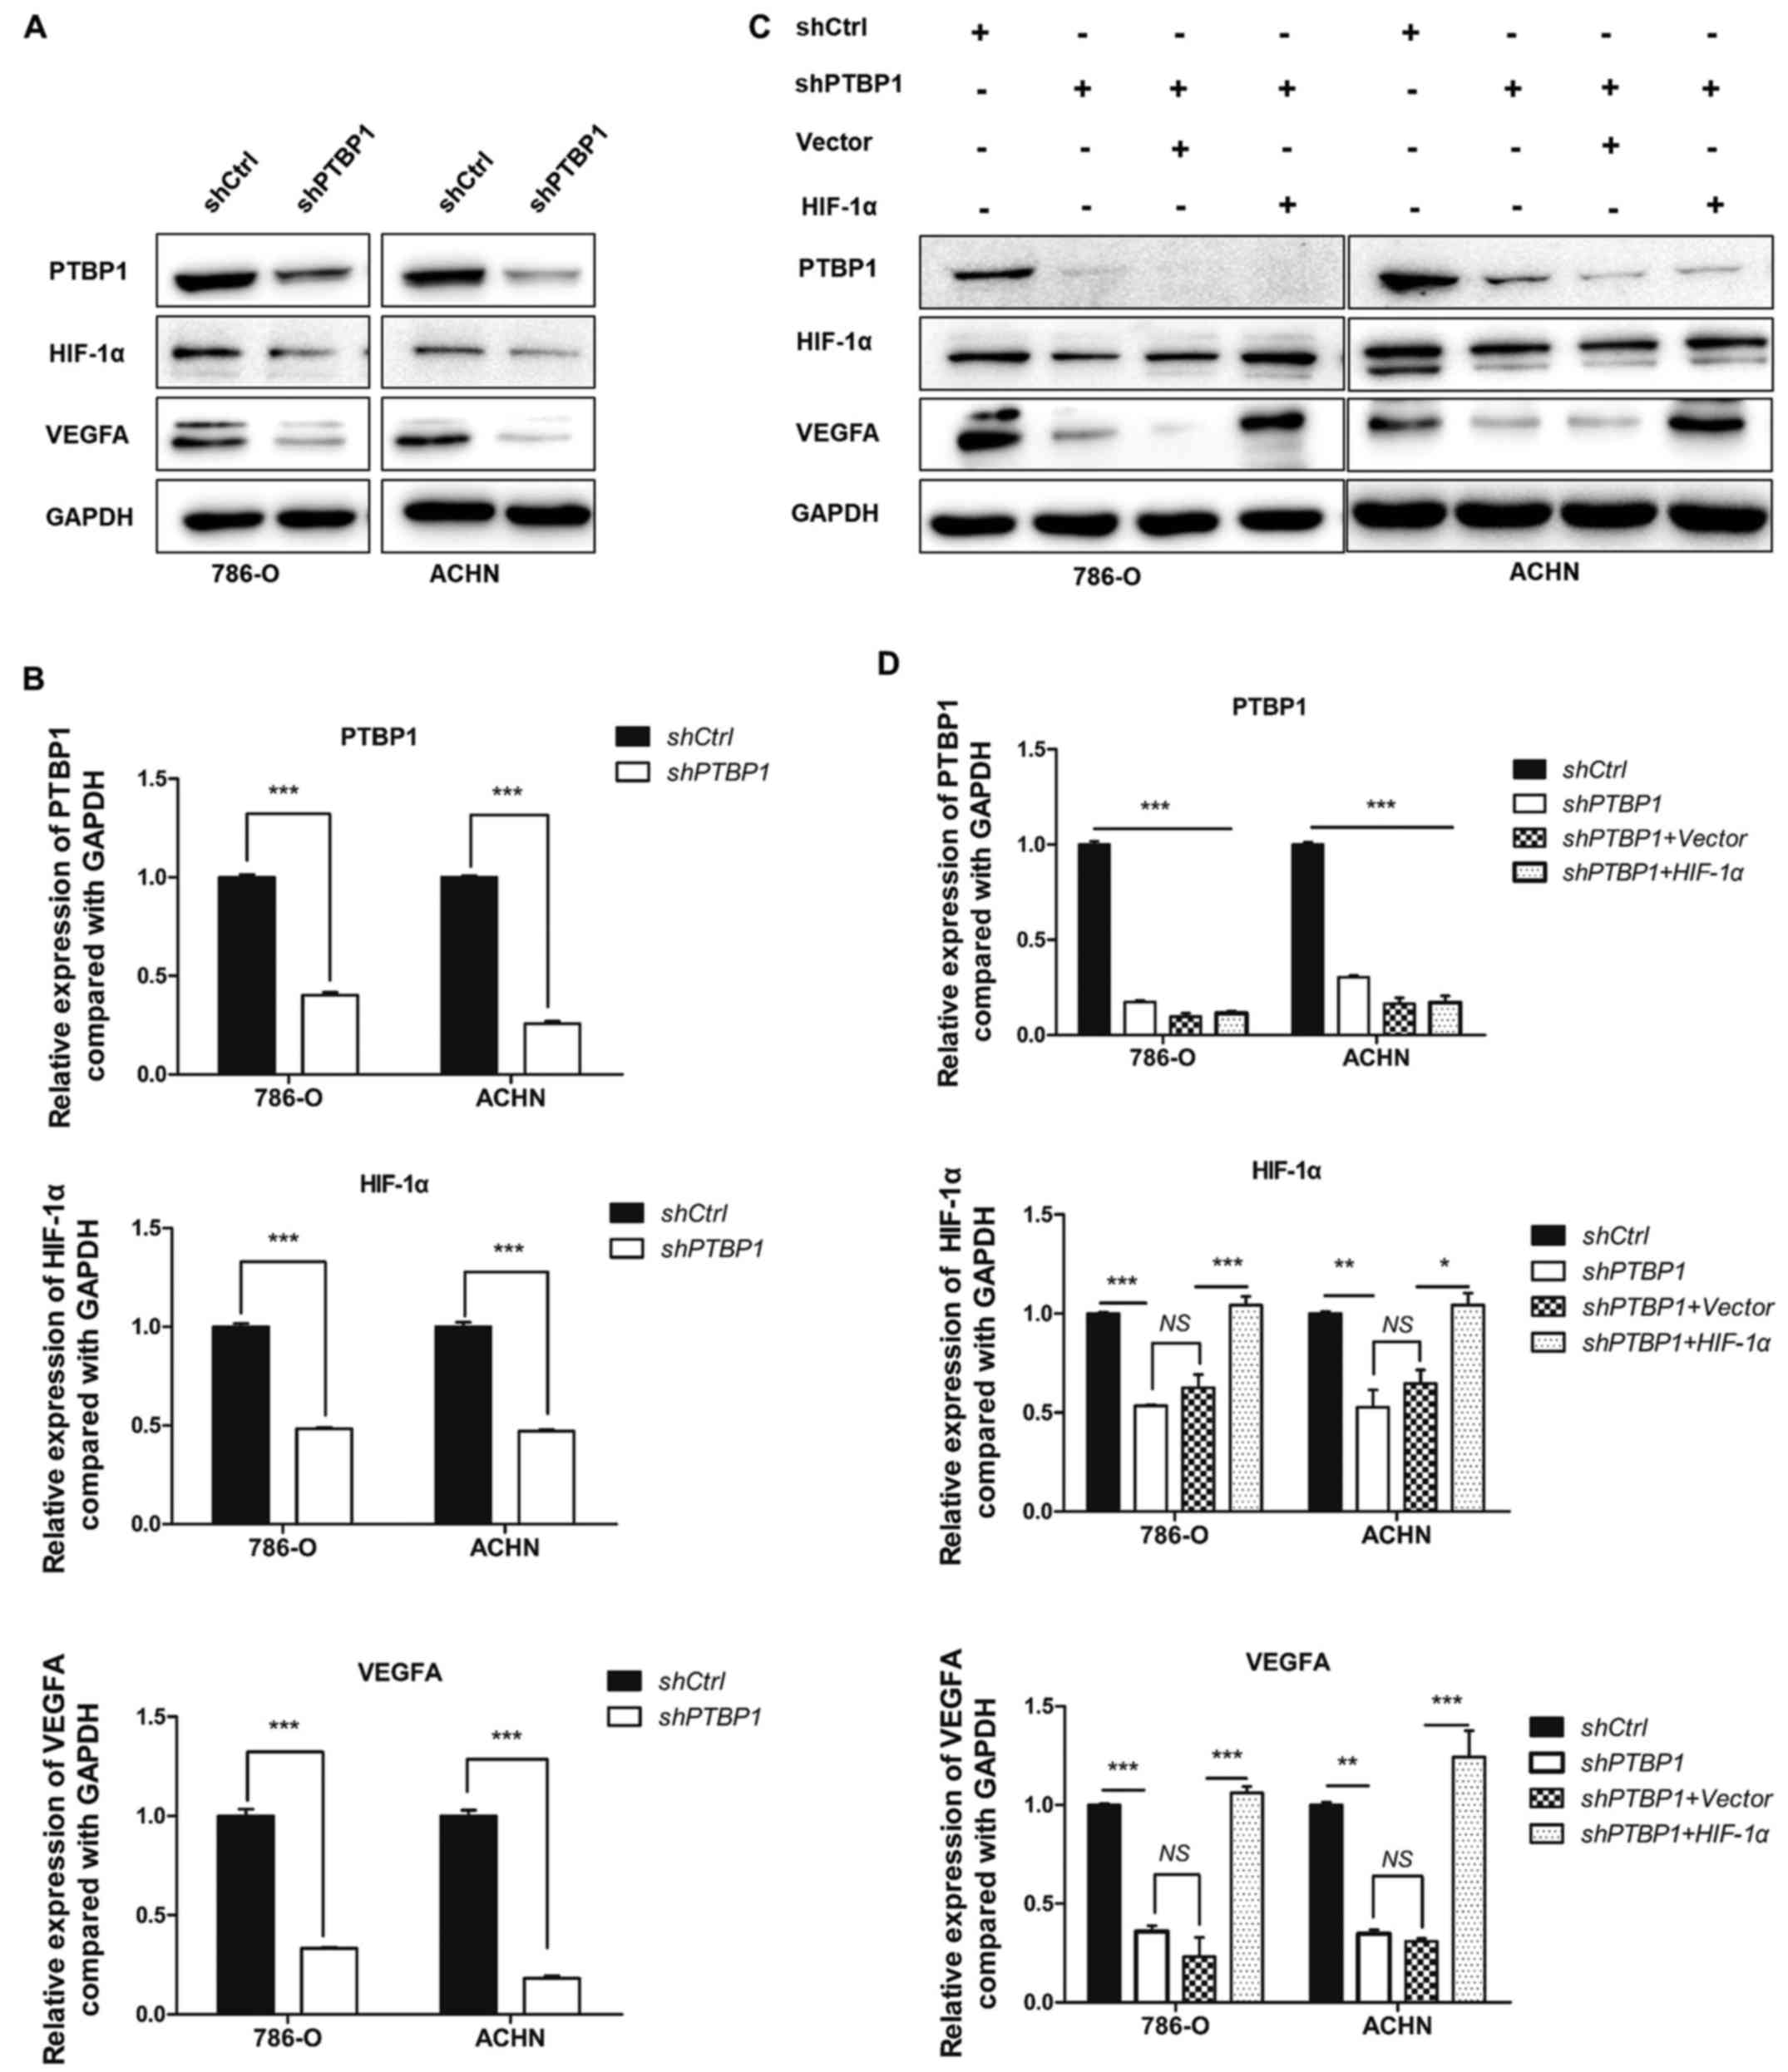
PTBP1 knockdown inhibits RCC cell
migration and invasion via the HIF-1α, pathway
To explore the potential mechanism of PTBP1 in
promoting RCC cell proliferation, migration, invasion and
angiogenesis, western blotting was used to measure the expression
of associated proteins. The data revealed that PTBP1 silencing
significantly decreased the expression of HIF-1α and VEGFA
(P<0.001; Fig. 3A and B). To
further identify the role of HIF-1α, rescue assays were performed,
in which HIF-1α or vector plasmids were transfected into 786-O and
ACHN cells that had been stably transfected with shPTBP1. The
results demonstrated that VEGFA and HIF-1α expression significantly
recovered following transfection of HIF-1α plasmid (P<0.05;
Fig. 3C and D).
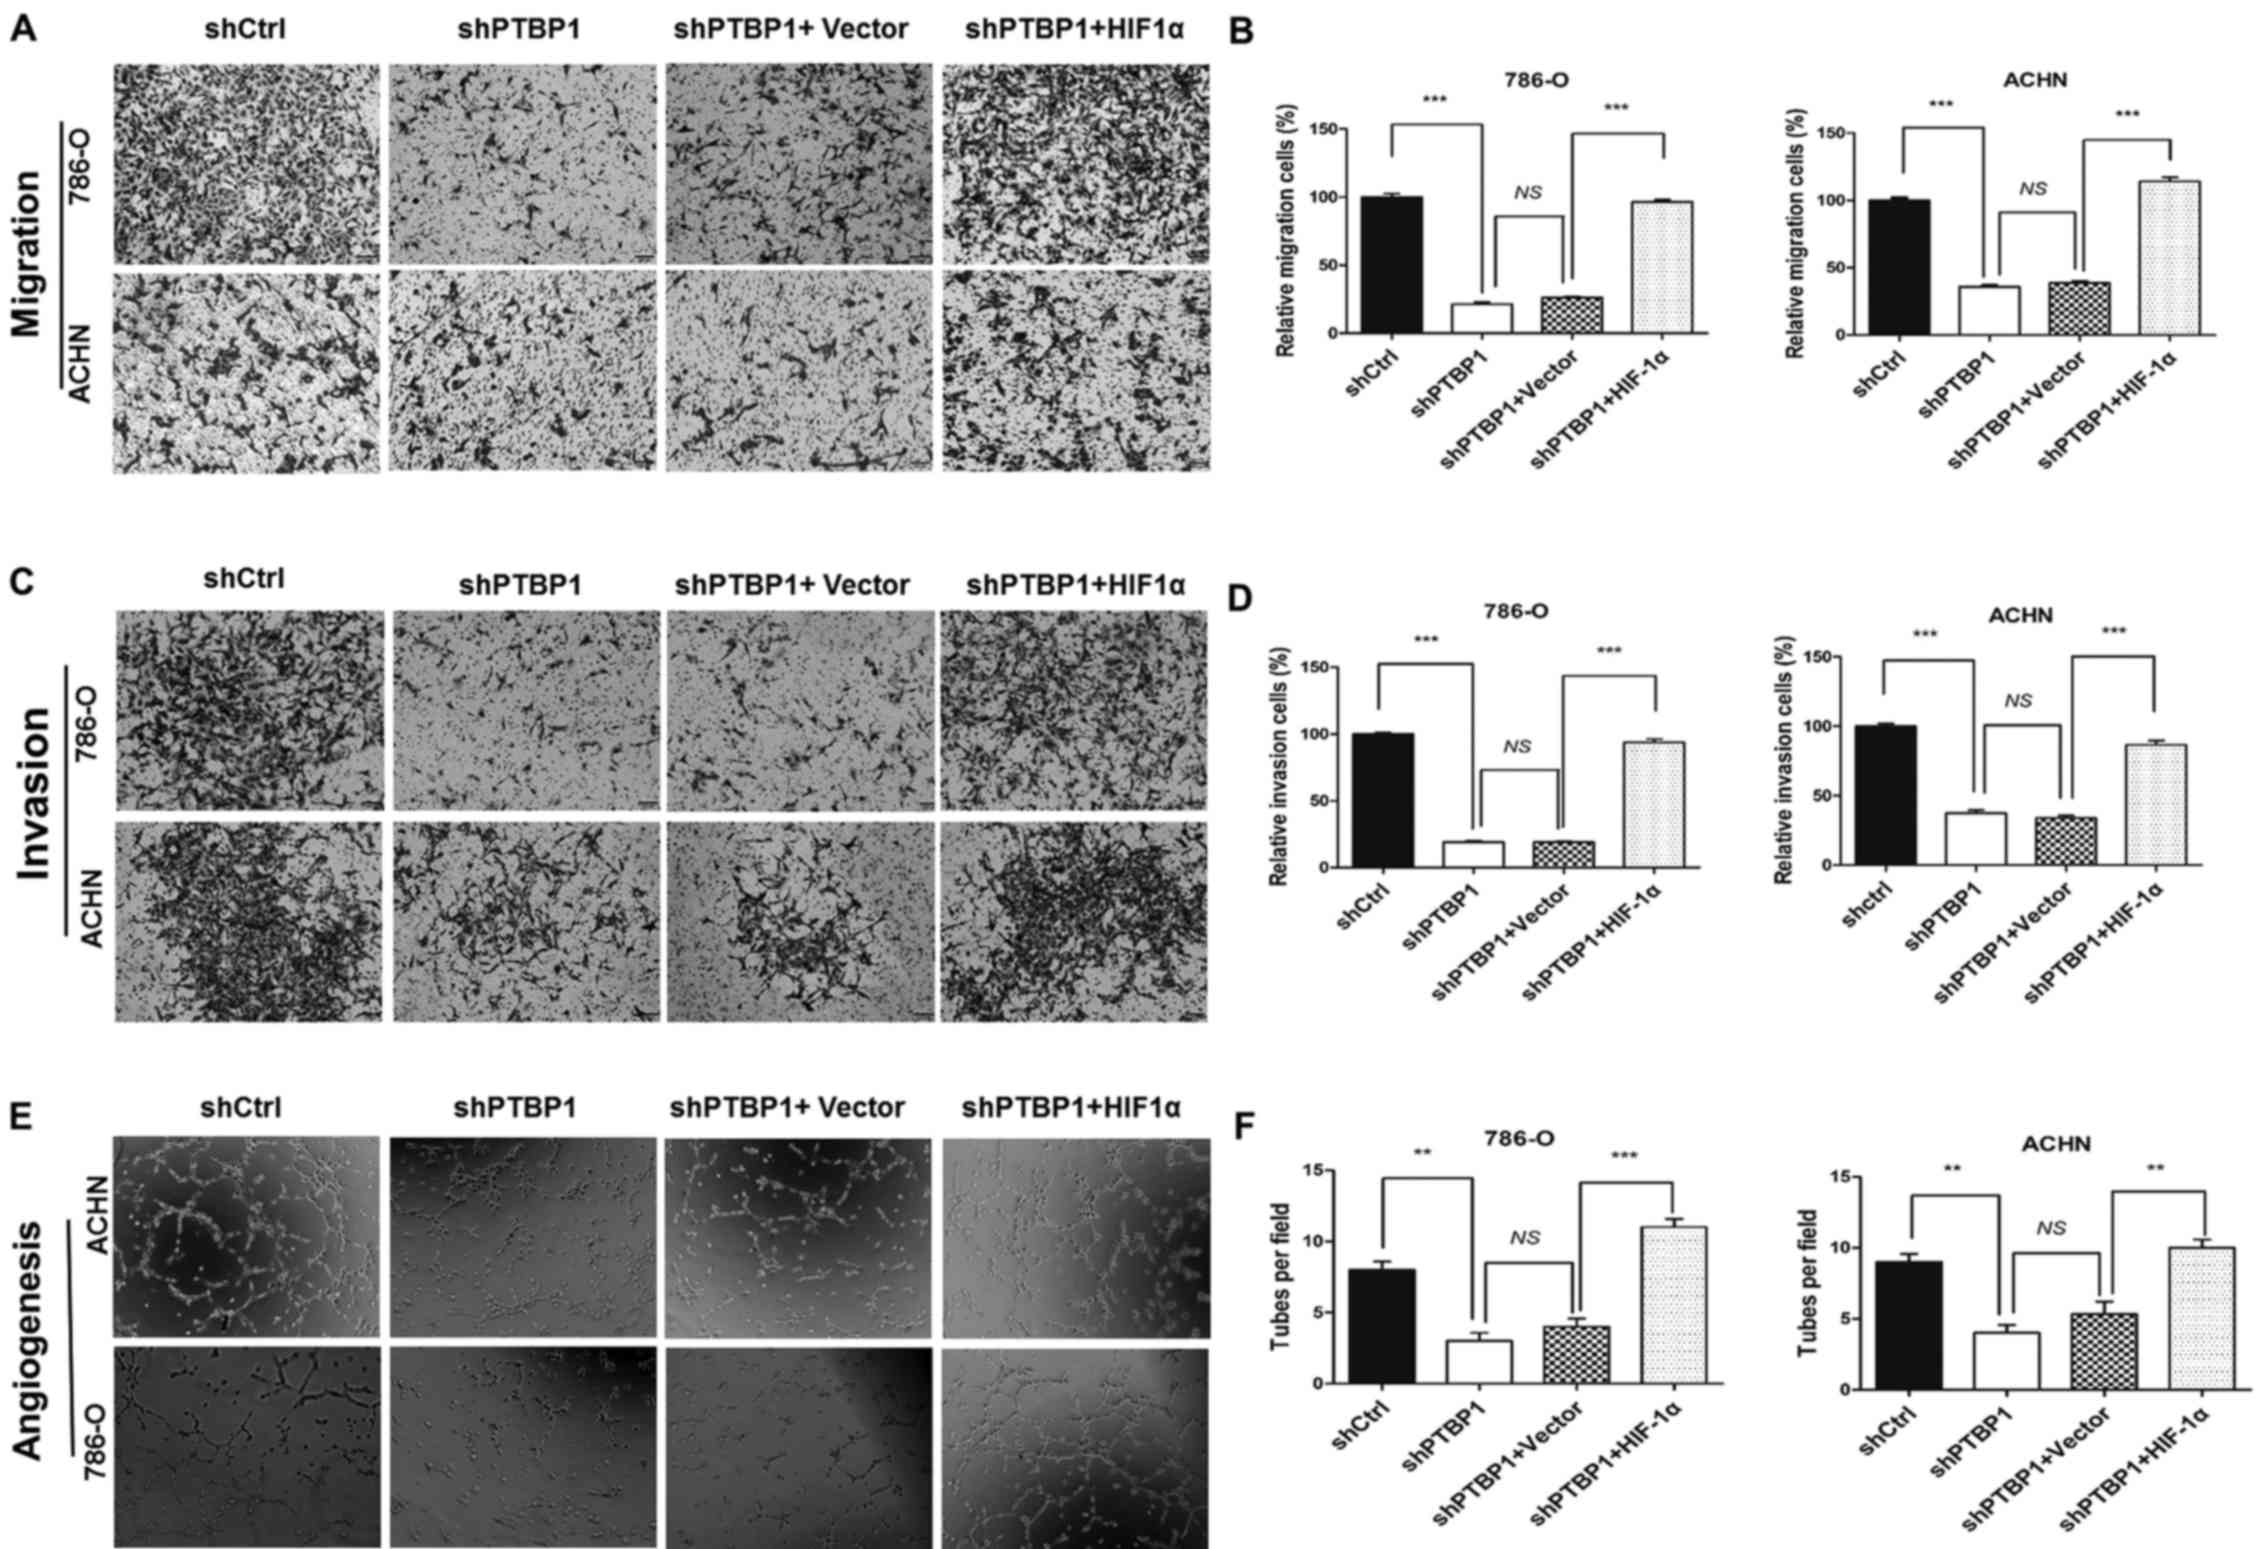
Furthermore, the decrease in the migration and
invasion of shPTBP1 786-O and ACHN cells that occurred following
PTBP1 knockdown was significantly reversed following transfection
of the HIF-1α plasmid (P<0.001; Fig. 4A–D). HIF-1α overexpression also
reversed the inhibition in HUVEC tube formation that occurred
(P<0.01; Fig. 4E and F). These
data suggest that PTBP1 regulates RCC cell migration, invasion and
angiogenesis in RCC via the HIF-1α-VEGF pathway.
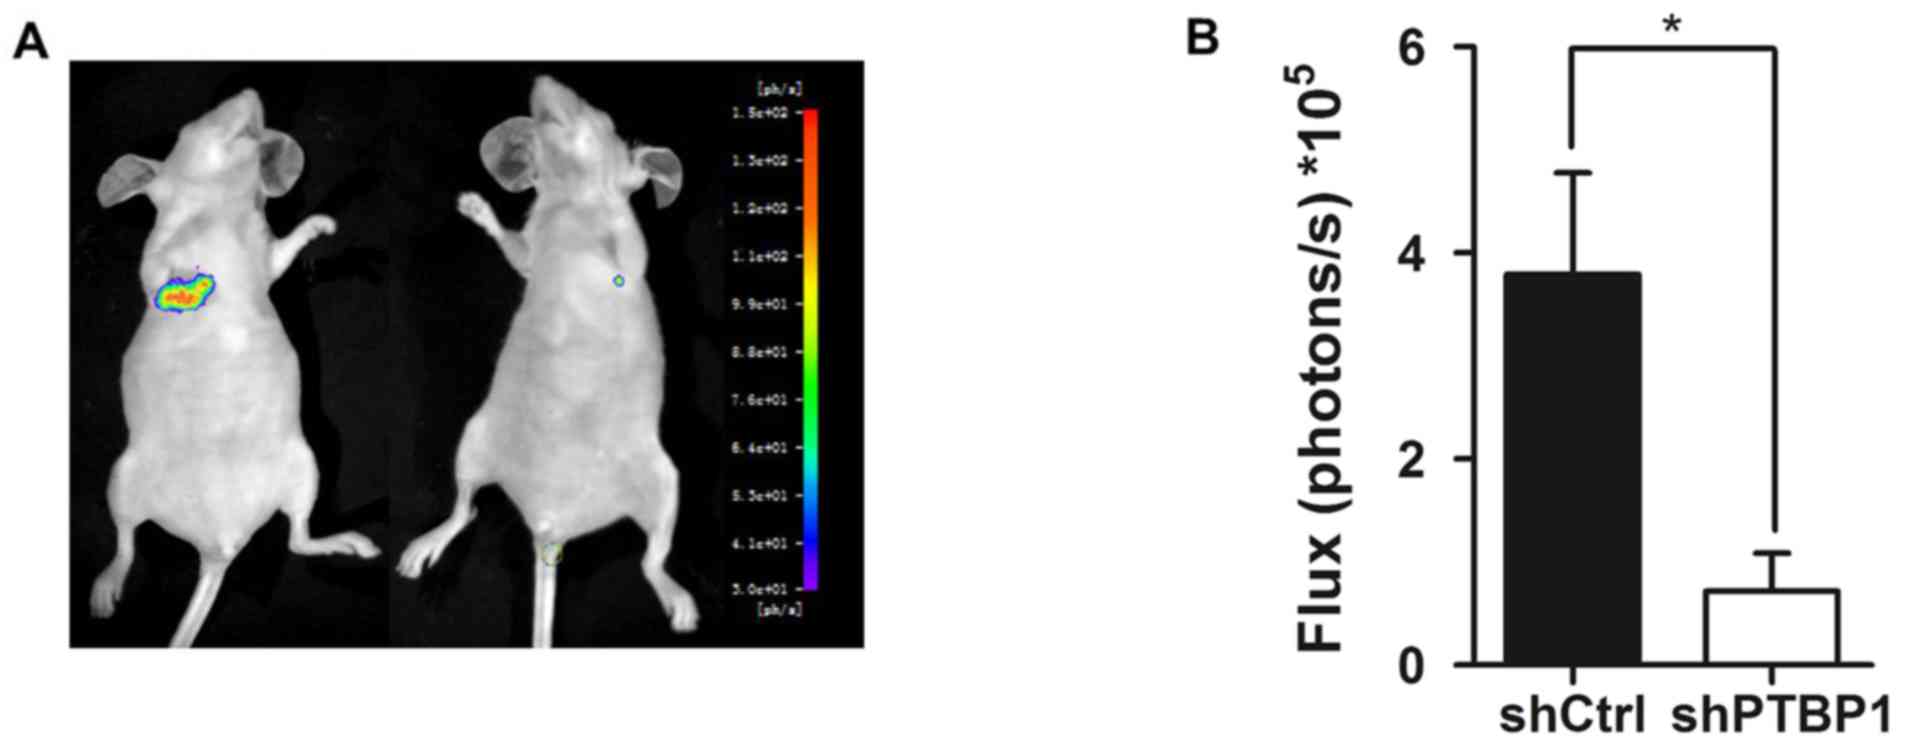
PTBP1 knockdown decreases RCC cell lung
metastasis in vivo
The current study demonstrated that PTBP1 affected
migration, invasion and angiogenesis in vitro; thus, it was
assessed whether PTBP1 regulates RCC metastasis in vivo. A
tail vein metastasis model was constructed in nude mice and stably
infected shPTBP1 and control 786-O cells transduced with luciferase
lentivirus were administered to BALB/c nude mice. After 6 weeks,
bioluminescence imaging was used to measure the metastatic lesions.
The results indicated that the Firefly luciferase activity of lung
metastases in the PTBP1- silenced group was significantly lower
than that in the control group (P<0.05; Fig. 5).
Discussion
RCC is the most common cancer of the urinary system
and readily metastasizes (28).
Due to the resistance of RCC to chemotherapy and radiotherapy,
targeted therapy has become an effective and accepted means of
treatment (29). Metastasis is the
primary cause of cancer treatment failure. Therefore, the genes
involved in metastasis may serve as promising biomarkers for
prognosis and therapy in patients with RCC (30). It has been demonstrated that PTBP1,
an hnRNP member, promotes cancer progression and is associated with
the prognosis of different types of cancer (13–16).
However, few studies have investigated the association between
PTBP1 expression and RCC. The results of the present study
demonstrated that PTBP1 expression was increased in RCC tissues,
which was in agreement with the results of previous studies
assessing other solid tumors (15,18).
Additionally, higher PTBP1 expression was associated with more
advanced stages of RCC and poorer survival rates of patients with
RCC and this was consistent with the data from patients in the TCGA
gene bank data. Univariate and multivariate Cox proportional
hazards regression analyses indicated that PTBP1 overexpression is
an important prognostic indicator for RCC. These results indicate
that PTBP1 is a prognostic indicator of RCC and may promote its
progression.
Metastasis and unrestricted growth are the primary
causes of cancer treatment failure. A series of interlinked events
promote tumor development and metastasis, including proliferation,
angiogenesis, migration, invasion, adhesion and extravasation into
target organs (31,32). Therefore, any factors that affect
specific processes may be involved in tumor metastasis. In the
present study, assessment of the TMA indicated that PTBP1 promotes
RCC progression; therefore, it was hypothesized that PTBP1 may
serve a role during tumor development and metastasis. From the
clinicopathological characteristics of the 307 patients with RCC,
it was demonstrated that patients with high PTBP1 expression had a
higher T or TNM status; thus it was indicated that PTBP1 may serve
a role in the proliferation and metastasis of RCC.
In the present study, PTBP1 knockdown inhibited RCC
cell proliferation, migration, invasion and angiogenesis in
vitro. These results are in accordance with the results of the
TMA assessment and indicated that PTBP1 overexpression is
associated with advanced RCC stage and poor survival. Therefore, it
was determined that PTBP1 serves an important role in promoting the
progression and metastasis of RCC. Subsequently, the mechanism by
which PTBP1 regulates the progression of RCC was investigated.
HIF-1α is a transcription factor involved in
angiogenesis, glucose metabolism, cell proliferation/survival and
apoptosis (33,34). Previous studies have demonstrated
that PTBP1 and HIF-1α promote metastasis in various types of cancer
(14–16,33).
However, to the best of our knowledge, an association between PTBP1
and HIF-1α in human RCC has not yet been established. PTBP1 is a
prominent RNA binding protein and a well-established regulator of
mRNA splicing, stability and translation (9). The results of the current study
indicated that PTBP1 regulates the expression of HIF-1α and VEGFA,
an HIF-1α target gene. The results of the rescue experiments also
demonstrated that HIF-1α overexpression in PTBP1-knockdown cells
reversed the decrease in cell migration, invasion and angiogenesis
that occurred following PTBP1 knockdown. Further studies are
required to explore the mechanism of PTBP1 in regulating the
expression of HIF-1α.
Lung metastasis is the most common type of
metastasis that occurs in RCC and the most common cause of
mortality in patients with RCC (35). The results of the in vivo
experiment demonstrated that the rate of metastasis was decreased
following PTBP1 knockdown. Therapies targeting VEGF, including
sorafenib and sunitinib, have been clinically effective at treating
patients with RCC. In a previous study, sorafenib prolonged the
survival of RCC patients, and the median overall survival for the
sorafenib group was 19.3 months, compared compared with 15.9 months
for the placebo (36). Sunitinib
extended the RCC patients progression-free survival (3). The present study shows PTBP1 as a
regulator of HIF-1α and VEGF. Thus, PTBP1 may be a novel
therapeutic target.
In conclusion, the current study demonstrated that
PTBP1 serves an important role in RCC metastasis and that PTBP1
expression is positively associated with poor patient survival and
advanced pathology. The results of clinical analyses suggest that
PTBP1 may be a novel biomarker for the prognosis of patients with
RCC. It was also demonstrated that PTBP1 regulates the expression
of HIF-1α, an important regulator of tumor metastasis. Therefore,
it may be determined that PTBP1 serves an important role in the
progression of RCC and further studies are required to explore the
mechanisms by which PTBP1 induces these effects.
Acknowledgments
The authors would like to thank Dr Rui Chen
(Southeast University, Nanjing, China) for providing the plasmids
mentioned in the Materials and methods.
Abbreviations:
|
PTBP1
|
polypyrimidine tract-binding protein
1
|
|
hnRNP
|
heterogeneous nuclear
ribonucleoprotein
|
|
RCC
|
renal cell carcinoma
|
|
NRT
|
normal renal tissue
|
|
HUVECs
|
human umbilical vein endothelial
cells
|
|
IHC
|
immunohistochemistry
|
|
TCGA
|
The Cancer Genome Atlas
|
|
TMA
|
tissue microarrays
|
Notes
[1]
Funding
This study was funded by grants from the National
Natural Science Foundation of China (nos. 81472663, 81502280 and
81672845), the Education Department of Jiangsu Province (no.
15KJA320006), the Jiangsu Provincial Science and Technology Program
(no. BK20161157), Jiangsu Provincial Medical Youth Talent (no.
QNRC2016773), Six Talent Peaks Project in Jiangsu Province (no.
WSN-119) and the Project of Invigorating Health Care through
Science, Technology and Education from Jiangsu Province.
[2] Availability
of data and materials.
The datasets and materials used during the current
study are available from the corresponding author on reasonable
request.
[3] Authors'
contributions
HS, PH and JB were responsible for the study
conception and design. HS, MZ and LL collected the clinical data
for the cohort, performed the cell and animal experiments, carried
out the statistical analyses, drafted the manuscript and provided
final approval for the submission. FC, YP and TJ conducted the
western blotting experiment and provided final approval for the
submission. HS, JB, PH and JZ critically revised the manuscript,
supervised the study and provided final approval for the
submission.
[4] Ethics
approval and consent to participate
For the use of human samples, informed consent was
obtained from all patients and institutional approval for the
current study was obtained from the Review Board of the Affiliated
Hospital of Xuzhou Medical University. All experiments involving
human subjects were performed in accordance with relevant
guidelines and regulations. All experiments involving animals were
approved by the Animal Care Committee of Xuzhou Medical
University.
[5] Consent for
publication
Not applicable.
[6] Competing
interests
The authors declare that they have no competing
interests.
References
|
1
|
Siegel RL, Miller KD and Jemal A: Cancer
statistics, 2015. CA Cancer J Clin. 65:5–29. 2015. View Article : Google Scholar : PubMed/NCBI
|
|
2
|
Siegel RL, Miller KD and Jemal A: Cancer
statistics, 2016. CA Cancer J Clin. 66:7–30. 2016. View Article : Google Scholar : PubMed/NCBI
|
|
3
|
Irani J: Sunitinib versus interferon-alpha
in metastatic renal-cell carcinoma. Prog Urol. 17:9962007.In
French. View Article : Google Scholar
|
|
4
|
Siegel R, Desantis C and Jemal A:
Colorectal cancer statistics, 2014. CA Cancer J Clin. 64:104–117.
2014. View Article : Google Scholar : PubMed/NCBI
|
|
5
|
Motzer RJ, Bander NH and Nanus DM:
Renal-cell carcinoma. N Engl J Med. 335:865–875. 1996. View Article : Google Scholar : PubMed/NCBI
|
|
6
|
Lam JS, Leppert JT, Belldegrun AS and
Figlin RA: Novel approaches in the therapy of metastatic renal cell
carcinoma. World J Urol. 23:202–212. 2005. View Article : Google Scholar : PubMed/NCBI
|
|
7
|
Gupta K, Miller JD, Li JZ, Russell MW and
Charbonneau C: Epidemiologic and socioeconomic burden of metastatic
renal cell carcinoma (mRCC): A literature review. Cancer Treat Rev.
34:193–205. 2008. View Article : Google Scholar : PubMed/NCBI
|
|
8
|
Patton JG, Mayer SA, Tempst P and
Nadal-Ginard B: Characterization and molecular cloning of
polypyrimidine tract-binding protein: A component of a complex
necessary for pre-mRNA splicing. Genes Dev. 5:1237–1251. 1991.
View Article : Google Scholar : PubMed/NCBI
|
|
9
|
Romanelli MG, Diani E and Lievens PM: New
insights into functional roles of the polypyrimidine tract-binding
protein. Int J Mol Sci. 14:22906–22932. 2013. View Article : Google Scholar : PubMed/NCBI
|
|
10
|
Xue Y, Zhou Y, Wu T, Zhu T, Ji X, Kwon YS,
Zhang C, Yeo G, Black DL, Sun H, et al: Genome-wide analysis of
PTB-RNA interactions reveals a strategy used by the general
splicing repressor to modulate exon inclusion or skipping. Mol
Cell. 36:996–1006. 2009. View Article : Google Scholar
|
|
11
|
Llorian M, Schwartz S, Clark TA, Hollander
D, Tan LY, Spellman R, Gordon A, Schweitzer AC, de la Grange P, Ast
G, et al: Position-dependent alternative splicing activity revealed
by global profiling of alternative splicing events regulated by
PTB. Nat Struct Mol Biol. 17:1114–1123. 2010. View Article : Google Scholar : PubMed/NCBI
|
|
12
|
McCutcheon IE, Hentschel SJ, Fuller GN,
Jin W and Cote GJ: Expression of the splicing regulator
polypyrimidine tract-binding protein in normal and neoplastic
brain. Neuro Oncol. 6:9–14. 2004. View Article : Google Scholar : PubMed/NCBI
|
|
13
|
Cheung HC, Hai T, Zhu W, Baggerly KA,
Tsavachidis S, Krahe R and Cote GJ: Splicing factors PTBP1 and
PTBP2 promote proliferation and migration of glioma cell lines.
Brain. 132:2277–2288. 2009. View Article : Google Scholar : PubMed/NCBI
|
|
14
|
Takahashi H, Nishimura J, Kagawa Y, Kano
Y, Takahashi Y, Wu X, Hiraki M, Hamabe A, Konno M, Haraguchi N, et
al: Significance of polypyrimidine tract-binding protein 1
expression in colorectal cancer. Mol Cancer Ther. 14:1705–1716.
2015. View Article : Google Scholar : PubMed/NCBI
|
|
15
|
He X, Pool M, Darcy KM, Lim SB, Auersperg
N, Coon JS and Beck WT: Knockdown of polypyrimidine tract-binding
protein suppresses ovarian tumor cell growth and invasiveness in
vitro. Oncogene. 26:4961–4968. 2007. View Article : Google Scholar : PubMed/NCBI
|
|
16
|
Sugiyama T, Taniguchi K, Matsuhashi N,
Tajirika T, Futamura M, Takai T, Akao Y and Yoshida K: MiR-133b
inhibits growth of human gastric cancer cells by silencing pyruvate
kinase muscle-splicer polypyrimidine tract-binding protein 1.
Cancer Sci. 107:1767–1775. 2016. View Article : Google Scholar : PubMed/NCBI
|
|
17
|
He X, Arslan AD, Ho TT, Yuan C, Stampfer
MR and Beck WT: Involvement of polypyrimidine tract-binding protein
(PTBP1) in maintaining breast cancer cell growth and malignant
properties. Oncogenesis. 3:e842014. View Article : Google Scholar : PubMed/NCBI
|
|
18
|
Cheung HC, Corley LJ, Fuller GN,
McCutcheon IE and Cote GJ: Polypyrimidine tract binding protein and
Notch1 are independently re-expressed in glioma. Mod Pathol.
19:1034–1041. 2006. View Article : Google Scholar : PubMed/NCBI
|
|
19
|
Christofk HR, Vander Heiden MG, Harris MH,
Ramanathan A, Gerszten RE, Wei R, Fleming MD, Schreiber SL and
Cantley LC: The M2 splice isoform of pyruvate kinase is important
for cancer metabolism and tumour growth. Nature. 452:230–233. 2008.
View Article : Google Scholar : PubMed/NCBI
|
|
20
|
David CJ, Chen M, Assanah M, Canoll P and
Manley JL: HnRNP proteins controlled by c-Myc deregulate pyruvate
kinase mRNA splicing in cancer. Nature. 463:364–368. 2010.
View Article : Google Scholar :
|
|
21
|
Taniguchi K, Sugito N, Kumazaki M,
Shinohara H, Yamada N, Nakagawa Y, Ito Y, Otsuki Y, Uno B, Uchiyama
K, et al: MicroRNA-124 inhibits cancer cell growth through
PTB1/PKM1/PKM2 feedback cascade in colorectal cancer. Cancer Lett.
363:17–27. 2015. View Article : Google Scholar : PubMed/NCBI
|
|
22
|
Wang MJ and Lin S: A region within the
5′-untranslated region of hypoxia-inducible factor-1alpha mRNA
mediates its turnover in lung adenocarcinoma cells. J Biol Chem.
284:36500–36510. 2009. View Article : Google Scholar : PubMed/NCBI
|
|
23
|
Bielli P, Bordi M, Di Biasio V and Sette
C: Regulation of BCL-X splicing reveals a role for the
polypyrimidine tract binding protein (PTBP1/hnRNP I) in alternative
5′ splice site selection. Nucleic Acids Res. 42:12070–12081. 2014.
View Article : Google Scholar : PubMed/NCBI
|
|
24
|
Yoon J and Herts BR: Staging renal cell
carcinoma with helical CT: The revised 1997 AJCC and UICC TNM
criteria. Crit Rev Computed Tomogr. 44:229–249. 2003. View Article : Google Scholar
|
|
25
|
Remmele W and Stegner HE: Recommendation
for uniform definition of an immunoreactive score (IRS) for
immunohistochemical estrogen receptor detection (ER-ICA) in breast
cancer tissue. Pathologe. 8:138–140. 1987.In German. PubMed/NCBI
|
|
26
|
Li HL, Han L, Chen HR, Meng F, Liu QH, Pan
ZQ, Bai J and Zheng JN: PinX1 serves as a potential prognostic
indicator for clear cell renal cell carcinoma and inhibits its
invasion and metastasis by suppressing MMP-2 via NF-κB-dependent
transcription. Oncotarget. 6:21406–21420. 2015.PubMed/NCBI
|
|
27
|
Hou P, Zhao Y, Li Z, Yao R, Ma M, Gao Y,
Zhao L, Zhang Y, Huang B and Lu J: LincRNA-ROR induces
epithelial-to-mesenchymal transition and contributes to breast
cancer tumorigenesis and metastasis. Cell Death Dis. 5:e12872014.
View Article : Google Scholar : PubMed/NCBI
|
|
28
|
Thompson Coon J1, Hoyle M, Green C, Liu Z,
Welch K, Moxham T and Stein K: Bevacizumab, sorafenib tosylate,
sunitinib and temsirolimus for renal cell carcinoma: a systematic
review and economic evaluation. Health Technol Assess. 14:1–184.
iii–iv. 2010. View Article : Google Scholar
|
|
29
|
Kitamura H, Takahashi A, Takei F, Hotta H,
Miyao N, Shindo T, Igarashi M, Tachiki H, Kunishima Y, Muranaka T,
et al Sapporo Medical University Urologic Oncology Consortium:
Molecular-targeted therapy and surgery may prolong survival of
renal cell carcinoma patients with bone metastasis: A
multi-institutional retrospective study in Japan. Anticancer Res.
36:5531–5536. 2016. View Article : Google Scholar : PubMed/NCBI
|
|
30
|
Audenet F, Yates DR, Cancel-Tassin G,
Cussenot O and Rouprêt M: Genetic pathways involved in
carcinogenesis of clear cell renal cell carcinoma: Genomics towards
personalized medicine. BJU Int. 109:1864–1870. 2012. View Article : Google Scholar
|
|
31
|
Hynes RO: Metastatic potential: Generic
predisposition of the primary tumor or rare, metastatic variants-or
both? Cell. 113:821–823. 2003. View Article : Google Scholar : PubMed/NCBI
|
|
32
|
Valastyan S and Weinberg RA: Tumor
metastasis: Molecular insights and evolving paradigms. Cell.
147:275–292. 2011. View Article : Google Scholar : PubMed/NCBI
|
|
33
|
Semenza GL: Hypoxia-inducible factor 1
(HIF-1) pathway. Sci STKE. 2007:cm82007. View Article : Google Scholar : PubMed/NCBI
|
|
34
|
Ke Q and Costa M: Hypoxia-inducible
factor-1 (HIF-1). Mol Pharmacol. 70:1469–1480. 2006. View Article : Google Scholar : PubMed/NCBI
|
|
35
|
Chen F, Fujinaga T, Shoji T, Miyahara R,
Bando T, Okubo K, Hirata T and Date H: Pulmonary resection for
metastasis from renal cell carcinoma. Interact Cardiovasc Thorac
Surg. 7:825–828. 2008. View Article : Google Scholar : PubMed/NCBI
|
|
36
|
Escudier B, Eisen T, Stadler WM, Szczylik
C, Oudard S, Siebels M, Negrier S, Chevreau C, Solska E, Desai AA,
et al TARGET Study Group: Sorafenib in advanced clear-cell
renal-cell carcinoma. N Engl J Med. 356:125–134. 2007. View Article : Google Scholar : PubMed/NCBI
|