Introduction
Epigenetic alterations have been identified in many
types of human cancer in connection with carcinogenesis without
genetic sequence abnormalities (1-4). DNA
methylation has long been investigated as the process of
carcinogenesis induced by epigenetic alterations. While regional
methylation alterations have been recognized to induce the
transcription silencing of tumor suppressor genes at the CpG island
of the promoter region (5-7), global hypomethylation alterations
have not received much attention, with no studies to date
investigating the role of such changes in the process of cancer
development and progression, at least to the best of our
knowledge.
DNA repetitive sequences are globally distributed in
the human genome and are ideal targets for hypomethylation. These
sequences are involved in tumor progression in ovarian epithelial
carcinomas and hepatocellular carcinomas and are considered to be a
better predictor of a poor survival than conventional markers
(8,9). LINE-1 is a transposable element in
the human genome comprising a repetitive sequence. The
hypomethylation of LINE-1 has been reported to be significantly
associated with chromosomal instability in gastrointestinal stromal
tumors (10). Experimental studies
using mouse models have provided evidence that global
hypomethylation and chromosomal instability are associated with
cancer development (11,12). We have previously demonstrated that
DNA hypomethylation is enhanced by chronic gastritis mediated by
Helicobacter pylori infection. In addition, aging is also a
contributory factor to enhanced DNA hypomethylation in colon and
stomach cancers (13,14). These data suggest that global DNA
hypomethylation plays a crucial role in carcinogenesis by affecting
the machinery that maintain chromosomal stability. However, the
mechanisms through which global DNA hypomethylation induces
chromosomal instability remain unclear.
Satellite DNA consists of highly repetitive
non-coding sequences. While LINE-1 is globally distributed in the
human genome, satellite DNA is mainly located in the centromeric
and pericentromeric regions of the chromosomes. Although satellite
DNA can be observed in almost all eukaryotic genomic DNA, the
sequences are species-specific (15). In the human genome, the centromeric
region consists of 171-base monomeric arrays, termed satellite
alphas. For many years, this non-coding region was not considered
to play any particular role, as it was hardly transcribed due to
the heterochromatin structure of its location; by contrast, the
appropriate transcription of satellite regions has been reported to
be essential for accurate chromosomal segregation (16-19).
The over-transcription from satellite DNA can be observed in
various epithelial tumors (20),
and the overexpression of satellite RNA has been found to induce
the abnormal segregation of chromosomes in experimental studies
(21,22).
However, the inhibition of satellite alpha
transcription has also been reported to lead to the disruption of
kinetochore formation, which is a prerequisite for chromosomal
segregation (19). Satellite DNA
and its transcripts are, therefore, important elements for
regulating cell division, and the disruption of this machinery,
known as aberrant transcription, can disrupt chromosomal stability.
Furthermore, aberrant transcription from the satellite regions in
cancer cells has been shown to be induced by epigenetic alterations
of global DNA hypomethylation (23). Several studies have demonstrated
that demethylation agents induce genome-wide DNA hypomethylation,
including in the satellite regions, thereby resulting in the
overexpression of satellite RNA (24-26).
In the present study, we addressed satellite DNA as
repetitive sequences, which are ideal targets for DNA
hypo-methylation. We also verified the oncogenic pathway in which
aberrant transcription from the satellite regions induced by DNA
hypomethylation leads to chromosomal instability, consequently
resulting in carcinogenesis.
Materials and methods
Patients and specimens
Samples of tumor tissue (TT) analyzed in this study
were obtained from 45 patients who underwent mastectomy for breast
cancer from July, 2015 to July, 2016 at Saitama Medical Center,
Jichi Medical University, Saitama-shi, Japan. Non-cancerous mammary
gland tissues (NMTs) corresponding TT were also obtained from 35 of
the 45 patients with breast cancer. The clinical and pathological
findings are presented in Table I.
NMTs were defined as tissues ≥2 cm macroscopically distant from the
tumor margin and microscopically identified as normal mammary gland
by the histological examination of hematoxylin and eosin
(H&E)-stained sections. Corresponding NMTs were obtained from
the resected specimen prior to the sampling of TT to avoid
contamination by tumor cells. Tissue specimens were immediately
soaked in RNAlater (Ambion, Austin, TX, USA) and stored at −80°C
after the RNAlater solution was removed. This study was approved by
the Research Ethics Committee at Jichi Medical University. Written
informed consent was obtained from each study participant.
 | Table IClinicopathological features of
breast cancer specimens. |
Table I
Clinicopathological features of
breast cancer specimens.
| Characteristic | n=45 |
|---|
| Mean age (±
SD) | 59.5±13.1 |
| Mean BMI (±
SD) | 23.5±4.0 |
| T
(Tis/T1-3/T4) | 3/39/3 |
| N
(negative/positive) | 29/16 |
| M
(negative/positive) | 41/3 |
| ERa (negative/positive) | 14/28 |
| HER2a (negative/positive) | 27/15 |
| Bilateral breast
tumors (negative/positive) | 39/6 |
| Malignancies in
other organs (negative/positive) | 39/6 |
Cell culture and viral transfection
Human mammary epithelial cells (HMEpCs) were
obtained from Cell Applications, Inc. (San Diego, CA, USA) and
maintained in MammaryLife Medium Complete kit (Lifeline Cell
Technology, Frederick, MD, USA). The cells were cultured at 37°C in
a 5% CO2 atmosphere.
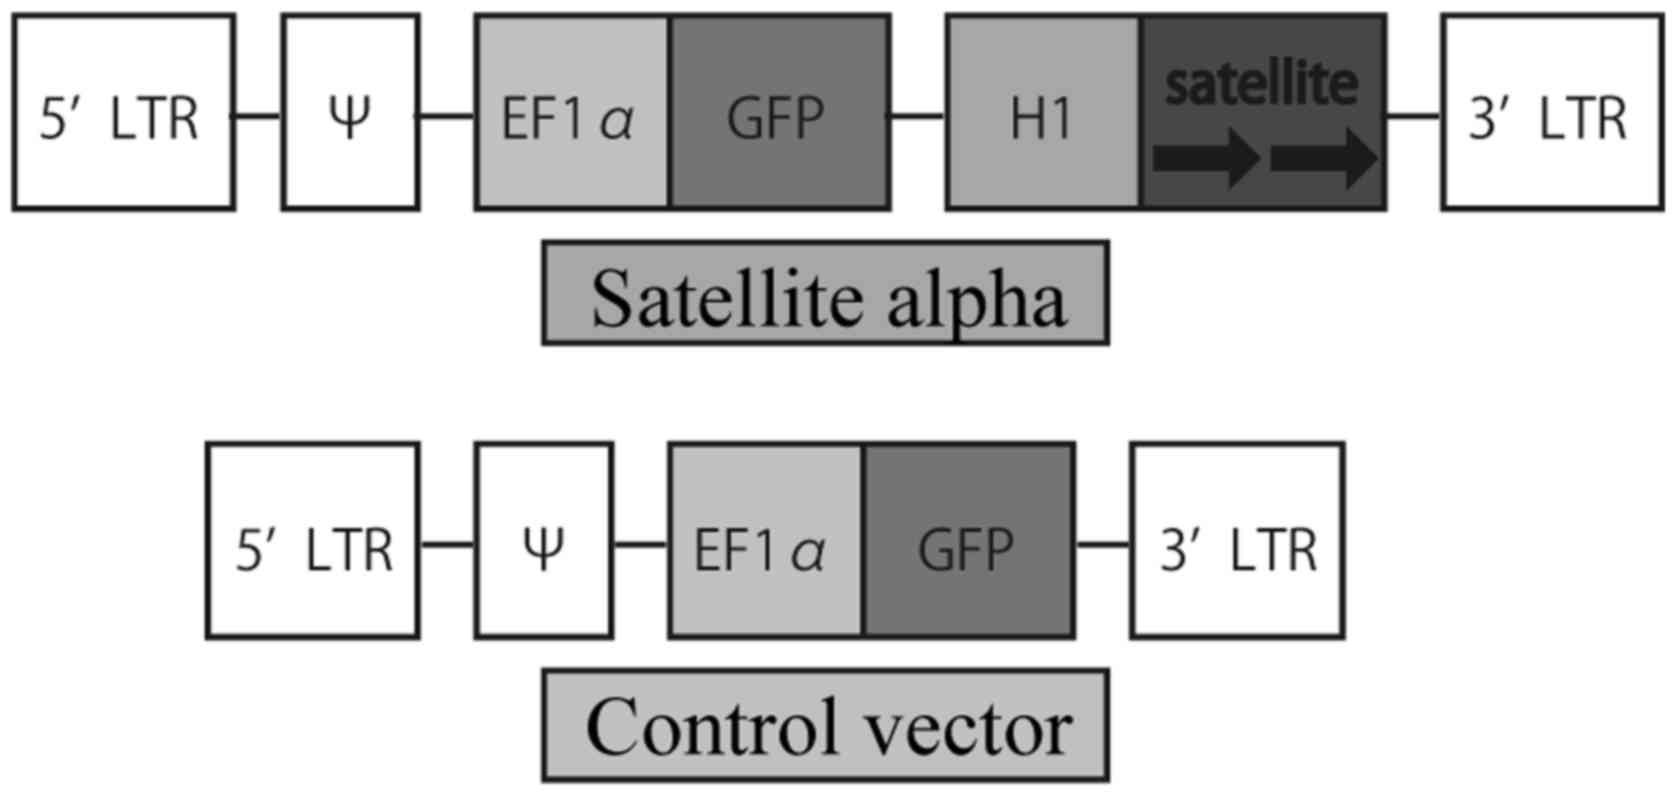
The plasmid vector, p156RRL-EF1a-GFP-U3H1SatA, which
was previously described and used (21), expressing satellite alpha
transcript (SAT) and green fluorescent protein (GFP) mRNA was a
gift from Inder Verma (Addgene plasmid #41795). To prepare a
control vector, the plasmid was treated with restriction enzymes so
that SAT was not expressed. The diagrams of the two vectors are
presented in Fig. 1.
Lentiviral particles were produced using the two
plasmid vectors with packaging plasmids as pLP1, pLP2 (Invitrogen
Corp., Grand Island, NY, USA) and pLP/VSVG (Clontech, Mountain
View, CA, USA). These packaging plasmids supply structural and
replication proteins required to produce a functional virus. The
lentiviral vectors titers carrying GFP were measured by infection
of 4×10⁵ HMEpCs. GFP expression was measured by a
fluorescence-activated cell sorting (FACS) analysis (BD
Biosciences, Mountain View, CA, USA) at 48 h after infection.
Typically, 10 μl of concentrated vector solution was able to
transduce GFP in ~10% of the cells, and the vector titers for
HMEpCs were considered to be 4×10⁶ cells/ml. Viral
infections of HMEpCs were performed several times, and the passage
number of the cells for transfections was unified. The infected
cells were sorted by detecting GFP using FACS in order to increase
the proportion of truly transfected cells. With this protocol, we
deemed that we had mostly used transfected cells in downstream
experiments. We prepared two types of HMEpC as controls: Cells
infected with satellite alpha-negative vectors named Control vector
and uninfected cells named negative control (NC). Both cells were
treated in a similar manner to the cells infected with satellite
alpha-positive vectors named Satellite alpha, apart from the
transfection vectors used.
RNA extraction
Total RNA was extracted from the samples using the
Illustra RNAspin Mini RNA Isolation kit (GE Healthcare UK,
Buckinghamshire, UK) according to the manufacturer's instructions.
To assess the RNA quality and yield, A260/A280 and A260/A230 ratios
for RNA preparation samples were analyzed with a NanoDrop ND-1000
spectrophotometer (NanoDrop Technologies, Inc., Wilmington, DE,
USA). RNA with an A260/A280 ratio of ≥1.8 was used for subsequent
experiments.
Reverse transcription-quantitative
polymerase chain reaction (RT-qPCR) assay for RNA transcript
expression
Reverse transcription (RT) was performed using the
High Capacity RNA-to-cDNA kit (Applied Biosystems, Carlsbad, CA,
USA). RT-qPCR assays were performed using SYBR-Green technology and
SYBR Premix Ex Taq (Tli RNaseH Plus) on the QuantStudio 12K Flex
Real-Time PCR system (Applied Biosystems). The thermal cycling
conditions were as follows: 95°C for 10 min, followed by 40 cycles
of 95°C for 15 sec and 56°C for 1 min. The expression of each gene
was determined using the fluorescence intensity measurements from
the QuantStudio 12K Flex Data Analysis software program. A
beta-actin (ACTB) fragment was amplified as an internal control.
The primer sequences are summarized in Table II. RT-qPCR assays were repeated
twice per sample.
| Table IIPCR primers for RNA transcript
expression. |
Table II
PCR primers for RNA transcript
expression.
| Target | Sequences
(5′-3′) |
|---|
| Satellite
alpha | F:
AAGGTCAATGGCAGAAAAGAA |
| R:
CAACGAAGGCCACAAGATGTC |
| Beta-actin (as an
internal control) | F:
CCATCATGAAGTGTGACGTGG |
| R:
GTCCGCCTAGAAGCATTTGCG |
DNA extraction and bisulfite
modification
The dissected tissues or cultured cells were placed
in buffered proteinase K solution at 56°C for 3 h. Genomic DNA was
isolated and purified using an EZ1 Advanced XL and an EZ1 DNA
Tissue kit (Qiagen, Hilden, Germany) according to the
manufacturer's instructions. DNA purity was assessed by the
NanoDrop ND-1000 spectrophotometer (NanoDrop Technologies, Inc.) at
absorbances of 260 and 280 nm. The A260/A280 ratio exceeded 1.8 in
all instances. The sodium bisulfite conversion of genomic DNA was
performed using an EpiTect Bisulfite kit (Qiagen). DNA quantities
of 400 ng in a volume of up to 40 μl were processed using
this standard protocol. The treatment of genomic DNA with sodium
bisulfite converted unmethylated (not methylated) cytosine to
uracil, which was then converted to thymidine during subsequent PCR
steps. This process revealed the sequence differences between the
methylated and unmethylated DNA.
MethyLight methods
Following bisulfite modification, each sample was
examined using MethyLight technology for satellite alpha sequences.
Two sets of primers and probes specifically designed to bind to
bisulfite-converted DNA were used in the reaction: Satellite alpha
primers and a probe for unmethylated target analyses (unmethylated
reaction), and Alu-C primers and a probe for the reference locus
(normalization control reaction), as previously described (27). The primer and probe sequences are
summarized in Table III.
Whole-genome amplification provided fully unmethylated DNA obtained
from HMEpC DNA, which served as the demethylation constant
reference that enabled the determination of the relative
demethylation level (RDL). We defined the RDL as (satellite alpha
reaction/Alu-C reaction) sample/(satellite alpha reaction/Alu-C
reaction) fully unmethylated control DNA. In each MethyLight
reaction, 1 μl of bisulfite-modified DNA solution was used.
Thermal cycling was initiated with a denaturation step at 95°C for
10 sec, followed by 50 cycles of 95°C for 5 sec and 60°C for 30
sec. PCR was performed on a QuantStudio 12K Flex Real-Time PCR
System with a final reaction volume of 25 μl containing
Premix Ex Taq (Takara Bio, Inc., Otsu, Japan), 600 nM of each
primer and 200 nM of the probe.
| Table IIIPCR primers and TaqMan probes for the
MethyLight method. |
Table III
PCR primers and TaqMan probes for the
MethyLight method.
| Target | | Sequences
(5′-3′) |
|---|
| Alu-C | Forward: |
GGTTAGGTATAGTGGTTTATATTTGTAATTTTAGTA |
| Reverse: |
ATTAACTAAACTAATCTTAAACTCCTAACCTCA |
| Probe: |
FAM-CCTACCTTAACCTCCC-MGB |
| Satellite
alpha | Forward: |
TTGATGGAGTATTTTTAAAATATATGTTTTGTAGT |
| Reverse: |
AAATTCTAAAAATATTCCTCTTCAATTACATAAA |
| Probe: |
FAM-TTTATCCCATTTCCAACAAA-MGB |
Microarray-based comparative genomic
hybridization (array CGH)
Array CGH was performed using a SurePrint G3 Human
CGH Microarray kit, 8×60K (Agilent Technologies Inc., Palo Alto,
CA, USA). Labeling and hybridization were performed using a SureTag
DNA Labeling kit and Oligo aCGH/ChiP-on-chip Hybridization kit
(both from Agilent Technologies Inc.) according to the protocol
provided by Agilent Technologies Inc. (Protocol v7.3, Oct. 2015).
In brief, ≥0.2 μg of DNA extracted from the tumor samples
and an equal amount of control DNA were digested with AluI
and RsaI for 2 h at 37°C. The digested DNA was labeled by
random priming. The tumor DNA and control DNA were labeled with
Cy5-dUTP and Cy3-dUTP, respectively. The labeled products were
purified using an Amicon Ultra-0.5 Centrifugal Filter Unit with an
Ultracel-30 membrane (Millipore, Billerica, MA, USA) and
concentrated to 9.5 μl. Dye incorporation and the DNA yield
were checked with a NanoDrop spectrophotometer. Equal amounts of
genomic DNA extracted from tumor samples and control DNAs were
mixed with human Cot-1 DNA, dissolved in hybridization buffer
(Agilent Technologies Inc.), denatured, and hybridized to the CGH
array at 67°C for 24 h. Following hybridization, the microarrays
were washed with Oligo aCGH/ChIP-on-Chip Wash Buffer (Agilent
Technologies Inc.). After washing, the slides were scanned on an
Agilent Technologies Microarray scanner. Microarray images were
analyzed using the Feature Extraction software program. v.12.0.3.1
(Agilent Technologies Inc.), and the resulting data were
subsequently imported into the Agilent Cytogenomics software
program, v.3.0.1.1.
Immunocytochemistry
The cells were cultured on cover glasses in well
plates. The prepared cover glasses were fixed in 4%
paraformaldehyde/PBS at room temperature for 15 min and then washed
3 times with PBS. The cells were permeabilized with 0.2% Triton
X-100 (Agilent Technologies Inc.) at room temperature for 5 min and
blocked with 10% Normal Goat Serum (Thermo Fisher Scientific, Inc.,
Waltham, MA, USA) at room temperature for 30 min. The cells were
washed 3 times with PBS and incubated with anti-α-tubulin
(#ab52866; Abcam, Cambridge, UK; 1:400 dilution) at room
temperature 90 min. Following extensive washing with PBS, the
samples were incubated with Alexa-594-conjugated anti-rabbit IgG
secondary antibody (#ab150080; Abcam; 1:500 dilution) and Hoechst
33342 (Thermo Fisher Scientific, Inc.; 10 μM) for nuclear
staining at room temperature for 60 min. The cover glasses were
washed 3 times with PBS and mounted in ProLong Diamond Antifade
Mountant (Thermo Fisher Scientific, Inc.) and sealed with nail
polish. Images were acquired using a Keyence BZ-X700 fluorescence
microscope (Keyence, Osaka, Japan).
Statistical analyses
All statistical analyses were performed using the
StatView version 5.0 software program (SAS Institute, Cary, NC,
USA). When necessary, the differences in qualitative variables were
evaluated using either the χ2 test or Fisher's exact
test. Continuous variables were compared using an analysis of
variance (ANOVA) with Tukey-Kramer test and Student's t-test. The
correlation between the two variables was evaluated by Pearson's
correlation coefficient. All reported P-values were two-sided, and
P-values <0.05 were considered to represent a statistically
significant result.
Results
RDL of satellite alpha in NMT and TT
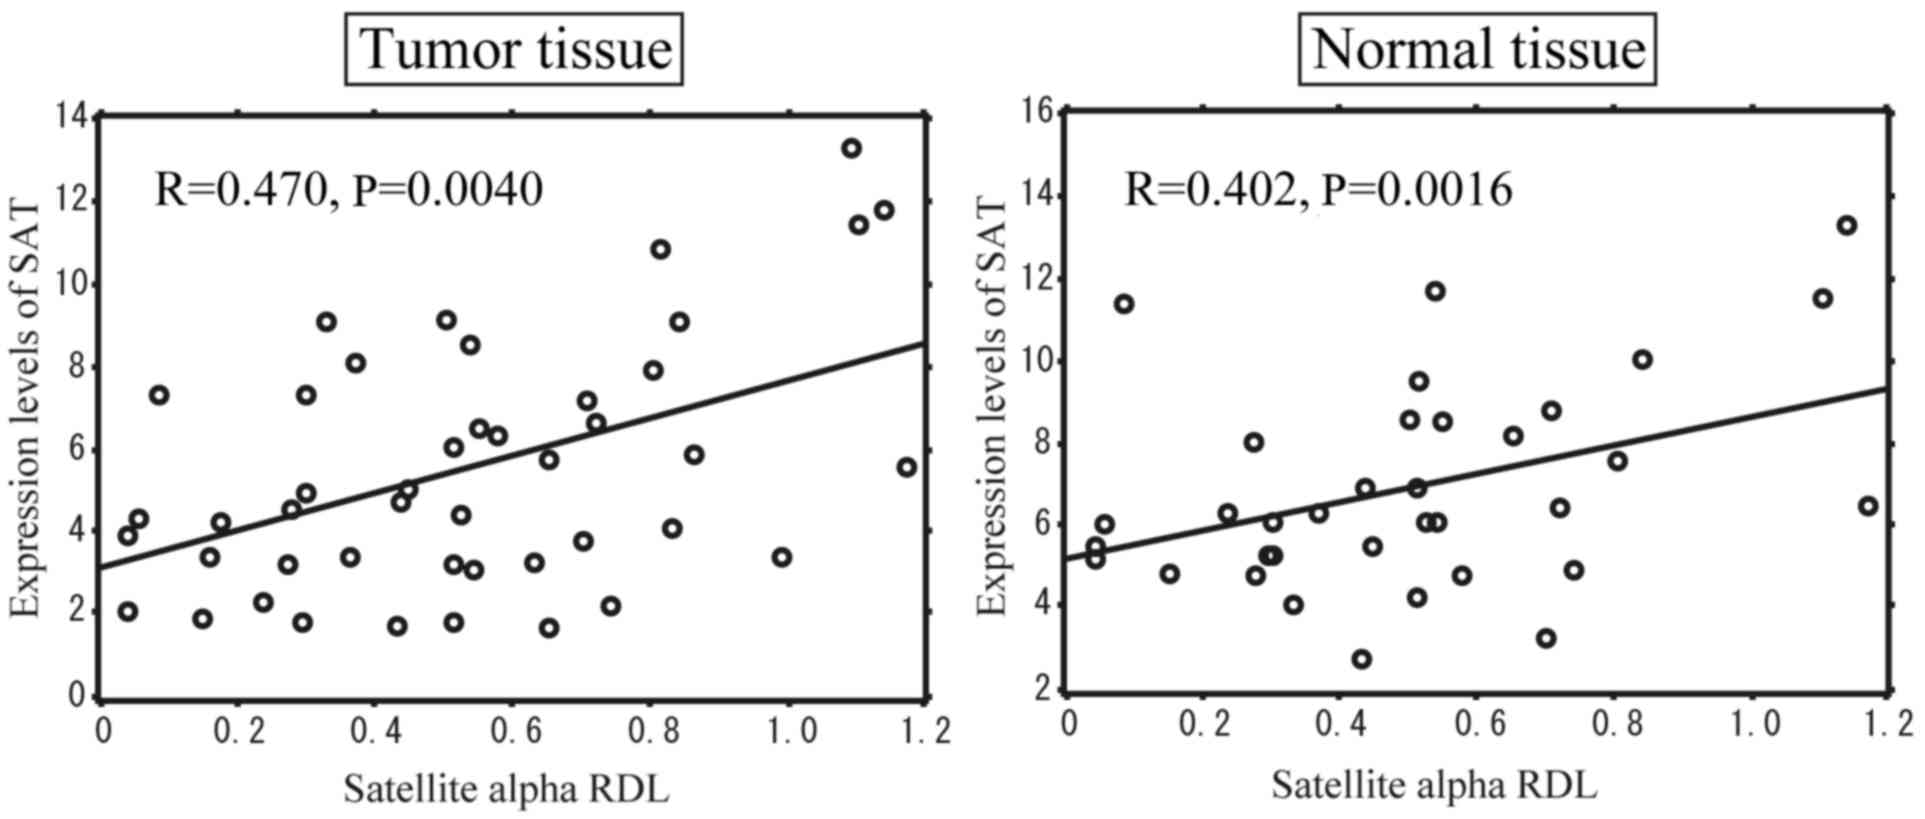
We determined the correlation between the DNA
hypomethylation levels of satellite region and the expression of
SAT in breast cancer and the NMTs corresponding TT. We evaluated
the RDL of satellite alpha in the NMTs and TT from 45 patients with
breast cancer using the MethyLight method and measured the
expression of SAT by RT-qPCR. Pearson's correlation coefficient
revealed that the SAT expression significantly correlated with the
levels of hypomethylation of satellite alpha sequences, not only in
TT, but also in NMTs (Fig. 2).
These data indicated that the expression of SAT was enhanced at the
centromeric region where the methylation of satellite alpha was
low, even in NMTs surrounding TT, suggesting that changes in
hypomethylation are involved in breast cancer development in
conjunction with the aberrant expression of SAT.
Array CGH of clinical specimens with a
high and low SAT expression
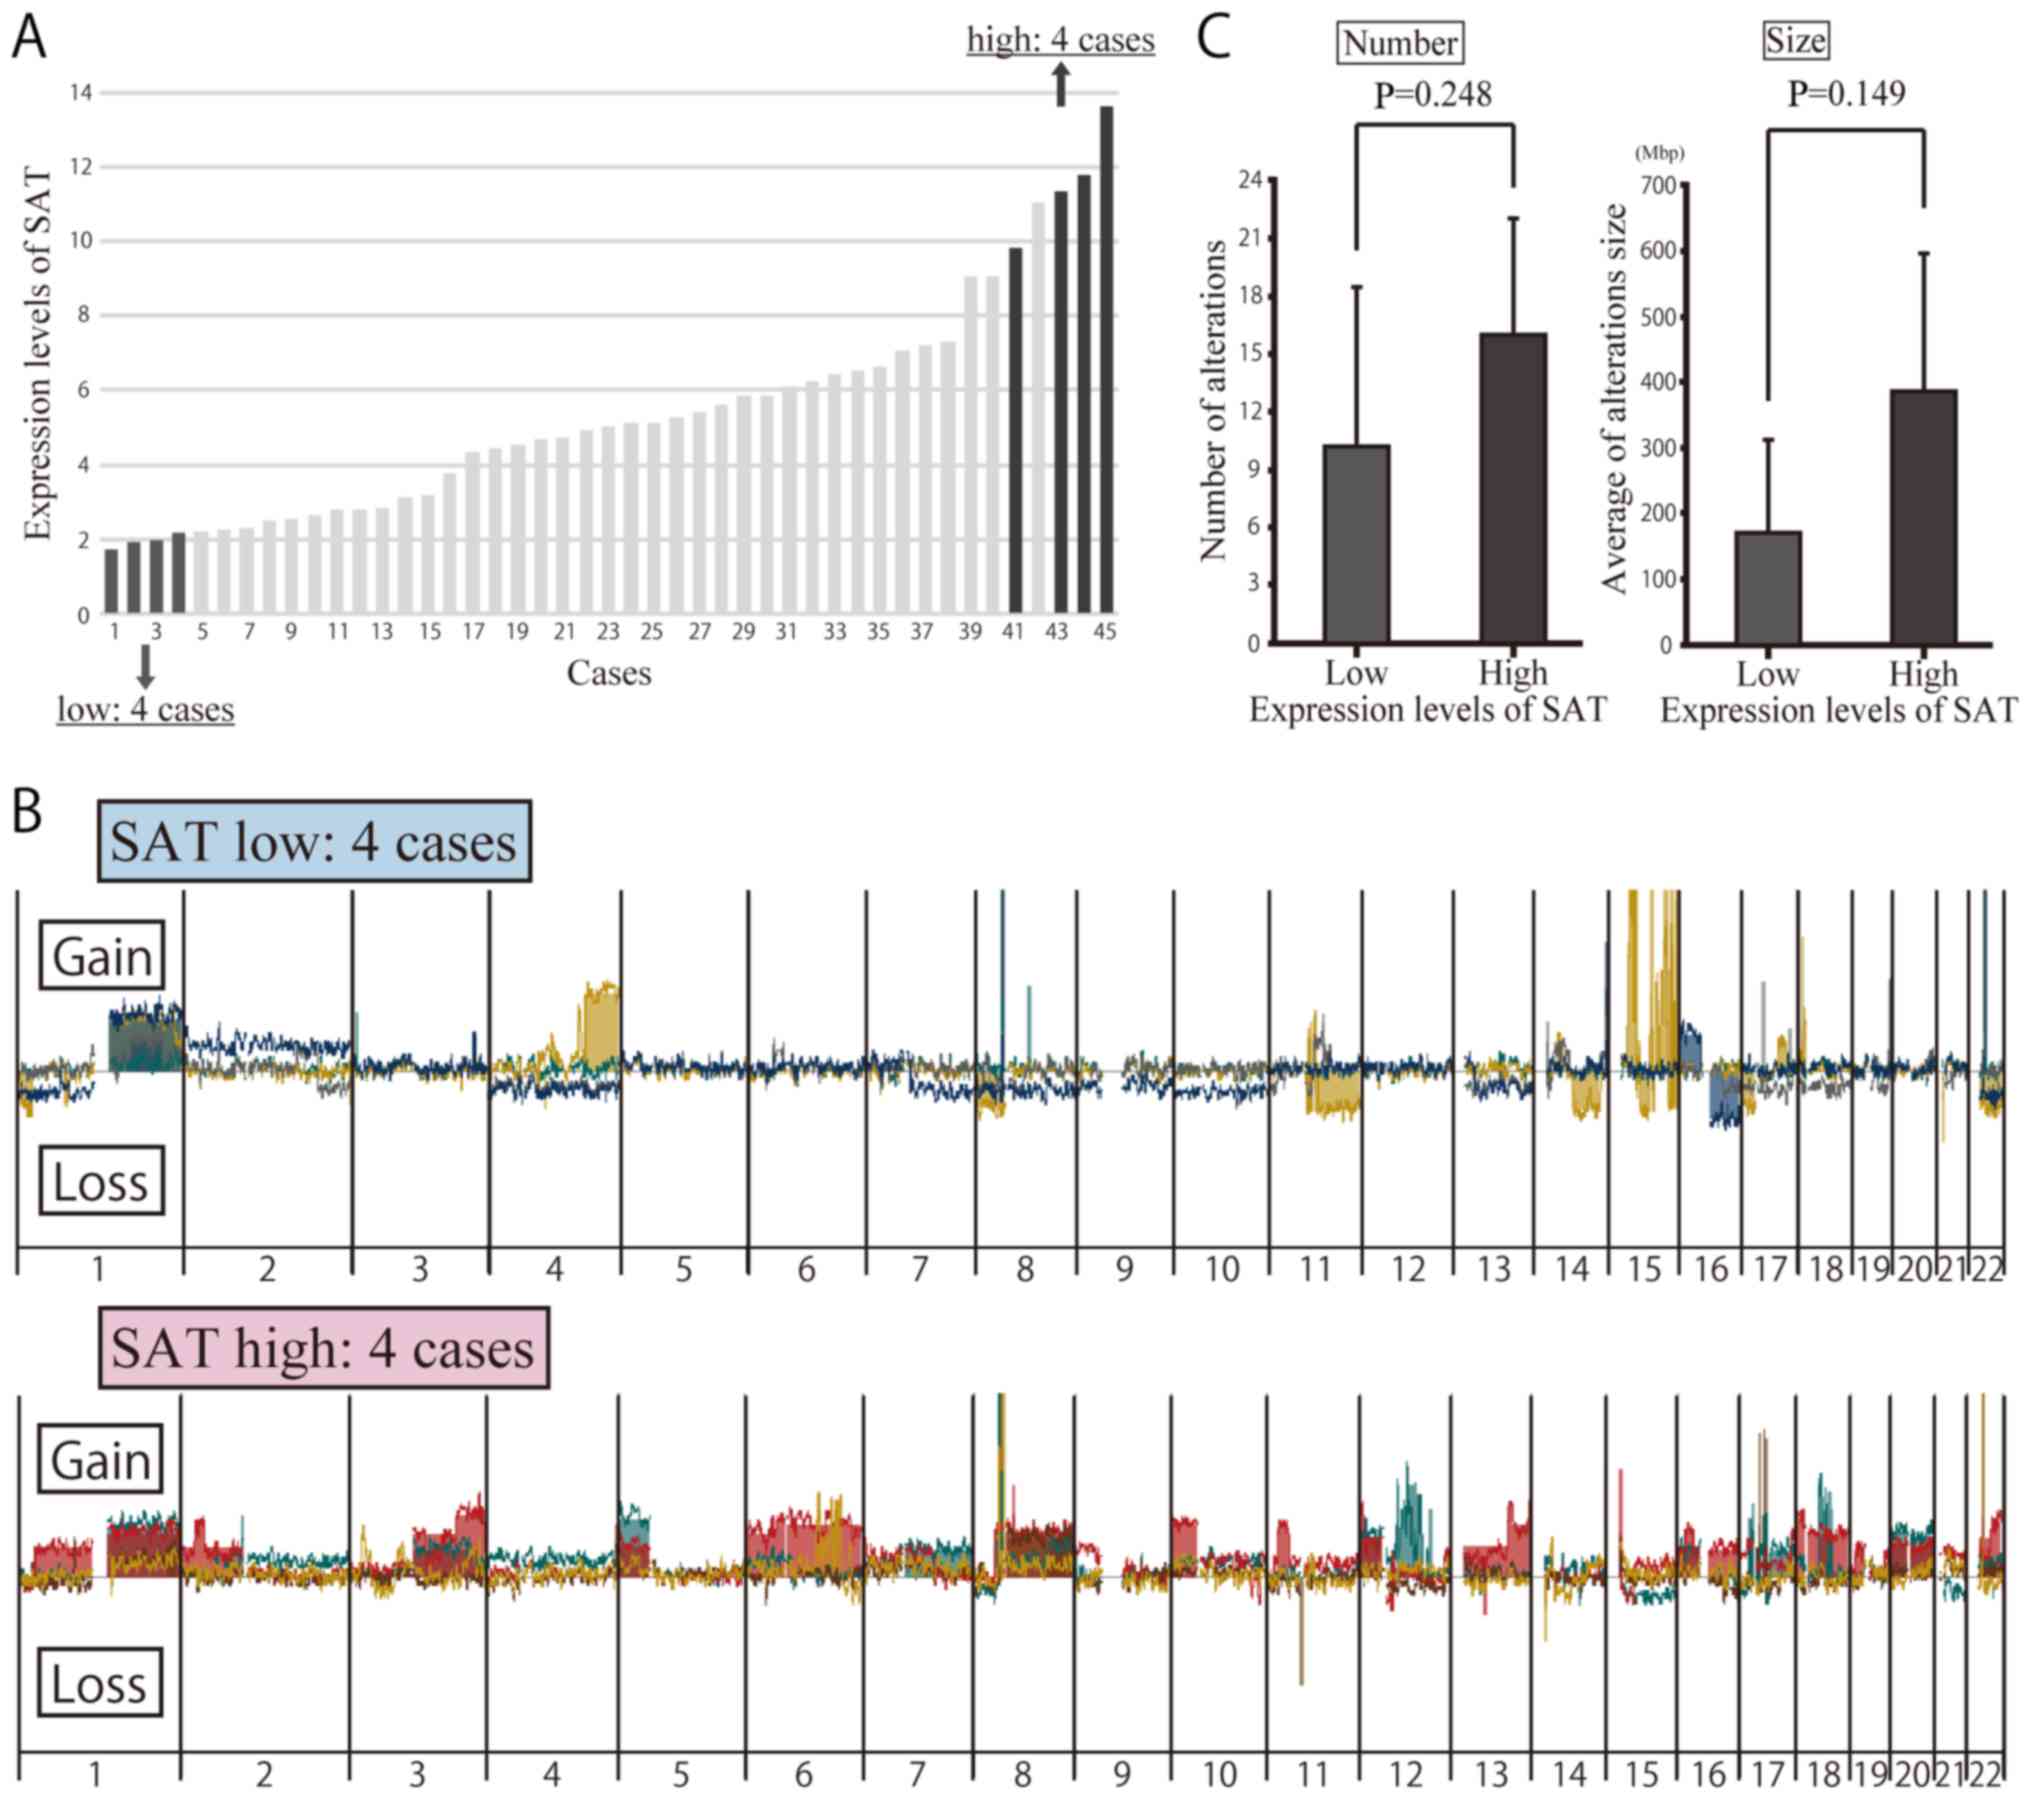
To determine whether or not the overexpression of
SAT induces chromosomal instability in breast cancer, an array CGH
analysis was carried out to detect copy number alterations in 8
patients, 4 of whom exhibited a high expression of SAT and the
other 4 of whom had a low expression of SAT (Fig. 3A). Table IV presents the clinicopathological
characteristics of the 8 patients. Copy number alterations were
compared between these patients. Array CGH was used to compare the
copy number alterations between these patients (Fig. 3B). The results revealed a
difference in the number and location of the copy number
alterations, but no significant differences were noted in the
number or size of the regions with copy number alterations based on
SAT expression (Fig. 3C).
| Table IVClinicopathological characeristics of
breast cancer specimens in array CGH analyses. |
Table IV
Clinicopathological characeristics of
breast cancer specimens in array CGH analyses.
| Case no.a | SAT expression | Age | BMI | T | N | M | ER | HER2 | Bilateral breast
tumors | Malignancies in
other organs |
|---|
| 1 | Low | 48 | 26 | 2 | − | − | − | − | − | − |
| 2 | Low | 41 | 19 | 1 | − | − | + | − | − | − |
| 3 | Low | 39 | 25 | 2 | + | − | − | − | − | − |
| 4 | Low | 68 | 26 | 1 | − | − | + | + | − | + |
| 41 | High | 34 | 19 | 1 | − | − | + | − | − | − |
| 43 | High | 43 | 18 | 1 | − | − | + | + | − | − |
| 44 | High | 59 | 19 | 2 | − | − | − | − | − | − |
| 45 | High | 48 | 23 | 1 | + | − | + | + | − | − |
Mitotic errors in satellite
alpha-transfected cells
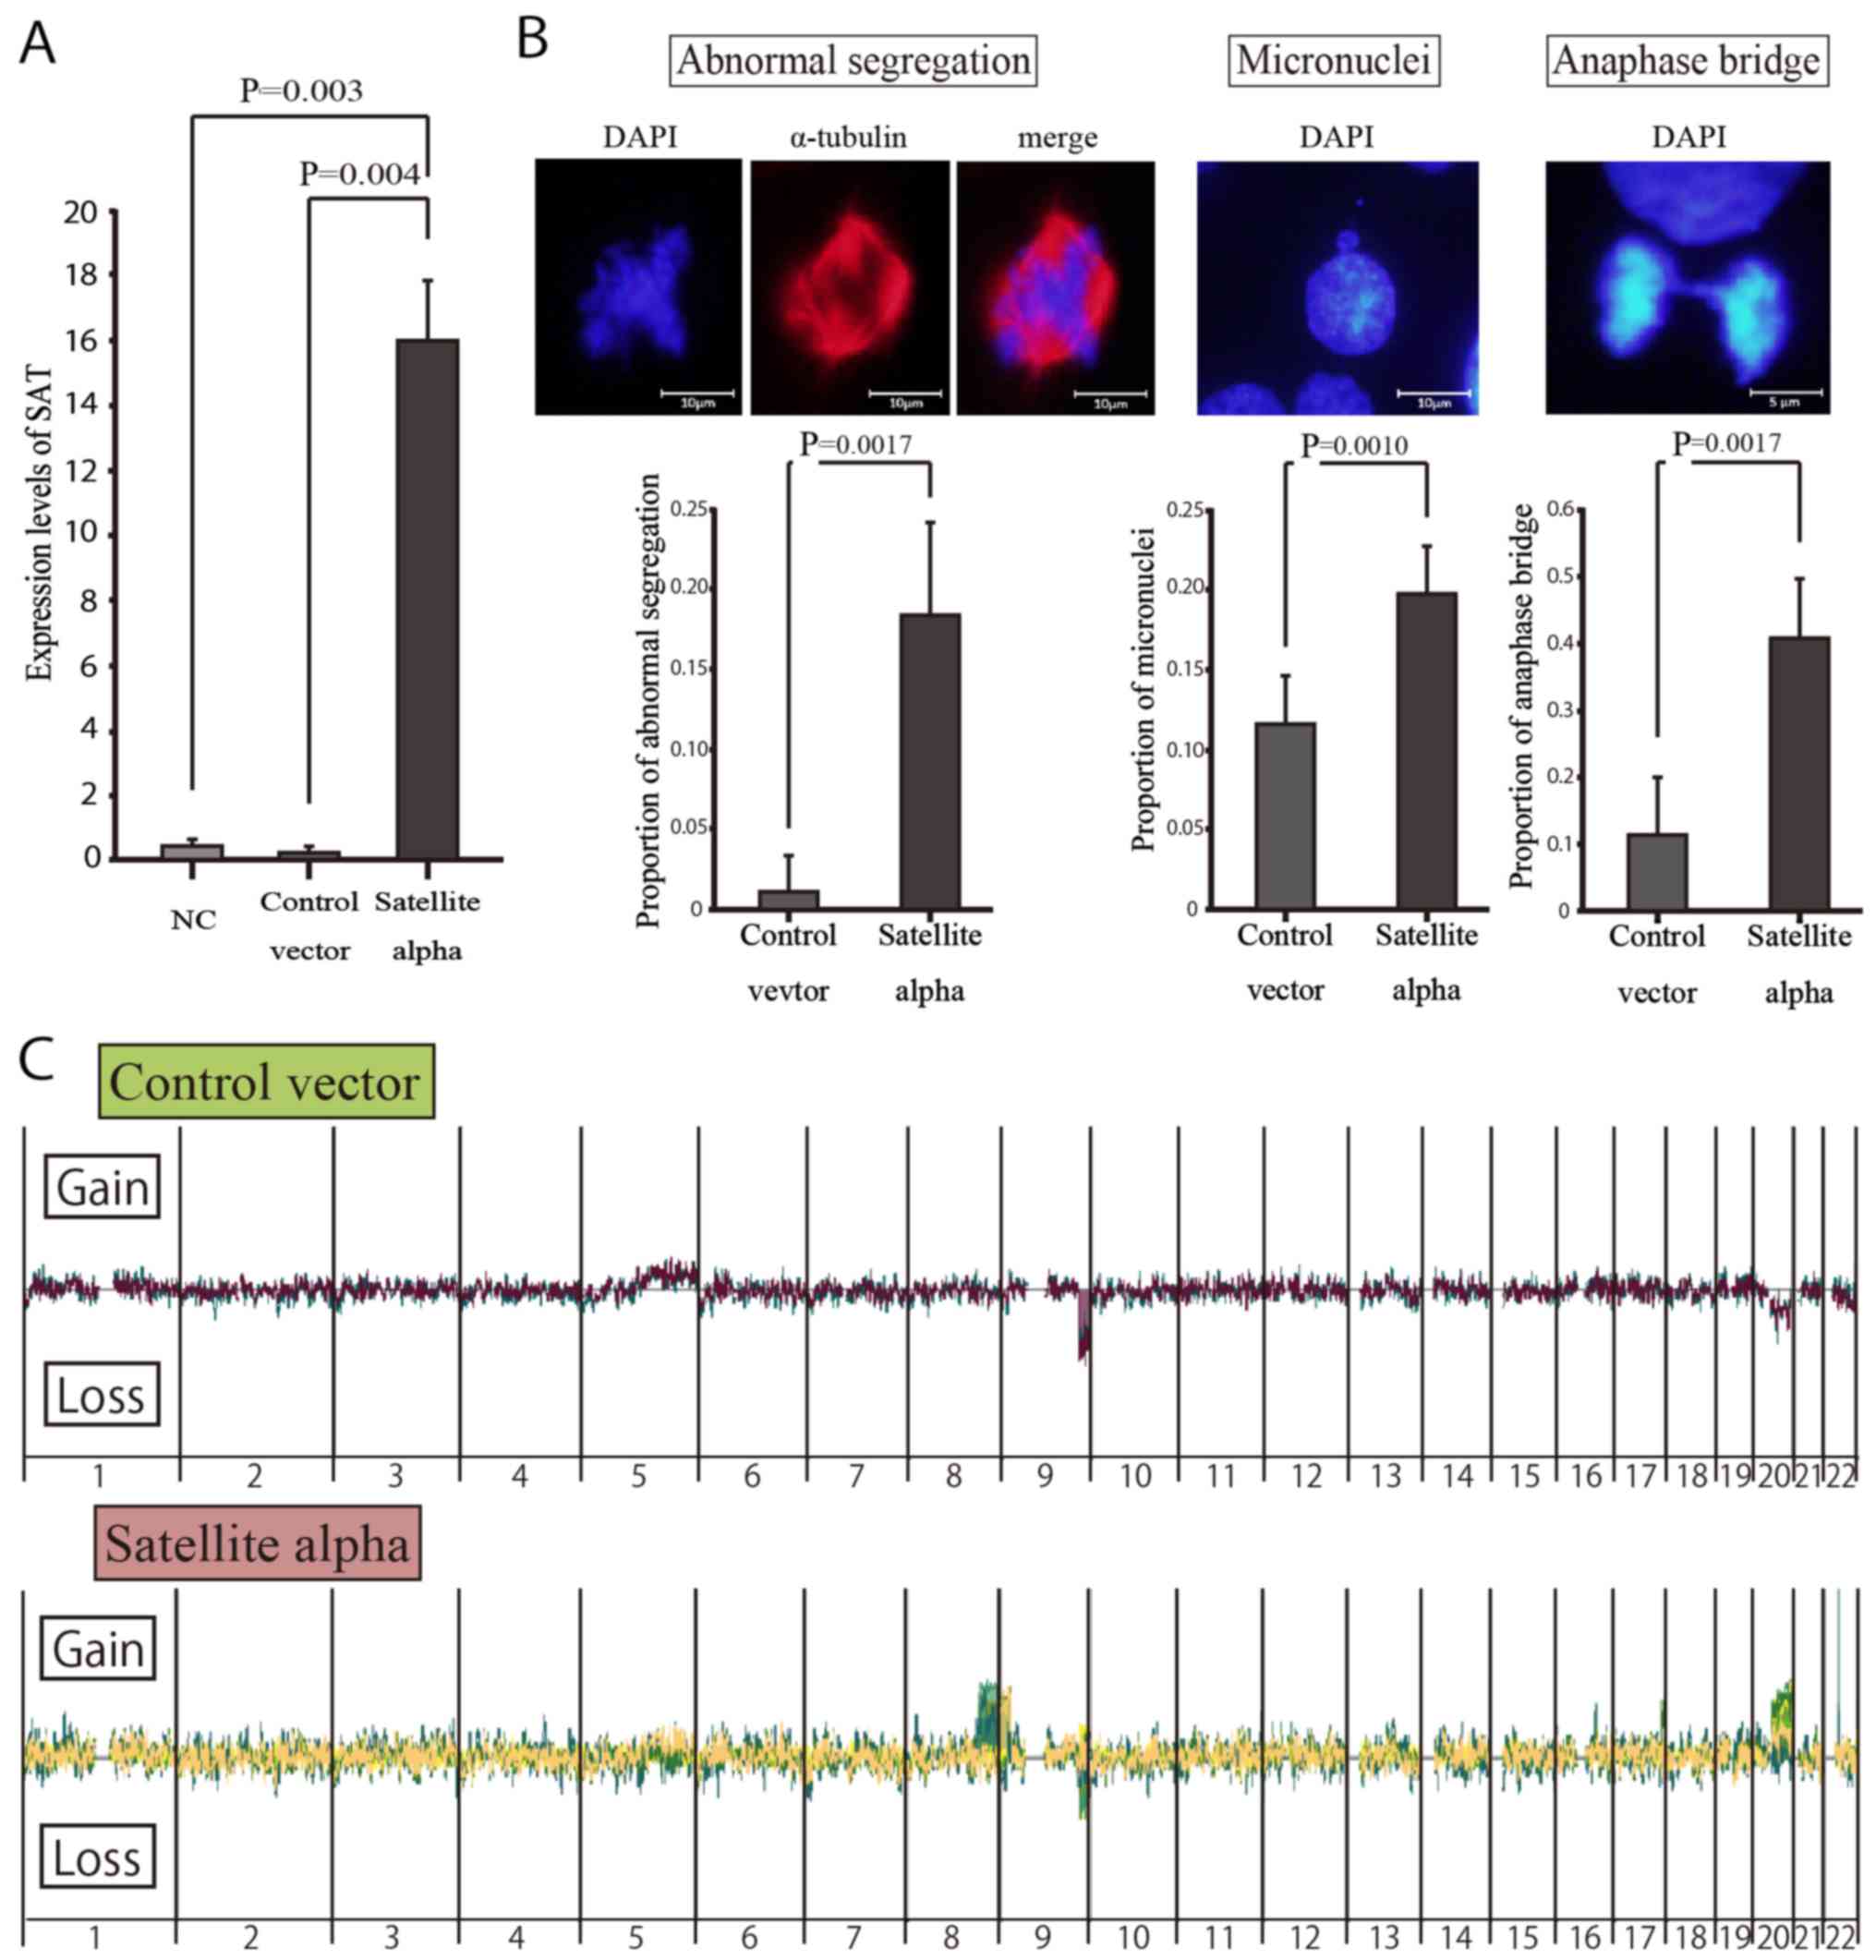
To examine whether or not the overexpression of SAT
induces chromosomal instability in normal mammary cells, we
transduced the satellite alpha sequences using lentiviral vectors
into HMEpCs and consequently induced the overexpression of SAT in
these cells. According to the GFP-positive rates on flow cytometry
(data not shown), the transduction efficiencies were 69.2 and 70.1%
in the satellite alpha-transfected cells and control cells
(transfected by vectors without satellite alpha sequences),
respectively. RT-qPCR revealed a significantly higher expression of
SAT in the cells transfected with satellite alpha-positive viruses
than in the Control vector group (Fig.
4A).
Immunocytochemistry was performed to detect mitotic
errors that might lead to chromosomal instability. On comparing
transduced cells with satellite alpha sequences and those without
such sequences, the rates of abnormal segregations of chromosomes,
micronuclei and anaphase bridging were significantly higher in the
cells with satellite alpha harboring overexpression of SAT than in
those without it (Fig. 4B).
Array CGH in vitro with high and low SAT
expression
To identify the specific locations at which the
overexpression of SAT led to chromosomal instability, copy number
alterations in satellite alpha-transfected cells were determined by
array CGH (Fig. 4C). Copy number
gains were frequently observed at specific locations in the long
arm (q arm) of human chromosomes 8 and 20 (8q and 20q) in the
SAT-overexpressing cells, but not in the control vector-transfected
cells, suggesting that these chromosomal alterations were induced
by the overexpression of SAT. By contrast, copy number losses of
chromosome 9q were observed in both cell groups, suggesting that
those were differences from the reference DNA employed in the CGH
arrays.
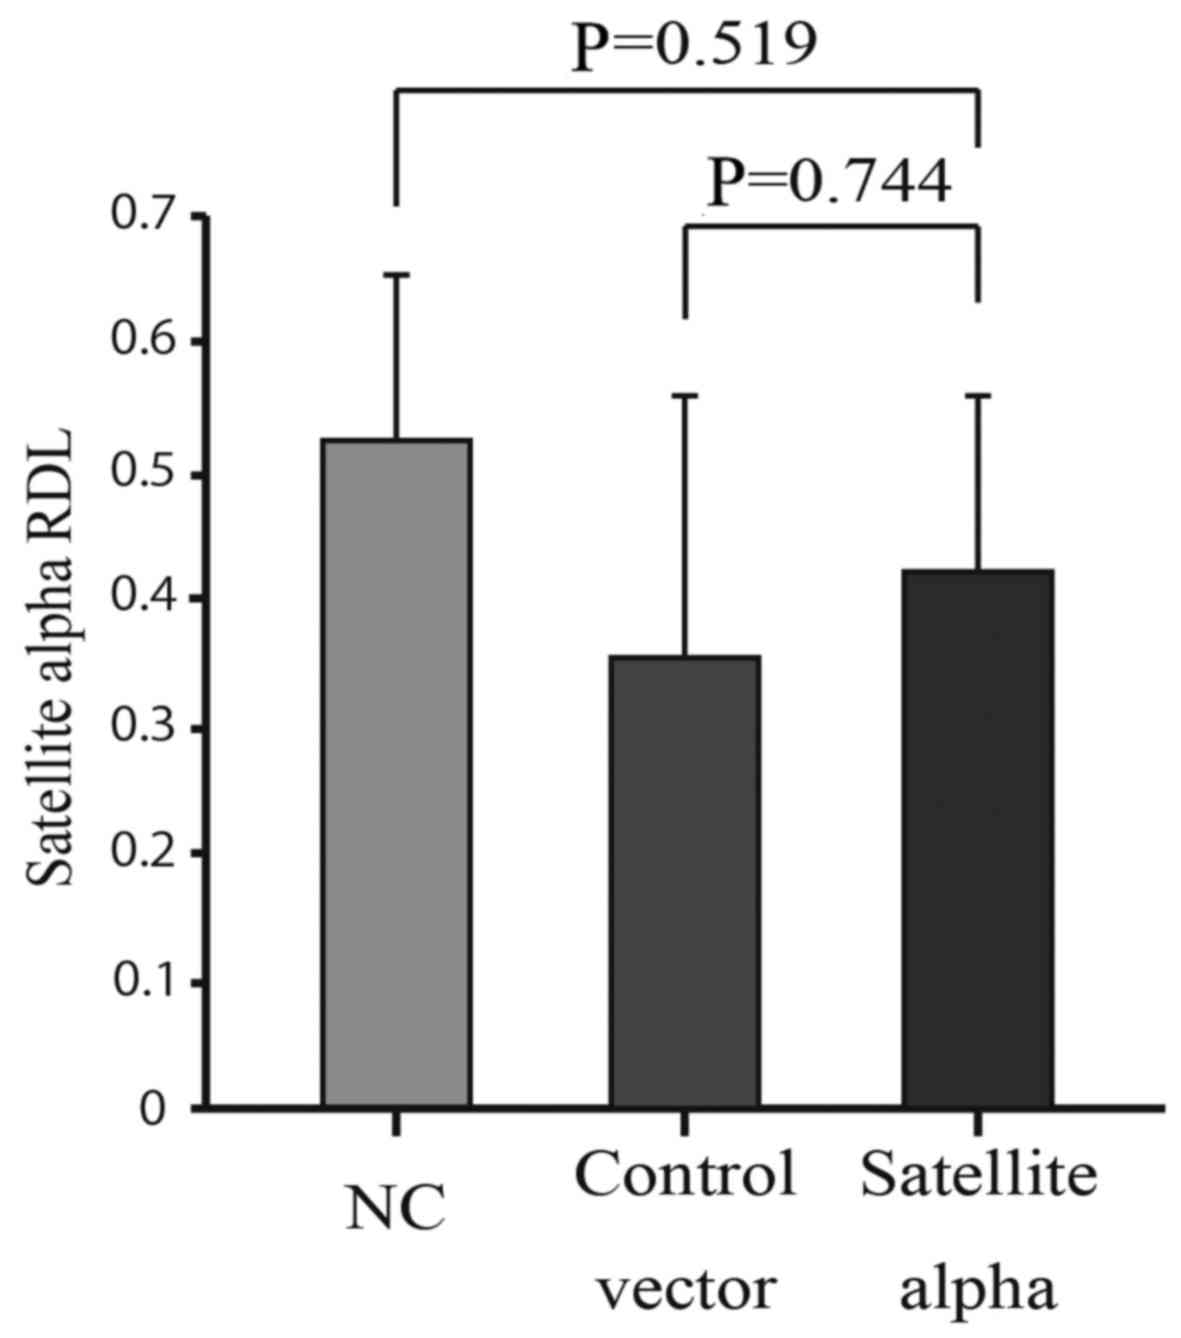
Alterations in the methylation levels in
satellite alpha-transfected cells
Based on signal transduction, hypomethylation at the
centromere leads to the overexpression of SAT; however, the reverse
effect has not been examined. We therefore focused on the
methylation levels at the centromere in connection with the
expression of SAT. Using HMEpCs transduced with the satellite alpha
sequences, the methylation levels of HMEpCs were measured via the
MethyLight method and compared with those of control cells. No
significant reduction in the methylation was observed in HMEpCs
overexpressing SAT compared to both the Control vector and NC
groups (Fig. 5). This indicates
that increased levels of SAT did not affect the levels of
methylation at the centromere, although decreased levels of
methylation at the centromeric regions enhanced the expression of
SAT.
Discussion
Chromosomal instability is induced by the
overexpression of SAT, even in normal epithelial cells
The aberrant over-expression of satellite RNAs has
been observed in various epithelial cancer cells (20) and may be actively involved in
cellular carcinogenesis (21,22).
It also leads to chromosomal instability in BRCA1-knockout mammary
gland cells and KRAS-mutated pancreatic epithelial cells (21,22).
However, its effects in normal cells have not yet been verified, at
least to the best of our knowledge. In this study, we demonstrated
that the overexpression of SAT led to chromosomal mis-segregations
in normal mammary epithelial cells, enhancing chromosomal
instability (Fig. 4B). To the best
of our knowledge, this is the first report to demonstrate that
chromosomal instability is induced by excessive satellite RNA in
normal human epithelial cells.
Cells with chromosomal mis-segregations are
considered to be at an increased risk of undergoing carcinogenesis,
although they did not acquire malignant potential in the present
study. These cells displayed contact inhibition following several
rounds of subculture, as shown in the untransfected HMEpCs (data
not shown). This implies that mis-segregation does not cause cells
to transform, but instead encourages cell death by apoptotic
machinery. Immunocytochemistry revealed representative
morphological changes of mis-segregation during cell division
(Fig. 4B), and array CGH revealed
copy number alterations of specific chromosomes (Fig. 4C), both of which are strongly
implicated in chromosomal instability. Such abnormal segregations
observed in immunocytochemistry seemed to occur in wide and
unspecified regions of chromosomes rather than in specific
chromosomes. The overexpression of SAT may enhance the risk of
abnormal segregation of cells in any region of the chromosome, but
most cells are excluded by apoptotic machinery, as they lack the
growth advantages characteristic of cancer cells. Surviving cells
may escape this apoptotic machinery via SAT-induced copy number
gains in chromosomes 8q and 20q.
DNA hypomethylation and
carcinogenesis
Decreased levels of methylation at the centromeric
regions reportedly cause the overexpression of satellite RNA, which
induces chromosomal instability (24-26).
In this study, we demonstrated a significant correlation between
hypomethylation at the satellite regions and the expression of SAT
in clinical specimens of breast cancer (Fig. 2). By contrast, the overexpression
of SAT did not affect the levels of methylation at the satellite
regions (Fig. 5), indicating that
a decrease in the levels of methylation occurs in advance at the
centromeric regions, followed by the over-expression of SAT in the
process of chromosomal instability. Therefore, hypomethylation
plays an initial role in carcinogenesis. Nevertheless, epigenetic
defects by themselves may not be sufficient to drive
carcinogenesis, while the appropriate regulation of cell cycle
checkpoints is in working order. For example, ICF syndrome caused
by aberrant DNA methyltransferase 3b (DNMT3b) leads to genome-wide
hypomethylation, but it rarely induces malignant disease (28,29).
Our findings indicated that hypomethylation and SAT overexpression
induced chromosomal mis-segregation in non-cancer cells, although
these normal cells did not exhibit infinite proliferative capacity,
suggesting that further contributions are required for the
development of cancer.
Specific chromosome alterations in array
CGH of clinical specimens
No significant differences in the number or size of
the altered regions on a whole-genomic scale were observed between
clinical samples with high and low expression of SAT in the array
CGH analyses (Fig. 3C). We
therefore focused on specific chromosomes, identifying obvious
differences between them. Copy number gains at 8q and 20q were
frequently observed only in clinical samples with a high expression
of SAT, with no such observations made in those with a low
expression, which was consistent with data obtained in vitro
using satellite alpha-transfected cells (Figs. 3B and 4C). Some copy number alterations were
also found in other chromosomal regions in samples with both high
and low expression of SAT. Chromosomal alteration of 8q and 20q may
have occurred at the initiation of breast cancer development prior
to the progression of cancer, where these alterations may
occur.
These chromosomal alterations are universally
recognized in breast cancer (30).
Of note, chromosomes 8q and 20q are so-called ‘fragile regions’
where aberrations are frequently found in several other carcinomas
(31-33). Copy number gains in those specific
chromosomes are observed from the very beginning of carcinogenesis
in most types of carcinomas and are not specific to breast cancer.
However, whether or not the copy number alterations at chromosomes
8q and 20q are essential for subsequent carcinogenesis is unclear.
As shown in this study, the overexpression of SAT led to
chromosomal alterations at chromosomes 8q and 20q in vitro,
although no malignancy developed. Given that these chromosomal
alterations are frequently observed in clinical specimens with a
high expression of SAT, however, they may be involved in the
development of cancer together with subsequent oncogenic genetic
and epigenetic alterations in the process of acquiring malignant
potential.
In conclusion, the overexpression of SAT impaired
the stability of chromosomes 8q and 20q in normal mammary
epithelial cells, as well as in clinical specimens of breast
cancer. Chromosomal instability induced by the overexpression of
SAT may be involved in the development of breast cancer. It is
important, however, to interpret our results within the context of
the study limitations, and further studies are required to draw
definitive conclusions.
Acknowledgments
Not applicable.
Notes
[1]
Funding
This study was supported in part by a Grant-in-Aid
for postgraduate students from Jichi Medical University and The JMU
Graduate Student Start-Up Award, a Grant-in-Aid from the Ministry
of Education, Culture, Sports, Science and Technology, and the JKA
Foundation through its promotion funds from Keirin Racing.
[2] Availability
of data and materials
The analyzed datasets generated during the study are
available from the corresponding author on reasonable request.
[3] Authors'
contributions
KI designed the study and wrote the initial draft of
the manuscript. KS contributed to analysis and interpretation of
data and assisted in the preparation of the manuscript. TO
contributed to the execution of the lentiviral infection
experiments. TF, YT, NK, FW, HI, YM, TK, MS, KF, YM, HN, FK and TR
contributed to data collection and interpretation, and critically
reviewed the manuscript. All authors have read and approved the
final manuscript.
[4] Ethics
approval and consent to participate
This study was approved by the Research Ethics
Committee at Jichi Medical University. Written informed consent was
obtained from each study participant.
[5] Consent for
publication
Not applicable.
[6] Competing
interests
The authors declare that they have no competing
interests.
References
|
1
|
Feinberg AP and Vogelstein B:
Hypomethylation distinguishes genes of some human cancers from
their normal counterparts. Nature. 301:89–92. 1983. View Article : Google Scholar : PubMed/NCBI
|
|
2
|
Rodriguez J, Frigola J, Vendrell E,
Risques RA, Fraga MF, Morales C, Moreno V, Esteller M, Capellà G,
Ribas M, et al: Chromosomal instability correlates with genome-wide
DNA demethylation in human primary colorectal cancers. Cancer Res.
66:8462–9468. 2006. View Article : Google Scholar : PubMed/NCBI
|
|
3
|
Herrera LA, Prada D, Andonegui MA and
Dueñas-González A: The epigenetic origin of aneuploidy. Curr
Genomics. 9:43–50. 2008. View Article : Google Scholar : PubMed/NCBI
|
|
4
|
Kawano H, Saeki H, Kitao H, Tsuda Y, Otsu
H, Ando K, Ito S, Egashira A, Oki E, Morita M, et al: Chromosomal
instability associated with global DNA hypomethylation is
associated with the initiation and progression of esophageal
squamous cell carcinoma. Ann Surg Oncol. 21(Suppl 4): S696–S702.
2014. View Article : Google Scholar : PubMed/NCBI
|
|
5
|
Esteller M, Silva JM, Dominguez G, Bonilla
F, Matias-Guiu X, Lerma E, Bussaglia E, Prat J, Harkes IC, Repasky
EA, et al: Promoter hypermethylation and BRCA1 inactivation in
sporadic breast and ovarian tumors. J Natl Cancer Inst. 92:564–569.
2000. View Article : Google Scholar : PubMed/NCBI
|
|
6
|
Yang B, Guo M, Herman JG and Clark DP:
Aberrant promoter methylation profiles of tumor suppressor genes in
hepatocellular carcinoma. Am J Pathol. 163:1101–1107. 2003.
View Article : Google Scholar : PubMed/NCBI
|
|
7
|
Herman JG and Baylin SB: Gene silencing in
cancer in association with promoter hypermethylation. N Engl J Med.
349:2042–2054. 2003. View Article : Google Scholar : PubMed/NCBI
|
|
8
|
Itano O, Ueda M, Kikuchi K, Hashimoto O,
Hayatsu S, Kawaguchi M, Seki H, Aiura K and Kitajima M: Correlation
of postoperative recurrence in hepatocellular carcinoma with
demethylation of repetitive sequences. Oncogene. 21:789–797. 2002.
View Article : Google Scholar : PubMed/NCBI
|
|
9
|
Widschwendter M, Jiang G, Woods C, Müller
HM, Fiegl H, Goebel G, Marth C, Müller-Holzner E, Zeimet AG, Laird
PW, et al: DNA hypomethylation and ovarian cancer biology. Cancer
Res. 64:4472–4480. 2004. View Article : Google Scholar : PubMed/NCBI
|
|
10
|
Igarashi S, Suzuki H, Niinuma T, Shimizu
H, Nojima M, Iwaki H, Nobuoka T, Nishida T, Miyazaki Y, Takamaru H,
et al: A novel correlation between LINE-1 hypomethylation and the
malignancy of gastrointestinal stromal tumors. Clin Cancer Res.
16:5114–5123. 2010. View Article : Google Scholar : PubMed/NCBI
|
|
11
|
Eden A, Gaudet F, Waghmare A and Jaenisch
R: Chromosomal instability and tumors promoted by DNA
hypomethylation. Science. 300:4552003. View Article : Google Scholar
|
|
12
|
Gaudet F, Hodgson JG, Eden A,
Jackson-Grusby L, Dausman J, Gray JW, Leonhardt H and Jaenisch R:
Induction of tumors in mice by genomic hypomethylation. Science.
300:489–492. 2003. View Article : Google Scholar : PubMed/NCBI
|
|
13
|
Suzuki K, Suzuki I, Leodolter A, Alonso S,
Horiuchi S, Yamashita K and Perucho M: Global DNA demethylation in
gastrointestinal cancer is age dependent and precedes genomic
damage. Cancer Cell. 9:199–207. 2006. View Article : Google Scholar : PubMed/NCBI
|
|
14
|
Saito M, Suzuki K, Maeda T, Kato T,
Kamiyama H, Koizumi K, Miyaki Y, Okada S, Kiyozaki H and Konishi F:
The accumulation of DNA demethylation in Sat α in normal gastric
tissues with Helicobacter pylori infection renders susceptibility
to gastric cancer in some individuals. Oncol Rep. 27:1717–1725.
2012.PubMed/NCBI
|
|
15
|
Plohl M, Meštrović N and Mravinac B:
Centromere identity from the DNA point of view. Chromosoma.
123:313–325. 2014. View Article : Google Scholar : PubMed/NCBI
|
|
16
|
Ugarkovic D: Functional elements residing
within satellite DNAs. EMBO Rep. 6:1035–1039. 2005. View Article : Google Scholar : PubMed/NCBI
|
|
17
|
Ideue T, Cho Y, Nishimura K and Tani T:
Involvement of satellite I noncoding RNA in regulation of
chromosome segregation. Genes Cells. 19:528–538. 2014. View Article : Google Scholar : PubMed/NCBI
|
|
18
|
Rošić S, Köhler F and Erhardt S:
Repetitive centromeric satellite RNA is essential for kinetochore
formation and cell division. J Cell Biol. 207:335–349. 2014.
View Article : Google Scholar
|
|
19
|
McNulty SM, Sullivan LL and Sullivan BA:
Human centromeres produce chromosome-specific and array-specific
alpha satellite transcripts that are complexed with CENP-A and
CENP-C. Dev Cell. 42:226–240.e6. 2017. View Article : Google Scholar : PubMed/NCBI
|
|
20
|
Ting DT, Lipson D, Paul S, Brannigan BW,
Akhavanfard S, Coffman EJ, Contino G, Deshpande V, Iafrate AJ,
Letovsky S, et al: Aberrant overexpression of satellite repeats in
pancreatic and other epithelial cancers. Science. 331:593–596.
2011. View Article : Google Scholar : PubMed/NCBI
|
|
21
|
Zhu Q, Pao GM, Huynh AM, Suh H, Tonnu N,
Nederlof PM, Gage FH and Verma IM: BRCA1 tumour suppression occurs
via heterochromatin-mediated silencing. Nature. 477:179–184. 2011.
View Article : Google Scholar : PubMed/NCBI
|
|
22
|
Kishikawa T, Otsuka M, Yoshikawa T, Ohno
M, Ijichi H and Koike K: Satellite RNAs promote pancreatic
oncogenic processes via the dysfunction of YBX1. Nat Commun.
7:130062016. View Article : Google Scholar : PubMed/NCBI
|
|
23
|
Lehnertz B, Ueda Y, Derijck AA,
Braunschweig U, Perez-Burgos L, Kubicek S, Chen T, Li E, Jenuwein T
and Peters AH: Suv39h-mediated histone H3 lysine 9 methylation
directs DNA methylation to major satellite repeats at pericentric
heterochromatin. Curr Biol. 13:1192–1200. 2003. View Article : Google Scholar : PubMed/NCBI
|
|
24
|
Bouzinba-Segard H, Guais A and Francastel
C: Accumulation of small murine minor satellite transcripts leads
to impaired centromeric architecture and function. Proc Natl Acad
Sci USA. 103:8709–8714. 2006. View Article : Google Scholar : PubMed/NCBI
|
|
25
|
Eymery A, Horard B, El Atifi-Borel M,
Fourel G, Berger F, Vitte AL, Van den Broeck A, Brambilla E,
Fournier A, Callanan M, et al: A transcriptomic analysis of human
centromeric and pericentric sequences in normal and tumor cells.
Nucleic Acids Res. 37:6340–6354. 2009. View Article : Google Scholar : PubMed/NCBI
|
|
26
|
Leonova KI, Brodsky L, Lipchick B, Pal M,
Novototskaya L, Chenchik AA, Sen GC, Komarova EA and Gudkov AV: P53
cooperates with DNA methylation and a suicidal interferon response
to maintain epigenetic silencing of repeats and noncoding RNAs.
Proc Natl Acad Sci USA. 110:E89–E98. 2013. View Article : Google Scholar :
|
|
27
|
Weisenberger DJ, Campan M, Long TI, Kim M,
Woods C, Fiala E, Ehrlich M and Laird PW: Analysis of repetitive
element DNA methylation by MethyLight. Nucleic Acids Res.
33:6823–6836. 2005. View Article : Google Scholar : PubMed/NCBI
|
|
28
|
Hagleitner MM, Lankester A, Maraschio P,
Hultén M, Fryns JP, Schuetz C, Gimelli G, Davies EG, Gennery A,
Belohradsky BH, et al: Clinical spectrum of immunodeficiency,
centromeric instability and facial dysmorphism (ICF syndrome). J
Med Genet. 45:93–99. 2008. View Article : Google Scholar
|
|
29
|
Walton EL, Francastel C and Velasco G:
Dnmt3b prefers germ line genes and centromeric regions: Lessons
from the ICF Syndrome and Cancer and Implications for Diseases.
Biology (Basel). 3:578–605. 2014.
|
|
30
|
Tsuji K, Kawauchi S, Saito S, Furuya T,
Ikemoto K, Nakao M, Yamamoto S, Oka M, Hirano T and Sasaki K:
Breast cancer cell lines carry cell line-specific genomic
alterations that are distinct from aberrations in breast cancer
tissues: Comparison of the CGH profiles between cancer cell lines
and primary cancer tissues. BMC Cancer. 10:152010. View Article : Google Scholar : PubMed/NCBI
|
|
31
|
Uchida M, Tsukamoto Y, Uchida T, Ishikawa
Y, Nagai T, Hijiya N, Nguyen LT, Nakada C, Kuroda A, Okimoto T, et
al: Genomic profiling of gastric carcinoma in situ and adenomas by
array-based comparative genomic hybridization. J Pathol.
221:96–105. 2010. View Article : Google Scholar : PubMed/NCBI
|
|
32
|
Tabach Y, Kogan-Sakin I, Buganim Y,
Solomon H, Goldfinger N, Hovland R, Ke XS, Oyan AM, Kalland KH,
Rotter V, et al: Amplification of the 20q chromosomal arm occurs
early in tumorigenic transformation and may initiate cancer. PLoS
One. 6:e146322011. View Article : Google Scholar : PubMed/NCBI
|
|
33
|
Orsetti B, Selves J, Bascoul-Mollevi C,
Lasorsa L, Gordien K, Bibeau F, Massemin B, Paraf F, Soubeyran I,
Hostein I, et al: Impact of chromosomal instability on colorectal
cancer progression and outcome. BMC Cancer. 14:1212014. View Article : Google Scholar : PubMed/NCBI
|