Introduction
Esophageal cancer is the eighth most common type of
cancer and the sixth leading cause of cancer-related mortality
worldwide. It is frequently observed in East Asia (1). The clinicopathological
characteristics of esophageal cancer have been investigated and
clarified. Pathological tumor depth, nodal status and stage are
known to be strongly associated with the survival outcome, which
has been recently improved with advancements in multimodal
treatments (2). However, the
long-term survival outcome remains dismal, and the 5-year survival
rate of patients with potentially curable advanced esophageal
cancer has been reported to be only 34–55%, according to recent
randomized controlled trials (3,4). To
improve this poor survival outcome, appropriate treatment
strategies tailored for each individual patient are warranted. To
achieve this, the biological characteristics and causal factors of
the survival outcome require clarification. Recently, it has been
reported that the progression of the disease may affect the
biological activity of some metabolites (5,6).
Metabolome analysis may enable us to understand
tumor-specific metabolic characteristics, which would facilitate
the discovery of novel anticancer drug targets and therapeutic
strategies (7). Thus far,
comparative metabolomic profiling has been conducted for several
cancer types, such as gastric, lung, prostate, or colorectal
cancers (7,8). Metabolomic profiles of esophageal
cancer have also been investigated using blood samples (5,9–12) or
paired tumor and non-tumor tissues (5,13,14).
Metabolomic analysis using blood is preferable for the
identification of tumor markers by comprehensive analysis; however,
it does not reflect the microenvironment of the tumor, which can
only be clarified using tissue samples. In addition, the majority
of previous studies have used either nuclear magnetic resonance
(NMR) (13,14) or gas chromatography-mass
spectrometry (GC-MS) (15) for
analysis. However, capillary electrophoresis-mass spectrometry
(CE-MS), which is specialized for the analysis of ionic metabolites
and thus may lead to the identification of novel metabolic
properties of cancer, has rarely been used for the metabolomic
analysis of paired tumor and non-tumor tissues. Furthermore, the
associations between metabolomic characteristics and advancement of
the disease or survival outcome have rarely been investigated and
remain unclear. Although Wang et al clarified the
associations between metabolomic characteristics and tumor stages,
only 45 metabolites were identified by NMR analysis, and the
associations between metabolomic characteristics and other clinical
factors were not investigated (14).
Therefore, the aim of the present study was to
clarify the potential association between pathological disease
status and metabolome profiles of tissues in patients with
esophageal cancer. We also investigated the differences in
metabolomic characteristics between tumor and non-tumor tissues
from patients with esophageal cancer.
Patients and methods
Patient characteristics
The present study was designed as a single-center,
prospective observational study. The institutional review board of
Tokai University (Isehara, Japan) approved the study protocol,
which had the following inclusion criteria: i) Patients with
histologically confirmed adenocarcinoma or squamous cell carcinoma
of the esophagus undergoing curative esophagectomy; ii) the size of
the primary tumor large enough to obtain 1 g of tumor tissue
without affecting the pathological examination; iii) an age of 20
years or older; and iv) written informed consent. Pathological
tumor depth, nodal status and stage were assigned according to the
Japanese Classification of Esophageal Cancer, 11th edition
(16).
Between May, 2012 and October, 2013, a total of 35
patients were enrolled in the present study, and 35 pairs of tumor
(Ts) and non-tumor (NTs) esophageal tissues were obtained. The
characteristics and pathological findings of the patients are
presented in Table I. Neoadjuvant
chemotherapy was administered to 17 patients, and the majority of
patients underwent subtotal esophagectomy. The surgery was curative
(R0) in 24 patients, and resulted in microscopic residual disease
(R1) in 7 patients and macroscopic residual disease (R2) in 4
patients. The disease was advanced in the majority of the patients,
and the pathological stage was III or IVa in 77% of the
patients.
 | Table ICharacteristics of patients with
adenocarcinoma or squamous cell carcinoma (SCC) of the
esophagus. |
Table I
Characteristics of patients with
adenocarcinoma or squamous cell carcinoma (SCC) of the
esophagus.
| Sex, n | |
| Male | 30 |
| Female | 5 |
| Age, years | |
| Median | 67 |
| Range | 42-81 |
| Performance status,
n | |
| 0 | 30 |
| 1 | 5 |
| Neoajuvant
chemotherapy, n | |
| + | 17 |
| − | 18 |
| Histology | |
| Well
differientated SCC | 13 |
| Moderately
differientated SCC | 18 |
| Poorly
differientated SCC | 4 |
| Tumor diameter
(mm) | |
| Median | 55 |
| Range | 25-93 |
| Lymphatic
invasion | |
| − | 6 |
| + | 29 |
| Vascular
invasion | |
| − | 4 |
| + | 31 |
| Tumor depth | |
| T1 | 1 |
| T2 | 7 |
| T3 | 23 |
| T4 | 4 |
| Nodal status | |
| N0 | 8 |
| N1 | 5 |
| N2 | 16 |
| N3 | 5 |
| N4 | 1 |
| Number of lymph
node metastases | |
| Median | 2 |
| Range | 0-9 |
| Stage | |
| I | 0 |
| II | 8 |
| III | 22 |
| IVa | 5 |
| Curability | |
| R0 | 24 |
| R1 | 7 |
| R2 | 4 |
Tissue sampling and metabolite
extraction
Tumor and surrounding tissues were surgically
resected from each of the 35 patients with esophageal cancer
immediately following esophagectomy. The resected tissue samples
were promptly frozen in liquid nitrogen and stored at −80°C until
metabolite extraction. To inactivate enzymes, ~50 mg of frozen
tissue was immersed into 1,500 μl of 50%
acetonitrile/Milli-Q water containing internal standards
[H3304-1002; Human Metabolome Technologies (HMT), Tsuruoka, Japan]
at 0°C. The tissue was homogenized 3 times at 1,500 rpm for 120 sec
using a tissue homogenizer (Microsmash MS100R; Tomy Digital biology
Co., Ltd., Tokyo, Japan) before the homogenate was centrifuged at
2,300 × g and 4°C for 5 min. Subsequently, 800 μl of the the
upper aqueous layer were centrifugally filtered through a Millipore
5,000-Da cut-off filter at 9,100 × g and 4°C for 120 min to remove
proteins. The filtrate was centrifugally concentrated and
re-suspended in 50 μl of Milli-Q water for capillary
electrophoresis time-of-flight mass spectrometry (CE-TOFMS)
analysis.
Metabolome analysis
Metabolome analysis was conducted by the basic Scan
package from HMT using CE-TOFMS based on previously described
methods (17,18). Briefly, CE-TOFMS analysis was
conducted using an Agilent CE capillary electrophoresis system
equipped with an Agilent 6210 time-of-flight mass spectrometer
(Agilent Technologies, Waldbronn, Germany). The systems were
controlled by Agilent G2201AA ChemStation software version B.03.01
for CE (Agilent Technologies). The spectrometer was scanned from 50
to 1,000 m/z, and peaks were extracted using MasterHands
automatic integration software (Keio University, Tsuruoka,
Yamagata, Japan) to obtain peak information including m/z,
peak area, and migration time (MT) (19). Signal peaks corresponding to
isotopomers, adduct ions and other product ions of known
metabolites were excluded, and based on their m/z values
with the MTs, remaining peaks were annotated according to the HMT’s
proprietary metabolite database. The areas of the annotated peaks
were normalized based on internal standard levels and sample
quantities to obtain relative levels of each metabolite.
Statistical analysis
Hierarchical cluster analysis (HCA) and principal
component analysis (PCA) were performed using the proprietary
software from HMT, PeakStat and SampleStat, respectively. Detected
metabolites were plotted on metabolic pathway maps using VANTED
software (20). All continuous
data, including age, tumor diameter and the number of lymph node
metastases, are presented as medians (range) and were analyzed by
the Wilcoxon rank-sum test. A value of P<0.05 was considered to
indicate a statistically significant difference. For any compound
that was not detected in a tissue from the subjects, half of the
minimum value of the measured compound replaced the missing data.
Metabolomic profiles were compared between i) tumor and non-tumor
tissues to elucidate differences in metabolomic profiles between
them; ii) patients with T1 or T2 disease (pT1-2) and those with T3
or T4 disease (pT3-4); and iii) patients with node-negative
(pN−) and node-positive (pN+) disease.
Results
Metabolomic characteristics between Ts
and NTs
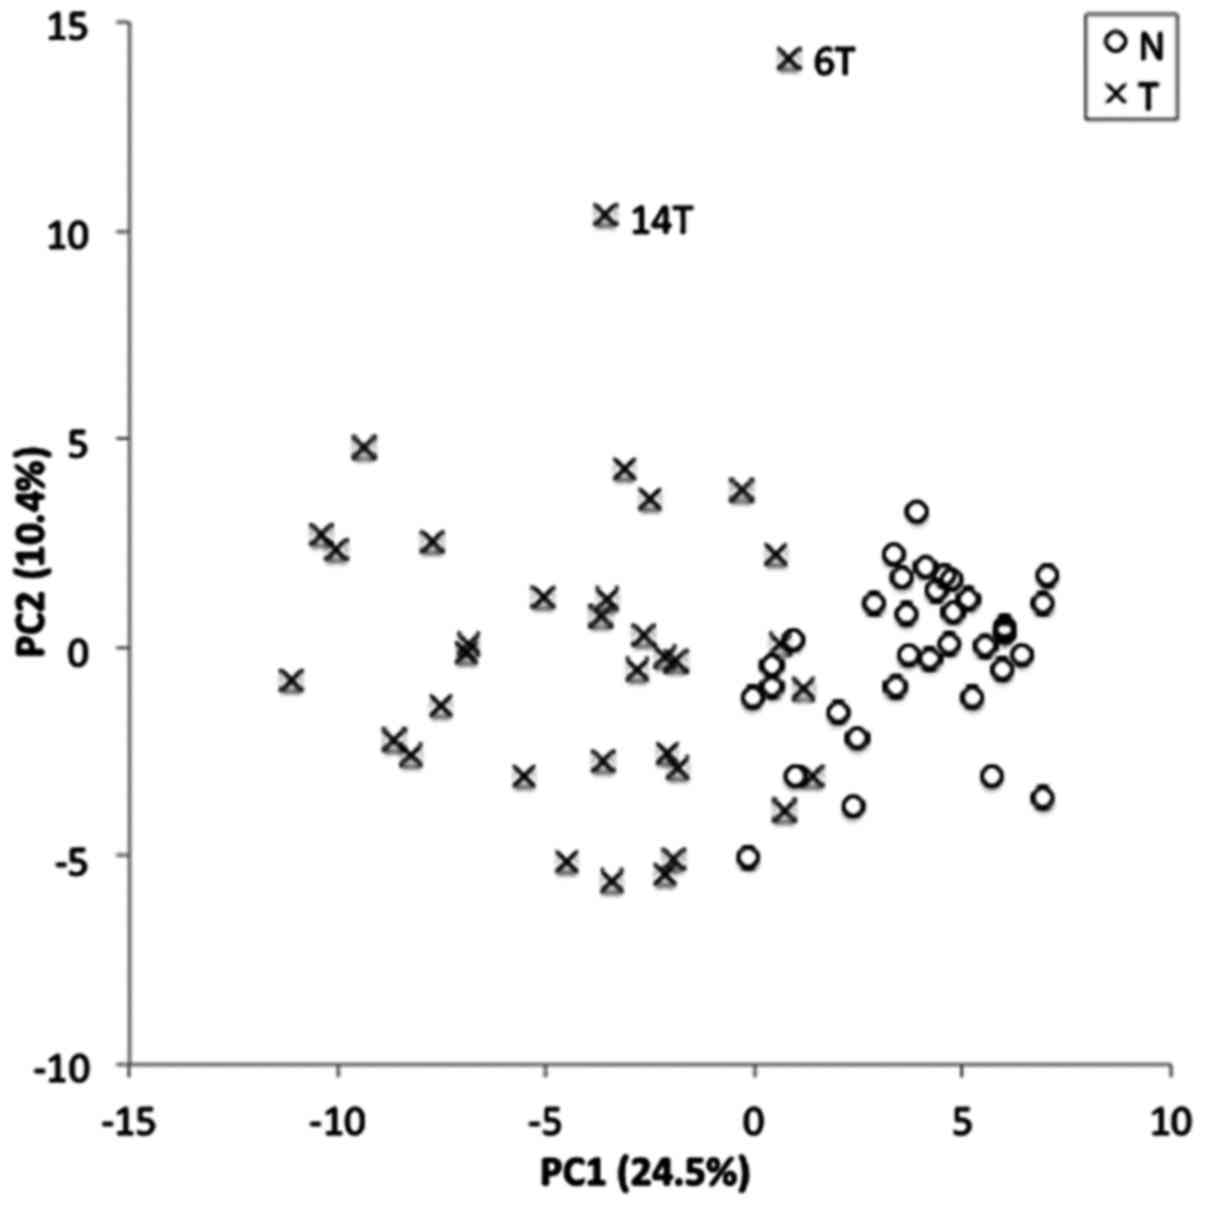
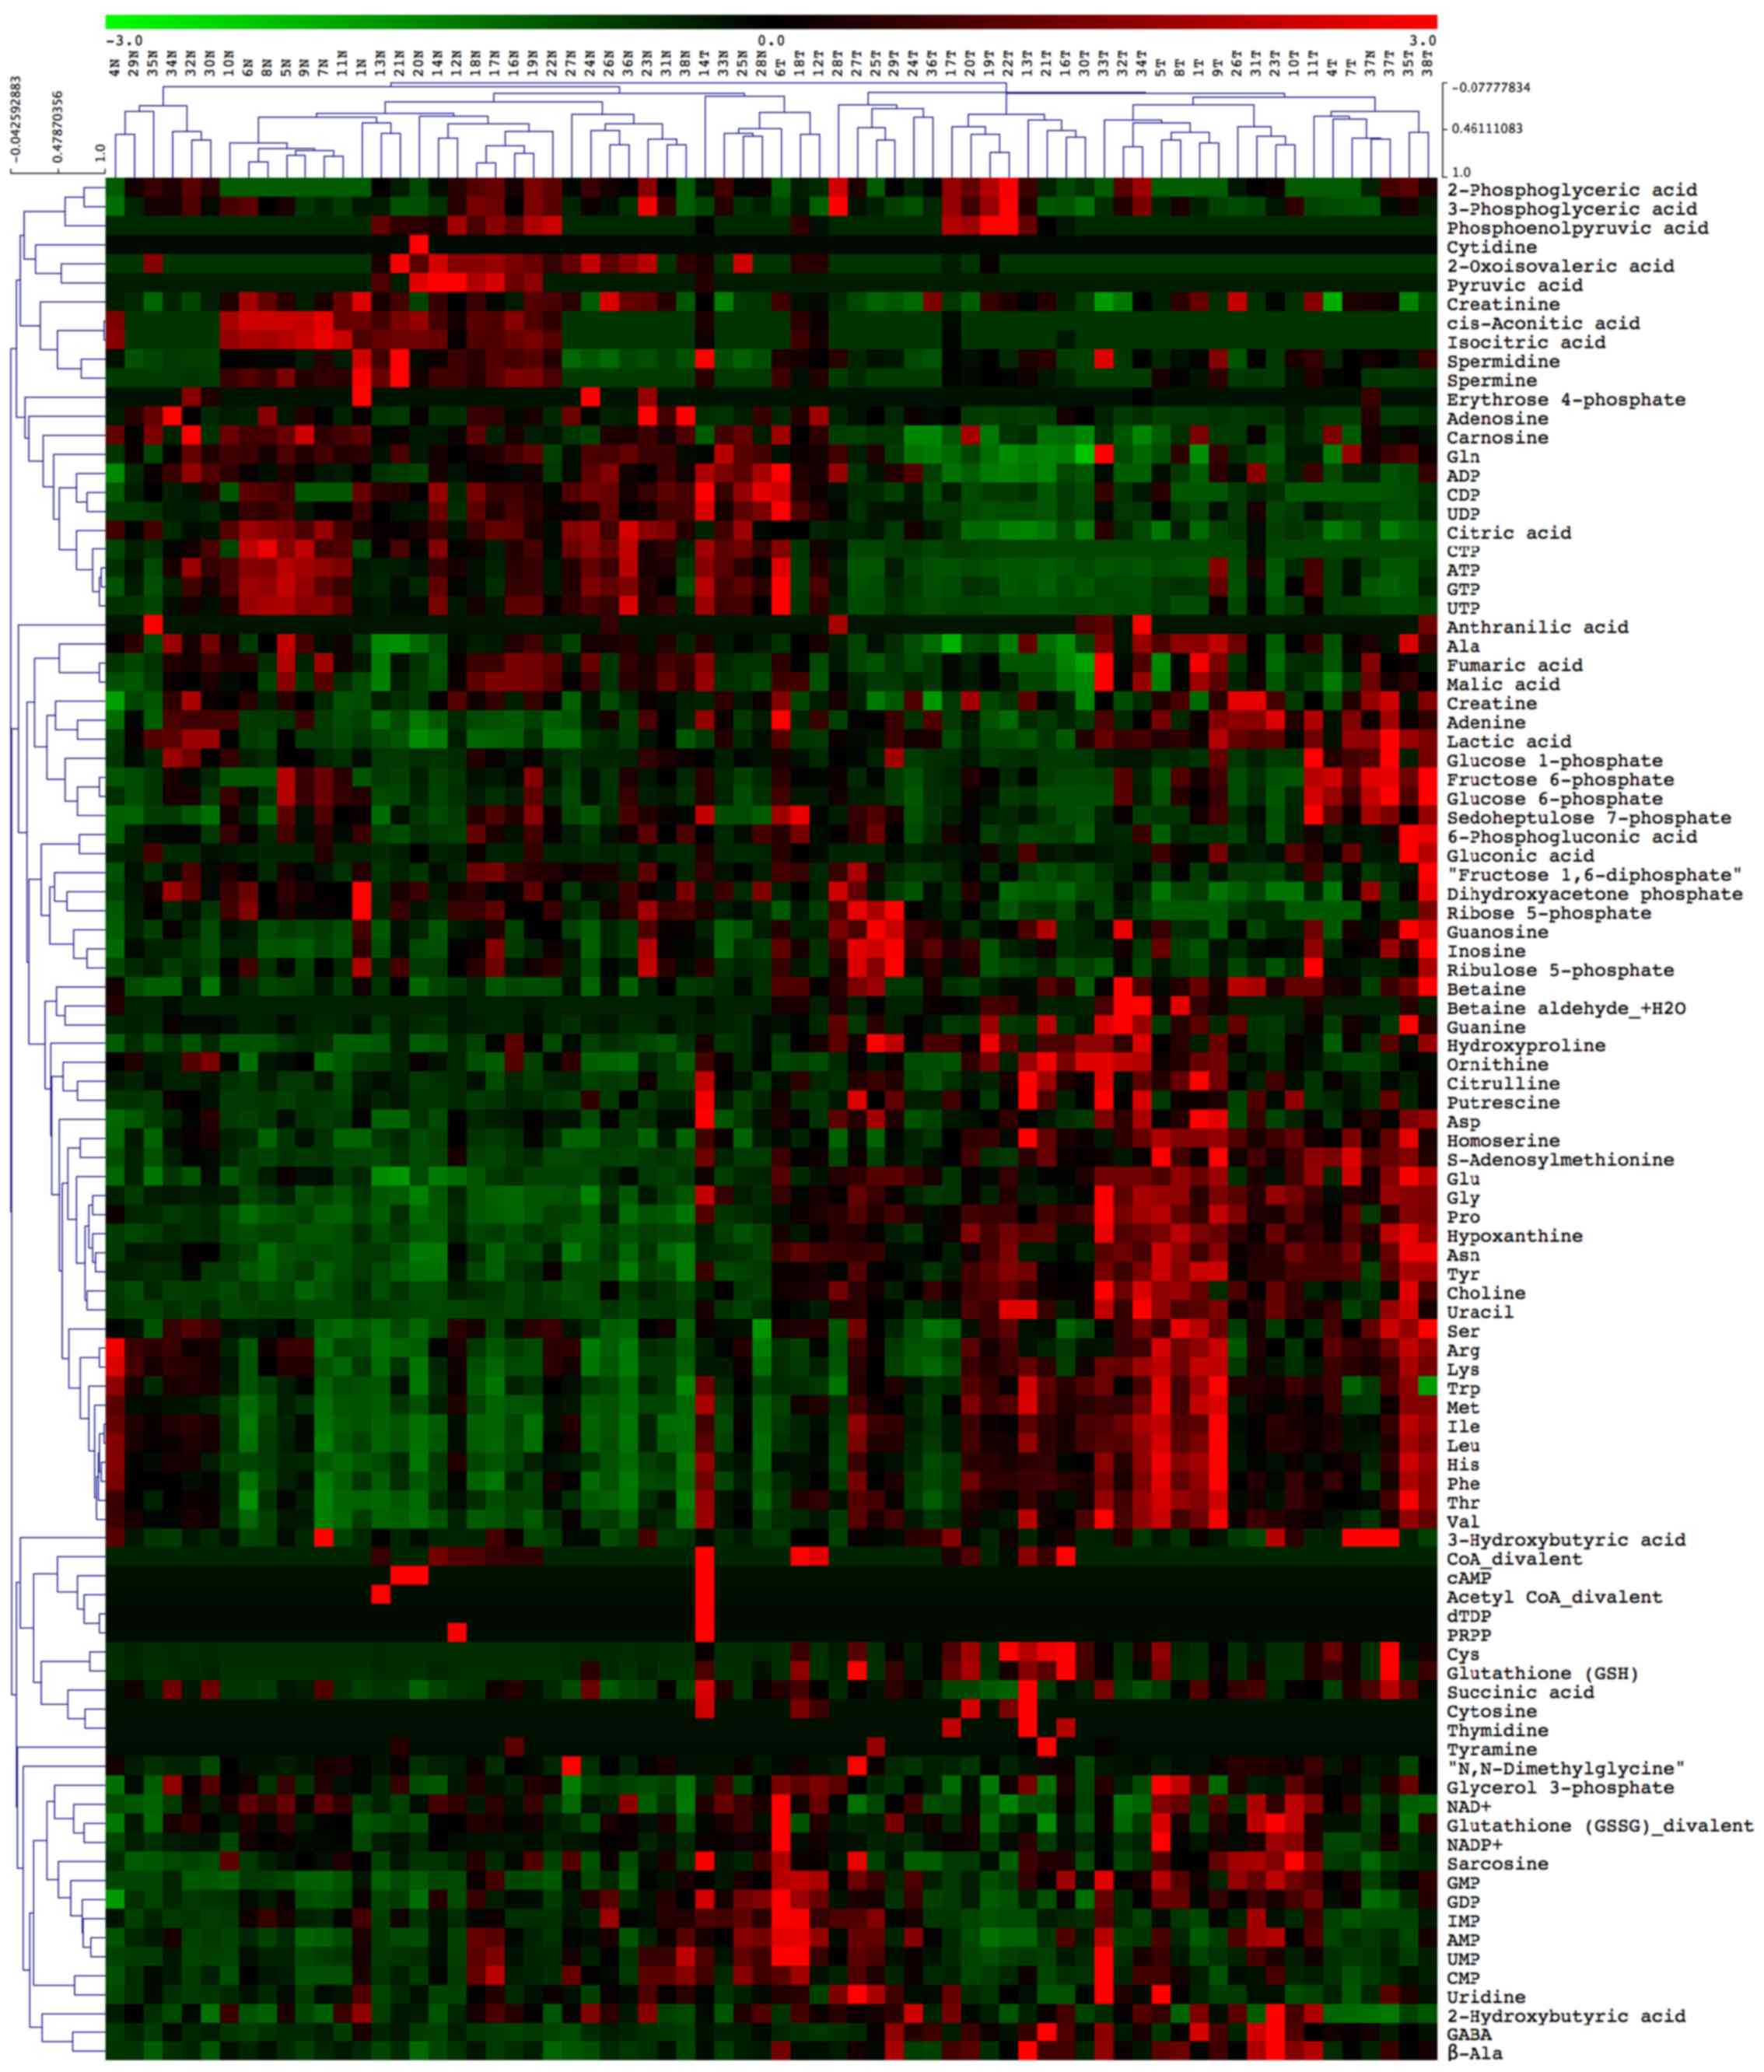
The metabolome data were normalized based on their
z-values and used for PCA and HCA. The PCA plot presented in
Fig. 1 shows a clear separation
between NTs and Ts along the PC1 axis, indicating an apparently
different metabolomic profile between NTs and Ts. The PCA plot also
indicates a higher heterogeneity in the metabolomic profiles of Ts
than of NTs. According to the HCA presented in Fig. 2, approximately two thirds of all
the measured metabolites were higher in Ts than in NTs.
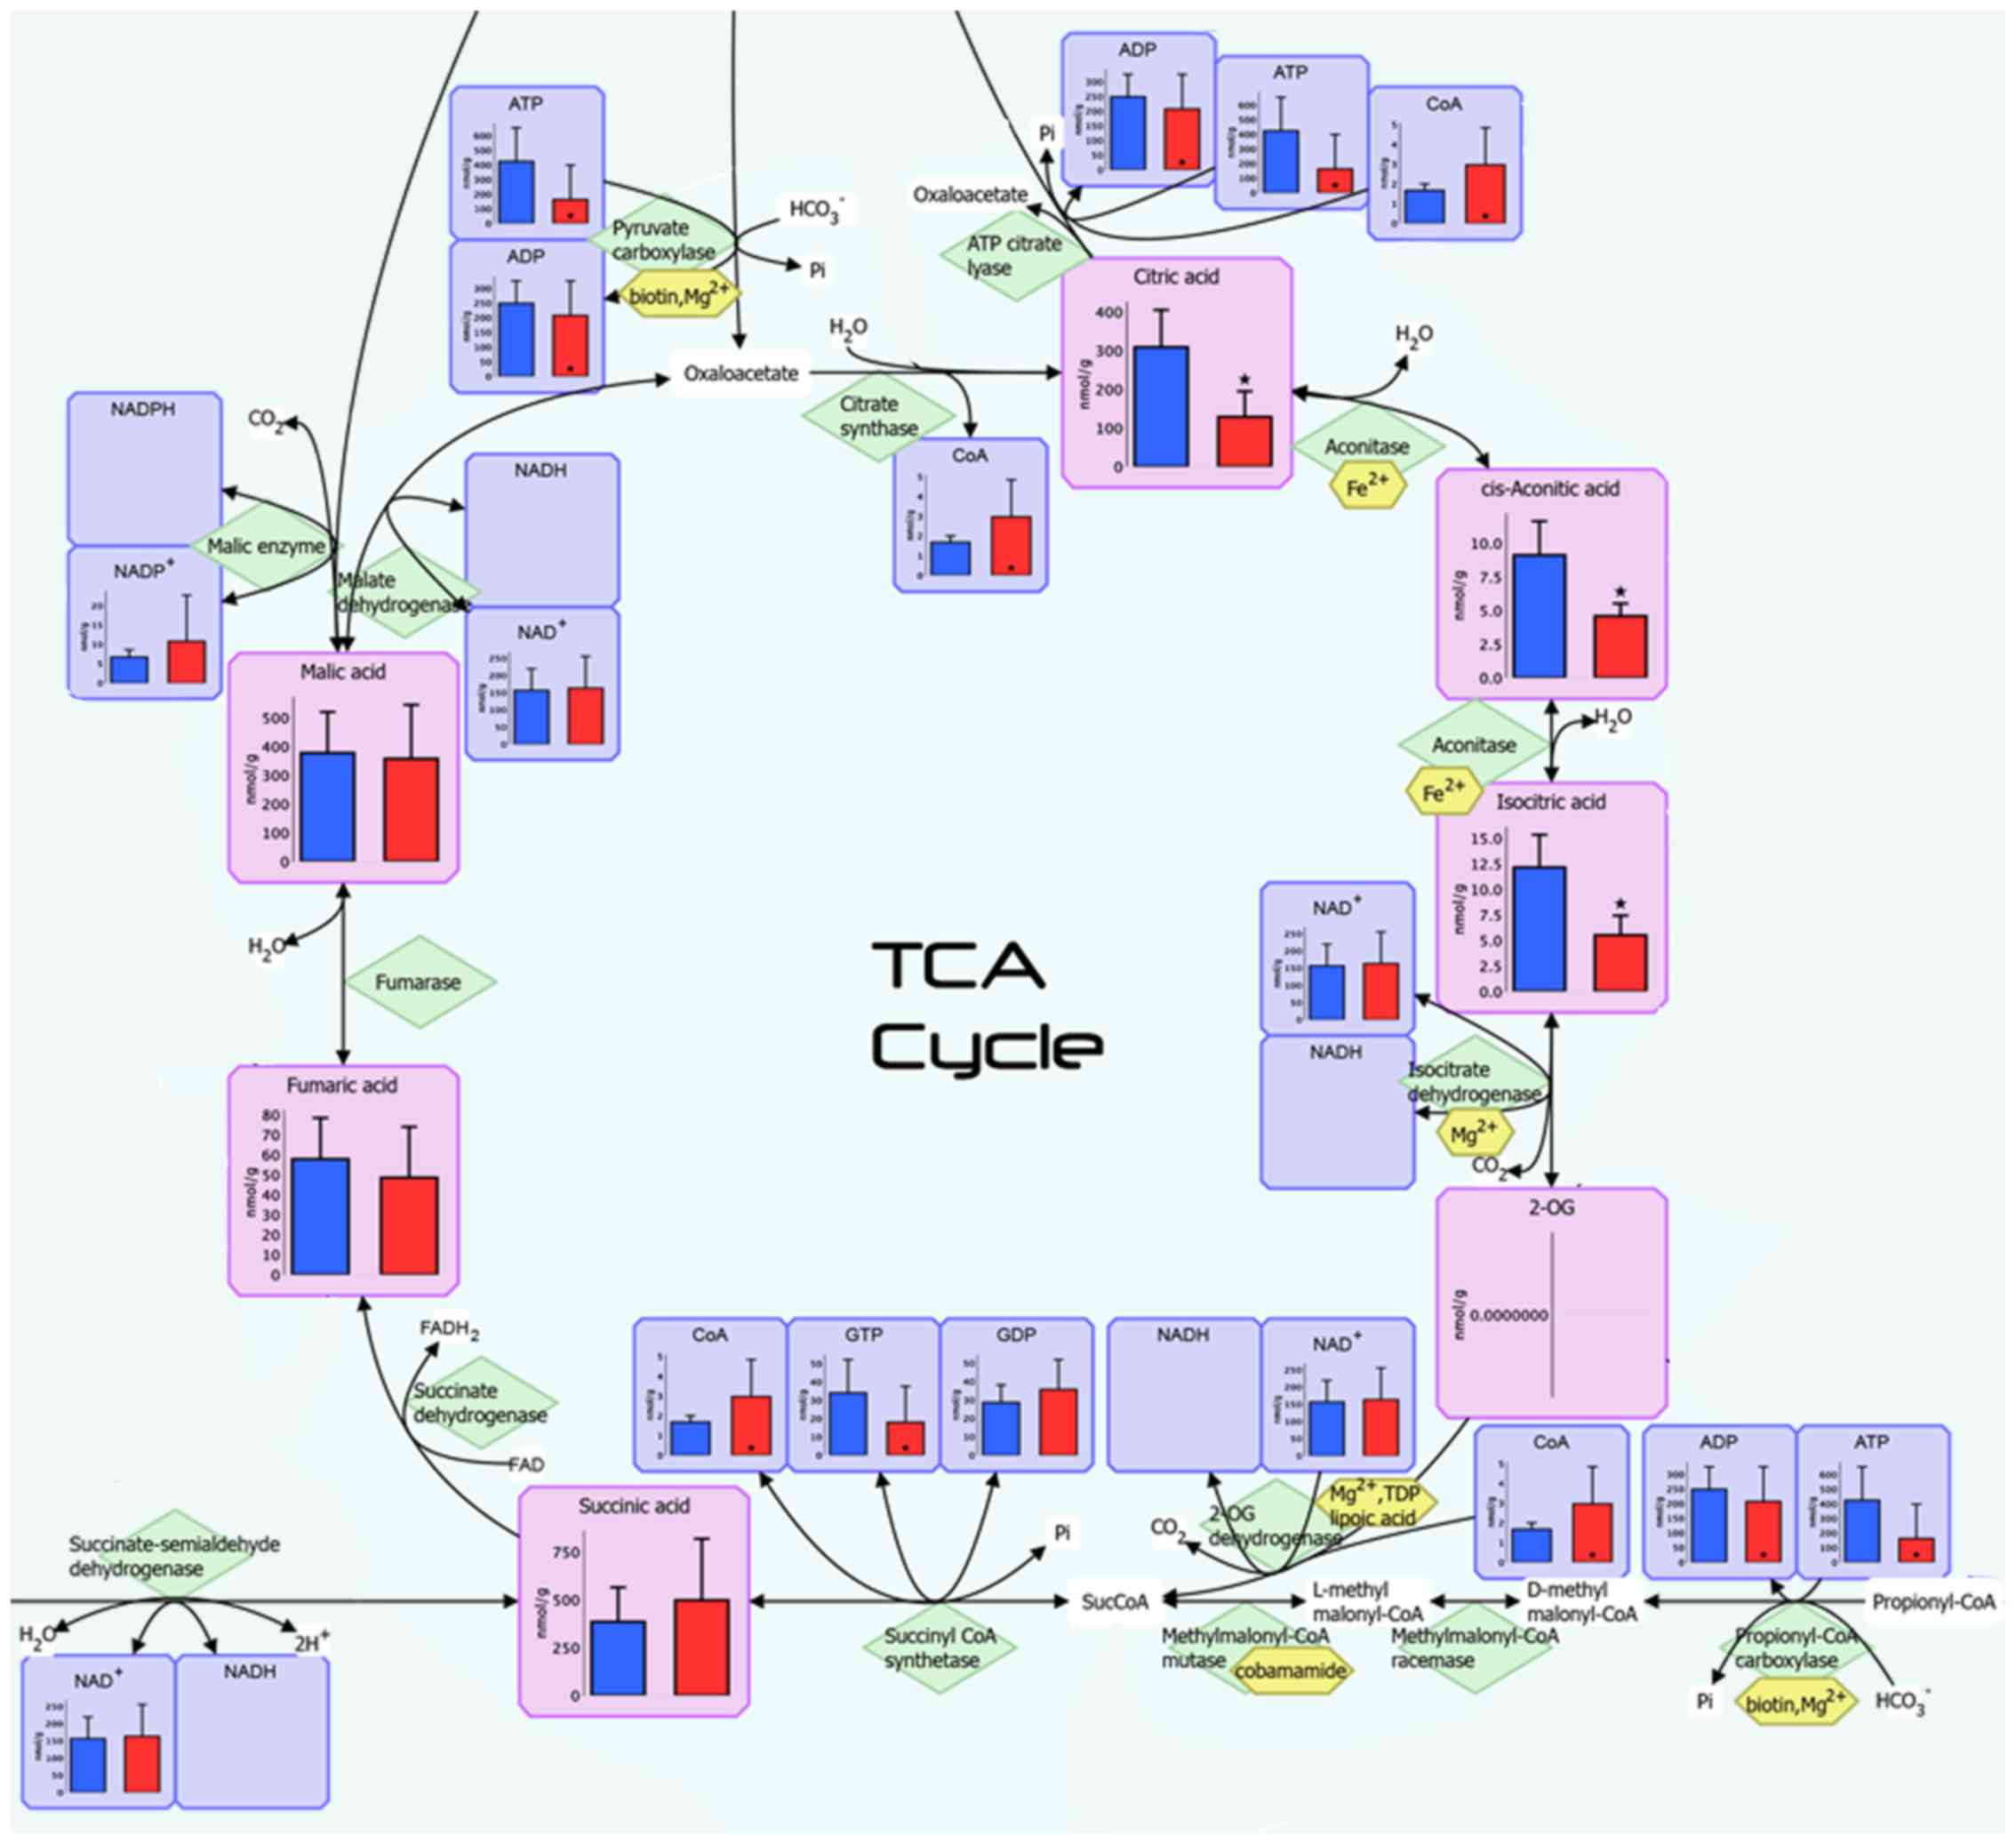
Metabolites measured in the present analysis were
visualized on a metabolome-wide pathway map (available upon
requested), and Fig. 3 illustrates
the pathway map of the tricarboxylic acid (TCA) cycle. A total of
110 compounds were measured, and 99 compounds were absolutely
quantified in this study (Table
II). Of these, the concentrations of as many as 58 compounds
were statistically significantly different between Ts and NTs
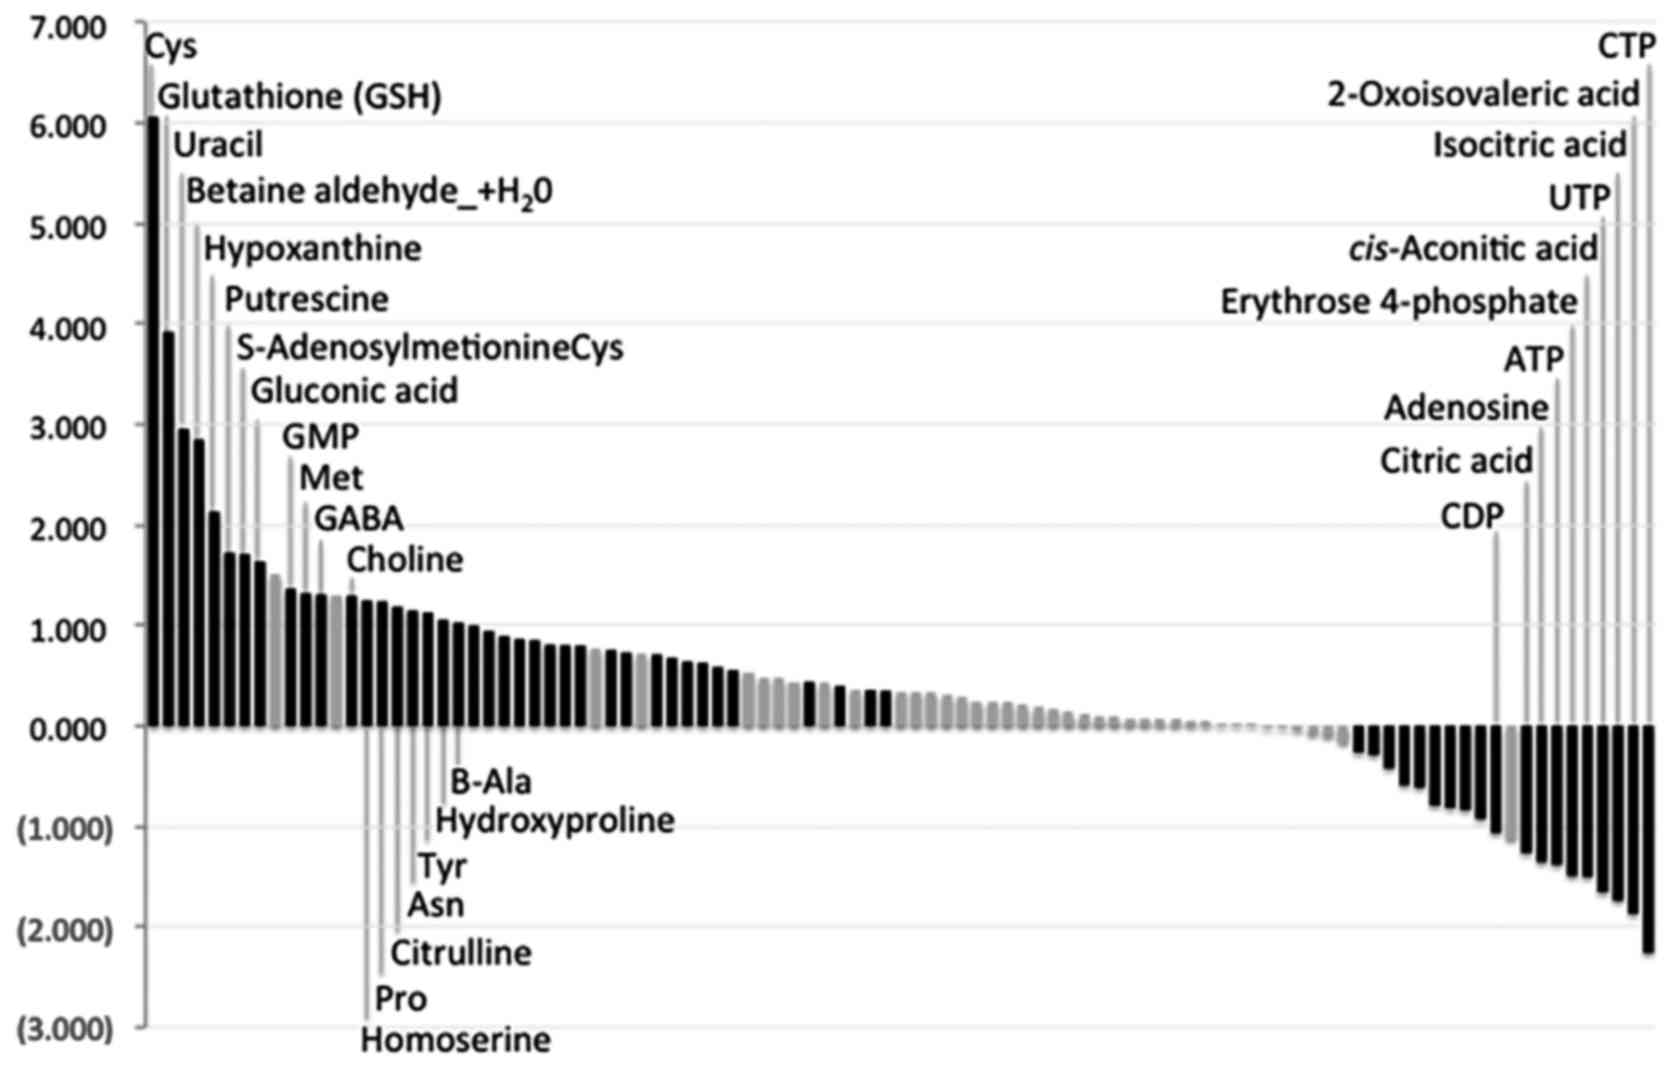
(P<0.05). Fig. 4 and Table II illustrate all the measured
metabolites in this study listed in descending order and based on
Ts/NTs ratios. The concentrations of most amino acids apart from
glutamine were significantly higher in Ts than in NTs (Fig. 5). In addition, as shown in Table II, the levels of nucleoside
triphosphates [adenosine triphosphate (ATP), cytidine triphosphate
(CTP), guanosine-5′-triphosphate (GTP) and uridine-5′-triphosphate
(UTP)] were statistically significantly lower in Ts, whereas those
of nucleoside monophosphates, such as guanosine monophosphate (GMP)
were much higher. The concentrations of isocitric acid,
cis-aconitic acid and citric acid, which are the upstream
TCA cycle intermediates, were significantly lower in Ts than in
NTs, while the lactic acid level was significantly higher in
Ts.
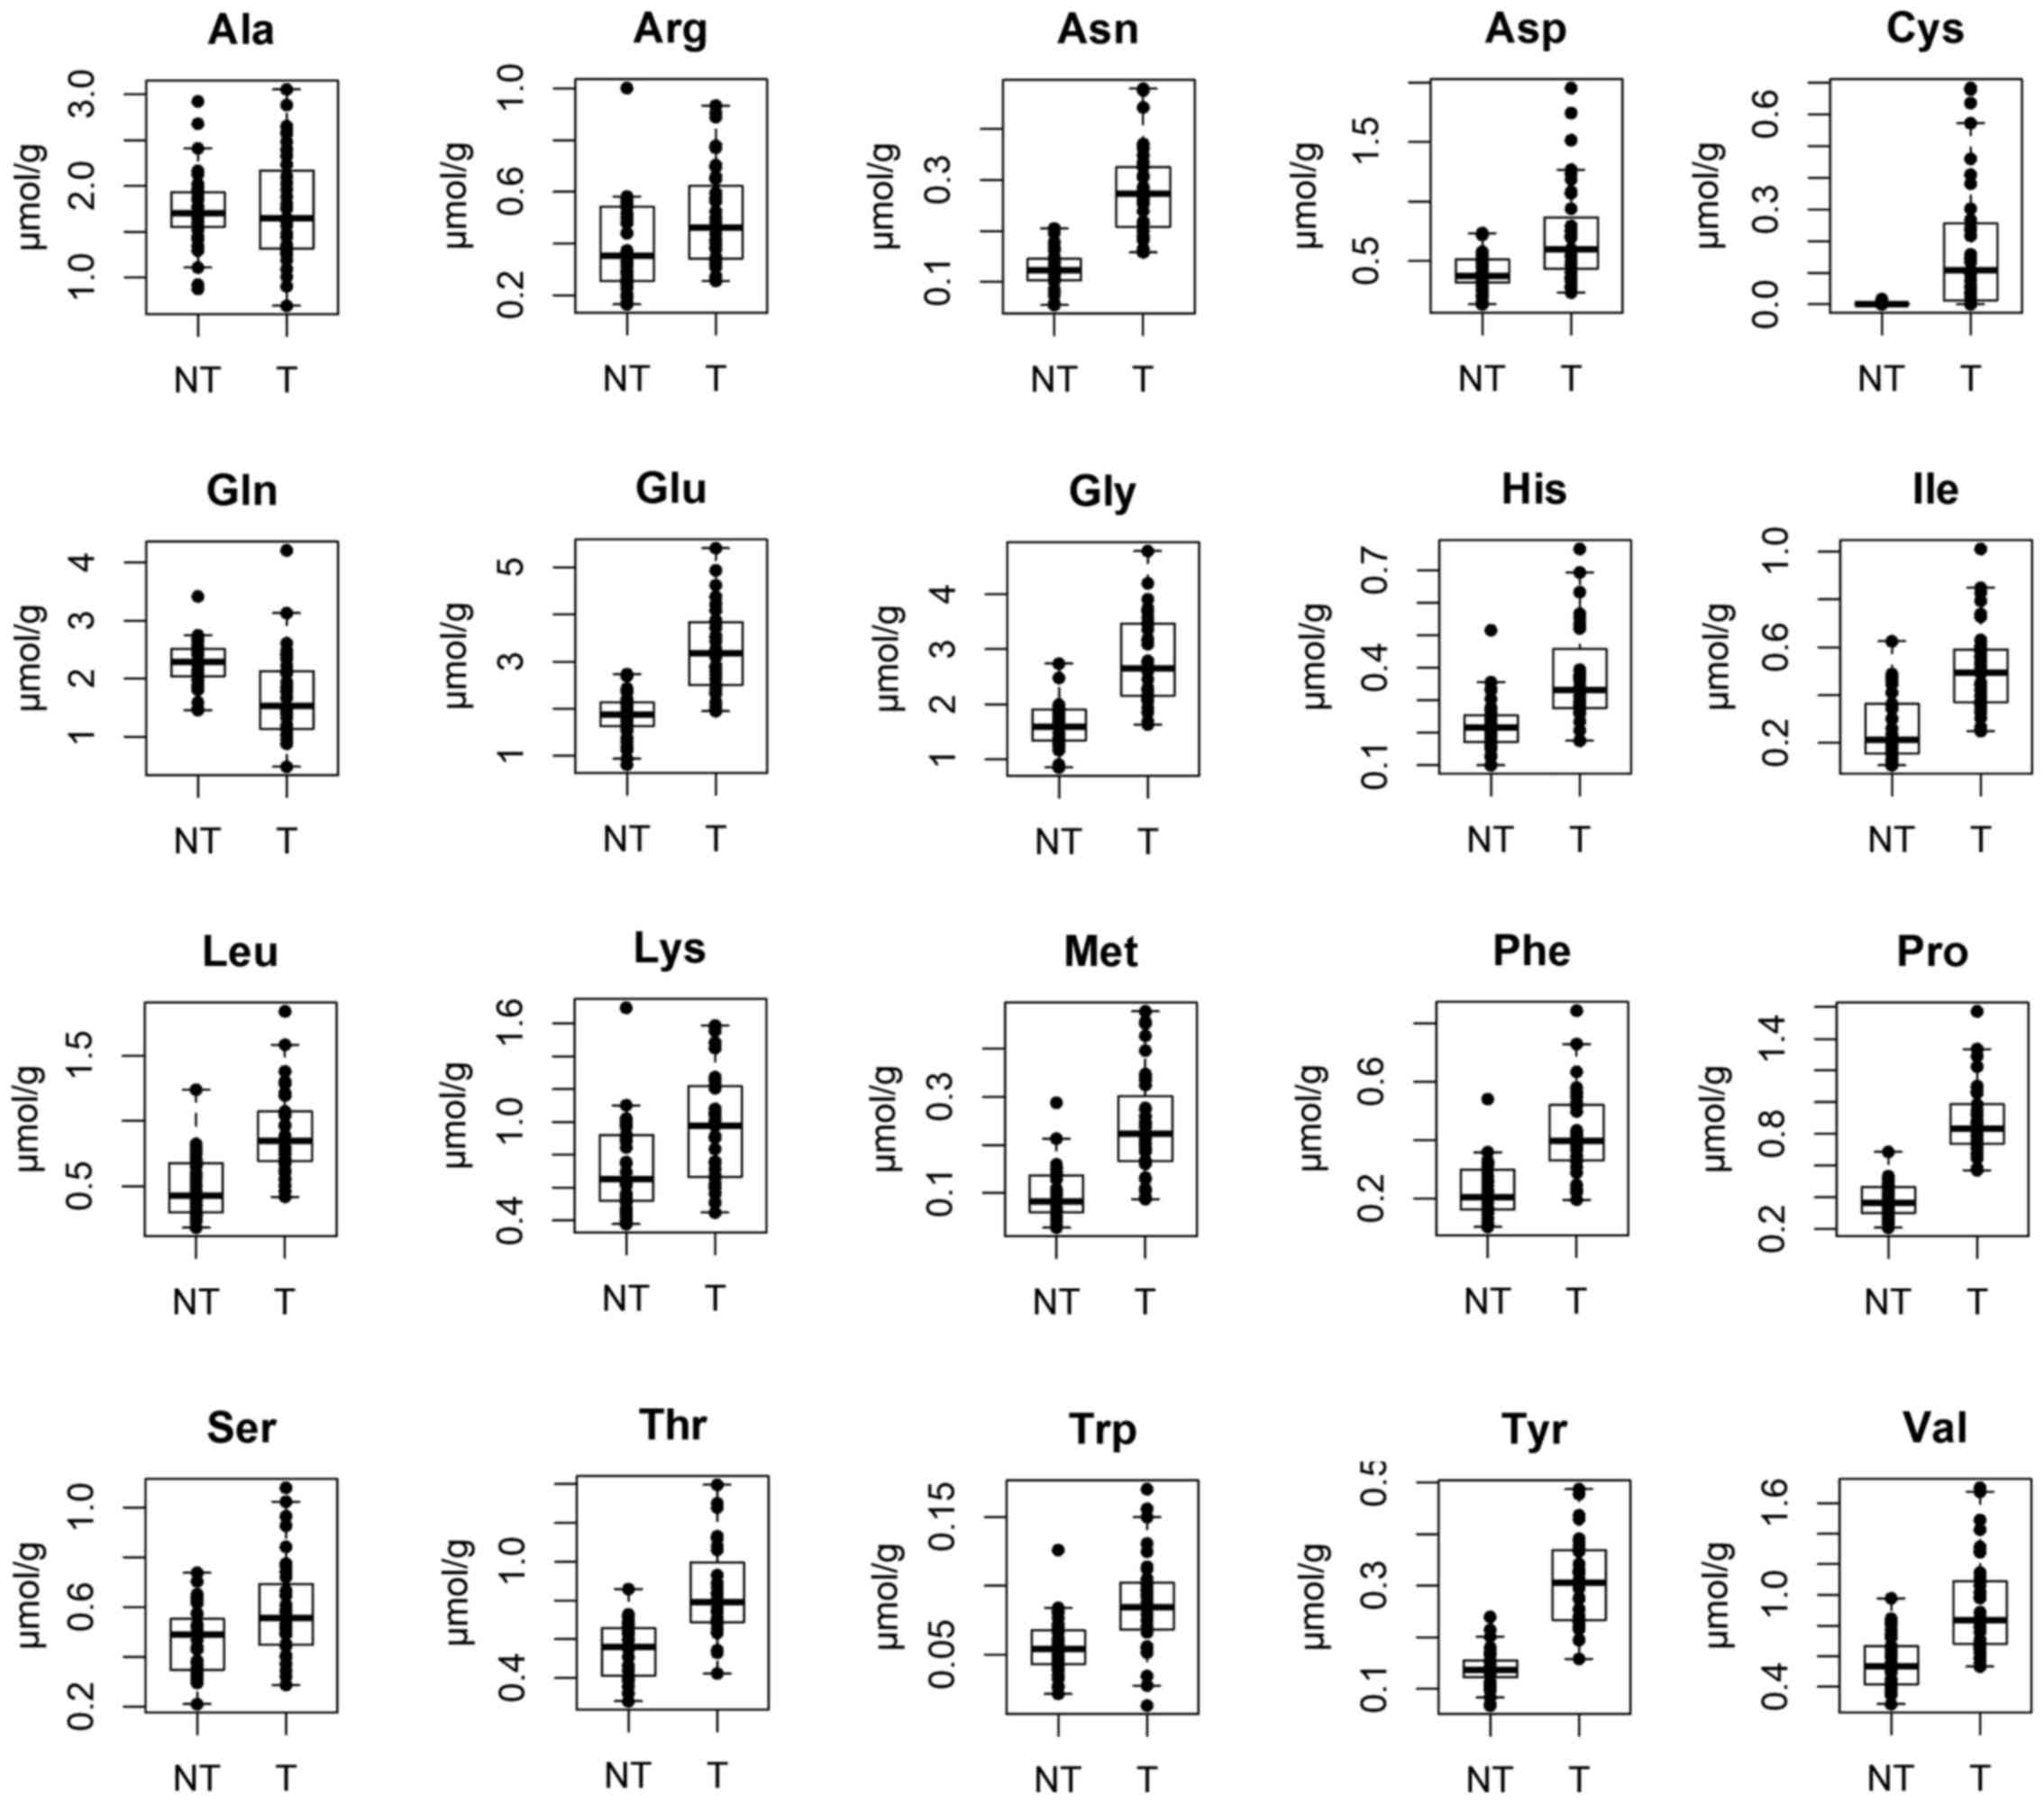 | Figure 5Concentrations of amino acids between
tumor tissue (Ts) and non-tumor esophageal tissues (NTs). Ala,
alanine; Arg, arginine; Asn, asparagine; Asp, aspartic acid; Cys,
cysteine; Gln, glutamine; Glu, glutamic acid; Gly, glycine; His,
histidine; Ile, isoleucine; Leu, leucine; Lys, lysine; Met,
methionine; Phe, phenylalanine; Pro, proline; Ser, serine; Thr,
threonine; Trp, tryptophan; Tyr, tyrosine; Val, valine. |
| Table IIConcentrations of compounds (listed
in descending order based on Ts/NTs ratios) in Ts and NTs. |
Table II
Concentrations of compounds (listed
in descending order based on Ts/NTs ratios) in Ts and NTs.
| Name of
compound | NTs | Ts | Ratio (Ts/NTs) | P-value | ND/all (70) | ND/NTs (35) | ND/Ts (35) |
| 2-Oxoglutaric
acid | 0.000 | 0.000 | NA | NA | 70 | 35 | 35 |
| cGMP | 0.000 | 0.000 | NA | NA | 70 | 35 | 35 |
| dATP | 0.000 | 0.000 | NA | NA | 70 | 35 | 35 |
| dCTP | 0.000 | 0.000 | NA | NA | 70 | 35 | 35 |
| dTMP | 0.000 | 0.000 | NA | NA | 70 | 35 | 35 |
| dTTP | 0.000 | 0.000 | NA | NA | 70 | 35 | 35 |
| Glyceraldehyde
3-phosphate | 0.000 | 0.000 | NA | NA | 70 | 35 | 35 |
| Glycolic acid | 0.000 | 0.000 | NA | NA | 70 | 35 | 35 |
| Glyoxylic acid | 0.000 | 0.000 | NA | NA | 70 | 35 | 35 |
| Malonyl
CoA_divalent | 0.000 | 0.000 | NA | NA | 70 | 35 | 35 |
| Thymine | 0.000 | 0.000 | NA | NA | 70 | 35 | 35 |
| Cys | 2.737 | 182.622 | 66.72 | <0.001 | 19 | 16 | 3 |
| Glutathione
(GSH) | 55.380 | 839.397 | 15.16 | <0.001 | 13 | 10 | 3 |
| Uracil | 21.761 | 168.667 | 7.75 | <0.001 | 1 | 1 | 0 |
| Betaine
aldehyde_+H2O | 0.094 | 0.674 | 7.20 | <0.001 | 45 | 31 | 14 |
| Hypoxanthine | 170.444 | 746.527 | 4.38 | <0.001 | 0 | 0 | 0 |
|
S-Adenosylmethionine | 12.254 | 40.406 | 3.30 | <0.001 | 0 | 0 | 0 |
| Putrescine | 36.506 | 119.342 | 3.27 | <0.001 | 0 | 0 | 0 |
| Gluconic acid | 28.168 | 87.567 | 3.11 | <0.001 | 0 | 0 | 0 |
| Guanine | 15.205 | 43.218 | 2.84 | 0.226 | 2 | 0 | 2 |
| GMP | 29.556 | 76.026 | 2.57 | <0.001 | 0 | 0 | 0 |
| Met | 97.882 | 243.854 | 2.49 | <0.001 | 0 | 0 | 0 |
| GABA | 12.250 | 30.295 | 2.47 | <0.001 | 0 | 0 | 0 |
| Tyramine | 0.166 | 0.408 | 2.46 | 0.404 | 64 | 33 | 31 |
| Choline | 161.699 | 395.925 | 2.45 | <0.001 | 0 | 0 | 0 |
| Homoserine | 0.843 | 2.001 | 2.37 | <0.001 | 12 | 10 | 2 |
| Pro | 377.514 | 890.493 | 2.36 | <0.001 | 0 | 0 | 0 |
| Citrulline | 30.403 | 69.160 | 2.27 | <0.001 | 0 | 0 | 0 |
| Asn | 124.410 | 275.376 | 2.21 | <0.001 | 0 | 0 | 0 |
| Tyr | 140.516 | 307.546 | 2.19 | <0.001 | 0 | 0 | 0 |
| Hydroxyproline | 28.391 | 58.942 | 2.08 | <0.001 | 0 | 0 | 0 |
| β-Ala | 36.973 | 75.260 | 2.04 | <0.001 | 0 | 0 | 0 |
| Betaine | 47.056 | 94.012 | 2.00 | <0.001 | 0 | 0 | 0 |
| Ile | 265.350 | 510.584 | 1.92 | <0.001 | 0 | 0 | 0 |
| Leu | 492.049 | 914.861 | 1.86 | <0.001 | 0 | 0 | 0 |
| Phe | 229.967 | 418.200 | 1.82 | <0.001 | 0 | 0 | 0 |
| Asp | 403.697 | 729.062 | 1.81 | <0.001 | 0 | 0 | 0 |
| Guanosine | 16.504 | 28.872 | 1.75 | 0.001 | 0 | 0 | 0 |
| Gly | 1615.687 | 2817.176 | 1.74 | <0.001 | 0 | 0 | 0 |
| Glu | 1862.762 | 3242.047 | 1.74 | <0.001 | 0 | 0 | 0 |
| CoA_divalent | 0.575 | 0.984 | 1.71 | 0.463 | 54 | 28 | 26 |
| His | 222.272 | 375.296 | 1.69 | <0.001 | 0 | 0 | 0 |
| Val | 564.942 | 937.011 | 1.66 | <0.001 | 0 | 0 | 0 |
|
NADP+ | 6.226 | 10.256 | 1.65 | 0.142 | 5 | 3 | 2 |
| Inosine | 118.058 | 193.143 | 1.64 | <0.001 | 0 | 0 | 0 |
| Adenine | 0.945 | 1.510 | 1.60 | <0.001 | 0 | 0 | 0 |
| Thr | 540.238 | 841.303 | 1.56 | <0.001 | 0 | 0 | 0 |
| Trp | 56.496 | 87.291 | 1.55 | <0.001 | 0 | 0 | 0 |
| Cytosine | 0.075 | 0.113 | 1.50 | 0.011 | 64 | 35 | 29 |
| Ornithine | 102.318 | 150.059 | 1.47 | 0.010 | 0 | 0 | 0 |
| Uridine | 50.310 | 72.303 | 1.44 | 0.108 | 0 | 0 | 0 |
| AMP | 234.908 | 327.723 | 1.40 | 0.170 | 0 | 0 | 0 |
| Sarcosine | 11.929 | 16.584 | 1.39 | 0.091 | 0 | 0 | 0 |
| Fructose
6-phosphate | 13.418 | 18.209 | 1.36 | 0.196 | 7 | 5 | 2 |
| Lactic acid | 30047.277 | 40727.323 | 1.36 | 0.001 | 0 | 0 | 0 |
| UMP | 39.626 | 53.320 | 1.35 | 0.320 | 0 | 0 | 0 |
| Lys | 728.484 | 958.409 | 1.32 | 0.002 | 0 | 0 | 0 |
| Succinic acid | 385.179 | 497.439 | 1.29 | 0.140 | 0 | 0 | 0 |
| Arg | 396.418 | 507.514 | 1.28 | 0.010 | 0 | 0 | 0 |
| GDP | 28.004 | 35.686 | 1.27 | 0.036 | 1 | 1 | 0 |
| Glycerol
3-phosphate | 211.332 | 268.640 | 1.27 | 0.054 | 0 | 0 | 0 |
| Sedoheptulose
7-phosphate | 19.238 | 24.436 | 1.27 | 0.095 | 0 | 0 | 0 |
| Ser | 467.826 | 590.577 | 1.26 | 0.077 | 0 | 0 | 0 |
| 3-Hydroxybutyric
acid | 287.678 | 355.980 | 1.24 | 0.051 | 0 | 0 | 0 |
| Glucose
1-phosphate | 25.489 | 31.150 | 1.22 | 0.362 | 0 | 0 | 0 |
| IMP | 31.863 | 37.742 | 1.18 | 0.506 | 1 | 0 | 1 |
| Glutathione
(GSSG)_divalent | 560.285 | 663.095 | 1.18 | 0.674 | 0 | 0 | 0 |
| Glucose
6-phosphate | 84.783 | 99.749 | 1.18 | 0.870 | 0 | 0 | 0 |
| Thymidine | 1.100 | 1.273 | 1.16 | 0.082 | 67 | 35 | 32 |
| CMP | 10.600 | 12.012 | 1.13 | 0.664 | 7 | 5 | 2 |
| 2-Hydroxybutyric
acid | 115.702 | 130.960 | 1.13 | 0.344 | 0 | 0 | 0 |
| Ribulose
5-phosphate | 33.894 | 37.243 | 1.10 | 0.753 | 0 | 0 | 0 |
| Spermidine | 17.565 | 18.966 | 1.08 | 0.326 | 0 | 0 | 0 |
| Creatine | 1608.615 | 1719.858 | 1.07 | 0.907 | 0 | 0 | 0 |
| Anthranilic
acid | 0.233 | 0.249 | 1.07 | 0.241 | 63 | 33 | 30 |
| 6-Phosphogluconic
acid | 15.030 | 15.899 | 1.06 | 0.318 | 3 | 1 | 2 |
| 2-Phosphoglyceric
acid | 8.473 | 8.918 | 1.05 | 0.812 | 21 | 10 | 11 |
|
N,N-Dimethylglycine | 3.640 | 3.802 | 1.04 | 0.398 | 3 | 1 | 2 |
| PRPP | 1.423 | 1.486 | 1.04 | 1.000 | 68 | 34 | 34 |
|
NAD+ | 156.517 | 163.076 | 1.04 | 0.815 | 0 | 0 | 0 |
| dTDP | 0.656 | 0.675 | 1.03 | 0.331 | 69 | 35 | 34 |
| Phosphoenolpyruvic
acid | 4.217 | 4.285 | 1.02 | 0.947 | 50 | 25 | 25 |
| Ala | 1740.699 | 1756.570 | 1.01 | 0.788 | 0 | 0 | 0 |
| Acetyl
CoA_divalent | 0.411 | 0.414 | 1.01 | 1.000 | 68 | 34 | 34 |
| cAMP | 0.425 | 0.422 | 0.99 | 0.592 | 67 | 33 | 34 |
| Fructose
1,6-diphosphate | 66.853 | 66.265 | 0.99 | 0.072 | 1 | 1 | 0 |
| Cytidine | 3.452 | 3.356 | 0.97 | 0.331 | 69 | 34 | 35 |
| Malic acid | 377.443 | 357.165 | 0.95 | 0.362 | 0 | 0 | 0 |
| 3-Phosphoglyceric
acid | 74.824 | 69.761 | 0.93 | 0.247 | 0 | 0 | 0 |
| Creatinine | 57.646 | 51.442 | 0.89 | 0.051 | 0 | 0 | 0 |
| ADP | 248.784 | 207.315 | 0.83 | 0.011 | 0 | 0 | 0 |
| Fumaric acid | 57.785 | 47.315 | 0.82 | 0.019 | 1 | 0 | 1 |
| Gln | 2277.779 | 1703.272 | 0.75 | <0.001 | 0 | 0 | 0 |
| Ribose
5-phosphate | 11.736 | 7.814 | 0.67 | <0.001 | 11 | 1 | 10 |
| UDP | 42.200 | 27.604 | 0.65 | <0.001 | 0 | 0 | 0 |
| Carnosine | 2.419 | 1.397 | 0.58 | <0.001 | 4 | 0 | 4 |
| Dihydroxyacetone
phosphate | 28.798 | 16.384 | 0.57 | <0.001 | 5 | 0 | 5 |
| Pyruvic acid | 24.610 | 13.810 | 0.56 | 0.011 | 61 | 27 | 34 |
| GTP | 34.037 | 17.962 | 0.53 | <0.001 | 0 | 0 | 0 |
| CDP | 7.051 | 3.378 | 0.48 | <0.001 | 14 | 6 | 8 |
| Spermine | 10.261 | 4.708 | 0.46 | 0.151 | 19 | 10 | 9 |
| Citric acid | 308.711 | 128.575 | 0.42 | <0.001 | 0 | 0 | 0 |
| Adenosine | 8.060 | 3.157 | 0.39 | <0.001 | 0 | 0 | 0 |
| ATP | 424.260 | 162.969 | 0.38 | <0.001 | 0 | 0 | 0 |
| Erythrose
4-phosphate | 5.064 | 1.801 | 0.36 | 0.042 | 63 | 29 | 34 |
| cis-Aconitic
acid | 5.724 | 2.025 | 0.35 | <0.001 | 47 | 16 | 31 |
| UTP | 77.543 | 24.624 | 0.32 | <0.001 | 3 | 0 | 3 |
| Isocitric acid | 7.347 | 2.204 | 0.30 | <0.001 | 46 | 16 | 30 |
| 2-Oxoisovaleric
acid | 5.466 | 1.498 | 0.27 | <0.001 | 47 | 17 | 30 |
| CTP | 14.088 | 2.946 | 0.21 | <0.001 | 28 | 4 | 24 |
Metabolomics with pathological tumor
depth (pT) and pathological nodal status (pN) relevance
Tumor depth is known to be associated with the
expression levels of glucose transporter (21) and several glycolytic enzymes, such
as hexokinase 2 (22) and pyruvate
kinase M2 (23). Thus, in this
study, the tumor concentrations of the quantified metabolites were
compared between pT1-2 and pT3-4 tumor tissues. Table III presents a list of metabolites
of which the concentrations were at least 1.5-fold higher (7
metabolites) or lower (21 metabolites) in pT3-4 than in pT1-2). The
concentrations of glycolytic and pentose phosphate pathway
intermediates were higher overall in subjects with advanced disease
(pT3-4), and the ratios of glucose 1-phosphate, ribose 5-phosphate
and ribulose 5-phosphate were 1.92, 1.58 and 1.56, respectively,
and >1.5-fold higher in pT3-4 than pT1 -2. By contrast, the
concentrations of malic acid and citric acid, also TCA cycle
intermediates, and most nucleotides were significantly lower in
pT3-4 than in pT1-2, possibly rationalizing relatively hypoxic
microenvironment of advanced tumor tissues (24). Moreover, adenine-, cytidine- and
uridine-nucleotide concentrations were lower in pT3-4 than in pT1-2
tumors, while the glutathione and cysteine levels were higher in
pT3-4 than in pT1-2, with ratios being 1.80 and 3.36, respectively
(Table III).
| Table IIIConcentrations of compounds in pT1-2
and pT3-4, and the pT3-4/pT1-2 ratio. |
Table III
Concentrations of compounds in pT1-2
and pT3-4, and the pT3-4/pT1-2 ratio.
| Compound name | pT1-2 | pT3-4 | Ratio
(pT3-4/pT1-2) | P-value |
|---|
| CTP | 7.968 | 1.459 | 0.18 | 0.022 |
| UTP | 60.532 | 13.984 | 0.23 | 0.651 |
| UDP | 63.988 | 16.823 | 0.26 | 0.088 |
| CDP | 7.582 | 2.133 | 0.28 | 0.030 |
| UMP | 110.416 | 36.403 | 0.33 | 0.010 |
| IMP | 76.817 | 26.164 | 0.34 | 0.046 |
| CMP | 23.980 | 8.466 | 0.35 | 0.007 |
| ATP | 290.826 | 125.085 | 0.43 | 0.406 |
| GTP | 29.731 | 14.475 | 0.49 | 0.143 |
| 2-Oxoisovaleric
acid | 2.399 | 1.231 | 0.51 | 0.033 |
| AMP | 517.276 | 271.559 | 0.52 | 0.019 |
| CoA_divalent | 1.549 | 0.817 | 0.53 | 0.818 |
|
NADP+ | 15.262 | 8.773 | 0.57 | 0.112 |
| GDP | 51.221 | 31.083 | 0.61 | 0.009 |
| Citric acid | 182.291 | 112.659 | 0.62 | 0.008 |
| Spermidine | 26.808 | 16.642 | 0.62 | 0.104 |
| Malic acid | 502.515 | 314.098 | 0.63 | 0.015 |
|
NAD+ | 228.540 | 143.680 | 0.63 | 0.034 |
| ADP | 288.720 | 183.195 | 0.63 | 0.104 |
| Sarcosine | 22.653 | 14.786 | 0.65 | 0.017 |
| Isocitric acid | 2.992 | 1.971 | 0.66 | 0.287 |
| Ribulose
5-phosphate | 26.049 | 40.560 | 1.56 | 0.143 |
| Ribose
5-phosphate | 5.390 | 8.532 | 1.58 | 0.858 |
| Guanosine | 18.390 | 31.977 | 1.74 | 0.042 |
| Glutathione
(GSH) | 520.187 | 933.978 | 1.80 | 0.356 |
| Glucose
1-phosphate | 18.228 | 34.979 | 1.92 | 0.923 |
| Tyramine | 0.146 | 0.486 | 3.33 | 0.972 |
| Cys | 64.742 | 217.549 | 3.36 | 0.103 |
Metastatic alterations seemingly affect the balance
of energy metabolism between glycolysis and oxidative
phosphorylation (25,26). Jin et al identified a series
of serum metabolites, such as valine and GABA that differ
significantly in patients with esophageal squamous cell carcinoma
with or without lymph node metastasis using a metabolomics approach
(27). In this study, we thus
investigated whether there was any metabolic difference in primary
tumor tissues with or without metastasis. Table IV lists the metabolites the
concentrations of which were at least 1.5-fold higher (2
metabolites) or lower (18 metabolites) in pN+ than in
pN−. N,N-dimethylglycine, isocitric acid,
fructose 1,6-diphosphate and aspartic acid were statistically
significantly lower in the pN+ than the pN−
tumor tissues. Of note, many nucleotide concentrations including
ATP, GTP, CTP and UTP tended to be lower in the pN+ than
pN− tumors, although the difference was not
statistically significant, with the exception of IMP and UMP.
| Table IVConcentrations of compounds in
pN− and pN+, and the
pN+/pN− ratio. |
Table IV
Concentrations of compounds in
pN− and pN+, and the
pN+/pN− ratio.
| Compound name | N− | N+ | Ratio
(N+/N−) | P-value |
|---|
| CoA_divalent | 2.094 | 0.656 | 0.31 | 0.201 |
|
N,N-Dimethylglycine | 6.492 | 3.004 | 0.46 | 0.010 |
| ATP | 268.010 | 131.845 | 0.49 | 0.630 |
| Glutathione
(GSH) | 1361.444 | 684.717 | 0.50 | 0.130 |
| IMP | 58.624 | 31.555 | 0.54 | 0.027 |
| UTP | 37.779 | 20.726 | 0.55 | 0.280 |
| CDP | 5.071 | 2.877 | 0.57 | 0.374 |
| Sedoheptulose
7-phosphate | 36.054 | 20.993 | 0.58 | 0.061 |
| UMP | 78.125 | 45.970 | 0.59 | 0.019 |
| Ribulose
5-phosphate | 54.332 | 32.180 | 0.59 | 0.286 |
| Isocitric acid | 3.199 | 1.909 | 0.60 | 0.039 |
| GTP | 25.892 | 15.612 | 0.60 | 0.428 |
| Fructose
1,6-diphosphate | 94.459 | 57.911 | 0.61 | 0.015 |
| Asp | 1030.898 | 639.629 | 0.62 | 0.041 |
| CTP | 4.155 | 2.588 | 0.62 | 0.830 |
| UDP | 38.597 | 24.347 | 0.63 | 0.056 |
| Ribose
5-phosphate | 10.923 | 6.893 | 0.63 | 0.538 |
| 2-Oxoisovaleric
acid | 2.042 | 1.337 | 0.65 | 0.287 |
| Guanine | 30.862 | 46.879 | 1.52 | 0.860 |
| Phosphoenolpyruvic
acid | 2.537 | 4.803 | 1.89 | 0.825 |
Discussion
Thus far, metabolomic differences between tumor and
non-tumor tissues have been investigated elsewhere in various types
of cancer (7,8,13,14).
The results of the present study not only demonstrated the basal
metabolomic differences between esophageal tumor and non-tumor
tissues, but also identified intriguing associations of metabolites
with the degree of tumor advancement and with the presence or
absence of lymph node metastasis.
Statistical significances between Ts and NTs were
found in 58 out of 110 compounds, including isocitric acid,
cis-aconitic acid, and citric acid, which were significantly
lower in Ts than NTs, and lactic acid, which was significantly
higher in Ts. These features suggest the upregulation of glycolysis
and lactate formation, and the downregulation of the flux into the
TCA cycle, and thus corroborate the hallmark of cancer metabolism
i.e., the Warburg effect (7,28).
In the present study, the tumor concentrations of
all amino acids apart from glutamine were higher than their
non-tumor counterparts. Amino acid synthesis may be globally
enhanced; however, this does not explain the significantly higher
concentrations of even essential amino acids. The data thus
possibly imply the hyperactivity of amino acid transporters
(29–31) or autophagic protein degradation
(32), both of which contribute to
the accumulation of overall amino acids in tumor tissues.
Glutamine, however, was the only amino acid that was lower in the
tumor than the non-tumor tissues. This is presumably due to
hyperactive glutamine breakdown, or glutaminolysis, for producing
energy and building blocks for continuous proliferation (33,34).
In fact, this trend of overall accumulations of amino acids apart
from glutamine in tumor regions has been reported elsewhere
(7,8,14);
accordingly, the near universality of this tumor amino acid profile
is intriguing, and the result is reported herein for the first time
(at least to the best of our knowledge) for an esophageal
tumor.
Few studies have investigated the association
between metabolomic characteristics and the pathological status of
tumor tissues. However, Wang et al reported 12 key
metabolites, such as glucose, AMP, NAD, formate, creatine and
choline metabolites that exhibited strong associations with the
advancement of esophageal cancer, and are thus likely to be
involved in both the carcinogenic process and metastatic alteration
of esophageal cancer (14). While
attempting to corroborate previous studies, we identified a novel
set of metabolites that show significant correlations with the
advancement of cancer, such as glycolytic and pentose phosphate
pathway intermediates (Table
III), taking advantage of CE-TOFMS-based metabolomics, which is
best suited to ionic metabolite analysis.
In contrast to glycolytic and pentose phosphate
pathway intermediates, the concentrations of citric acid, isocitric
acid and malic acid in pT3-4 disease were relatively lower than in
pT1-2 disease, suggesting the downregulation of TCA cycle activity
in advanced tumors. These results, i.e., a lower TCA cycle activity
and accelerated glycolysis, may be due to a more enhanced Warburg
effect in advanced-stage tumors compared with less advanced
ones.
A series of nucleotide concentrations were lower in
advanced than in less advanced tumors (Table III). Although higher levels of
nucleotide metabolites in the advanced tumors were expected, the
nucleotide pathway intermediates were mostly lower in the advanced
ones. This is possibly due to accelerated utilizations of these
nucleotides for their increased DNA synthesis. A lower adenosine
monophosphate level in advanced than in less advanced tumors has
also been previously reported (14). Total adenylate levels (ATP + ADP +
AMP) in pT3-4 (579.8 nmol/g tissue) was almost half of those in
pT1-2 (1096.8 nmol/g), again indicating a higher demand of
nucleotides in pT3-4 than in pT1-2 tumor tissues for their
increased DNA synthesis. The levels of glutathione and cysteine,
two primary anti-oxidants, were on average higher in pT3-4 than in
pT1-2, indicating a more reduced status and higher resistance
against oxidative stress in pT3-4.
Of note, in cases with pN+, both
glutathione and cysteine levels were lower than in cases with
pN−, with ratios being 0.50 (P=0.130) (Table IV) and 0.83, respectively,
translating to a lower resistance against oxidative stress in
pN+ (note that the ratio of cysteine is not shown in
Table IV). Generally, the tumor
microenvironment is in a highly oxidative state, and thus, tumor
cells tend to be more resistant to oxidative stress. Pavlides et
al (35) proposed that stromal
tissues rely primarily on glycolysis, producing lactate and
ketones, whereas metastatic cancer cells rather use oxidative
phosphorylation for energy production, availing the carbon sources
provided by the neighboring stromal tissues, and coined the term,
‘reverse Warburg effect’ (35,36).
In this perspective, proliferative tumor regions may contain more
cells that mainly use typical Warburg-type energy metabolism, which
presumably reduces oxidative stress assuming that oxidative
phosphorylation via electron transport chain is a primary source of
reactive oxygen species (ROS) (37). By contrast, metastatic tumor cells
are rich in mitochondria, producing higher concentrations of ROS,
and thus may develop a tumor microenvironment with higher oxidative
stress (25,26,36).
Taken together, the results thus reflect the basal metabolic
differences between advanced (but without metastatic) and
metastatic tumors.
The present study is limited to the elucidation of
the metabolic microenvironment of tissues with or without cancerous
cells and may not be suitable for discovery of a potential
biomarker for early detection of cancer, as our analysis was
performed using surgically resected specimens and not liquid
biopsies. Although not as comprehensive as our study, the
metabolomics of biopsy specimens are being realized (38–40).
Moreover, once we focus on some specific metabolite markers for
pathological tumor status and survival outcome, a minimal amount of
tissue, such as a biopsy specimen, may be sufficient for such
targeted analysis.
A limitation of this study is that the effects of
potential confounding factors affecting the metabolome
characteristics, such as the use of chemotherapy and each patient’s
nutritional status, could not be eliminated. Therefore, the
difference in metabolome characteristics between advanced and
less-advanced tumors might have been influenced by these
confounding factors. Due to the limited number of cases in this
study, it would be difficult to exclude the effects of all
potential confounding factors completely; however, these effects
should be clarified in future trials with sufficient numbers of
cases.
In conclusion, in this study, we demonstrated
significantly different metabolomic characteristics between tumor
and non-tumor tissues of esophageal cancer and identified a novel
set of metabolites that correlate well with the degree of tumor
advancement. This suggests that the pathological disease status and
survival outcome may be predicted by analysis of several primary
metabolites, possibly even from a biopsy specimen. Further
clarification of cancer metabolomics, particularly in relation to
the advancement of disease and survival outcome, will enable the
selection of more appropriate treatment strategies contributing to
individualized medicine.
Acknowledgments
The authors would like to thank Dr Tamaki Fujimori
and Ms. Aya Hoshi, HMT, for their data analysis support. The
authors used the English Language Service (International Medical
Information Center) for language editing.
Funding
This study was supported by the Japan Society for
the Promotion of Science (JSPS) KAKENHI (Grant no. JP26461998).
Availability of data and materials
The analyzed datasets generated during the study are
available from the corresponding author on reasonable request.
Ethics approval and consent to
participate
The Institutional Review board of Tokai University
(Isehara, Japan) approved the study protocol and all patients
provided written informed consent prior to obtaining the
samples.
Authors’ contributions
MTo, KK and SO conceived and designed the study;
MTo, KK, JO and AK were involved in data acquisition; KK and YO
were involved in data analysis; MTo, KK, SO, HM, MK and MTe were
involved in data interpretation. All authors have read and approval
the final manuscript.
Consent for publication
Not applicable.
Competing interests
The authors declare that they have no competing
interests.
References
|
1
|
Domper Arnal MJ, Ferrández Arenas Á and
Lanas Arbeloa Á: Esophageal cancer: Risk factors, screening and
endoscopic treatment in Western and Eastern countries. World J
Gastroenterol. 21:7933–7943. 2015. View Article : Google Scholar
|
|
2
|
Tachimori Y, Ozawa S, Numasaki H,
Fujishiro M, Matsubara H, Oyama T, Shinoda M, Toh Y, Udagawa H and
Uno T: Comprehensive Registry of Esophageal Cancer in Japan, 2008.
Esophagus. 12:130–157. 2015. View Article : Google Scholar
|
|
3
|
van Hagen P, Hulshof MC, van Lanschot JJ,
Steyerberg EW, van Berge Henegouwen MI, Wijnhoven BP, Richel DJ,
Nieuwenhuijzen GA, Hospers GA, Bonenkamp JJ, et al CROSS Group:
Preoperative chemoradiotherapy for esophageal or junctional cancer.
N Engl J Med. 366:2074–2084. 2012. View Article : Google Scholar
|
|
4
|
Ando N, Kato H, Igaki H, Shinoda M, Ozawa
S, Shimizu H, Nakamura T, Yabusaki H, Aoyama N, Kurita A, et al: A
randomized trial comparing postoperative adjuvant chemotherapy with
cisplatin and 5-fluorouracil versus preoperative chemotherapy for
localized advanced squamous cell carcinoma of the thoracic
esophagus (JCOG9907). Ann Surg Oncol. 19:68–74. 2012. View Article : Google Scholar
|
|
5
|
Abbassi-Ghadi N, Kumar S, Huang J, Goldin
R, Takats Z and Hanna GB: Metabolomic profiling of
oesophago-gastric cancer: A systematic review. Eur J Cancer.
49:3625–3637. 2013. View Article : Google Scholar
|
|
6
|
Pavlova NN and Thompson CB: The emerging
hallmarks of cancer metabolism. Cell Metab. 23:27–47. 2016.
View Article : Google Scholar
|
|
7
|
Kami K, Fujimori T, Sato H, Sato M,
Yamamoto H, Ohashi Y, Sugiyama N, Ishihama Y, Onozuka H, Ochiai A,
et al: Metabolomic profiling of lung and prostate tumor tissues by
capillary electrophoresis time-of-flight mass spectrometry.
Metabolomics. 9:444–453. 2013. View Article : Google Scholar
|
|
8
|
Hirayama A, Kami K, Sugimoto M, Sugawara
M, Toki N, Onozuka H, Kinoshita T, Saito N, Ochiai A, Tomita M, et
al: Quantitative metabolome profiling of colon and stomach cancer
microenvironment by capillary electrophoresis time-of-flight mass
spectrometry. Cancer Res. 69:4918–4925. 2009. View Article : Google Scholar
|
|
9
|
Ikeda A, Nishiumi S, Shinohara M, Yoshie
T, Hatano N, Okuno T, Bamba T, Fukusaki E, Takenawa T, Azuma T, et
al: Serum metabolomics as a novel diagnostic approach for
gastrointestinal cancer. Biomed Chromatogr. 26:548–558. 2012.
View Article : Google Scholar
|
|
10
|
Xu J, Chen Y, Zhang R, Song Y, Cao J, Bi
N, Wang J, He J, Bai J, Dong L, et al: Global and targeted
metabolomics of esophageal squamous cell carcinoma discovers
potential diagnostic and therapeutic biomarkers. Mol Cell
Proteomics. 12:1306–1318. 2013. View Article : Google Scholar
|
|
11
|
Zhang X, Xu L, Shen J, Cao B, Cheng T,
Zhao T, Liu X and Zhang H: Metabolic signatures of esophageal
cancer: NMR-based metabolomics and UHPLC-based focused metabolomics
of blood serum. Biochim Biophys Acta. 1832:1207–1216. 2013.
View Article : Google Scholar
|
|
12
|
Ma H, Hasim A, Mamtimin B, Kong B, Zhang
HP and Sheyhidin I: Plasma free amino acid profiling of esophageal
cancer using high-performance liquid chromatography spectroscopy.
World J Gastroenterol. 20:8653–8659. 2014. View Article : Google Scholar
|
|
13
|
Yang Y, Wang L, Wang S, Liang S, Chen A,
Tang H, Chen L and Deng F: Study of metabonomic profiles of human
esophageal carcinoma by use of high-resolution magic-angle spinning
1H NMR spectroscopy and multivariate data analysis. Anal Bioanal
Chem. 405:3381–3389. 2013. View Article : Google Scholar
|
|
14
|
Wang L, Chen J, Chen L, Deng P, Bu Q,
Xiang P, Li M, Lu W, Xu Y, Lin H, et al: 1H-NMR based metabonomic
profiling of human esophageal cancer tissue. Mol Cancer. 12:252013.
View Article : Google Scholar
|
|
15
|
Wu H, Xue R, Lu C, Deng C, Liu T, Zeng H,
Wang Q and Shen X: Metabolomic study for diagnostic model of
oesophageal cancer using gas chromatography/mass spectrometry. J
Chromatogr B Analyt Technol Biomed Life Sci. 877:3111–3117. 2009.
View Article : Google Scholar
|
|
16
|
The Japan Eshophageal Society: Japanese
Classification of Esophageal Cancer 11th edition. Esophagus. Nov
10–2016.Epub ahead of print.
|
|
17
|
Ohashi Y, Hirayama A, Ishikawa T, Nakamura
S, Shimizu K, Ueno Y, Tomita M and Soga T: Depiction of metabolome
changes in histidine-starved Escherichia coli by CE-TOFMS. Mol
Biosyst. 4:135–147. 2008. View
Article : Google Scholar
|
|
18
|
Ooga T, Sato H, Nagashima A, Sasaki K,
Tomita M, Soga T and Ohashi Y: Metabolomic anatomy of an animal
model revealing homeostatic imbalances in dyslipidaemia. Mol
Biosyst. 7:1217–1223. 2011. View Article : Google Scholar
|
|
19
|
Sugimoto M, Wong DT, Hirayama A, Soga T
and Tomita M: Capillary electrophoresis mass spectrometry-based
saliva metab-olomics identified oral, breast and pancreatic
cancer-specific profiles. Metabolomics. 6:78–95. 2010. View Article : Google Scholar
|
|
20
|
Junker BH, Klukas C and Schreiber F:
VANTED: A system for advanced data analysis and visualization in
the context of biological networks. BMC bioinformatics. 7:1092006.
View Article : Google Scholar
|
|
21
|
Kawamura T, Kusakabe T, Sugino T, Watanabe
K, Fukuda T, Nashimoto A, Honma K and Suzuki T: Expression of
glucose transporter-1 in human gastric carcinoma: Association with
tumor aggressiveness, metastasis, and patient survival. Cancer.
92:634–641. 2001. View Article : Google Scholar
|
|
22
|
Hamabe A, Yamamoto H, Konno M, Uemura M,
Nishimura J, Hata T, Takemasa I, Mizushima T, Nishida N, Kawamoto
K, et al: Combined evaluation of hexokinase 2 and phosphorylated
pyruvate dehydrogenase-E1α in invasive front lesions of colorectal
tumors predicts cancer metabolism and patient prognosis. Cancer
Sci. 105:1100–1108. 2014. View Article : Google Scholar
|
|
23
|
Fukuda S, Miyata H, Miyazaki Y, Makino T,
Takahashi T, Kurokawa Y, Yamasaki M, Nakajima K, Takiguchi S, Mori
M, et al: Pyruvate kinase M2 modulates esophageal squamous cell
carcinoma chemotherapy response by regulating the pentose phosphate
pathway. Ann Surg Oncol. 22(Suppl 3): S1461–S1468. 2015. View Article : Google Scholar
|
|
24
|
Hockel M, Schlenger K, Aral B, Mitze M,
Schaffer U and Vaupel P: Association between tumor hypoxia and
malignant progression in advanced cancer of the uterine cervix.
Cancer Res. 56:4509–4515. 1996.
|
|
25
|
Payen VL, Porporato PE, Baselet B and
Sonveaux P: Metabolic changes associated with tumor metastasis,
part 1: Tumor pH, glycolysis and the pentose phosphate pathway.
Cell Mol Life Sci. 73:1333–1348. 2016. View Article : Google Scholar
|
|
26
|
Porporato PE, Payen VL, Baselet B and
Sonveaux P: Metabolic changes associated with tumor metastasis,
part 2: Mitochondria, lipid and amino acid metabolism. Cell Mol
Life Sci. 73:1349–1363. 2016. View Article : Google Scholar
|
|
27
|
Jin H, Qiao F, Chen L, Lu C, Xu L and Gao
X: Serum metabolomic signatures of lymph node metastasis of
esophageal squamous cell carcinoma. J Proteome Res. 13:4091–4103.
2014. View Article : Google Scholar
|
|
28
|
Warburg O: On the origin of cancer cells.
Science. 123:309–314. 1956. View Article : Google Scholar
|
|
29
|
Honjo H, Kaira K, Miyazaki T, Yokobori T,
Kanai Y, Nagamori S, Oyama T, Asao T and Kuwano H:
Clinicopathological significance of LAT1 and ASCT2 in patients with
surgically resected esophageal squamous cell carcinoma. J Surg
Oncol. 113:381–389. 2016. View Article : Google Scholar
|
|
30
|
Kobayashi H, Ishii Y and Takayama T:
Expression of L-type amino acid transporter 1 (LAT1) in esophageal
carcinoma. J Surg Oncol. 90:233–238. 2005. View Article : Google Scholar
|
|
31
|
Younes M, Pathak M, Finnie D, Sifers RN,
Liu Y and Schwartz MR: Expression of the neutral amino acids
transporter ASCT1 in esophageal carcinomas. Anticancer Res.
20:3775–3779. 2000.
|
|
32
|
Morselli E, Galluzzi L, Kepp O, Vicencio
JM, Criollo A, Maiuri MC and Kroemer G: Anti- and pro-tumor
functions of autophagy. Biochim Biophys Acta. 1793:1524–1532. 2009.
View Article : Google Scholar
|
|
33
|
Vander Heiden MG, Cantley LC and Thompson
CB: Understanding the Warburg effect: The metabolic requirements of
cell proliferation. Science. 324:1029–1033. 2009. View Article : Google Scholar
|
|
34
|
Tsun ZY and Possemato R: Amino acid
management in cancer. Semin Cell Dev Biol. 43:22–32. 2015.
View Article : Google Scholar
|
|
35
|
Pavlides S, Whitaker-Menezes D,
Castello-Cros R, Flomenberg N, Witkiewicz AK, Frank PG, Casimiro
MC, Wang C, Fortina P, Addya S, et al: The reverse Warburg effect:
Aerobic glycolysis in cancer associated fibroblasts and the tumor
stroma. Cell Cycle. 8:3984–4001. 2009. View Article : Google Scholar
|
|
36
|
Sotgia F, Whitaker-Menezes D,
Martinez-Outschoorn UE, Flomenberg N, Birbe RC, Witkiewicz AK,
Howell A, Philp NJ, Pestell RG and Lisanti MP: Mitochondrial
metabolism in cancer metastasis: Visualizing tumor cell
mitochondria and the ‘reverse Warburg effect’ in positive lymph
node tissue. Cell Cycle. 11:1445–1454. 2012. View Article : Google Scholar
|
|
37
|
Orrenius S: Reactive oxygen species in
mitochondria-mediated cell death. Drug Metab Rev. 39:443–455. 2007.
View Article : Google Scholar
|
|
38
|
Benahmed MA, Elbayed K, Daubeuf F,
Santelmo N, Frossard N and Namer IJ: NMR HRMAS spectroscopy of lung
biopsy samples: Comparison study between human, pig, rat, and mouse
metabolomics. Magn Reson Med. 71:35–43. 2014. View Article : Google Scholar
|
|
39
|
Li M, Song Y, Cho N, Chang JM, Koo HR, Yi
A, Kim H, Park S and Moon WK: An HR-MAS MR metabolomics study on
breast tissues obtained with core needle biopsy. PLoS One.
6:e255632011. View Article : Google Scholar
|
|
40
|
Choi JS, Baek HM, Kim S, Kim MJ, Youk JH,
Moon HJ, Kim EK and Nam YK: Magnetic resonance metabolic profiling
of breast cancer tissue obtained with core needle biopsy for
predicting pathologic response to neoadjuvant chemotherapy. PLoS
One. 8:e838662013. View Article : Google Scholar
|