Introduction
Human arylamine N-acetyltransferase 1 (NAT1)
and arylamine N-acetyltransferase 2 (NAT2) are cytosolic
phase II xenobiotic metabolizing isozymes, which catalyze the
acetylation of a wide range of aromatic and heterocyclic amines via
a ping-pong bi-bi reaction mechanism (1,2).
This acetylation can ultimately lead to bioactivation and/or
deactivation of various substrates, including breast cancer
carcinogens (3–5). In addition to metabolizing
xenobiotics, NAT1, but not NAT2, can catalyze the hydrolysis of
acetyl-CoA using folate as a cofactor (6,7).
NAT1 and NAT2 are encoded by two separate loci in
close proximity on chromosome 8p22 (8,9) and
each consist of an intronless open reading frame of 870 base pairs
(10). Although NAT1 and
NAT2 share ~87% nucleotide sequence identity and 81% deduced
amino acid homology, they exhibit differing tissue localizations,
and distinct but overlapping substrate specificities (11). In addition, NAT1 and
NAT2 expression vary inter-individually from single
nucleotide polymorphisms (SNPs) (2,12–17).
Although NAT1 and NAT2 catalyze
N-acetylation, their roles in breast cancer etiology may
differ. Numerous studies have investigated possible roles for NAT1
in breast cancer etiology and progression (18–24),
given the association between increased expression of NAT1
and estrogen receptor (ER)-positive breast cancers (25–31).
Notably, NAT1 expression is not directly regulated by
estrogens or dihydrotestosterone (32), thus suggesting that there may be a
common regulatory element between NAT1 and ESR1.
Furthermore, congenic rats expressing higher NAT2 activity
(orthologous to human NAT1) have been reported to exhibit greater
carcinogen-induced mammary tumor susceptibility independent of
carcinogen metabolism (22). In
addition, SNPs in NAT2 have been well described and have
been revealed to influence acetylation rates of many known
carcinogens; an association between NAT2 genotype with
breast cancer risk among smokers has been reported (33). Since NAT1 and NAT2
may have different roles in breast cancer, it is important to
analyze relationships between the expression levels of these
isozymes.
The mRNA expression levels of NAT1 and
NAT2 have been detected by reverse transcription-polymerase
chain reaction (RT-PCR) in human mammary tissue (34,35).
NAT1 N-acetylation activity has been widely reported in
normal breast tissue and breast tumor tissue (34,36–40),
whereas NAT2 N-acetylation activity has not been observed as
consistently; when NAT2 activity is observed the activity is much
lower than NAT1 activity (34,38,39).
In addition, since NAT1 and NAT2 have overlapping substrate
specificities, activity studies of the two isozymes can be complex.
For example, Deitz probed human mammary tissue samples for NAT1 and
NAT2 activities with p-aminobenzoic acid (PABA; selective
for NAT1) and sulfamethazine (SMZ; selective for NAT2), and
reported that SMZ was acetylated by NAT1 at very low levels
(40). By normalizing the SMZ
N-acetylation activity to NAT1 activity, Deitz demonstrated
that the SMZ N-acetylation activity was most likely
catalyzed by NAT1 rather than NAT2. NAT1 and NAT2
activities have also been reported in rat mammary tissues (41).
Wakefield et al profiled NAT1
expression and activity in seven breast cancer cell lines (MCF-7,
T47D, ZR-75-1, Cal51, MDA-MB-231, MDA-MB-437 and MDA-MB-453) and
detected NAT1 mRNA expression and activity in all seven cell
lines (28); however, NAT2
expression and activity were not investigated. In addition,
NAT2 mRNA has been detected in MCF-7 breast cancer cells at
very low levels (35); however,
NAT1 was not measured at the same time preventing a direct
comparison of expression between the two isozymes. Bradshaw et
al detected NAT1 and NAT2 by western blotting in the
ER-positive breast cancer cell line MCF-7; however, the expression
levels were not compared between the two proteins (42).
Limited studies have investigated the expression
profiles of these isozymes together in breast tissues. Based on
limited data, it has been hypothesized that NAT2 expression
is very low in breast tissue and negligible in comparison to
NAT1 expression; however, previous investigations have not
addressed this hypothesis rigorously or comprehensively. To gain a
better understanding of the relationship between NAT1 and
NAT2 in breast tissues the present study evaluated the RNA
expression levels of each in breast cancer cell lines, breast tumor
tissue, and normal breast tissue. In addition, this study evaluated
the extent to which established breast cancer cell lines reflect
the NAT expression profile observed in primary breast tumors
and normal breast tissue. Since NAT1 and NAT2 are so
similar in terms of sequence, structure and substrates, and the
association between NAT1 and ESR1 has been well
established, the present study also evaluated the relationship
between NAT2 and ESR1 expression in breast tissues.
Since inhibition of NAT1 activity is under investigation for breast
cancer prevention and treatment, understanding the relationships
between NAT1, NAT2 and ESR1 is of great
importance.
Materials and methods
Acquisition of publicly available data
from the Cancer Cell Line Encyclopedia (CCLE) and The Cancer Genome
Atlas (TCGA) data repositories
RNA expression (RNA-Seq) data for ESR1,
NAT1 and NAT2 in established breast cancer cell lines
were accessed on 8/11/17 (n=57) from the CCLE (43); RNA expression values were reported
in reads per kilobase of transcript per million mapped reads
(RPKM). A total of 15 breast cancer cell lines had no detectable
NAT2 gene expression. Data from TCGA (44) for the breast invasive carcinoma
(BRCA) cohort were accessed on 2/4/18 (primary breast tumor tissue,
n=1,043; normal breast tissue, n=99) via FirebrowseR (45), an R client to the Broad Institute’s
RESTful Firehose Pipeline; RNA expression values were reported in
RNA-Seq by Expectation-Maximization (RSEM). A total of 59 of the
breast tumor samples and seven of the normal tissue samples did not
have gene expression data for NAT2.
Established breast cancer cell lines
analyzed
The following breast cancer cell lines were analyzed
in this study: AU565, BT-20, BT-474, BT-483, BT-549, CAL-120,
CAL-148, CAL-51, CAL-85-1, CAMA-1, DU4475, EFM-19, EFM-192A,
HCC1143, HCC1187, HCC1395, HCC1419, HCC1428, HCC1500, HCC1569,
HCC1599, HCC1806, HCC1937, HCC1954, HCC202, HCC2157, HCC2218,
HCC38, HCC70, HDQ-P1, HMC-1-8, HMEL, Hs 274.T, Hs 281.T, Hs 343.T,
Hs 578.T, Hs 606.T, Hs 739.T, Hs 742.T, JIMT-1, KPL-1, MCF-7,
MDA-MB-134-VI, MDA-MB-157, MDA-MB-175-VII, MDA-MB-231, MDA-MB-361,
MDA-MB-415, MDA-MB-436, MDA-MB-453, MDA-MB-468, SK-BR-3, T-47D,
UACC-812, UACC-893, ZR-75-1 and ZR-75-30.
Statistical analyses
Shapiro-Wilk tests were conducted to determine if
the expression of the genes under study were approximately normally
distributed. Significant evidence of departures from approximate
normality was observed; therefore, non-parametric statistical
techniques were employed for subsequent analyses. Spearman’s
correlation was used to evaluate the RNA expression levels between
gene pairs (i.e. ESR1 and NAT1, ESR1 and
NAT2, NAT1 and NAT2). Differences in the mRNA
expression levels of NAT1 and NAT2 in each dataset,
and differences in RNA expression between primary breast tumor
samples and normal breast tissue samples, were evaluated using the
Wilcoxon rank-sum test; median values were compared to determine
fold-differences.
RNA expression data for each gene were stratified by
ER status (+ or −) as defined in the literature (46–48)
for the CCLE data, or as determined by immunohistochemistry during
sample collection and cataloging for TCGA data. Differences in gene
expression following stratification were evaluated using Wilcoxon
rank-sum tests for each gene; median values were compared to
determine fold-differences. A total of 10 of the breast cancer cell
lines had either conflicting or unknown ER status in the
literature.
Wakefield et al published the NAT1 PABA
N-acetylation activities of seven (ZR-75-1, T47D, MCF-7,
MDA-MB-453, MDA-MB-436, MDA-MB-231 and CAL-51) of the 57 breast
cancer cell lines included in the present study (28). The association between previously
reported NAT1 activity and NAT1 RNA expression data for the
same cell lines in the CCLE repository was evaluated. All
statistical analyses were performed in R: A Language and
Environment for Statistical Computing, version 3.4.2 (49).
Results
Association between NAT1 and ESR1, NAT2
and ESR1, and NAT1 and NAT2
NAT1 RNA and ESR1 RNA were
significantly correlated (P<0.0001 for all) at moderately high
magnitudes in breast cancer cell lines (Spearman rho ρ=0.59;
Fig. 1A and B), human primary
breast tumors (ρ=0.59; Fig. 1C and
D) and normal breast tissue (ρ=0.57; Fig. 1E and F). A significant (P<0.005
for all) association between ESR1 and NAT2 expression
was observed, although the magnitude of the association was low and
varied across datasets. The primary breast tumor dataset exhibited
the weakest association (ρ=0.16; Fig.
1C and D), whereas the normal breast tissue (ρ=0.38; Fig. 1E and F) and breast cancer cell line
(ρ=0.39; Fig. 1A and B) datasets
exhibited similar, albeit low, association. Strong evidence of an
association (P<0.0001 for all) between NAT1 RNA and
NAT2 RNA levels was observed in all three datasets, with
moderately high magnitude in the breast cancer cell lines (ρ=0.64;
Fig. 1A and B). The primary breast
tumor and normal breast tissue datasets exhibited interdependence
similar to each other (ρ= 0.43 and 0.46, respectively; Figs. 1C–F); however, the association was
lower than that observed in the breast cancer cell lines.
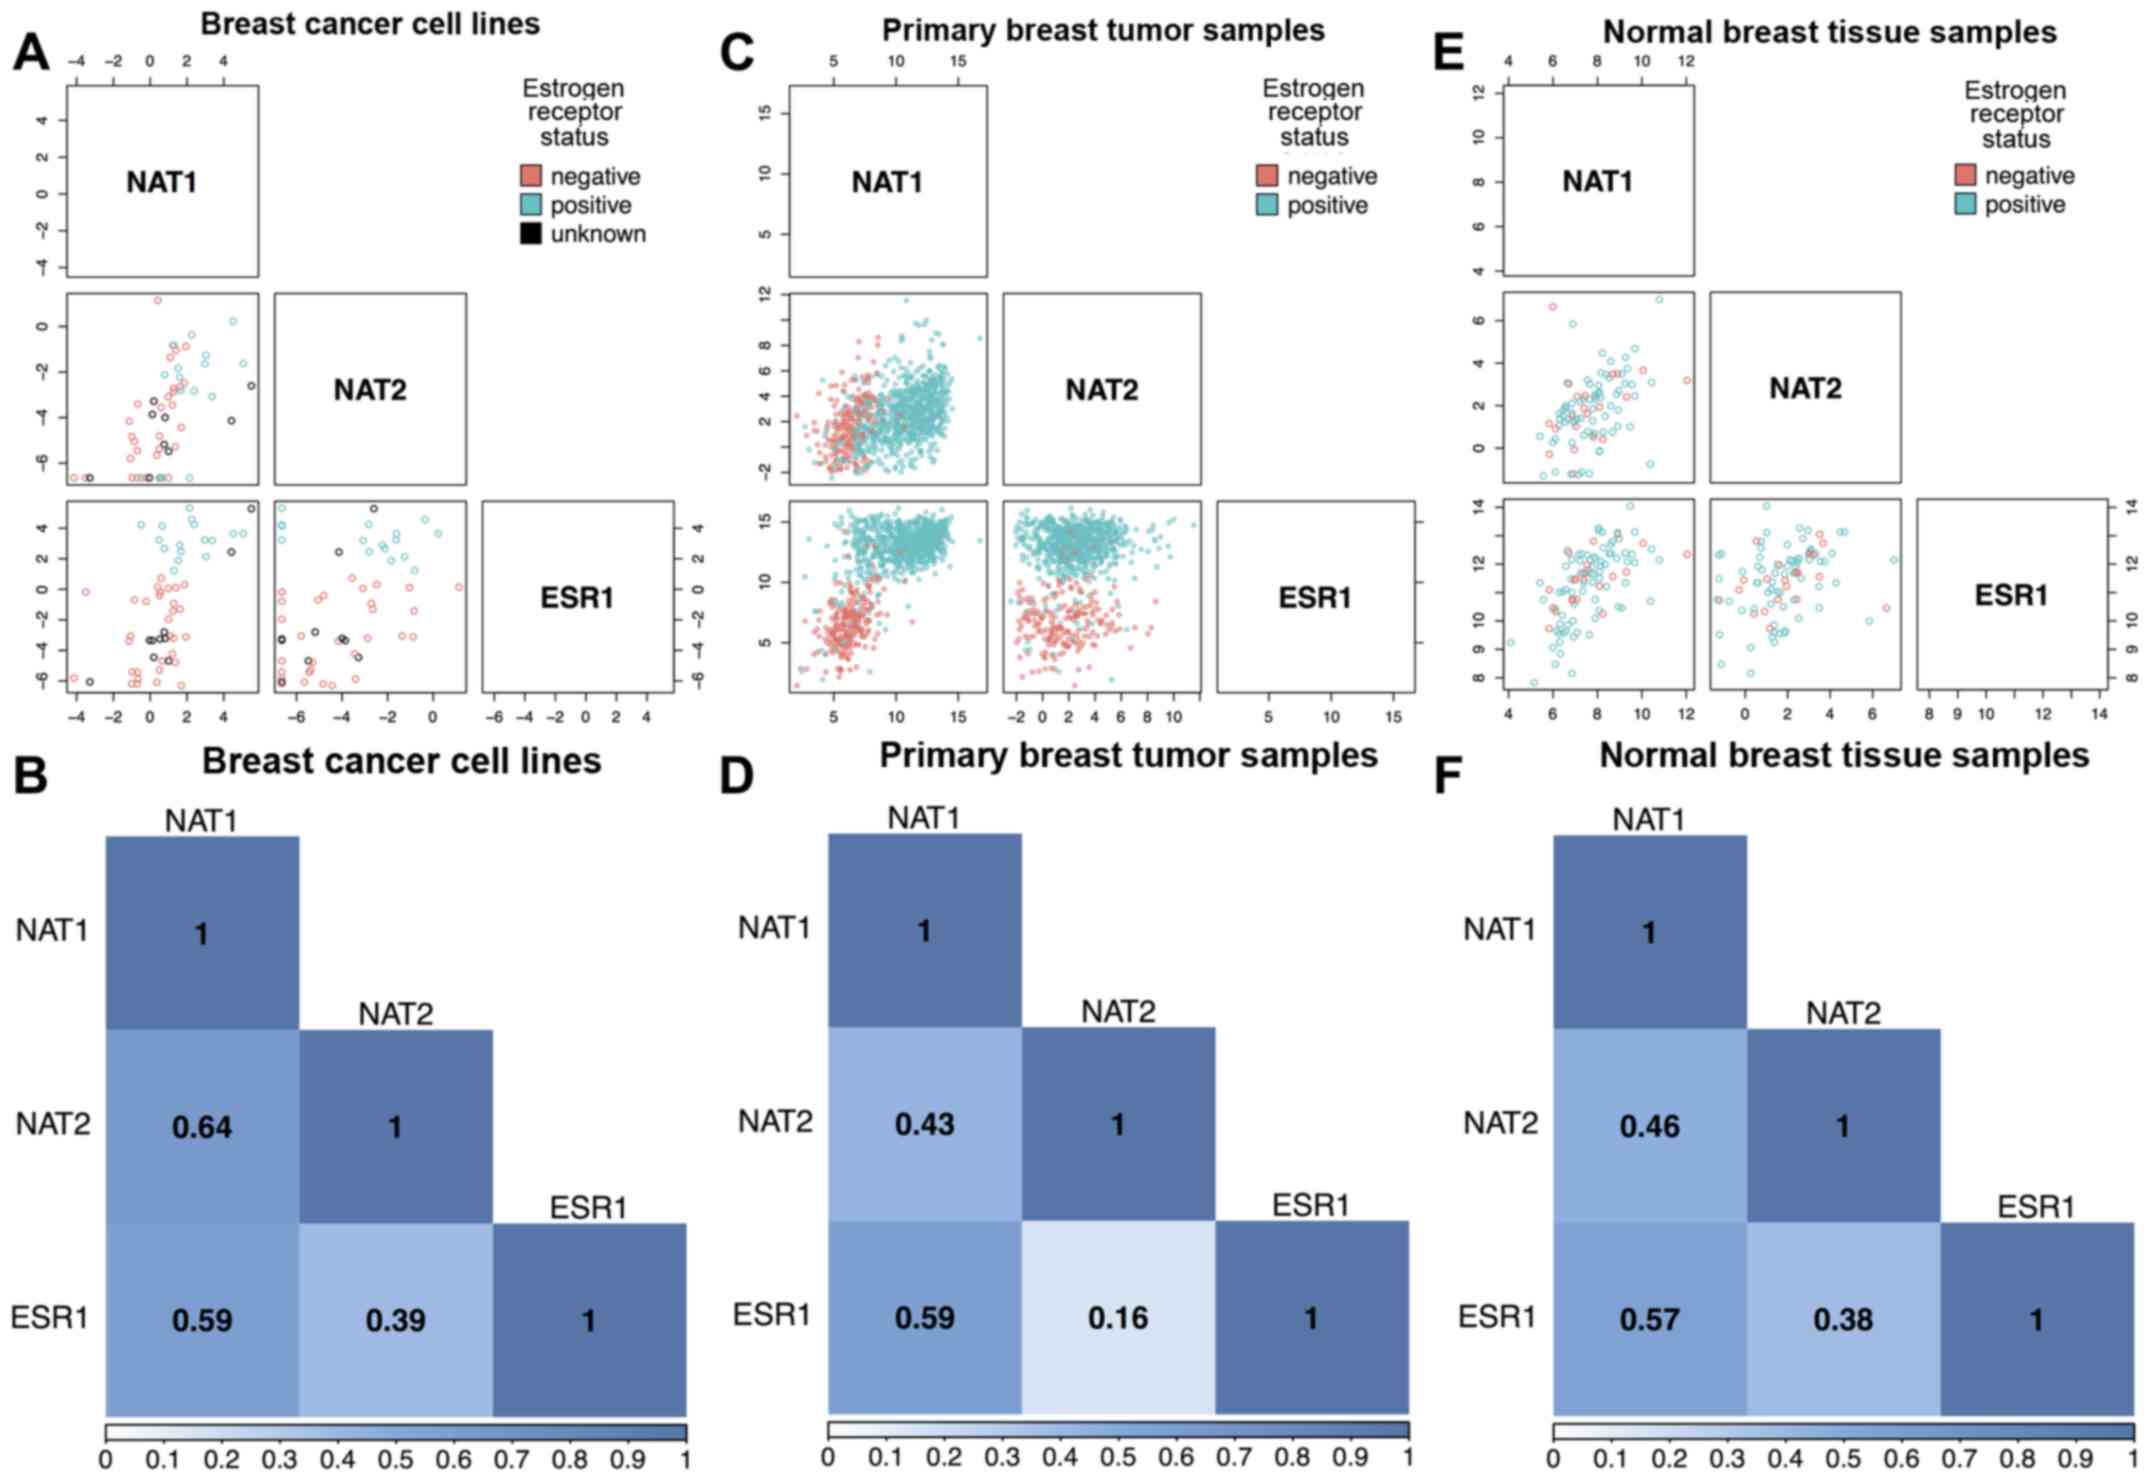 | Figure 1Scatterplot and correlation matrices
for NAT1, NAT2, and ESR1. Associations between
NAT1, NAT2, and ESR1 RNA expression were
analyzed in breast cancer cell lines, primary breast tumor tissue,
and normal breast tissue using the Spearman method. In the
scatterplot matrices, each open circle represents a single sample
and is color-coded according to ER status; pink circles,
ER− samples; blue circles, ER+ samples; black
circles, samples with unknown ER status. In the association
matrices, boxes are labeled with the Spearman correlation
coefficient (ρ) for each comparison and color reflects strength of
association; dark blue represents high association, light blue
represents low association, and white represents no association.
(A) Scatterplot matrix of the association between NAT1,
NAT2 and ESR1 RNA expression in breast cancer cell
lines (n=57). (B) Correlation matrix between NAT1,
NAT2 and ESR1 RNA expression in breast cancer cell
lines (n=57). (C) Scatterplot matrix of the association between
NAT1, NAT2 and ESR1 RNA expression in primary
breast tumor samples (n=1,043 for NAT1 vs. ESR1,
n=984 for NAT1 vs. NAT2 and NAT2 vs.
ESR1). (D) Correlation matrix between NAT1,
NAT2, and ESR1 RNA expression in primary breast tumor
samples (n=1,043 for NAT1 vs. ESR1, n=984 for
NAT1 vs. NAT2 and NAT2 vs. ESR1). (E)
Scatterplot matrix of the association between NAT1,
NAT2 and ESR1 RNA expression in normal breast tissue
samples (n=99 for NAT1 vs. ESR1, n=92 for NAT1
vs. NAT2 and NAT2 vs. ESR1). (F) Correlation
matrix between NAT1, NAT2 and ESR1 RNA
expression in normal breast tissue samples (n=99 for NAT1
vs. ESR1, n=92 for NAT1 vs. NAT2 and
NAT2 vs. ESR1). ER, estrogen receptor; ESR1,
estrogen receptor 1; NAT1, arylamine
N-acetyltransferase 1; NAT2, arylamine
N-acetyltransferase 2. |
Comparison of NAT1 and NAT2
expression
NAT1 RNA expression in breast cancer cell
lines, primary breast tumors, and normal breast tissue was
significantly higher compared with NAT2 expression by 33-,
222- and 52-fold, respectively (P<0.0001 for all; Fig. 2A–C). NAT1 expression was
higher than NAT2 expression in all 57 breast cancer cell
lines tested, with the exception of the UACC-893 cell line, which
expressed the highest NAT2 RNA of any of the breast cancer
cell lines analyzed. A total of 15 of the 57 breast cancer cell
lines (MDA-MB-134-IV, CAL-120, DU4475, MCF-7, JIMT-1, Hs 281.T,
KPL-1, Hs 606.T, HCC70, EFM-19, CAL-148, HCC1569, HMC-1-8, HCC1599
and HCC1395) had no reported NAT2 RNA expression, whereas
all 57 reported NAT1 RNA expression. The KPL-1 breast cancer
cell line has been reported to be contaminated/misidentified and to
be an MCF-7 derivative (50).
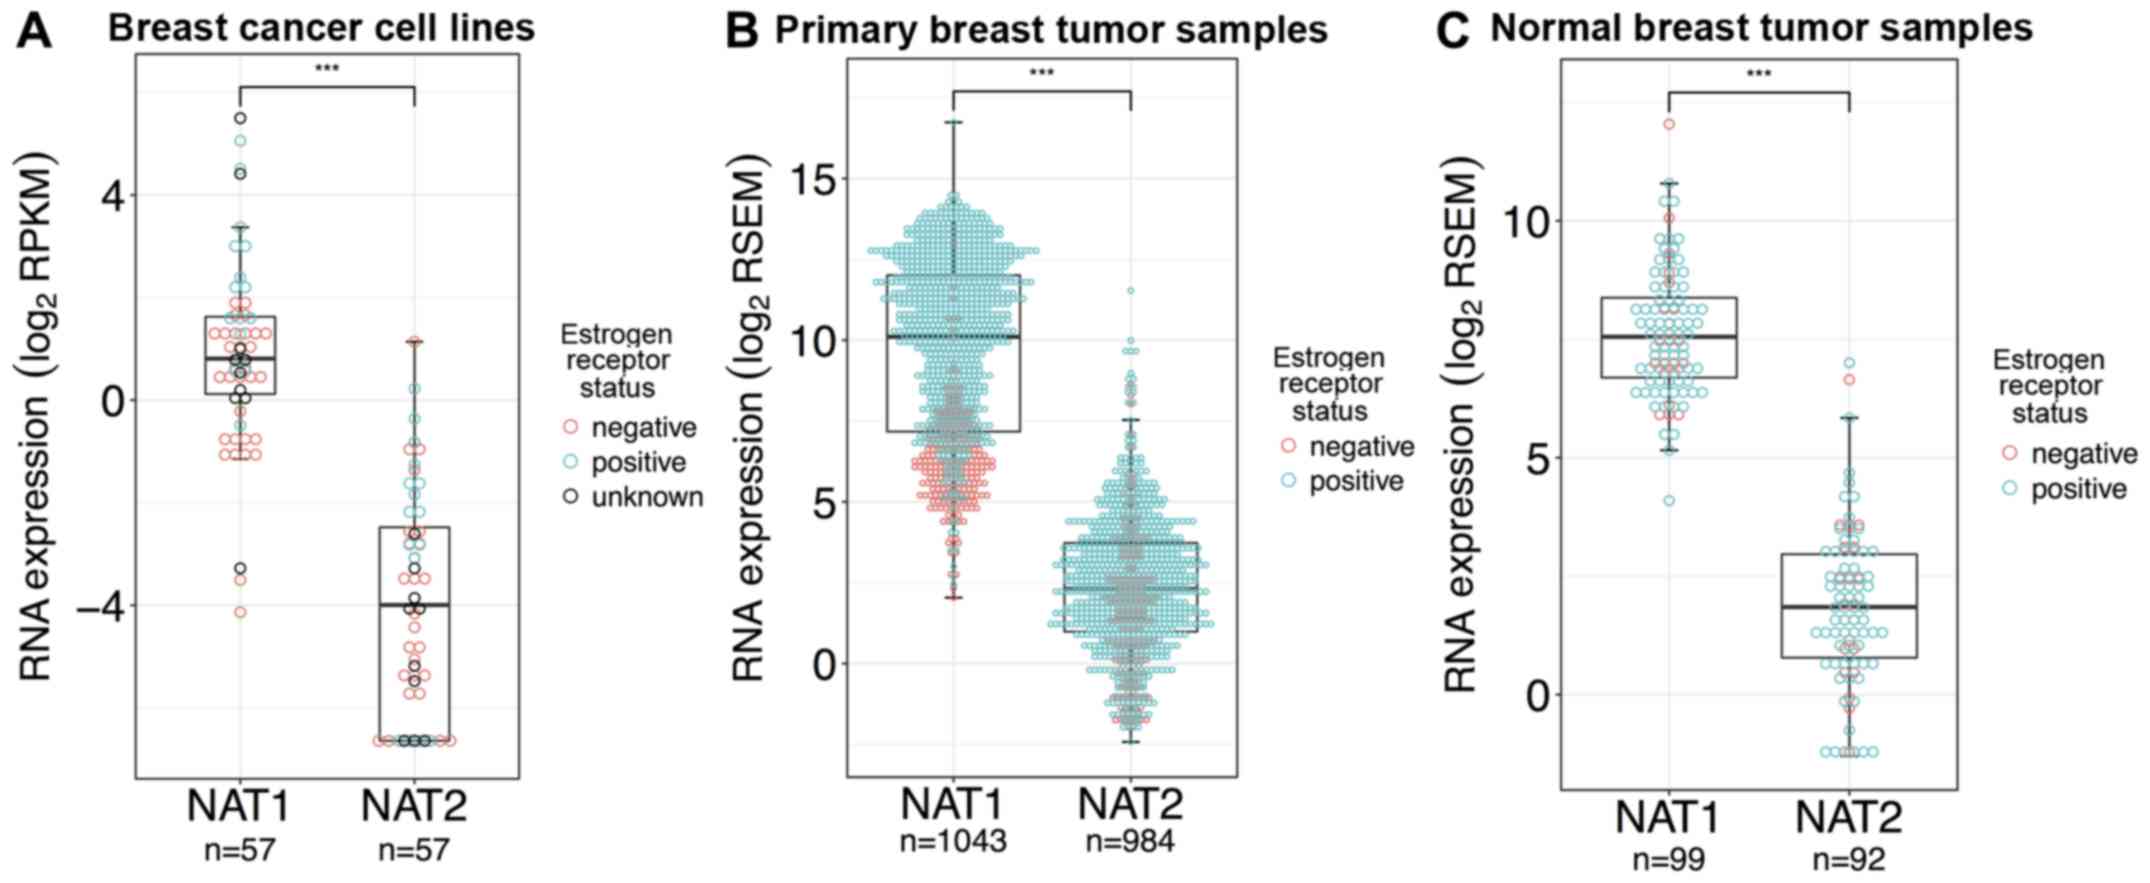 | Figure 2NAT1 and NAT2 RNA
expression in breast cancer cell lines, primary breast tumor
samples, and normal breast tissue samples. Differences in gene
expression between NAT1 and NAT2 in breast cancer
cell lines, primary breast tumor tissue and normal breast tissue
were statistically evaluated by Wilcoxon rank-sum test;
***P<0.001. Each dot represents a single sample and
is color-coded according to ER status; pink dots, ER−
samples; blue dots, ER+ samples; black dots, samples
with unknown ER status. In the boxplots, the solid black line
represents the median, the upper hinge represents the 75th quartile
and the lower hinge represents the 25th quartile. The upper whisker
represents the largest observation less than or equal to the upper
hinge + 1.5 x IQR, the lower whisker represents the smallest
observation greater than or equal to the lower hinge - 1.5 x IQR.
(A) NAT1 RNA expression was significantly higher than
NAT2 RNA expression in the breast cancer cell lines. (B)
NAT1 RNA expression was significantly higher than
NAT2 RNA expression in the primary breast tumor samples. (C)
NAT1 RNA expression was significantly higher than
NAT2 RNA expression in the normal breast tissue samples. ER,
estrogen receptor; IQR, interquartile range; NAT1, arylamine
N-acetyltransferase 1; NAT2, arylamine
N-acetyltransferase 2; RPKM, reads per kilobase of
transcript per million mapped reads; RSEM, RNA-Seq by
Expectation-Maximization. |
In TCGA dataset, normal breast tissue samples were
collected from patients in which primary breast tumor samples were
also collected (but only for 99 individuals), allowing comparison
of gene expression between normal breast tissue and primary tumor
breast tissue within single individuals. In the primary breast
tumor samples, only nine of the 984 samples had higher NAT2
RNA expression than NAT1; of those nine samples, two were
ER+ and seven were ER−, and only one sample
had a corresponding normal breast tissue sample. Notably, in that
individual’s normal breast tissue sample, NAT2 RNA
expression was not higher than NAT1 RNA expression. In the
normal breast tissue samples, only one of the 92 samples had higher
NAT2 RNA expression than NAT1; the corresponding
primary breast tumor sample from the same patient had lower
NAT2 than NAT1.
Comparison of gene expression between
ER+ and ER− samples
ESR1 and NAT1 gene expression were
significantly increased, 86- and 2.6-fold, respectively, in
ER+ breast cancer cell lines (P<0.0001 for both;
Fig. 3A), whereas NAT2 gene
expression did not significantly vary between ER+ and
ER− breast cancer cell lines (P>0.05; Fig. 3A). Of the breast cancer cell lines
with ER status defined in the literature (46–48),
a connection between ESR1 RNA expression and the reported ER
status has been observed. According to the literature, samples in
the dataset with ESR1 RNA expression <1.7 RPKM were
defined as ER−, whereas samples with ESR1
expression >2.3 RPKM were defined as ER+. The
expression levels of all three genes were significantly higher in
ER+ primary breast tumor samples (P<0.0001 for all;
Fig. 3B); however. the fold-change
between NAT2 expression in ER+ and ER−
samples was smaller (1.8-fold difference) than for NAT1 and
ESR1. In comparison, ESR1 and NAT1 were ~108-
and 27-fold higher, respectively. The expression levels of genes
were not significantly different between ER+ and
ER− normal breast tissue samples (P>0.05 for all;
Fig. 3C). Most of the breast
cancer cell lines were ER−, whereas most of the primary
breast tumor and normal breast tissue samples were
ER+.
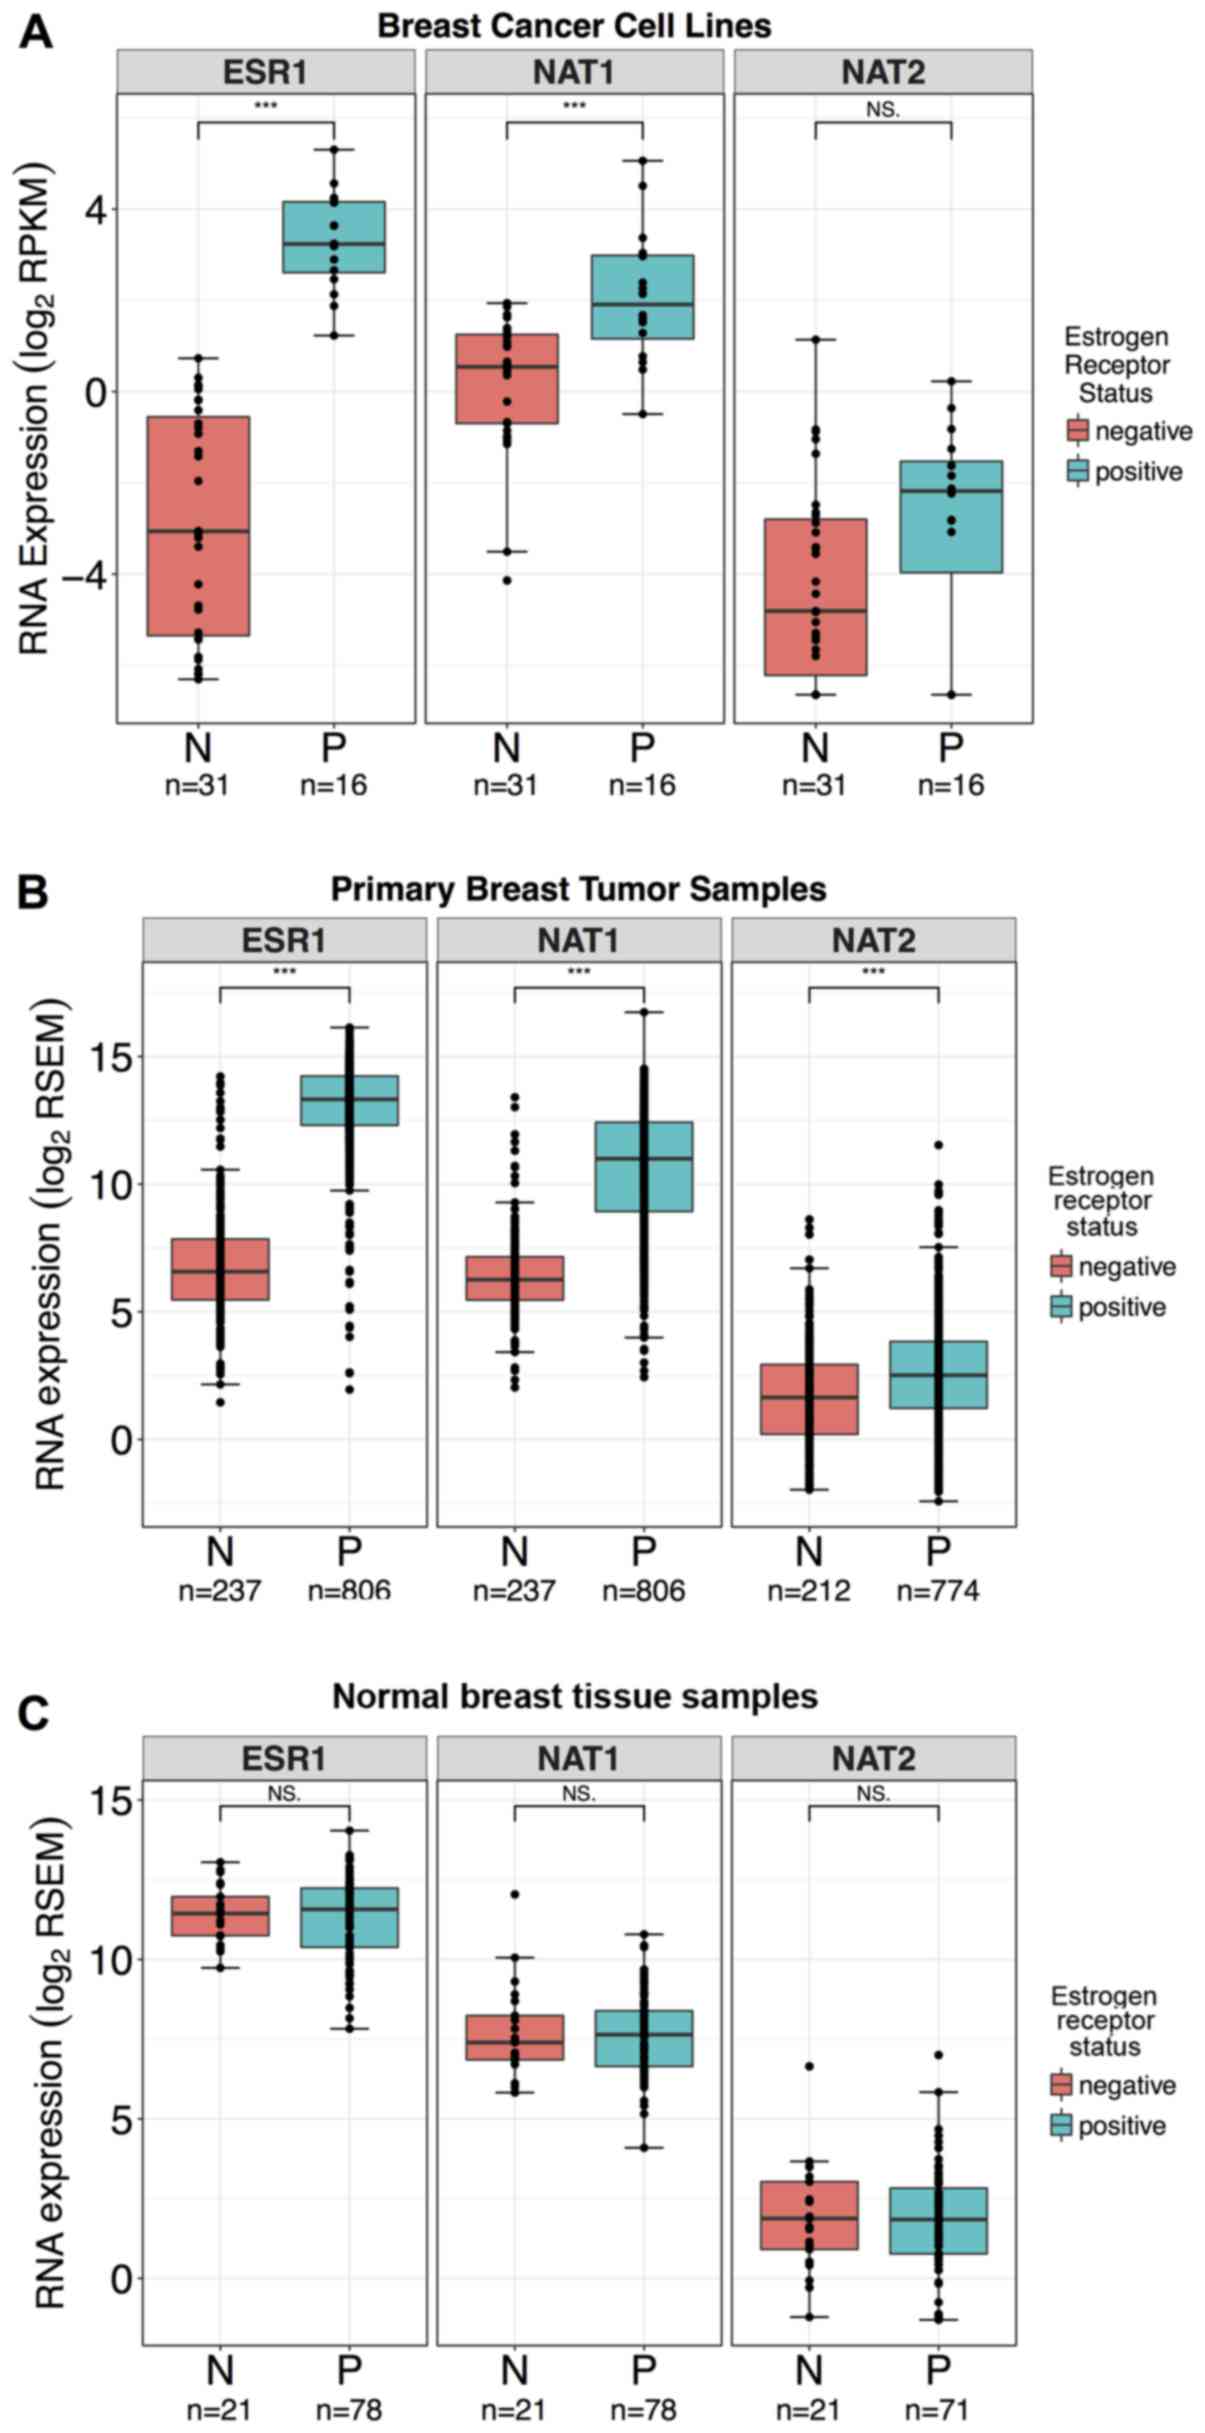 | Figure 3ESR1, NAT1 and
NAT2 RNA expression in breast cancer cell lines, primary
breast tumor samples, and normal breast tissue stratified by ER
status. Differences in the expression levels of ESR1,
NAT1 and NAT2 genes in breast cancer cell lines,
primary breast tumor tissue, and normal breast tissue stratified by
ER status were evaluated by Wilcoxon rank-sum test;
***P<0.001; NS, not significant. Boxplots are
color-coded according to ER status; pink boxplots, ER−
samples; blue boxplots, ER+ samples. In the boxplots,
the solid black line represents the median, the upper hinge
represents the 75th quartile and the lower hinge represents the
25th quartile. The upper whisker represents the largest observation
less than or equal to the upper hinge + 1.5 x IQR, the lower
whisker represents the smallest observation greater than or equal
to the lower hinge - 1.5 x IQR. (A) ESR1 and NAT1 RNA
expression were significantly higher in ER+ breast
cancer cell lines compared with ER− breast cancer cell
lines. NAT2 RNA expression was not significantly different
in ER+ breast cancer cell lines compared with
ER− breast cancer cell lines. A total of 10 cell lines
had either conflicting reports or no available data for ER status
in the literature and were excluded from the analysis. (B)
ESR1, NAT1 and NAT2 RNA expression were
significantly higher in ER+ samples compared with
ER− samples in the primary breast tumor dataset. (C)
ESR1, NAT1 and NAT2 RNA expression levels were
not significantly different in ER+ samples compared with
ER− samples in the normal breast tissue dataset. ER,
estrogen receptor; IQR, interquartile range; ESR1, estrogen
receptor 1; NAT1, arylamine N-acetyltransferase 1;
NAT2, arylamine N-acetyltransferase 2; RPKM, reads
per kilobase of transcript per million mapped reads; RSEM, RNA-Seq
by Expectation-Maximization. |
Comparison of NAT1, NAT2, and ESR1 gene
expression between normal breast tissue and primary breast
tumors
Differences in gene expression between normal breast
tissue and primary breast tumor tissue were evaluated for each
gene, ESR1, NAT1, and NAT2. More spread was
observed in the primary breast tumor samples compared with the
normal breast tissue samples for each gene. ESR1 and
NAT1 gene expression were significantly elevated 2.5- and
5.9-fold, respectively, in primary breast tumor samples compared
with normal breast tissue samples (P<0.0001 for both; Fig. 4). NAT2 expression was also
significantly higher in primary breast tumor samples compared with
normal breast tissue samples, but at a lower significance and
fold-change (1.4-fold) than ESR1 and NAT1 (P<0.05;
Fig. 4).
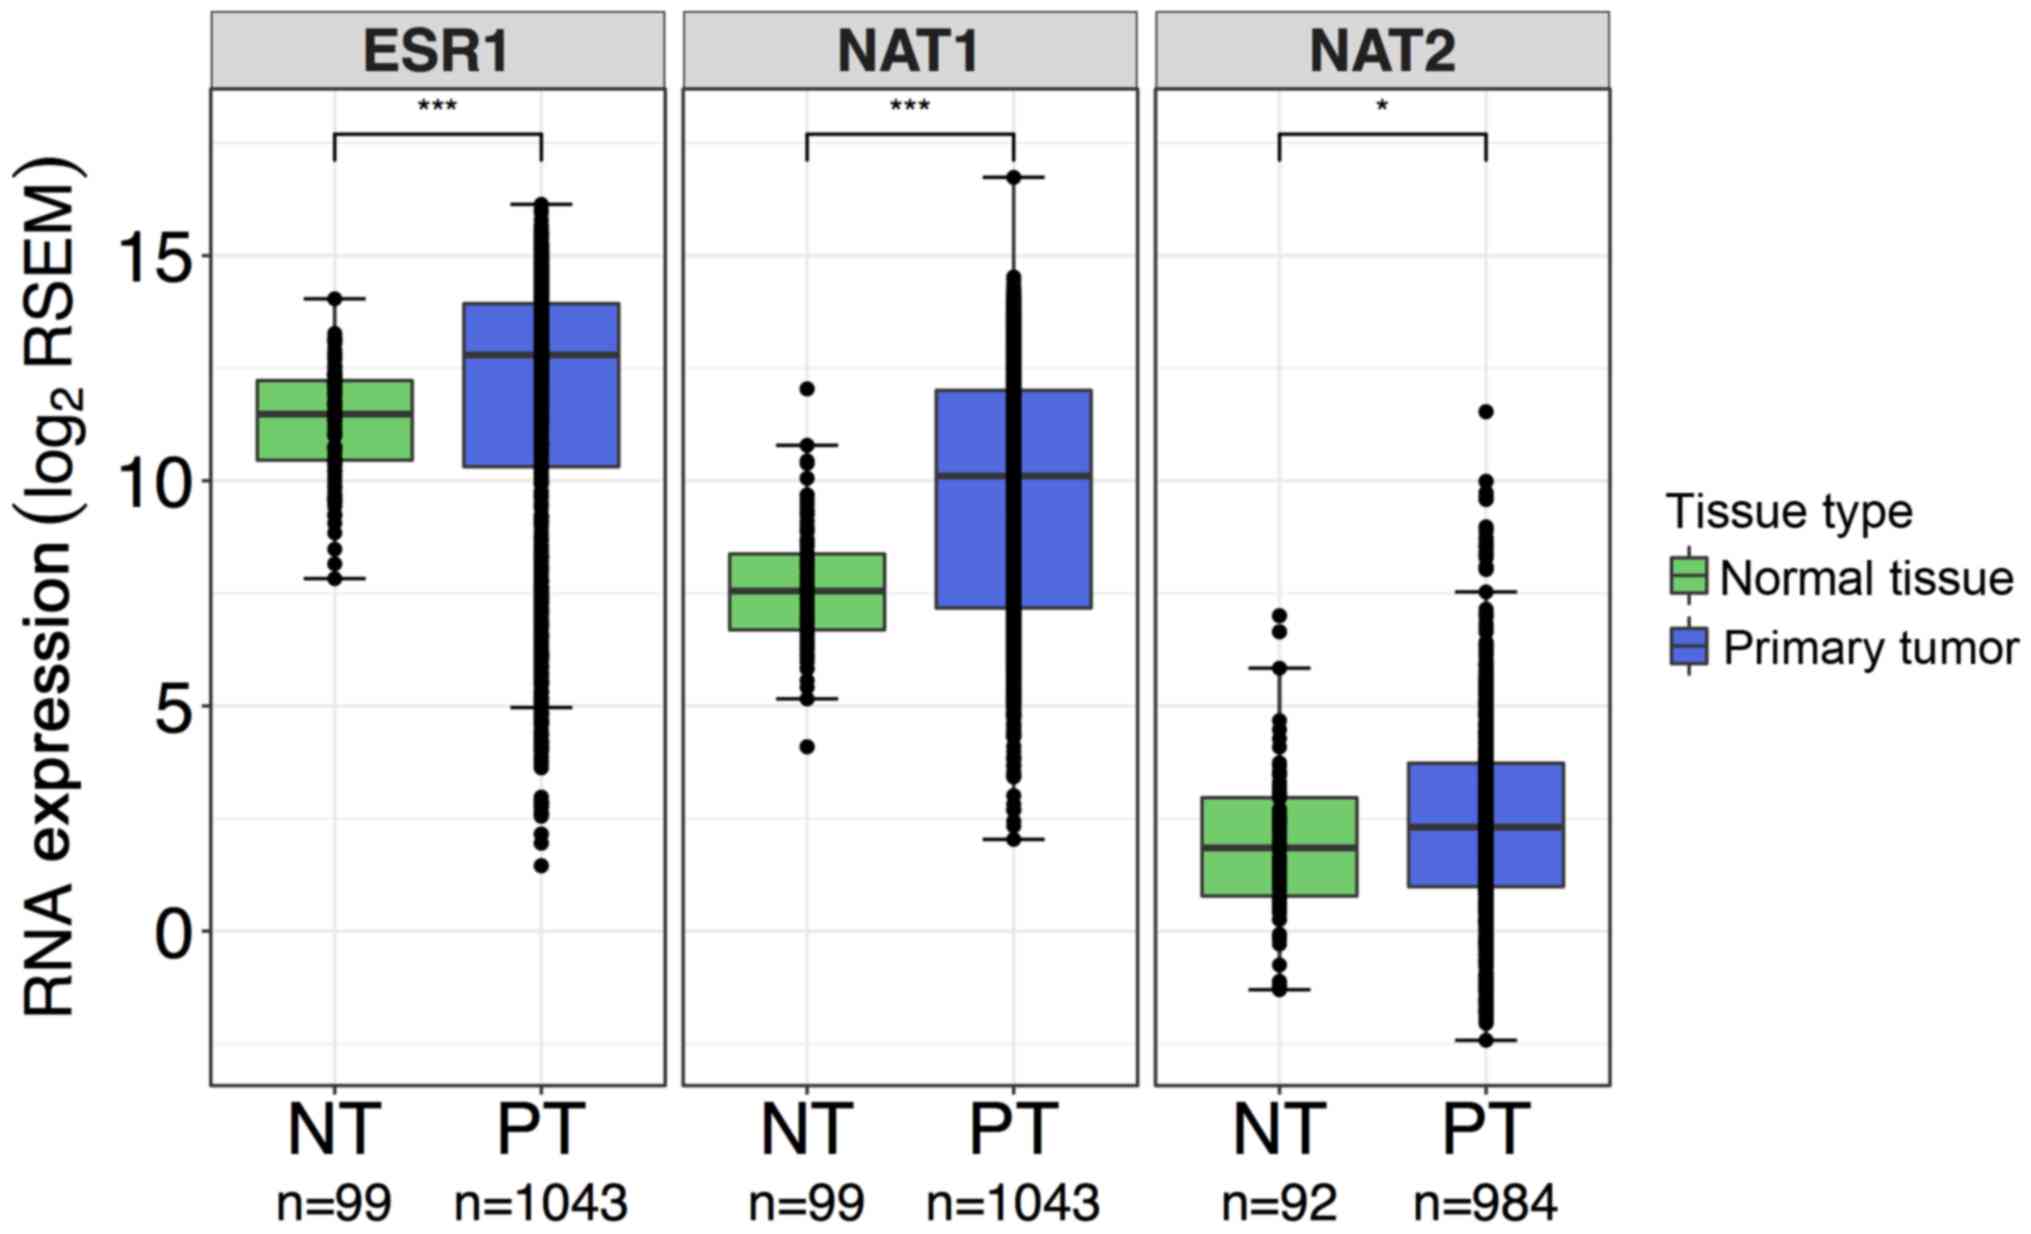 | Figure 4Comparison of ESR1,
NAT1 and NAT2 RNA expression in normal breast tissue
and primary breast tumor samples. Differences in gene expression of
ESR1, NAT1 and NAT2 in normal breast tissue
and primary breast tumor tissue were evaluated by Wilcoxon rank-sum
test; ***P<0.001; *P<0.05. Boxplots are
color-coded according to tissue type; green boxplots, normal breast
tissue samples; blue boxplots, primary breast tumor samples. In the
boxplots, the solid black line represents the median, the upper
hinge represents the 75th quartile and the lower hinge represents
the 25th quartile. The upper whisker represents the largest
observation less than or equal to the upper hinge + 1.5 x IQR, the
lower whisker represents the smallest observation greater than or
equal to the lower hinge - 1.5 * IQR. For all genes,
more spread was observed in data from the primary breast tumor
samples compared with the normal breast tissue samples. ESR1
and NAT1 gene expression were significantly elevated in
primary tumor tissue compared with normal breast tissue.
NAT2 expression was also significantly higher in primary
tumor tissue compared with normal breast tissue, but at a lower
significance than ESR1 and NAT1. IQR, interquartile
range; ESR1, estrogen receptor 1; NAT1, arylamine
N-acetyltransferase 1; NAT2, arylamine
N-acetyltransferase 2; RSEM, RNA-Seq by
Expectation-Maximization. |
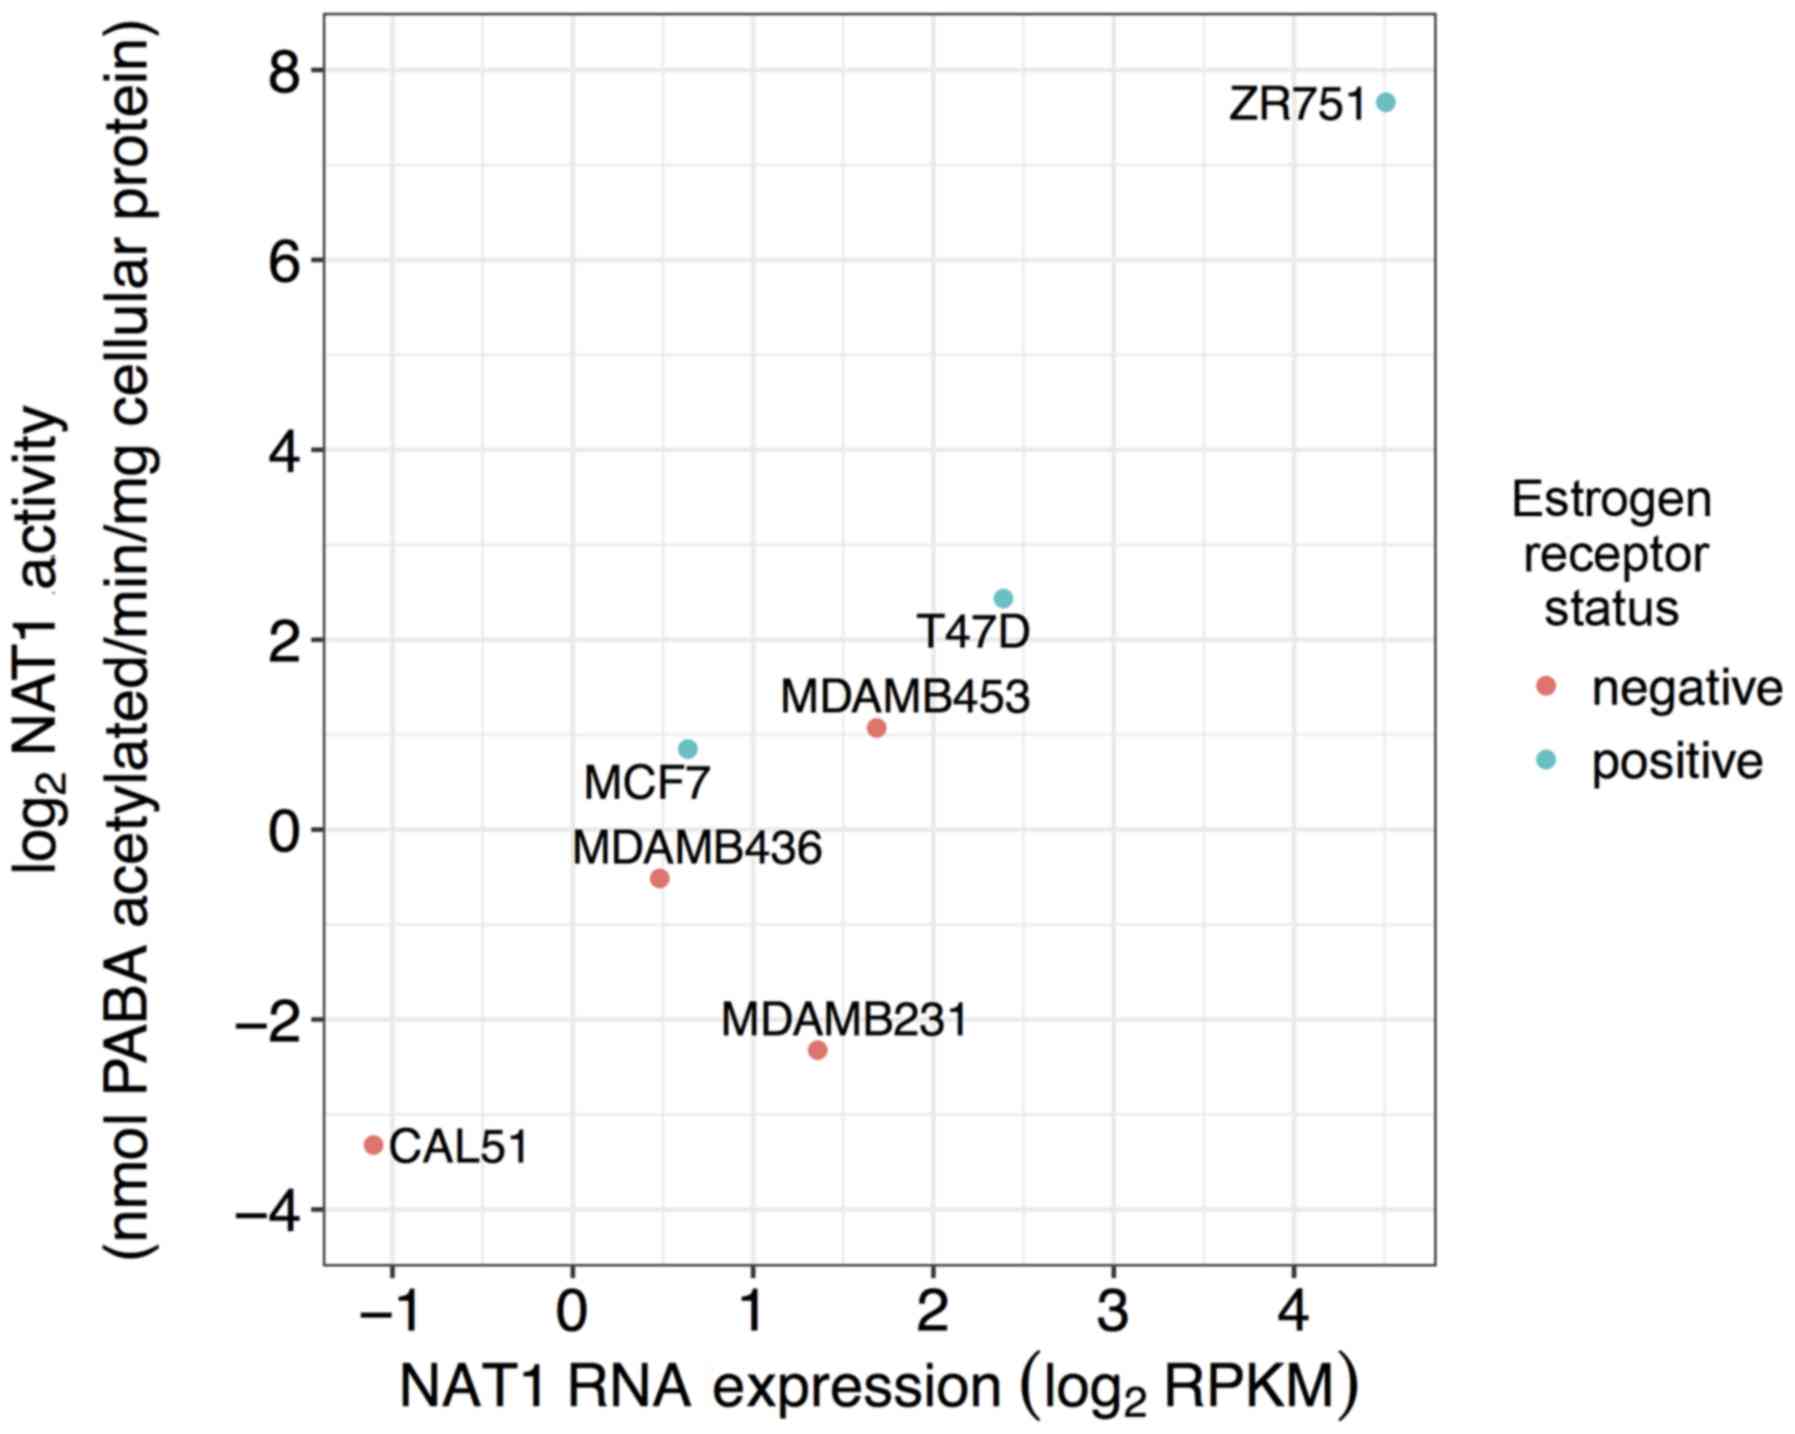
Relationship between previously reported
NAT1 N-acetylation activity and NAT1 RNA expression
NAT1 N-acetylation activity previously
reported in the literature and NAT1 RNA expression in seven
of the 57 breast cancer cell lines were significantly associated
(P<0.05) with a high magnitude (ρ=0.89; Fig. 5).
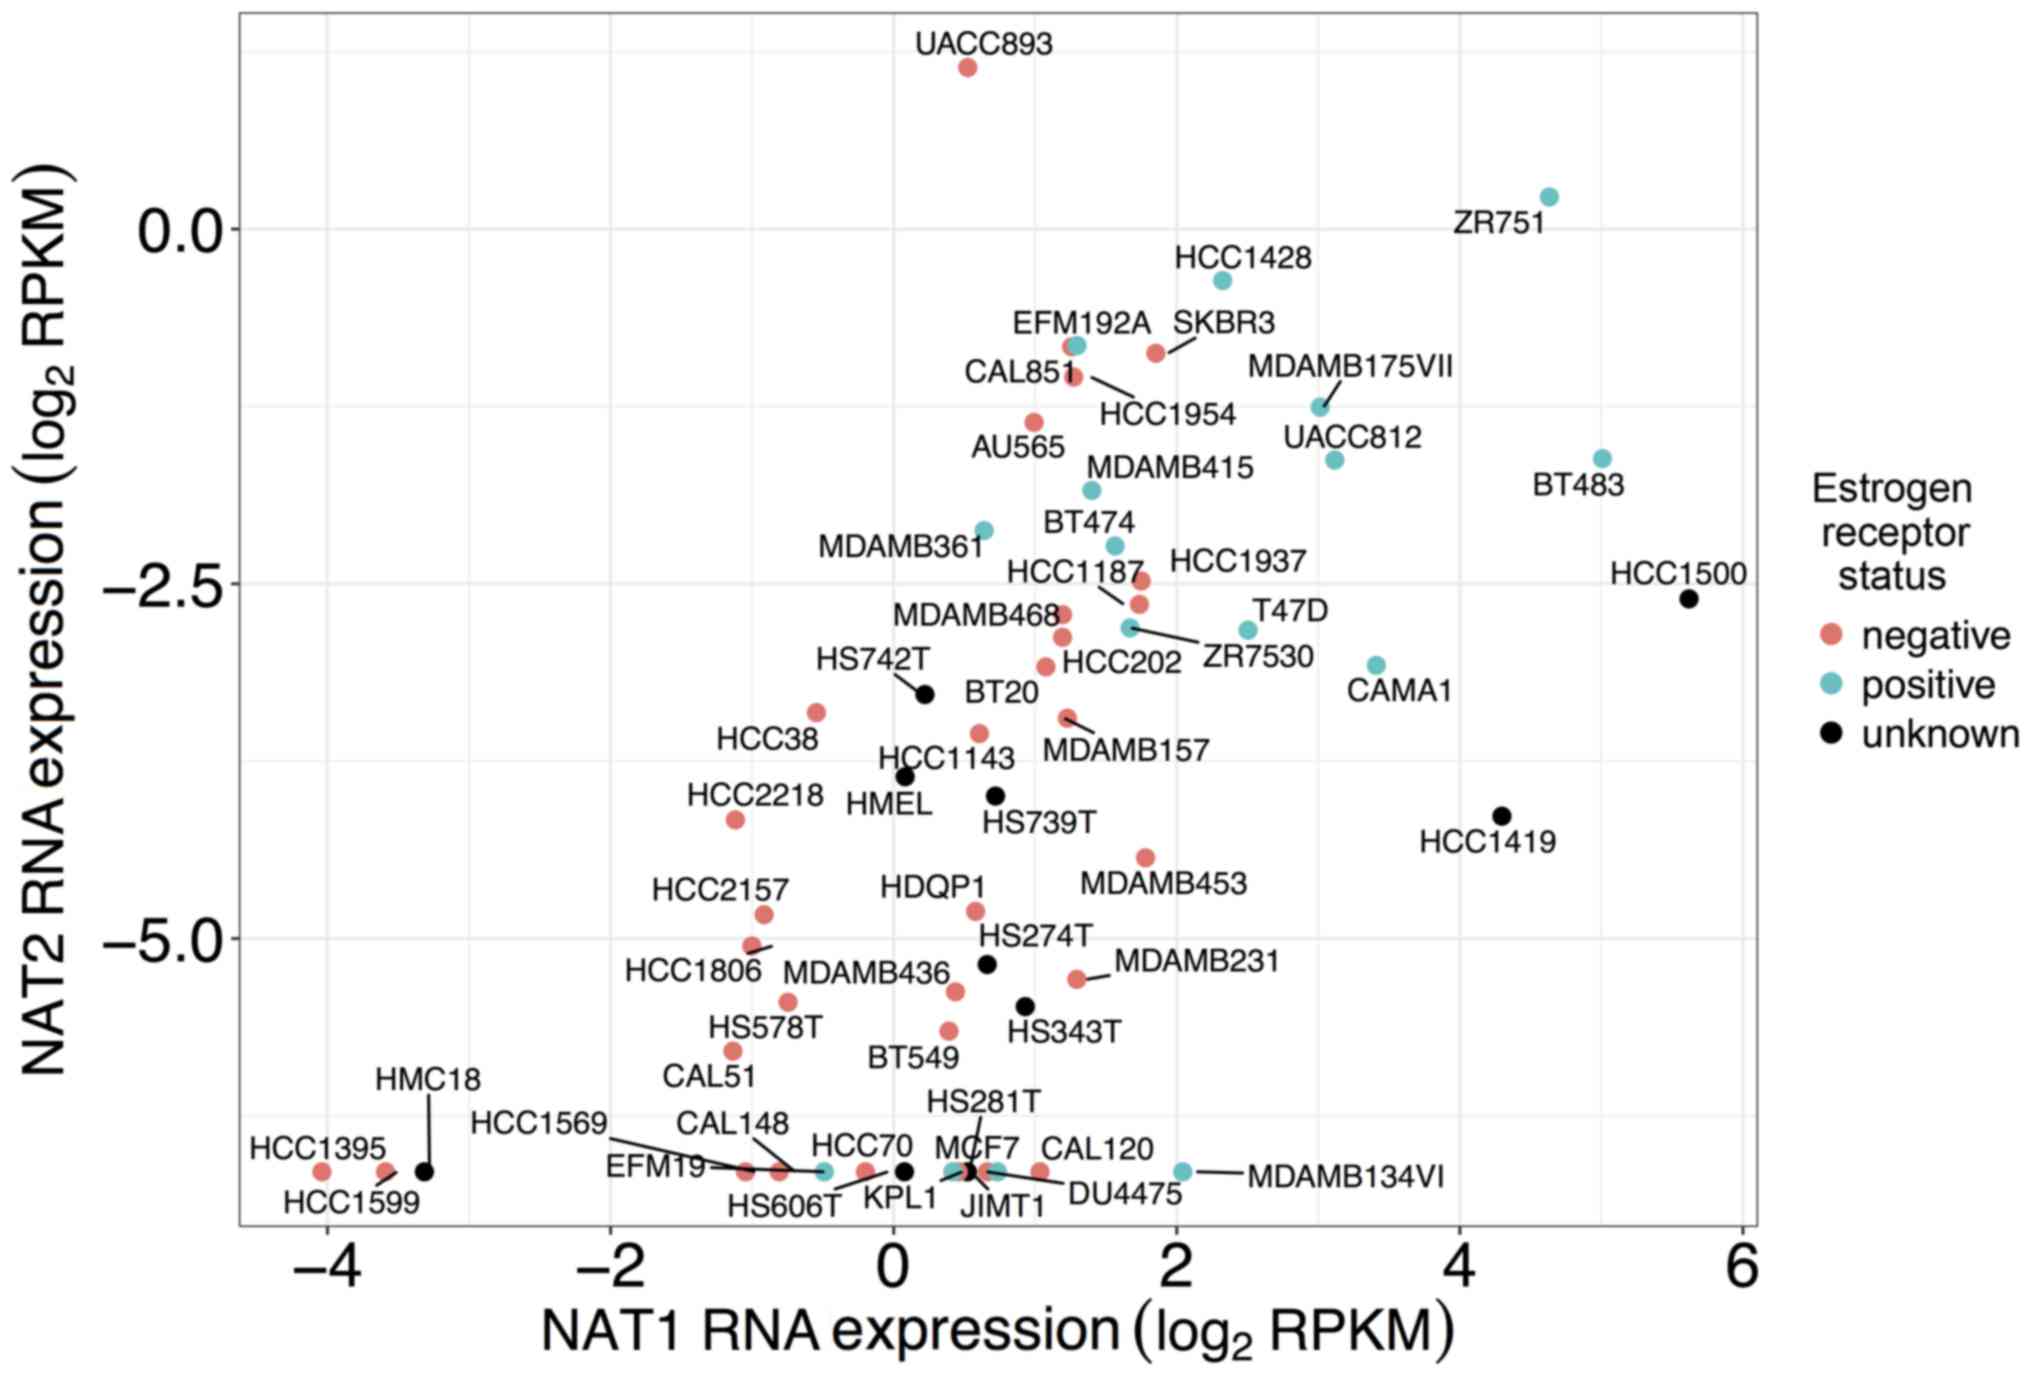
Co-expression of NAT1 and NAT2 RNA
expression in established breast cancer cell lines
Co-expression profiles of NAT1 and
NAT2 RNA for each established breast cancer cell line
included in this study are presented in Fig. 6. Of all the cell lines included in
the present study, the UACC-893 cell line expressed the highest
level of NAT2 RNA, whereas the HCC1500 cell line expressed
the highest level of NAT1 RNA. The ZR-75-1 cell line
expressed high levels of both NAT1 and NAT2 RNA,
whereas the HCC1395 cell line expressed low levels of both.
Discussion
The present study analyzed established breast cancer
cell lines and samples from patients with breast cancer to evaluate
the extent to which breast cancer cell lines serve as appropriate
models for NAT1, NAT2 and ESR1 expression in
breast tumors. Overall, the present findings demonstrated a strong
association between NAT1 and ESR1 expression, which
is in agreement with previous reports that NAT1 and
ESR1 are positively associated (25–31),
and this association was observed in all three sample types at
approximately the same magnitude. These findings suggested that
breast cancer cell lines may accurately reflect this relationship
and provide a useful model for further research into the
relationship. It is well known that ESR1 expression is
frequently altered in breast cancer; therefore, the decrease in
association between NAT2 and ESR1 in primary breast
tumors compared with normal breast tissue samples and established
breast cancer cell lines may be due to more dysregulation of
ESR1 than NAT2 in primary breast tumors. The results
of an analysis between NAT2 and ESR1 expression
suggested that, while NAT2 and ESR1 are associated,
the magnitude is low.
Interdependence between NAT1 and NAT2
expression was moderately high in the breast cancer cell line
dataset, but substantially lower in the primary breast tumor and
normal breast tissue datasets. Additionally, the strength of the
association between NAT1 and NAT2 in the breast
cancer cell line dataset was similar to the strength of the
association observed between NAT1 and ESR1 in that
dataset; however, in the primary breast tumor and normal breast
tissue datasets, the association between NAT1 and
NAT2 was lower. These findings suggested that breast cancer
cell lines may over-represent the interdependence between
NAT1 and NAT2, and not fully replicate the
relationship observed in primary breast tumors or normal breast
tissue.
In the breast cancer cell line data there appears to
be a cut-off (between 1.7 and 2.3 RPKM) linking ESR1 RNA
expression and the reported ER status of the breast cancer cell
lines. This may provide a method to predict the ER status of breast
cancer cell lines that currently have conflicting or unknown ER
status in the literature. Using that method, it may be predicted
that the HCC1500 and HCC1419 cell lines are ER+, whereas
the HMC-1-8, Hs 742.T, Hs 343.T, Hs 739.T, HMEL, Hs 274.T, Hs 281.T
and Hs 606.T cell lines are ER−. Notably, although
67–82% of breast cancers are ER+ (51) and most of the primary breast tumor
samples were ER+, the majority of established breast
cancer cell lines are ER−.
NAT1 and NAT2 RNA expression were
reported in almost all samples included in the present study, which
concurs with previously published results that have detected
NAT1 and NAT2 mRNA by RT-PCR in human mammary tissue
in smaller cohorts (34–36). NAT1 RNA expression was
significantly higher than NAT2 RNA expression in the breast
cancer cell lines, primary breast tumor samples and normal breast
tissue. In addition, with only a few exceptions, NAT1 RNA
expression was always higher than NAT2 RNA expression in
matched samples from the breast cancer cell line, primary breast
tumor sample and normal breast tissue sample datasets, thus
supporting previous findings that indicated NAT1 transcripts
were 2- to 3-fold higher than NAT2 transcripts in human
mammary tissues (52). The
UACC-893 cell line, the only breast cancer cell line observed in
this study to express higher NAT2 RNA than NAT1 RNA,
is an ER− and progesterone receptor-negative cell line
that has a ~20-fold amplification of the human epidermal growth
factor receptor 2/neu oncogene sequence. Further study of this cell
line may aid in the identification of additional regulatory
mechanisms of NAT1 and/or NAT2, since it expresses a
unique profile of NAT1 and NAT2 compared with the
other breast cancer cell lines.
While NAT1 expression was reported in all 57
breast cancer cell lines in the present study, 15 of those breast
cancer cell lines had no reported NAT2 RNA expression
(Fig. 6). The cell lines with no
detected NAT2 RNA are plotted at ~−6.6 log2 RPKM
NAT2. One of those 15 cell lines, MCF-7, has previously been
reported to express NAT2 RNA expression (35,53)
albeit at very low levels. One reason for the difference in
observation between this study and the previous studies may be that
the detection threshold for NAT2 was higher when measured by
RNA-Seq for the CCLE dataset than in the previous studies.
Additionally, in the previous studies that detected NAT2 RNA
in the MCF-7 breast cancer cell line, NAT1 RNA was not
measured at the same time; therefore, direct comparisons of the
isozymes was not possible. To the best of our knowledge,
NAT2 RNA expression has not been investigated in any of the
other 56 breast cancer cell lines until this study. The results of
this study indicated that NAT2 may be expressed in breast
tissues and expression should be considered when studying
NAT1, due to their overlapping substrate specificities and
the high degree of structural similarity.
In normal breast tissue samples no significant
difference in gene expression for ESR1, NAT1 and
NAT2 was observed when data was stratified by ER status.
However, in the primary breast tumor samples and in the breast
cancer cell lines, ESR1 and NAT1 exhibited increased
expression in the ER+ samples compared with in the
ER− samples. NAT2 RNA expression did not
significantly vary in breast cancer cell lines when comparing
ER+ and ER− samples, but was significantly
increased in ER+ primary breast tumor samples compared
with in ER− primary breast tumor samples, although the
difference was small. This finding suggested that the dysregulation
of NAT1 and ESR1 during tumorigenesis may share
similar mechanisms; however, NAT2 does not.
ESR1, NAT1 and NAT2 RNA
expression were each increased in primary breast tumor samples
compared with normal breast tissue samples although the
significance and fold-change of NAT2 were smaller than that
of ESR1 and NAT1. Additionally, for all genes, more
widely spread expression was observed in the primary breast tumor
samples compared with normal breast tissue. These data suggested
that expression of all three genes may become modified during
breast cancer tumorigenesis; however, the expression of NAT1
and ESR1 appear to be dysregulated to a greater extent. As
recently reviewed (54), the role
of NAT2 in breast cancer etiology is considered to be due to its
effects on carcinogen metabolism. The present study suggested that
the role of NAT2 in breast cancer is less likely a product of cell
transformation, as the expression levels of NAT2 between
normal and tumor tissues exhibited smaller variance than the
expression levels of NAT1 and ESR1.
NAT1 N-acetylation activity has been
reported in normal breast tissue and breast tumor tissue (34,36–40),
whereas NAT2 N-acetylation activity has not been observed as
consistently; when NAT2 activity is observed the activity is much
lower than that of NAT1 activity (34,38,39).
Wakefield et al profiled NAT1 expression and activity
in seven breast cancer cell lines (MCF-7, T47D, ZR-75-1, Cal51,
MDA-MB-231, MDA-MB-437 and MDA-MB-453); NAT1 mRNA and
activity was observed in all seven cell lines (28); however, NAT2 expression and
activity were not co-investigated. The high degree of association
between the previously reported NAT1 N-acetylation activity
and the NAT1 RNA expression of the same seven breast cancer
cell lines suggested that NAT1 RNA expression is highly
reflective of NAT1 N-acetylation activity. Gene expression
is not always predictive of enzyme activity, due to the numerous
regulatory mechanisms that can occur between RNA expression and
protein function; however, these results suggested that RNA
expression of NAT1 may serve as an appropriate predictor of
NAT1 N-acetylation activity. Further studies with an
increased number of breast cancer cell lines in which NAT1
N-acetylation activity has been measured are required to
confirm this hypothesis. Additionally, further studies are required
to determine association between NAT2 RNA expression and
NAT2 N-acetylation activity.
The CCLE and TCGA repositories offer a wealth of
publicly available data. The present study utilized this data to
analyze and annotate the previously undefined relationships between
NAT1, NAT2 and ESR1 in breast cancer cell
lines, primary breast tumors and normal breast tissue. The results
demonstrated that NAT1 and NAT2 RNA were expressed in
normal breast tissue and primary breast tumor tissue; however,
NAT1 RNA expression was much higher than NAT2. The
expression of NAT1 and NAT2 were found to be
associated; however, the magnitude was lower than that observed
between NAT1 and ESR1 in the primary breast tumors
and normal breast tissue. Additionally, although the association
between NAT1 and NAT2 was slightly exaggerated in the
breast cancer cell lines dataset, the cell lines generally
reflected the NAT1 and NAT2 expression profiles of
the primary breast tumors investigated. The present study
demonstrated that while NAT1 and ESR1 expression were
moderately associated in all datasets included in this study,
NAT2 and ESR1 expression were associated at a lower
magnitude, particularly in the primary breast tumor samples.
NAT1 and ESR1 expression were
increased in primary breast tumor samples compared with normal
breast tissue samples, and were increased in ER+ primary
breast tumors compared with ER− primary breast tumors.
NAT2 expression was slightly increased in primary breast
tumor samples compared with normal breast tissue samples and in
ER+ primary breast tumors compared with ER−
primary breast tumors. Although NAT1 and NAT2 are
both implicated in breast cancer, the majority of previous breast
cancer studies have investigated each isozyme individually. The
present study suggested that both isozymes should be considered in
each study, since both are expressed in breast tissues. Defining
the association between NAT1, NAT2 and ESR1 is
of great importance, as modification of NAT1 is currently
being studied for breast cancer prevention (20,21,55,56).
Funding
The present study was partially supported by US
Public Health Service grants (grant nos. T32-ES011564 and
R25-CA134283).
Availability of data and materials
The CCLE data have been deposited in the Gene
Expression Omnibus (GEO; https://www.ncbi.nlm.nih.gov/geo/) using accession
number GSE36139 and are also available at http://www.broadinstitute.org/ccle. TCGA data portal
can be accessed at https://portal.gdc.cancer.gov/ or via FirebrowseR, an
R client to the Broad Institute’s RESTful Firehose Pipeline.
Authors’ contributions
SMC designed the study, retrieved and analyzed all
data, and prepared all figures in partial fulfilment of her PhD
dissertation carried out under the direction of DWH. Both authors
drafted the manuscript. DWH reviewed, modified and approved the
final manuscript.
Ethics approval and consent to
participate
Not applicable.
Patient consent for publication
Not applicable.
Competing interests
The authors declare that they have no competing
interests.
Acknowledgments
The results published here are in whole or part
based upon data generated by TCGA, managed by the National Cancer
Institute and the National Human Genome Research Institute, and the
CCLE, a collaboration between the Broad Institute and the Novartis
Institutes for Biomedical Research and its Genomics Institute of
the Novartis Research Foundation. Information about TCGA and CCLE
can be found at http://cancergenome.nih.gov and https://portals.broadinstitute.org/ccle,
respectively. Those who carried out the original analysis and
collection of the TCGA and CCLE data bear no responsibility for the
further analysis or interpretation of it presented in this
manuscript. Results of this study represent partial fulfillment of
Samantha M. Carlisle’s PhD in Pharmacology and Toxicology from the
University of Louisville. The authors thank Mr. Patrick J. Trainor,
MS, MA (Department of Medicine, University of Louisville,
Louisville, KY, USA) for his careful review of the manuscript and
insights.
Abbreviations:
|
NAT1
|
arylamine N-acetyltransferase 1
|
|
NAT2
|
arylamine N-acetyltransferase 2
|
|
SNPs
|
single nucleotide polymorphisms
|
|
ESR1
|
estrogen receptor 1
|
|
CCLE
|
Cancer Cell Line Encyclopedia
|
|
TCGA
|
The Cancer Genome Atlas
|
|
ER
|
estrogen receptor
|
|
SMZ
|
sulfamethazine
|
|
PABA
|
p-aminobenzoic acid
|
|
RPKM
|
reads per kilobase of transcript per
million mapped reads
|
|
RSEM
|
RNA-Seq by
Expectation-Maximization
|
|
ρ
|
Spearman correlation coefficient
|
References
|
1
|
Hein DW: Molecular genetics and function
of NAT1 and NAT2: Role in aromatic amine metabolism and
carcinogenesis. Mutat Res. 506–507. 65–77. 2002.
|
|
2
|
Hein DW, Doll MA, Fretland AJ, Leff MA,
Webb SJ, Xiao GH, Devanaboyina US, Nangju NA and Feng Y: Molecular
genetics and epidemiology of the NAT1 and NAT2 acetylation
polymorphisms. Cancer Epidemiol Biomarkers Prev. 9:29–42. 2000.
|
|
3
|
Bendaly J, Zhao S, Neale JR, Metry KJ,
Doll MA, States JC, Pierce WM Jr and Hein DW:
2-Amino-3,8-dimethylimidazo-[4,5-f]quinoxaline-induced DNA adduct
formation and mutagenesis in DNA repair-deficient Chinese hamster
ovary cells expressing human cytochrome 4501A1 and rapid or slow
acetylator N-acetyltransferase 2. Cancer Epidemiol Biomarkers Prev.
16:1503–1509. 2007. View Article : Google Scholar
|
|
4
|
Millner LM, Doll MA, Cai J, States JC and
Hein DW: NATb/NAT1*4 promotes greater arylamine
N-acetyltransferase 1 mediated DNA adducts and mutations than
NATa/NAT1*4 following exposure to 4-aminobiphenyl. Mol
Carcinog. 51:636–646. 2012. View Article : Google Scholar
|
|
5
|
Hein DW: Acetylator genotype and
arylamine-induced carcinogenesis. Biochim Biophys Acta. 948:37–66.
1988.
|
|
6
|
Stepp MW, Mamaliga G, Doll MA, States JC
and Hein DW: Folate-dependent hydrolysis of acetyl-Coenzyme A by
recombinant human and rodent arylamine N-acetyltransferases.
Biochem Biophys Rep. 3:45–50. 2015.
|
|
7
|
Laurieri N, Dairou J, Egleton JE, Stanley
LA, Russell AJ, Dupret JM, Sim E and Rodrigues-Lima F: From
arylamine N-acetyltransferase to folate-dependent acetyl CoA
hydrolase: Impact of folic acid on the activity of (HUMAN)NAT1 and
its homologue (MOUSE)NAT2. PLoS One. 9:e963702014. View Article : Google Scholar
|
|
8
|
Matas N, Thygesen P, Stacey M, Risch A and
Sim E: Mapping AAC1, AAC2 and AACP, the genes for arylamine
N-acetyltransferases, carcinogen metabolising enzymes on human
chromosome 8p22, a region frequently deleted in tumours. Cytogenet
Cell Genet. 77:290–295. 1997. View Article : Google Scholar
|
|
9
|
Hickman D, Risch A, Buckle V, Spurr NK,
Jeremiah SJ, McCarthy A and Sim E: Chromosomal localization of
human genes for arylamine N-acetyltransferase. Biochem J.
297:441–445. 1994. View Article : Google Scholar
|
|
10
|
Grant DM, Blum M, Demierre A and Meyer UA:
Nucleotide sequence of an intronless gene for a human arylamine
N-acetyltransferase related to polymorphic drug acetylation.
Nucleic Acids Res. 17:39781989. View Article : Google Scholar
|
|
11
|
Kawamura A, Graham J, Mushtaq A,
Tsiftsoglou SA, Vath GM, Hanna PE, Wagner CR and Sim E: Eukaryotic
arylamine N-acetyltransferase. Investigation of substrate
specificity by high-throughput screening. Biochem Pharmacol.
69:347–359. 2005. View Article : Google Scholar
|
|
12
|
Vatsis KP and Weber WW: Structural
heterogeneity of Caucasian N-acetyltransferase at the NAT1 gene
locus. Arch Biochem Biophys. 301:71–76. 1993. View Article : Google Scholar
|
|
13
|
Weber WW and Vatsis KP: Individual
variability in p-aminobenzoic acid N-acetylation by human
N-acetyltransferase (NAT1) of peripheral blood. Pharmacogenetics.
3:209–212. 1993. View Article : Google Scholar
|
|
14
|
Grant DM, Hughes NC, Janezic SA,
Goodfellow GH, Chen HJ, Gaedigk A, Yu VL and Grewal R: Human
acetyltransferase polymorphisms. Mutat Res. 376:61–70. 1997.
View Article : Google Scholar
|
|
15
|
Cloete R, Akurugu WA, Werely CJ, van
Helden PD and Christoffels A: Structural and functional effects of
nucleotide variation on the human TB drug metabolizing enzyme
arylamine N-acetyltransferase 1. J Mol Graph Model. 75:330–339.
2017. View Article : Google Scholar
|
|
16
|
McDonagh EM, Boukouvala S, Aklillu E, Hein
DW, Altman RB and Klein TE: PharmGKB summary: Very important
pharmacogene information for N-acetyltransferase 2. Pharmacogenet
Genomics. 24:409–425. 2014.
|
|
17
|
Butcher NJ, Boukouvala S, Sim E and
Minchin RF: Pharmacogenetics of the arylamine N-acetyltransferases.
Pharmacogenomics J. 2:30–42. 2002. View Article : Google Scholar
|
|
18
|
Tiang JM, Butcher NJ and Minchin RF:
Effects of human arylamine N-acetyltransferase I knockdown in
triple-negative breast cancer cell lines. Cancer Med. 4:565–574.
2015. View Article : Google Scholar
|
|
19
|
Tiang JM, Butcher NJ, Cullinane C, Humbert
PO and Minchin RF: RNAi-mediated knock-down of arylamine
N-acetyltransferase-1 expression induces E-cadherin up-regulation
and cell-cell contact growth inhibition. PLoS One. 6:e170312011.
View Article : Google Scholar
|
|
20
|
Tiang JM, Butcher NJ and Minchin RF: Small
molecule inhibition of arylamine N-acetyltransferase Type I
inhibits proliferation and invasiveness of MDA-MB-231 breast cancer
cells. Biochem Biophys Res Commun. 393:95–100. 2010. View Article : Google Scholar
|
|
21
|
Stepp MW, Doll MA, Carlisle SM, States JC
and Hein DW: Genetic and small molecule inhibition of arylamine
N-acetyltransferase 1 reduces anchorage-independent growth in human
breast cancer cell line MDA-MB-231. Mol Carcinog. 57:549–558. 2018.
View Article : Google Scholar
|
|
22
|
Stepp MW, Doll MA, Samuelson DJ, Sanders
MA, States JC and Hein DW: Congenic rats with higher arylamine
N-acetyltransferase 2 activity exhibit greater carcinogen-induced
mammary tumor susceptibility independent of carcinogen metabolism.
BMC Cancer. 17:2332017. View Article : Google Scholar
|
|
23
|
Carlisle SM, Trainor PJ, Yin X, Doll MA,
Stepp MW, States JC, Zhang X and Hein DW: Untargeted polar
metabolomics of transformed MDA-MB-231 breast cancer cells
expressing varying levels of human arylamine N-acetyltransferase 1.
Metabolomics. 12:1112016. View Article : Google Scholar
|
|
24
|
Witham KL, Minchin RF and Butcher NJ: Role
for human arylamine N-acetyltransferase 1 in the methionine salvage
pathway. Biochem Pharmacol. 125:93–100. 2017. View Article : Google Scholar
|
|
25
|
Perou CM, Jeffrey SS, van de Rijn M, Rees
CA, Eisen MB, Ross DT, Pergamenschikov A, Williams CF, Zhu SX and
Lee JC: Distinctive gene expression patterns in human mammary
epithelial cells and breast cancers. Proc Natl Acad Sci USA.
96:9212–9217. 1999. View Article : Google Scholar
|
|
26
|
Zhao H, Langerød A, Ji Y, Nowels KW,
Nesland JM, Tibshirani R, Bukholm IK, Kåresen R, Botstein D and
Børresen-Dale AL: Different gene expression patterns in invasive
lobular and ductal carcinomas of the breast. Mol Biol Cell.
15:2523–2536. 2004. View Article : Google Scholar
|
|
27
|
Wang Y, Klijn JG, Zhang Y, Sieuwerts AM,
Look MP, Yang F, Talantov D, Timmermans M, Meijer-van Gelder ME and
Yu J: Gene-expression profiles to predict distant metastasis of
lymph-node-negative primary breast cancer. Lancet. 365:671–679.
2005. View Article : Google Scholar
|
|
28
|
Wakefield L, Robinson J, Long H, Ibbitt
JC, Cooke S, Hurst HC and Sim E: Arylamine N-acetyltransferase 1
expression in breast cancer cell lines: A potential marker in
estrogen receptor-positive tumors. Genes Chromosomes Cancer.
47:118–126. 2008. View Article : Google Scholar
|
|
29
|
Tozlu S, Girault I, Vacher S, Vendrell J,
Andrieu C, Spyratos F, Cohen P, Lidereau R and Bieche I:
Identification of novel genes that co-cluster with estrogen
receptor alpha in breast tumor biopsy specimens, using a
large-scale real-time reverse transcription-PCR approach. Endocr
Relat Cancer. 13:1109–1120. 2006. View Article : Google Scholar
|
|
30
|
Abba MC, Hu Y, Sun H, Drake JA, Gaddis S,
Baggerly K, Sahin A and Aldaz CM: Gene expression signature of
estrogen receptor alpha status in breast cancer. BMC Genomics.
6:372005. View Article : Google Scholar
|
|
31
|
Bièche I, Girault I, Urbain E, Tozlu S and
Lidereau R: Relationship between intratumoral expression of genes
coding for xenobiotic-metabolizing enzymes and benefit from
adjuvant tamoxifen in estrogen receptor alpha-positive
postmenopausal breast carcinoma. Breast Cancer Res. 6:R252–R263.
2004. View
Article : Google Scholar
|
|
32
|
Zhang X, Carlisle SM, Doll MA, Martin RCG,
States JC, Klinge CM and Hein DW: High N-acetyltransferase 1
expression is associated with estrogen receptor expression in
breast tumors, but is not under direct regulation by estradiol,
5α-androstane-3β,17β-diol, or dihydrotestosterone in breast cancer
cells. J Pharmacol Exp Ther. 365:84–93. 2018. View Article : Google Scholar
|
|
33
|
Ambrosone CB, Kropp S, Yang J, Yao S,
Shields PG and Chang-Claude J: Cigarette smoking,
N-acetyltransferase 2 genotypes, and breast cancer risk: Pooled
analysis and meta-analysis. Cancer Epidemiol Biomarkers Prev.
17:15–26. 2008. View Article : Google Scholar
|
|
34
|
Sadrieh N, Davis CD and Snyderwine EG:
N-acetyltransferase expression and metabolic activation of the
food-derived heterocyclic amines in the human mammary gland. Cancer
Res. 56:2683–2687. 1996.
|
|
35
|
Husain A, Zhang X, Doll MA, States JC,
Barker DF and Hein DW: Identification of N-acetyltransferase 2
(NAT2) transcription start sites and quantitation of NAT2-specific
mRNA in human tissues. Drug Metab Dispos. 35:721–727. 2007.
View Article : Google Scholar
|
|
36
|
Lee JH, Chung JG, Lai JM, Levy GN and
Weber WW: Kinetics of arylamine N-acetyltransferase in tissues from
human breast cancer. Cancer Lett. 111:39–50. 1997. View Article : Google Scholar
|
|
37
|
Husain A, Barker DF, States JC, Doll MA
and Hein DW: Identification of the major promoter and non-coding
exons of the human arylamine N-acetyltransferase 1 gene (NAT1).
Pharmacogenetics. 14:397–406. 2004. View Article : Google Scholar
|
|
38
|
Geylan YS, Dizbay S and Güray T: Arylamine
N-acetyltransferase activities in human breast cancer tissues.
Neoplasma. 48:108–111. 2001.
|
|
39
|
Geylan-Su YS, Isgör B, Coban T, Kapucuoglu
N, Aydintug S, Iscan M, Iscan M and Güray T: Comparison of NAT1,
NAT2 and GSTT2-2 activities in normal and neoplastic human breast
tissues. Neoplasma. 53:73–78. 2006.
|
|
40
|
Deitz AC: N-acetyltransferase genetic
polymorphisms and breast cancer risk. In: PhD dissertation.
University of North Dakota; 1999
|
|
41
|
Jefferson FA, Xiao GH and Hein DW:
4-Aminobiphenyl downregulation of NAT2 acetylator
genotype-dependent N- and O-acetylation of aromatic and
heterocyclic amine carcinogens in primary mammary epithelial cell
cultures from rapid and slow acetylator rats. Toxicol Sci.
107:293–297. 2009. View Article : Google Scholar
|
|
42
|
Bradshaw TD, Chua MS, Orr S, Matthews CS
and Stevens MF: Mechanisms of acquired resistance to
2-(4-aminophenyl)benzothiazole (CJM 126, NSC 34445). Br J Cancer.
83:270–277. 2000. View Article : Google Scholar
|
|
43
|
Barretina J, Caponigro G, Stransky N,
Venkatesan K, Margolin AA, Kim S, Wilson CJ, Lehár J, Kryukov GV
and Sonkin D: The Cancer Cell Line Encyclopedia enables predictive
modelling of anticancer drug sensitivity. Nature. 483:603–607.
2012. View Article : Google Scholar
|
|
44
|
Weinstein JN, Collisson EA, Mills GB, Shaw
KR, Ozenberger BA, Ellrott K, Shmulevich I, Sander C and Stuart JM;
Cancer Genome Atlas Research Network: The Cancer Genome Atlas
Pan-Cancer analysis project. Nat Genet. 45:1113–1120. 2013.
View Article : Google Scholar
|
|
45
|
Deng M, Bragelmann J, Kryukov I,
Saraiva-Agostinho N and Perner S: FirebrowseR: an R client to the
Broad Institute’s Firehose Pipeline. Database (Oxford) 2017.
baw1602017. View Article : Google Scholar
|
|
46
|
Dai X, Cheng H, Bai Z and Li J: Breast
cancer cell line classification and its relevance with breast tumor
subtyping. J Cancer. 8:3131–3141. 2017. View Article : Google Scholar
|
|
47
|
American Type Culture Collection (ATCC©):
Breast cancer and normal cell lines. 2013, https://www.atcc.org/~/media/PDFs/Cancer%20and%20Normal%20cell%20lines%20tables/Breast%20cancer%20and%20normal%20cell%20lines.ashx.
Accessed Feb 2, 2018.
|
|
48
|
Kao J, Salari K, Bocanegra M, Choi YL,
Girard L, Gandhi J, Kwei KA, Hernandez-Boussard T, Wang P, Gazdar
AF, et al: Molecular profiling of breast cancer cell lines defines
relevant tumor models and provides a resource for cancer gene
discovery. PLoS One. 4:e61462009. View Article : Google Scholar
|
|
49
|
R Core Team: R: A language and environment
for statistical computing. R Foundation for Statistical Computing;
Vienna, Austria: 2017, http://www.R-project.org/.
Accessed Dec 15, 2017.
|
|
50
|
Capes-Davis A, Theodosopoulos G, Atkin I,
Drexler HG, Kohara A, MacLeod RA, Masters JR, Nakamura Y, Reid YA
and Reddel RR: Check your cultures! A list of cross-contaminated or
misidentified cell lines. Int J Cancer. 127:1–8. 2010. View Article : Google Scholar
|
|
51
|
Thorpe SM: Estrogen and progesterone
receptor determinations in breast cancer. Technology, biology and
clinical significance Acta Oncol. 27:1–19. 1988.
|
|
52
|
Williams JA, Stone EM, Fakis G, Johnson N,
Cordell JA, Meinl W, Glatt H, Sim E and Phillips DH:
N-Acetyltransferases, sulfotransferases and heterocyclic amine
activation in the breast. Pharmacogenetics. 11:373–388. 2001.
View Article : Google Scholar
|
|
53
|
AbuHammad S and Zihlif M: Gene expression
alterations in doxorubicin resistant MCF7 breast cancer cell line.
Genomics. 101:213–220. 2013. View Article : Google Scholar
|
|
54
|
Hein DW: N-acetyltransferase 2
polymorphism and human urinary bladder and breast cancer risks.
Arylamine N-Acetyltransferases in Health and Disease: From
Pharmacogenetics to Drug Discovery and Diagnostics. Laurieri N and
Sim E: World Scientific Publishing; Singapore: pp. 327–349. 2018,
View Article : Google Scholar
|
|
55
|
Butcher NJ and Minchin RF: Arylamine
N-acetyltransferase 1: A novel drug target in cancer development.
Pharmacol Rev. 64:147–165. 2012. View Article : Google Scholar
|
|
56
|
Laurieri N, Egleton JE and Russell AJ:
Human N-acetyltransferase type 1 and breast cancer. Arylamine
N-Acetyltransferases in Health and Disease: From Pharmacogenetics
to Drug Discovery and Diagnostics. Laurieri N and Sim E: World
Scientific Publishing; Singapore: pp. 351–384. 2018, View Article : Google Scholar
|