Introduction
Colorectal cancer is one of the most common
malignancies of the digestive system worldwide. However, the
majority of the patients in China are at an advanced stage at
initial diagnosis (1), therefore,
adjuvant chemotherapy is required in a number of cases. Currently,
folinic acid, 5-fluorouracil and oxaliplatin (FOLFOX) is the
first-line chemotherapeutic regimen for colorectal cancer. However,
a number of patients eventually succumb to the disease due to
resistance to chemotherapeutic drugs (2,3).
Therefore, to prolong the survival of patients with colorectal
cancer, it is crucial to determine the mechanism underlying the
development of drug resistance and find an effective treatment
method to increase drug sensitivity.
The Golgi phosphorylated protein (GOLPH)3 gene,
which is located on chromosome 5p13, encodes a ~34-kDa protein of
the Golgi complex. Previous research demonstrated that GOLPH3 is a
proto-oncogene (4–7). Previous studies by the authors
revealed that GOLPH3 mRNA was overexpressed in colorectal cancer
tissues and may promote the proliferation of colon cancer cells
through activating the phosphoinositide 3-kinase/Akt/mechanistic
target of rapamycin kinase and Wnt/β-catenin signaling pathways
in vitro. Furthermore, the overexpression of GOLPH3 may
serve as an important marker for predicting poor prognosis in
colorectal cancer (8–10). To the best of our knowledge,
GOLPH3-associated resistance to chemotherapy and its underlying
mechanism in human colon cancer have not been previously
reported.
Based on previous research on the association
between the overexpression of GOLPH3 and colorectal cancer, it was
hypothesized that the overexpression of GOLPH3 may be involved in
the resistance of colon cancer cells to platinum-based
chemotherapy. Therefore, the aim of the present study was to
investigate the effects of overexpressing GOLPH3 on resistance to
cisplatin in HT29 human colon cancer cells, and the underlying
mechanism by siRNA transfection and in a nude mouse tumor
transplantation model.
Materials and methods
Cell lines and culture
The human colorectal cancer cell line, HT29, was
purchased from the Cell Bank of Type Culture Collection of the
Chinese Academy of Sciences (Shanghai, China). The cells were
cultured in RPMI-1640 medium (Beijing Solarbio Science &
Technology Co., Ltd., Beijing, China) supplemented with 10% fetal
bovine serum in 5% CO2 at 37°C. The cells were harvested
in the logarithmic growth phase.
Selection of cisplatin concentration
HT29 cells were divided into four groups according
to cisplatin concentration (0, 2.5, 5 and 10 µM). Cisplatin
was obtained from Shandong Qilu Pharmaceutical Factory (Shandong,
China).
Cell grouping
HT29 cells were divided into five groups as follows:
Control group; transfection group and experimental groups 1, 2 and
3. The cells in the control group were untreated. In the
transfection group, the cells were transfected with 50 nM
siRNA-GOLPH3 (Zimmer AG, Shanghai, China). Group 1 consisted of
HT29 cells that were treated with cisplatin. Group 2 comprised
siRNA-GOLPH3-transfected HT29 cells that were treated with
cisplatin. Group 3 involved HT29 cells that were treated with
cisplatin and 50 µM extracellular signal-regulated kinase
(ERK)1/2 inhibitor PD98059 (Cell Signaling Technology Inc.,
Danvers, MA, USA). Each experimental group was maintained in
RPMI-1640 containing 10 µM cisplatin for 24 h at 37°C.
RNA extraction and reverse
transcription-quantitative polymerase chain reaction (RT-qPCR)
The expression of GOLPH3 mRNA in the control and
siRNA transfection groups was assessed. Total RNA was extracted
from cultured cells using TRIzol reagent (Invitrogen, Thermo Fisher
Scientific, Inc., Waltham, MA, USA). Total RNA (2 µg) from
each sample was reverse transcribed into cDNA using the SuperScript
III Reverse Transcriptase kit (Invitrogen, Thermo Fisher
Scientific, Inc.) according to the manufacturer's instructions.
RT-qPCR was performed using the SYBR Ex Taq kit (Takara Bio, Inc.,
Otsu, Japan) and the ABI 9700 RT-qPCR detection system (Applied
Biosystems; Thermo Fisher Scientific, Inc.). The RT-qPCR conditions
were initial denaturation for 20 sec at 95°C, followed by 45 cycles
at 95°C for 10 sec, annealing at 60°C for 20 sec and extension for
20 sec at 72°C. All PCR primers were synthesized by Zimmer AG. The
primer sequences for each gene were as follows: GOLPH3 forward,
5′-AGGGCGACTCCAAGGAAA-3′ and reverse, 5′-TGATGTGTAACCCTCGCG-3′ and
GAPDH forward, 5′-GGTCATAAGCTTGCGTTGATTAAG-3′ and reverse,
5′-CTACGGAAACCTTGTTACGACTTT-3′. Using GAPDH as an internal
reference, the relative expression level was calculated with the
2−ΔΔCq method.
Cell proliferation (MTT) assay
The cells were seeded into 96-well plates at a
density of 105 cells/well and maintained for 24 h at
37°C in an anchorage-dependent manner. Next, four double cells were
set up in each group, and four control wells that only contained
cells without any other treatment were set up in each group. After
a 48-h culture, 10 µl 5 mg/ml MTT (Sigma-Aldrich; Merck
KGaA, Darmstadt, Germany) was added to each well, followed by
further culture for 4 h, after which time the culture medium was
discarded. A total of 150 µl DMSO (Sigma-Aldrich; Merck
KGaA) was added to each well, and the wells were mixed by
oscillation in the dark. OD490 was measured with a
microplate reader (Huadong Electronics, Nanjing, China). The
aforementioned procedure was repeated three times. The following
formula was used: Rate of growth inhibition in cancer cells = (1 −
mean OD490 in treatment groups/mean OD490 in
control groups) ×100%.
Colony formation assay
The cells in the logarithmic growth phase were
inoculated into 6-well plates (500 cells/well) containing complete
culture medium. The medium was changed every 3 days over the next 3
weeks. Once the colonies became visible, the culture was
terminated, and the cells were washed with PBS and fixed in 100%
methanol. After staining with 0.5% crystal violet dye for 30 min,
the cells were washed three times with PBS, and the colonies
(>50 cells) were counted under an inverted microscope. The
aforementioned steps were repeated three times, and the mean cell
count was calculated.
Tumor sphere formation assay
HT29 cells were trypsinized, and then single
dispersed cells were suspended in DMEM-F12 (Sigma-Aldrich; Merck
KGaA) containing 20 ng/ml basic fibroblast growth factor, 20 ng/ml
epidermal growth factor (PeproTech, Rocky Hill, NJ, USA), B27 and 5
µg/ml insulin, and were subsequently seeded onto 24-well
ultra-low attachment plates (1,000 cells/well). The cells were then
incubated at 37°C in DMEM-F12 for 6–7 days and supplemented with
fresh medium every 2–3 days. Finally, the visible spheres were
counted and images were captured (magnification, ×200; Olympus
Corporation, Tokyo, Japan).
Apoptotic (Annexin V) assay
The culture medium was centrifuged at 1,000 × g for
5 min. The supernatant was discarded, and the cells were
resuspended gently in PBS. A total of 5–10 million resuspended
cells were centrifuged at 1,000 × g for 5 min, and the supernatant
was discarded. The cells were resuspended in a mixture containing
195 µl Annexin binding buffer, 5 µl Pacific Blue
Annexin V (Beckman Coulter, Inc., Brea, CA, USA) and 10 µl
propidium iodide (PI; Sigma-Aldrich; Merck KGaA) working solution
for 10–20 min at room temperature, placed in an ice bath and
detected by flow cytometry (FC500; Beckman Coulter, Inc.).
Western blot analysis
Each cell line in the logarithmic growth phase was
washed with PBS. The cells were lysed in RIPA lysis
buffer(containing 50 mM Tris-HCl, pH 7.4, 150 Mm NaCl, 0.1% SDS, 1
mM EDTA, 1% Triton X-100, 1 mM PMSF, and 1 mM protease inhibitor
cocktail) for 20 min on ice with occasional vortex mixing. The
concentration of the proteins was determined using a BCA assay kit
(Wegene Bio, Shanghai, China). The protein lysates (30 µg
per lane) were separated by 10% SDS-PAGE and transferred
electrophoretically to nitrocellulose membranes (Beijing Solarbio
Science & Technology Co., Ltd.). The membranes were blocked in
phosphate-buffered saline with 0.1% Tween-20 (PBST) plus 3% BSA
(Sigma-Aldrich; Merck KGaA) for 1 h at room temperature. The blots
were incubated with antibodies against GOLPH3 (1:1,000; catalog no.
ab 98023); P-glycoprotein (p-gp; 1:500; catalog no. ab 103477)
(both from Abcam, Cambridge, UK); β-catenin (1:500; catalog no.
sc-59737; Santa Cruz Biotechnology, Inc., Dallas, TX, USA); ERK1/2
(1:500; catalog no. ab 17942); pERK1/2 (1:500; catalog no. ab
65142) (both from Abcam); GAPDH (1:1,000; catalog no. sc-365062);
and β-actin (1:1,000; catalog no. sc-47778) (both from Santa Cruz
Biotechnology, Inc.) at 4°C overnight. The membranes were washed
and incubated with horseradish peroxidase-conjugated secondary
antibodies (both 1:5,000; catalog nos. sc-516102 and sc-2357,
respectively; Santa Cruz Biotechnology, Inc.) for 1 h at room
temperature. The bands were visualized with a chemiluminescence
detection kit (catalog no. 32109; Thermo Fisher Scientific, Inc.),
and the results were analyzed with ImageJ software (version 1.48;
National Institutes of Health, Bethesda, MD, USA). The relative
intensity of the target protein was calculated as gray value of the
target band/gray value of the GAPDH (or β-actin) band. GAPDH (or
β-actin) was used as a loading control. All experiments were
performed independently in triplicate.
Nude mouse tumorigenicity assay
A total of 16 Balb/c nude mice (6 weeks old) were
purchased from Beijing Vital River Laboratory Animal Technology
Company (Beijing, China). All animal experiments were approved by
the Animal Experimental Ethics Committee of China Three Gorges
University (ethics approval no. 2016070A; Yichang, Hubei, China).
All mice were free to eat and drink, and the temperature was kept
at 22±2°C with a humidity of 50–60%. The lighting was controlled in
the room with alternating cycles of 12 h-light (8:00–20:00) and 12
h-darkness (20:00–8:00). All experimental procedures involving
animals were performed in accordance with the Guide for the Care
and Use of Laboratory Animals and conformed to the institutional
ethical guidelines for animal experimentation. Nude mice were
handled and cared for at the Experimental Animal Center of China
Three Gorges University.
The female nude mice (16–17 g) were randomly divided
into four groups (n=4/group) as follows: Control group,
transfection group and experimental groups 1 and 2. The control
group consisted of mice that were xenografted with HT29 cells. The
transfection group comprised mice that were xenografted with
siRNA-GOLPH3-transfected HT29 cells. Group 1 involved mice that
were xenografted with HT29 cells and injected intraperitoneally
with cisplatin. Group 2 consisted of mice that were xenografted
with siRNA-GOLPH3-transfected HT29 cells and injected
intraperitoneally with cisplatin. The cells were trypsinized,
collected by centrifugation (400 × g for 5 min at 4°C) and
suspended in PBS. Subsequently, 0.2 ml of DMEM (Shanghai Biotend
Biotechnology, Shanghai, China) containing 107 cells was
injected subcutaneously into the axillary region of each mouse. The
mice were housed in a pathogen-free environment. When an
appreciable tumor had formed subcutaneously at 7 days after
injection, each nude mouse was weighed. Nude mice in experimental
groups 1 and 2 received an intraperitoneal injection of cisplatin
(3 mg/kg, every 3 days), while nude mice in the control and
transfection groups were treated with normal saline instead of
cisplatin. Tumor growth was monitored every 3 days, and tumor
volume was calculated using the formula, V = 0.5 ab2,
where 'a' and 'b' are the length and width of the tumor,
respectively, measured with a sliding caliper. The mice were
sacrificed after 30 days, and the tumors were resected and
weighed.
Statistical analysis
SPSS software (version 19.0; SPSS, Inc., Chicago,
IL, USA) was used for statistical analysis. Numerical data are
expressed as the mean ± standard deviation. The Student's t-test
was used to compare each experimental group with the control group.
The differences between experimental groups were compared by
one-way analysis of variance. The differences between paired
experimental groups were compared by the Least Significant
Difference t-test. Statistical significance was set at
P<0.05.
Results
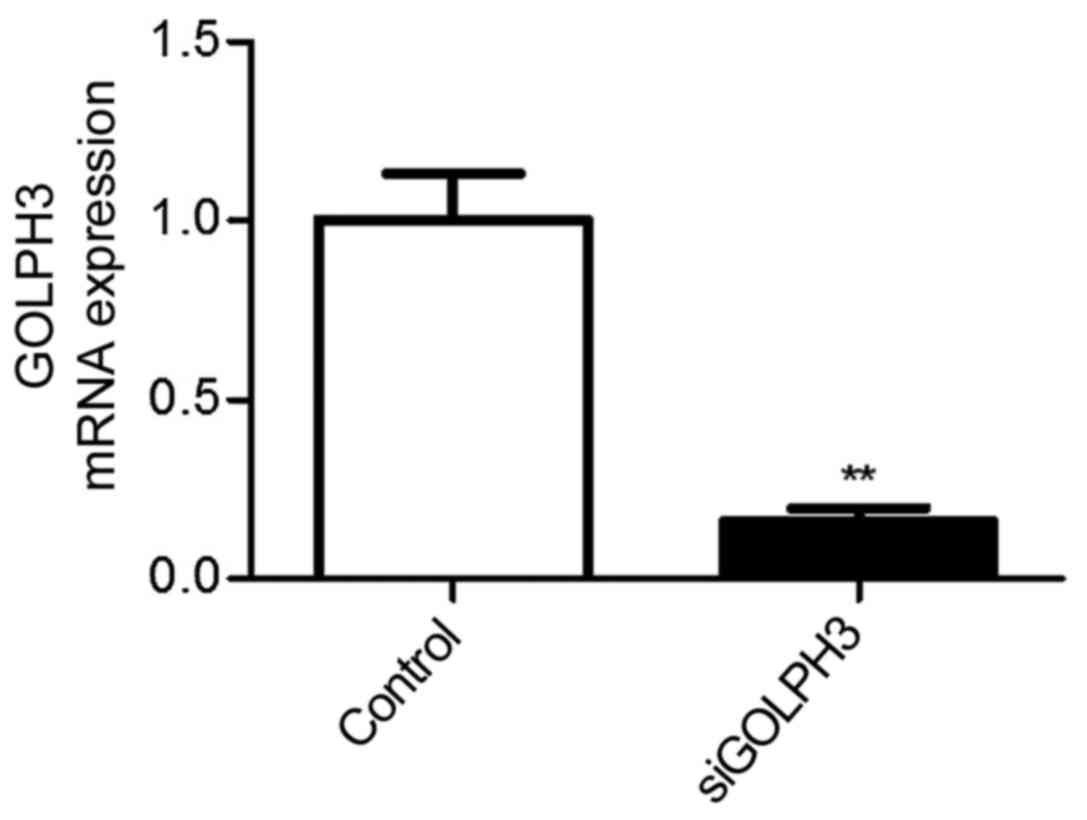
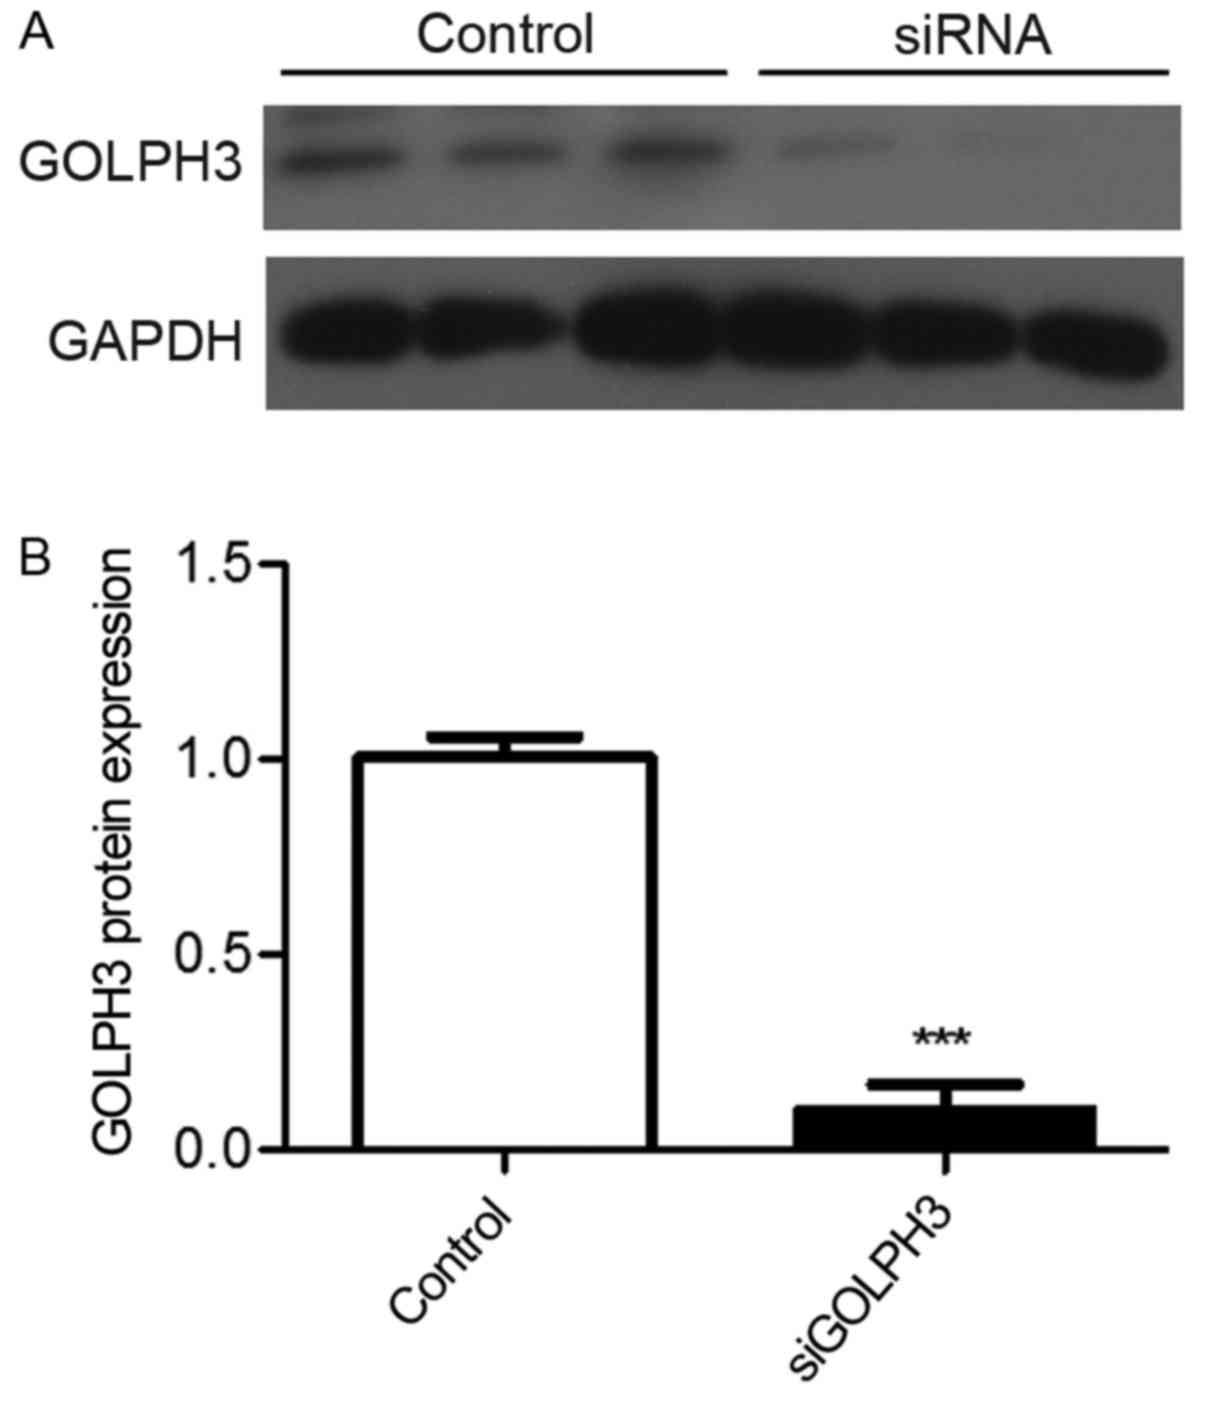
Detection of GOLPH3 expression in
transfected HT29 cells
Compared with the control group (HT29 cells)
(1.002±0.223), the expression of GOLPH3 mRNA in the siRNA-GOLPH3
transfection group (0.162±0.062) significantly decreased
(P<0.01). Western blotting revealed that the GOLPH3 expression
in the control and transfection groups was 1.003±0.094 and
0.099±0.112, respectively, and the difference was statistically
significant (P<0.001), confirming the transfection efficiency
(Figs. 1 and 2).
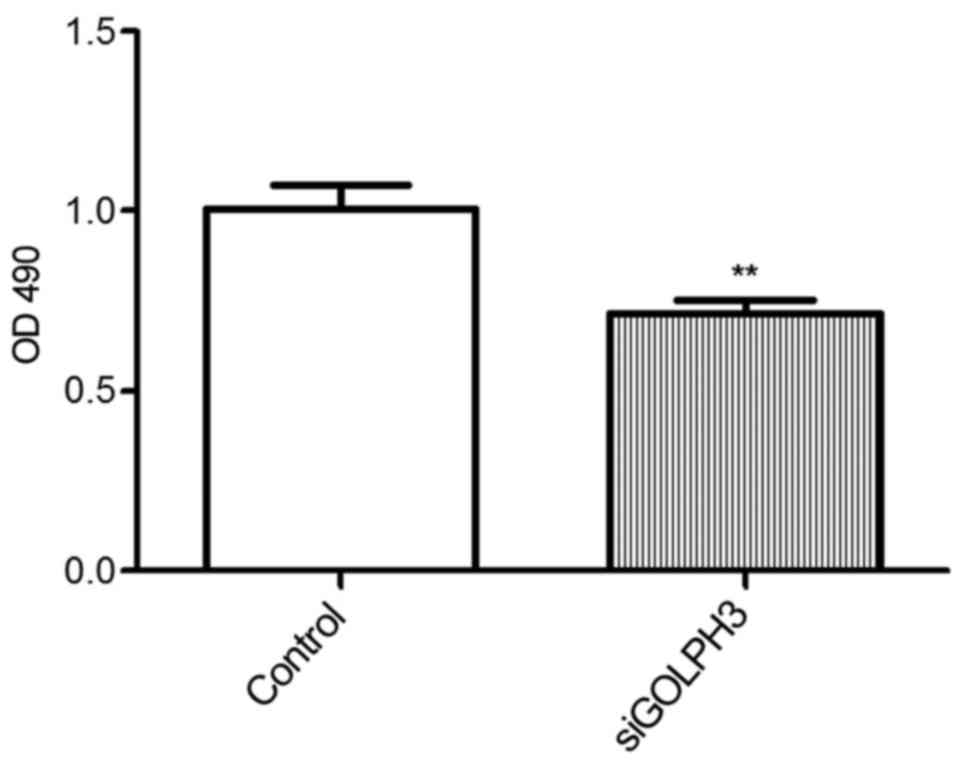
Detection of cell proliferation and
tumorigenicity in the transfection group
The OD490 value of the transfection group
(0.715±0.074) was significantly lower compared with the control
group (1.007±0.130) as demonstrated by the MTT assay (P<0.01).
This indicated that the proliferation of HT29 cells significantly
decreased following the silencing of GOLPH3 mRNA expression
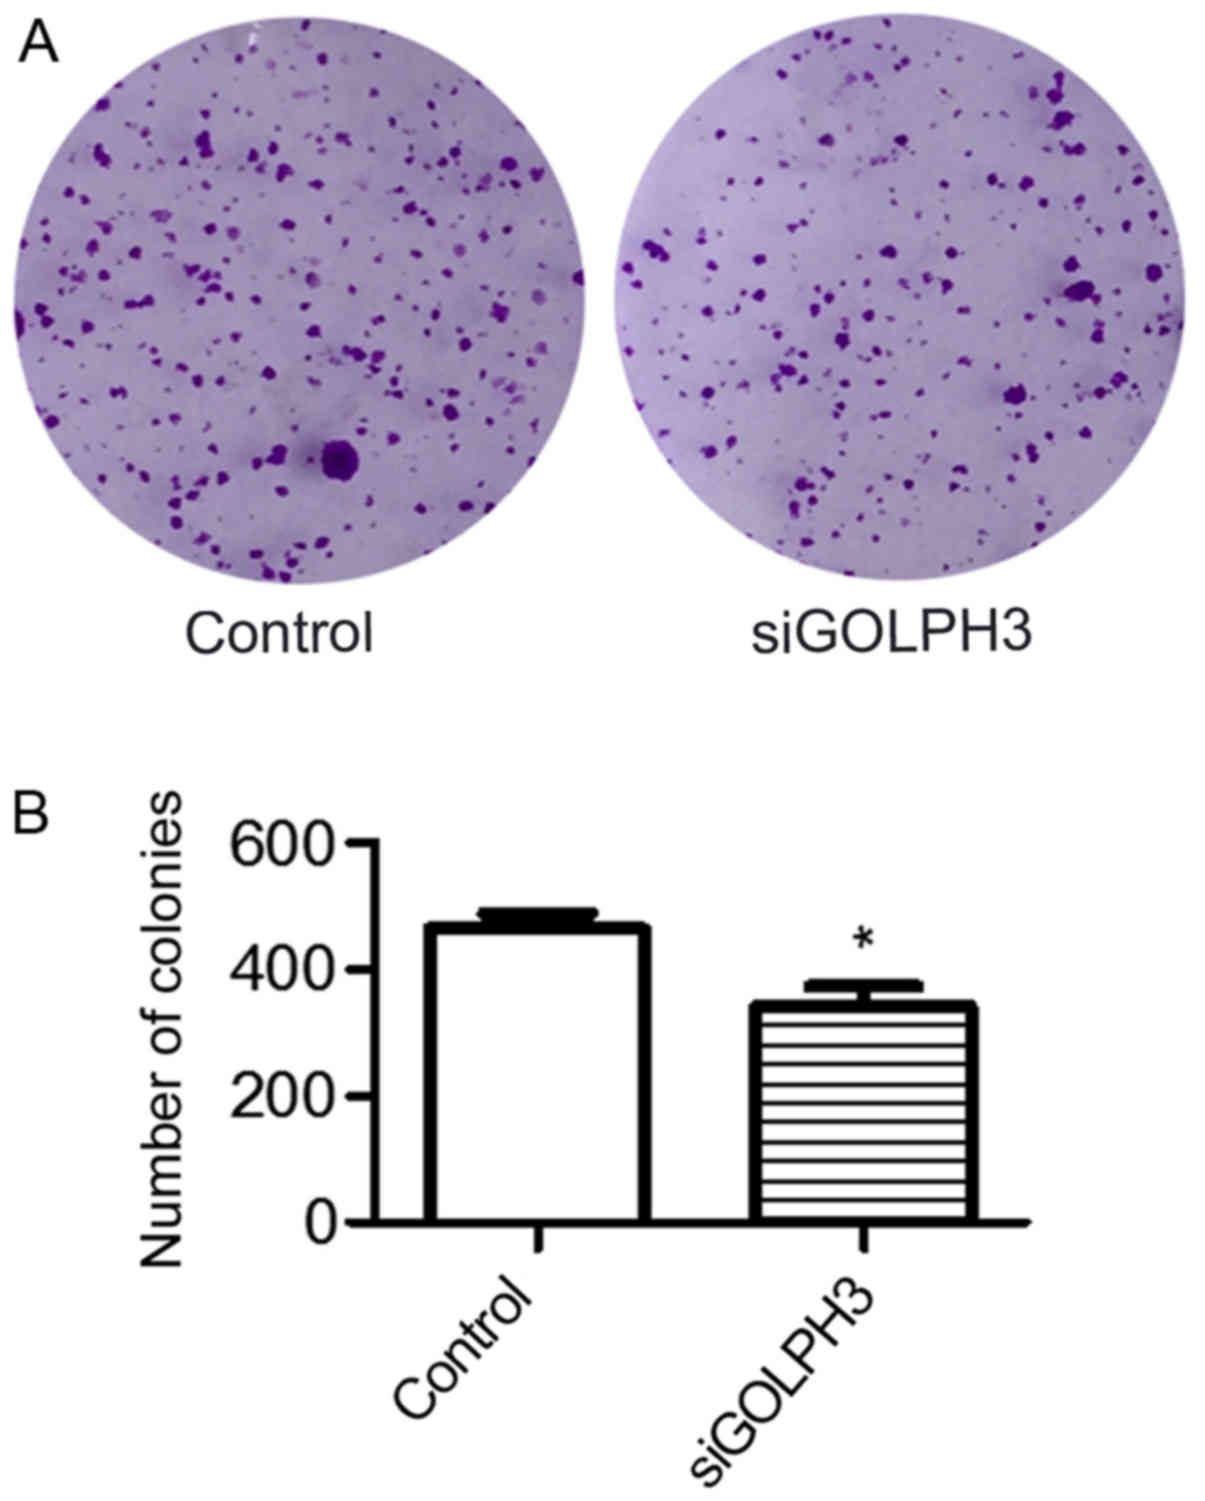
(Fig. 3). The colony formation
assay demonstrated that the number of colonies in the control group
(463.300±43.020) was significantly higher compared with the
transfection group (341.700±54.930) (P<0.05), indicating that
silencing GOLPH3 mRNA expression significantly reduced the
tumorigenicity of HT29 cells (Fig.
4).
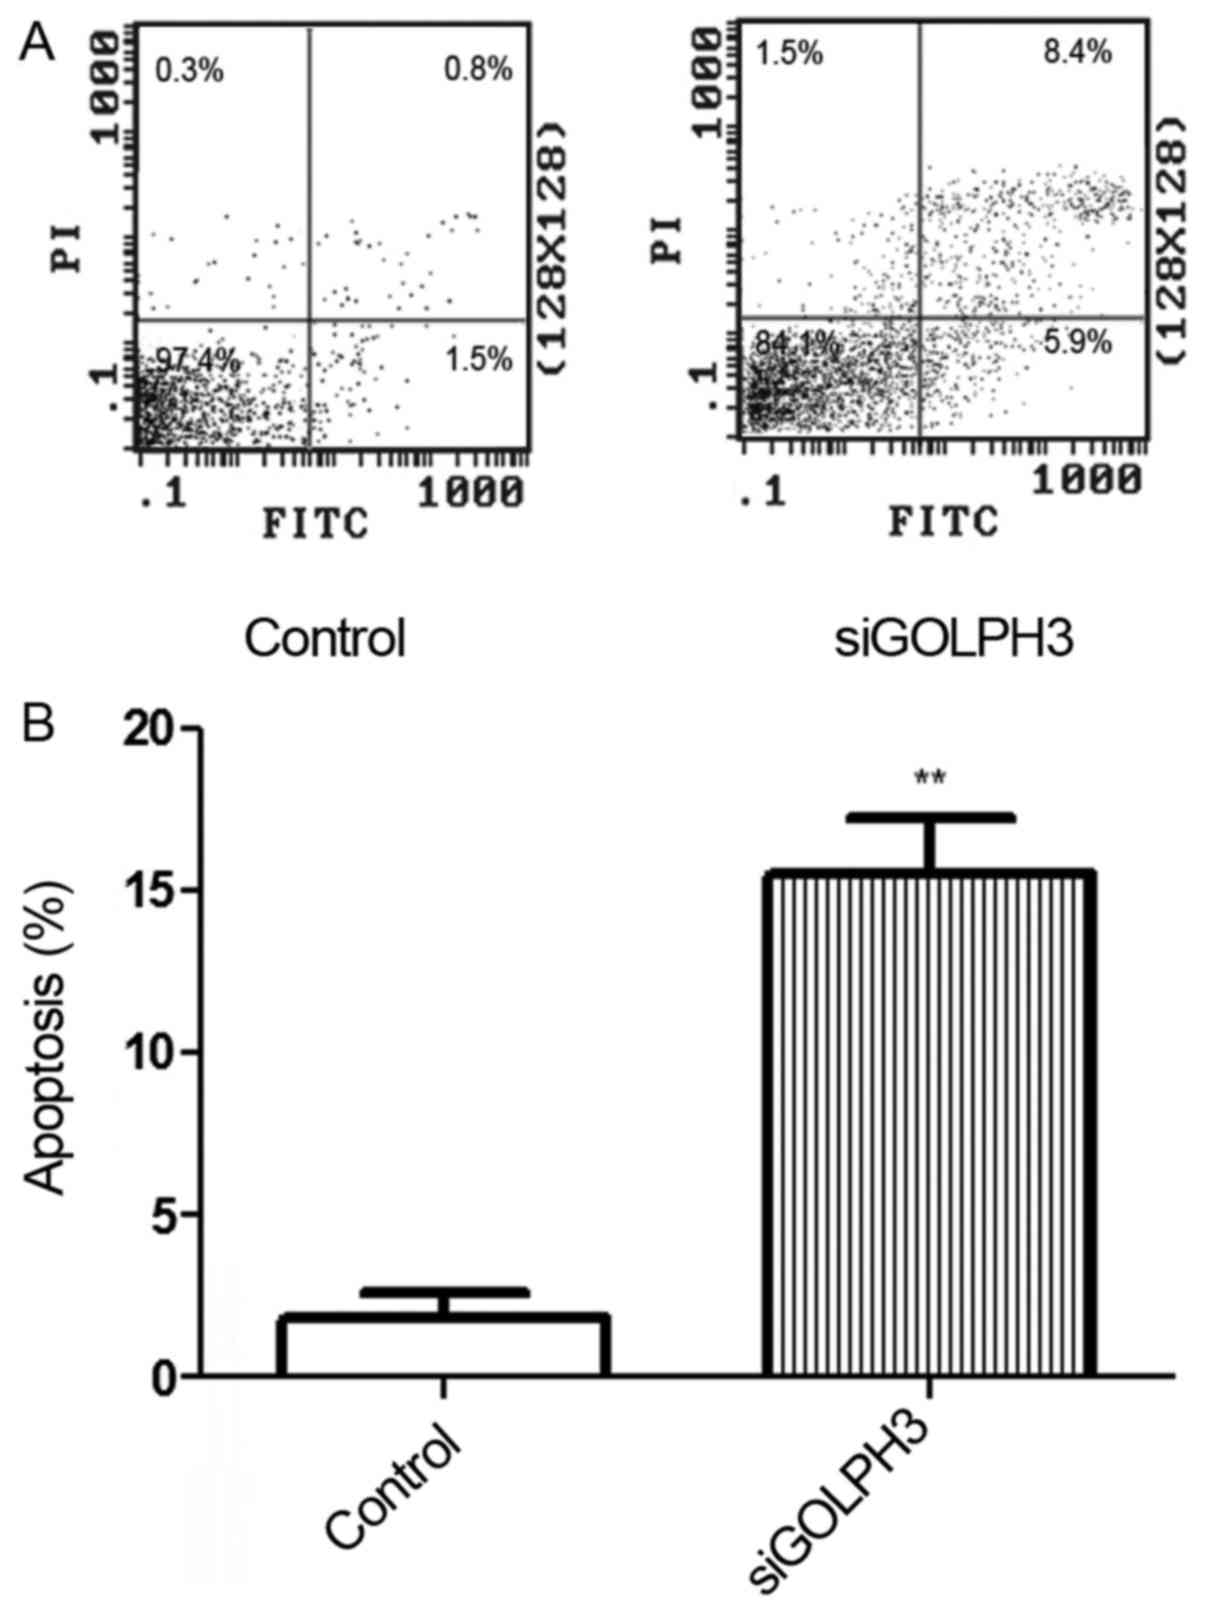
Detection of apoptosis in the
transfection group
The apoptosis rate of the transfection group
(15.520±2.921%) was significantly higher compared with the control
group (1.843±1.298%), as shown by flow cytometry with Annexin
V-fluorescein isothiocyanate (FITC)/PI (P<0.01) (Fig. 5). This finding also indicated that
the GOLPH3 gene was effectively silenced.
Involvement of the GOLPH3 in the
resistance of HT29 cells to cisplatin
Compared with the control group, an increasing
concentration of cisplatin (2.5, 5 and 10 µM) increased the
expression of GOLPH3, P-gp, β-catenin and pERK1/2 in HT29 cells
(Fig. 6 and Table I). The difference in protein
expression levels was most significant between the 10 µM
cisplatin treatment group and the control group (P<0.01).
Therefore, 10 µM cisplatin was selected for subsequent
experiments.
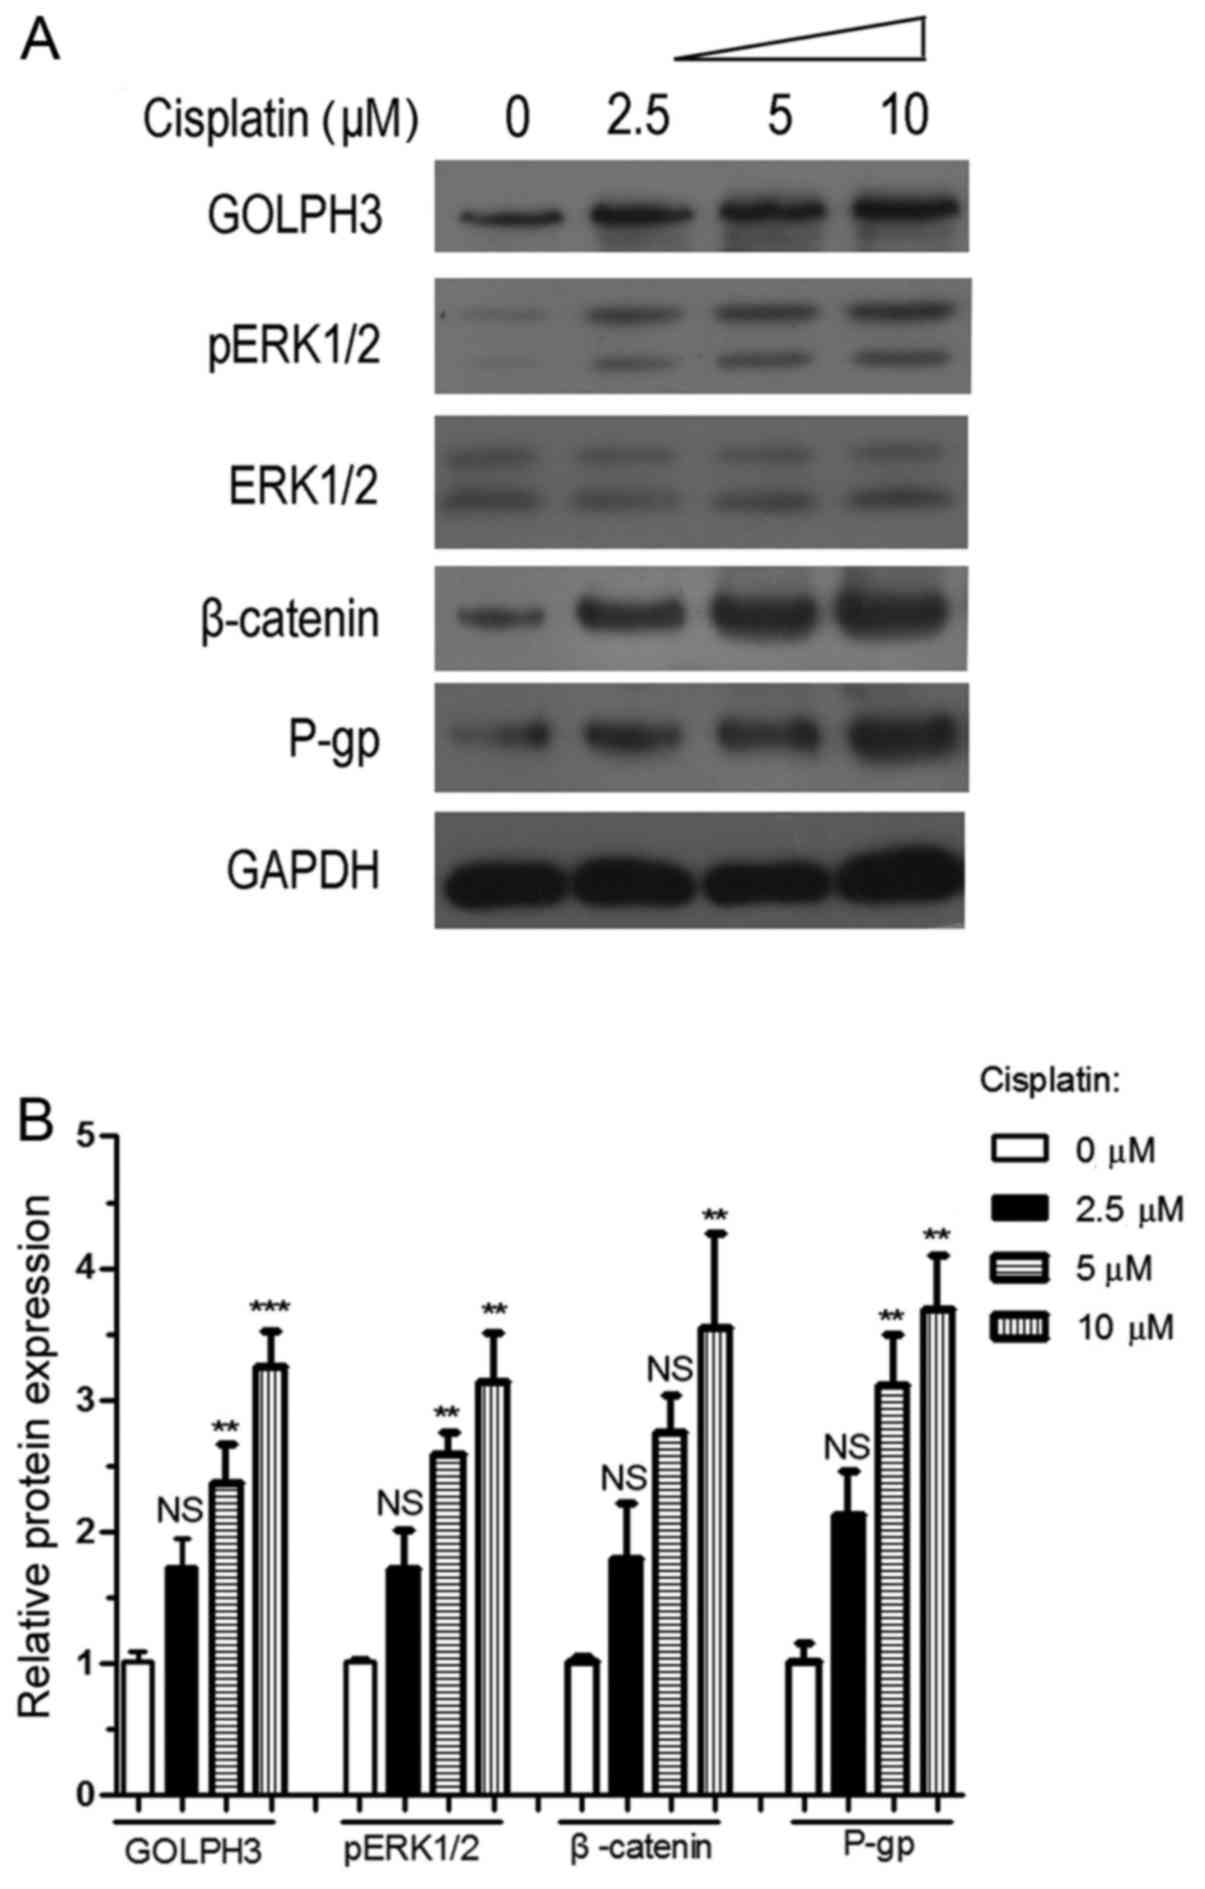 | Figure 6Effects of cisplatin on the
expression of GOLPH3, P-gp, β-catenin and pERK1/2 proteins. (A)
Protein expression following treatment with different
concentrations of cisplatin. (B) Comparison of protein expression
levels following treatment with different concentrations of
cisplatin. GAPDH was used for normalization, and expression levels
were analyzed by one-way analysis of variance. NS, P>0.05,
**P<0.01 and ***P<0.001 vs. the control
group. GOLPH3, Golgi phosphorylated protein 3; P-gp,
P-glycoprotein; ERK, extracellular signal-regulated kinase; NS,
non-significant; p, phosphorylated. |
 | Table IProtein expression levels following
treatment with different concentrations of cisplatin. |
Table I
Protein expression levels following
treatment with different concentrations of cisplatin.
| Cisplatin
concentration (µM) | GOLPH3 | pERK1/2 | β-catenin | P-gp |
|---|
| 0 | 1.020±0.119 | 1.020±0.045 | 1.020±0.067 | 1.020±0.241 |
| 2.5 | 1.735±0.367a | 1.725±0.501b | 1.798±0.724c | 2.129±0.586d |
| 5 | 2.377±0.498e | 2.589±0.166f | 2.756±0.478g | 3.118±0.662h |
| 10 | 3.249±0.463i | 3.146±0.361j | 3.554±1.222k | 3.693±0.706l |
P-gp expression was significantly increased in the
10 µM cisplatin group compared with the control group
(P<0.01), indicating that HT29 cells developed resistance to 10
µM cisplatin. Furthermore, the expression of GOLPH3, pERK1/2
and β-catenin proteins was upregulated in the 10 µM
cisplatin treatment group (P<0.01), which also suggested that
the resistance of HT29 cells to cisplatin was associated with
GOLPH3 expression, mitogen-activated protein kinase (MAPK)/ERK and
the Wnt/β-catenin cell signaling pathway.
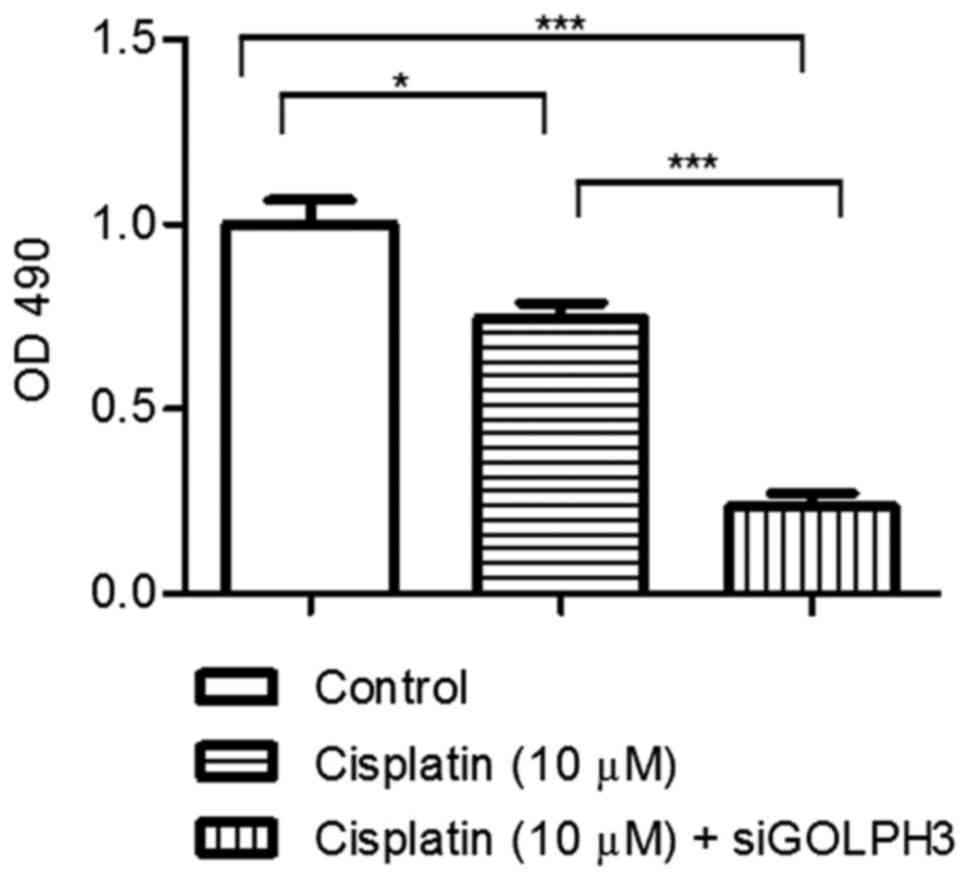
Effects of silencing GOLPH3 expression on
the proliferation of HT29 cells under cisplatin treatment
Under cisplatin treatment, cell proliferation was
examined using the MTT assay (Fig.
7). The OD490 of experimental groups 1 and 2
(0.746±0.085 and 0.236±0.071, respectively) was significantly lower
compared with the control group (1.000±0.127) (P<0.05), and the
OD490 of experimental group 2 was significantly lower
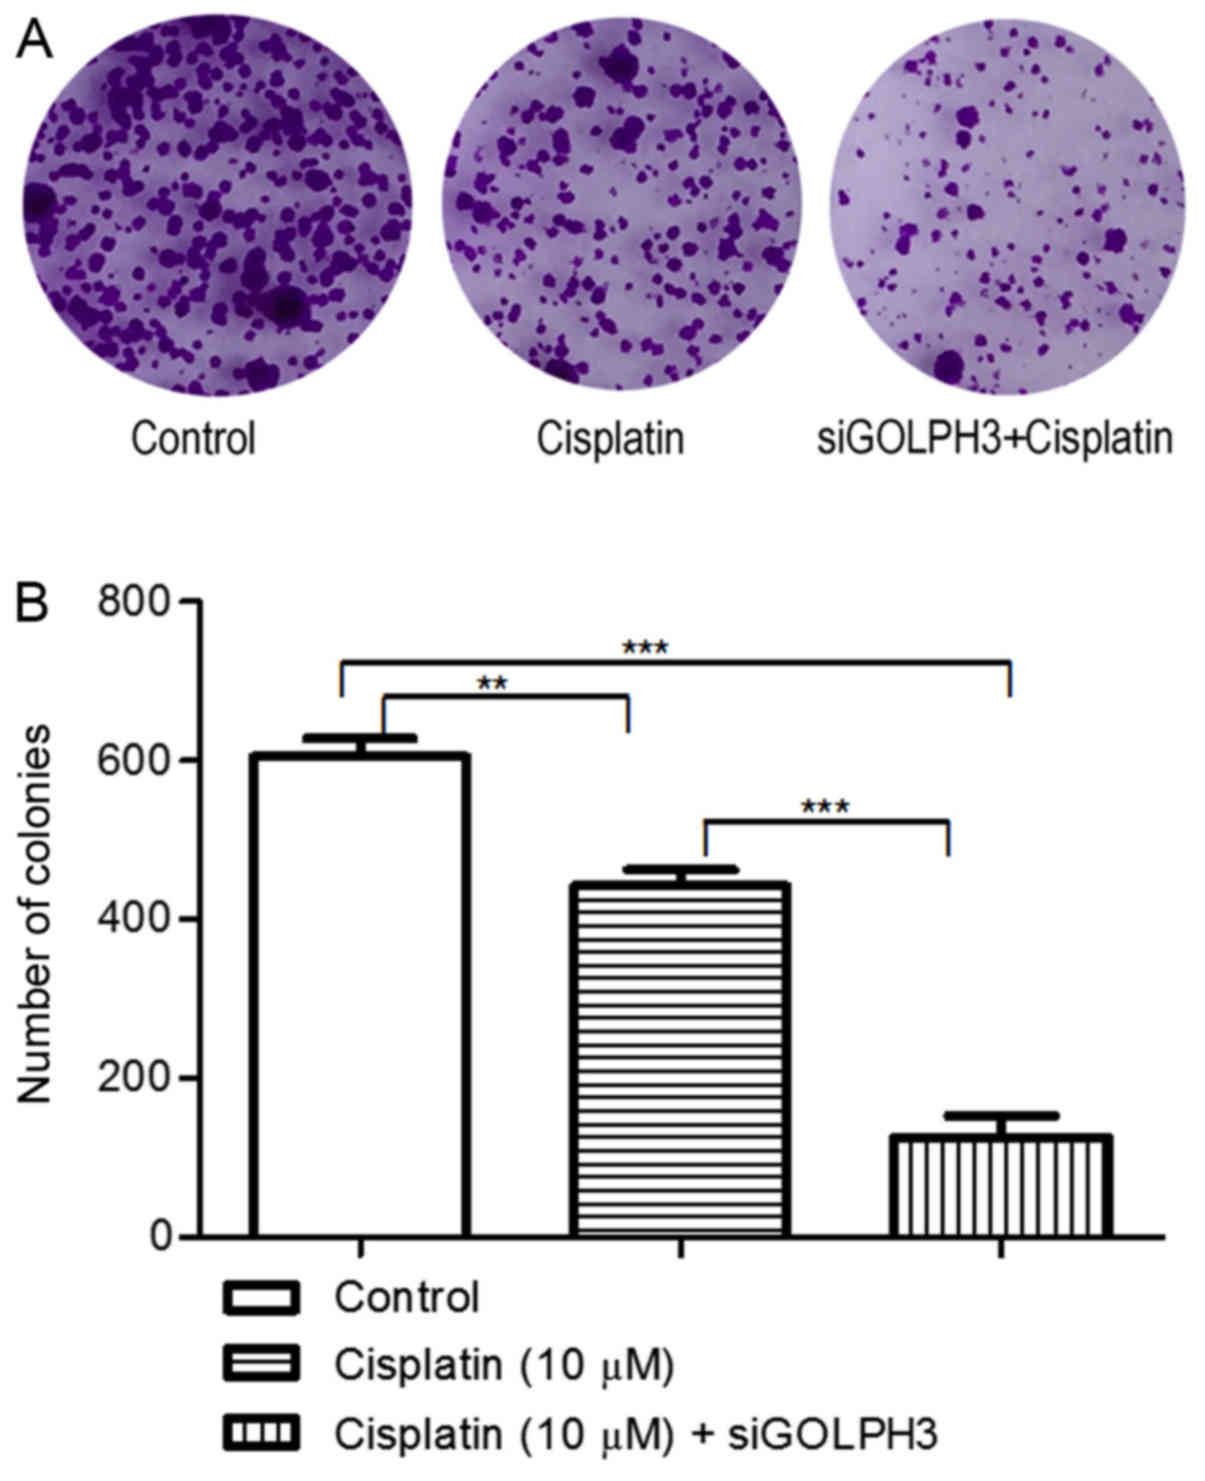
compared with experimental group 1 (P<0.001). The colony counts
in the control and experimental groups 1 and 2 were 604.70±39.70,
442.30±34.270 and 126.30±45.650, respectively, and the differences
among all groups were significant (P<0.05). These results
confirmed that silencing of GOLPH3 decreased the proliferation of
HT29 cells under cisplatin treatment (Figs. 7 and 8).
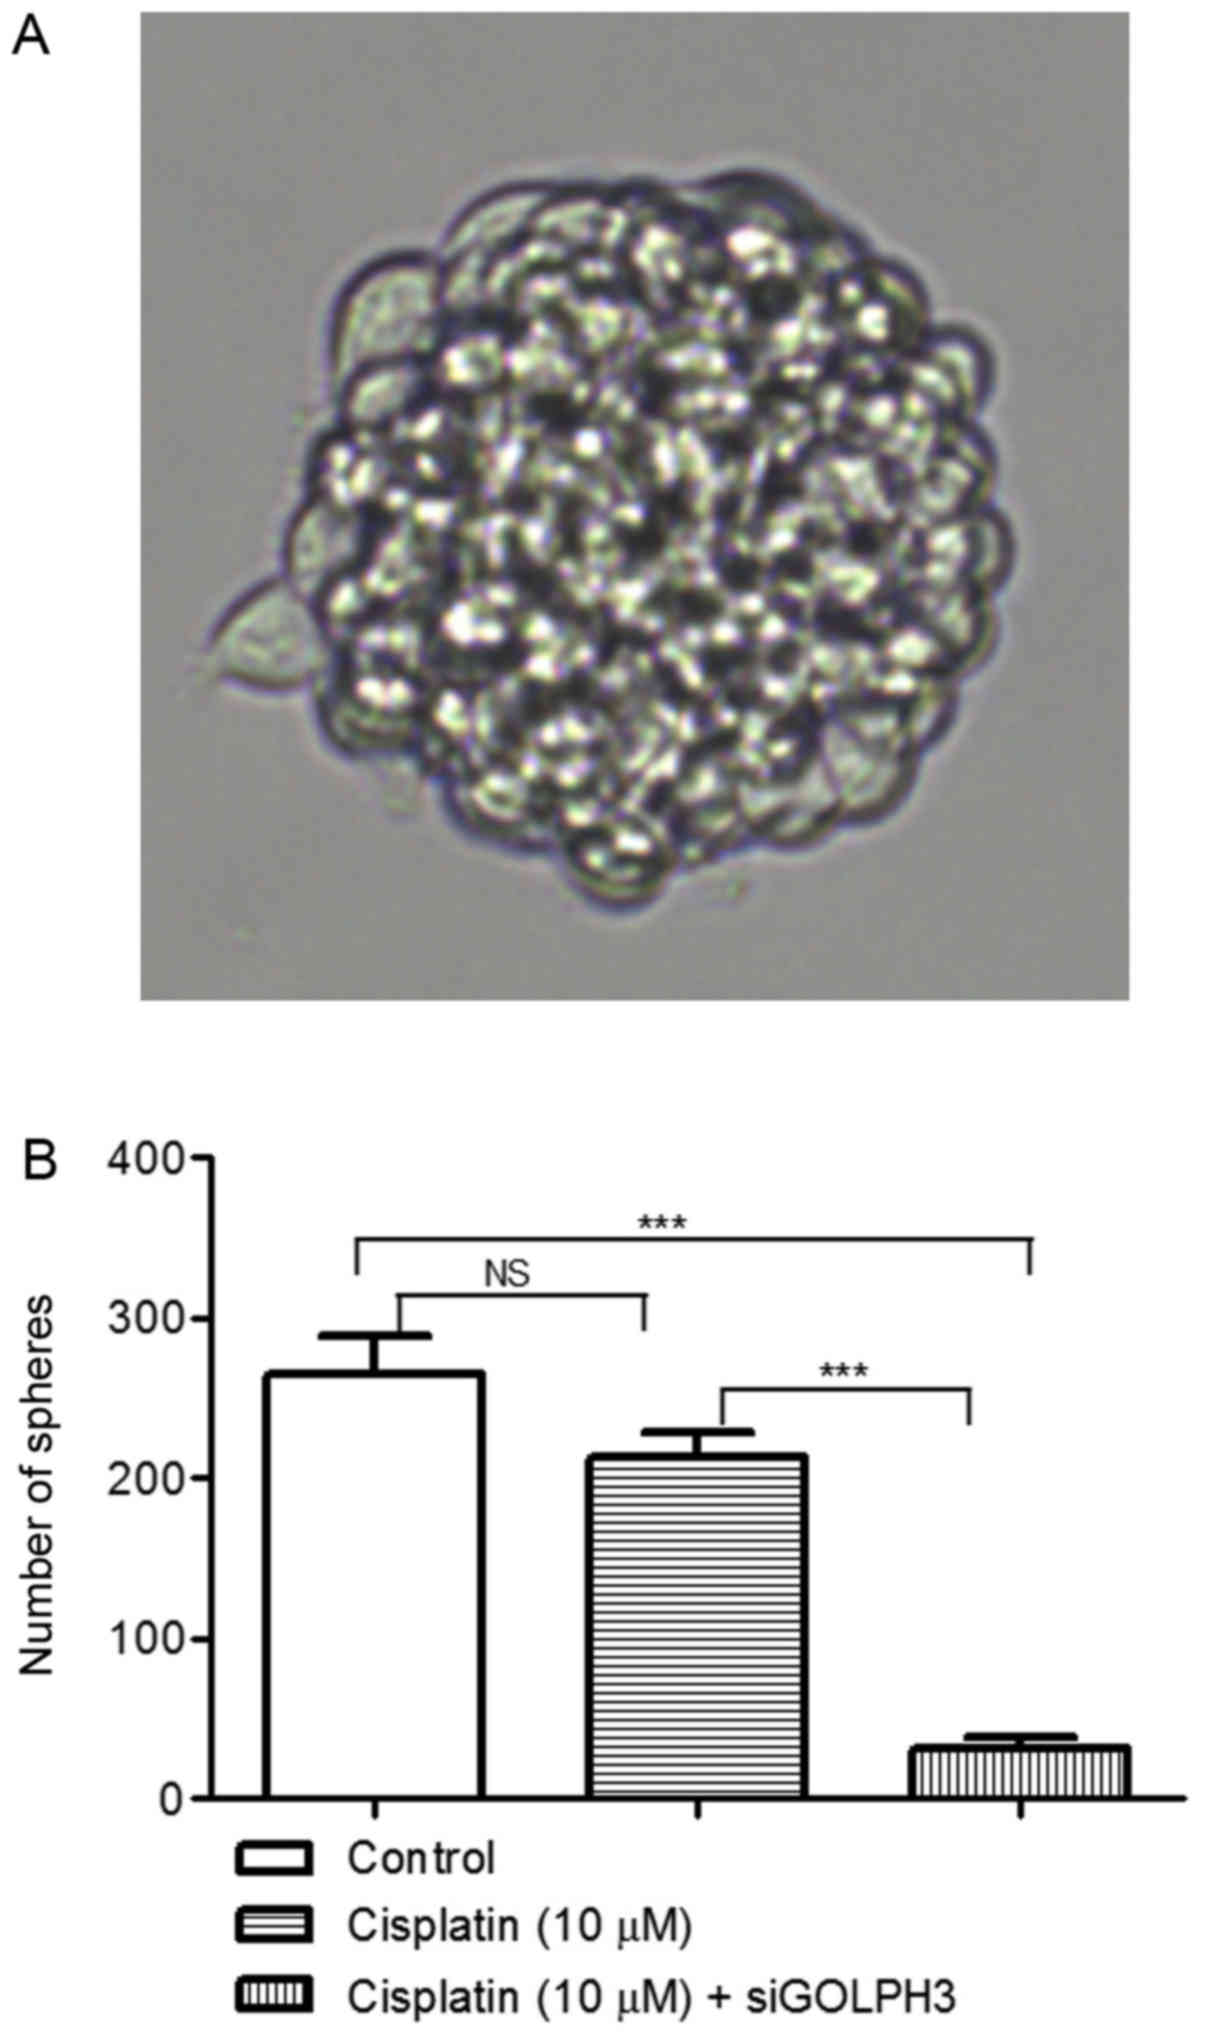
Effects of silencing GOLPH3 on the
tumorigenicity of HT29 cells under cisplatin treatment
Under cisplatin treatment, the tumor sphere counts
in the control and experimental groups 1 and 2 were 264.30±47.990,
212.80±30.380 and 30.750±14.50, respectively. The tumor sphere
count in experimental group 2 was significantly lower compared with
the control group and experimental group 1 (P<0.001). However,
there was no significant difference between experimental group 1
and the control group (P>0.05). These results demonstrated that
silencing GOLPH3 expression decreased the tumorigenicity of HT29
cells under cisplatin treatment (Fig.
9).
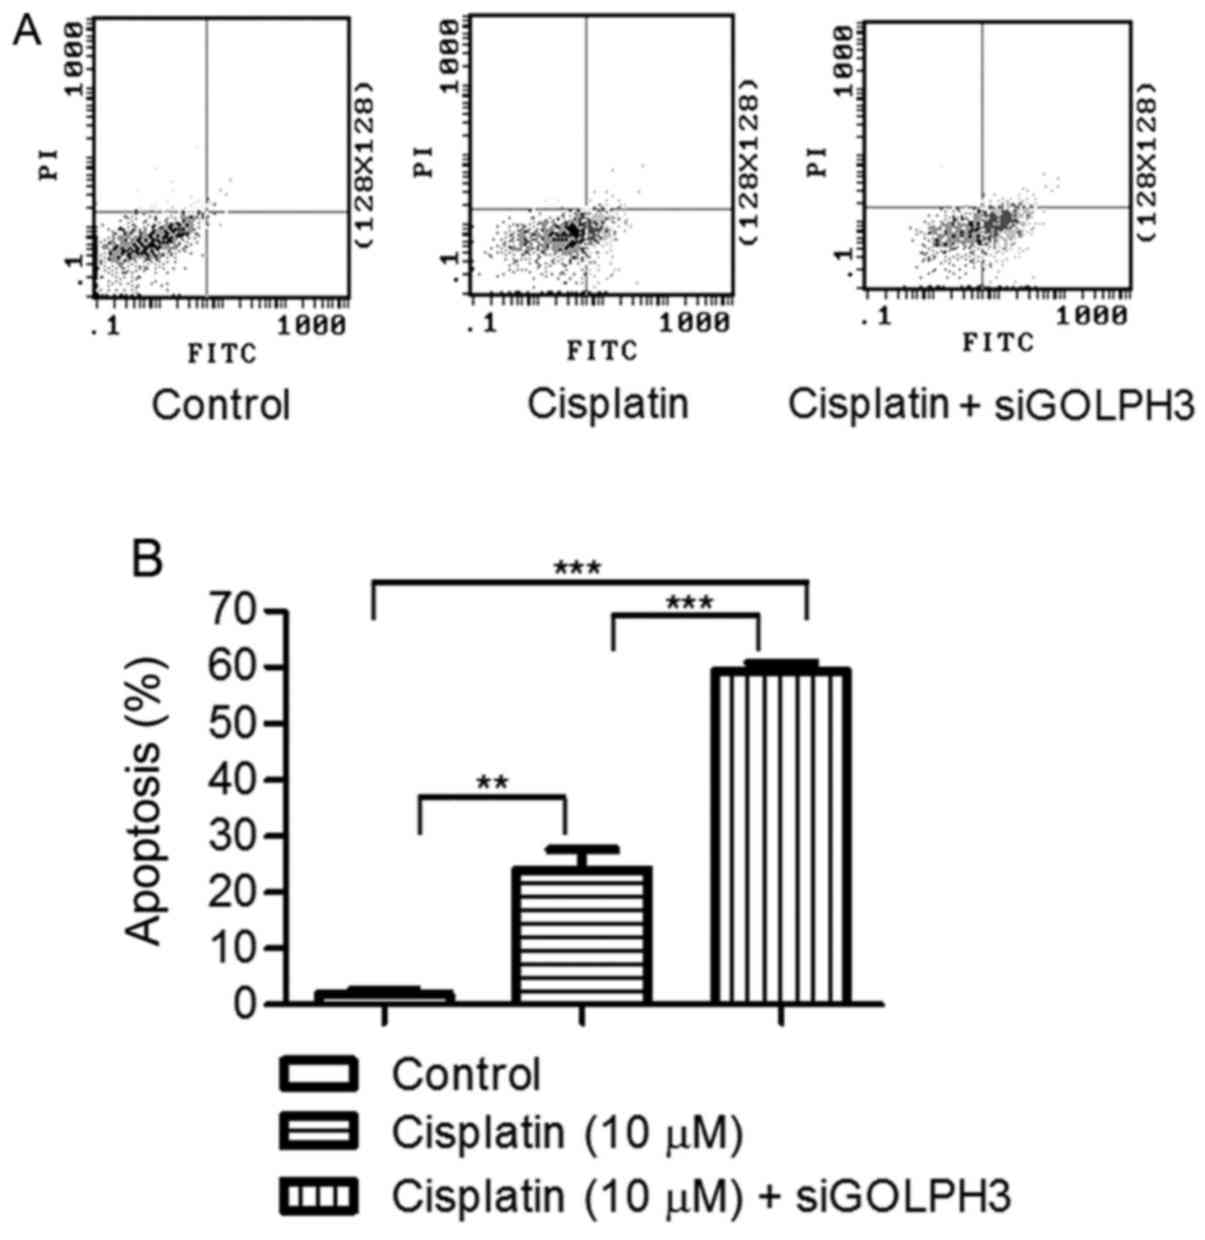
Effects of silencing GOLPH3 on the
apoptosis of HT29 cells under cisplatin treatment
The apoptosis rates of experimental group 1 and
experimental group 2 (23.890±6.363 and 59.400±2.392%, respectively)
were significantly higher compared with the control group
(1.843±1.298) by flow cytometry with Annexin V-FITC/PI (P<0.01).
The apoptosis rate of experimental group 2 was significantly higher
compared with experimental group 1 (P<0.001) (Fig. 10). This finding demonstrated that
silencing GOLPH3 gene expression induced apoptosis in HT29 cells
under cisplatin treatment.
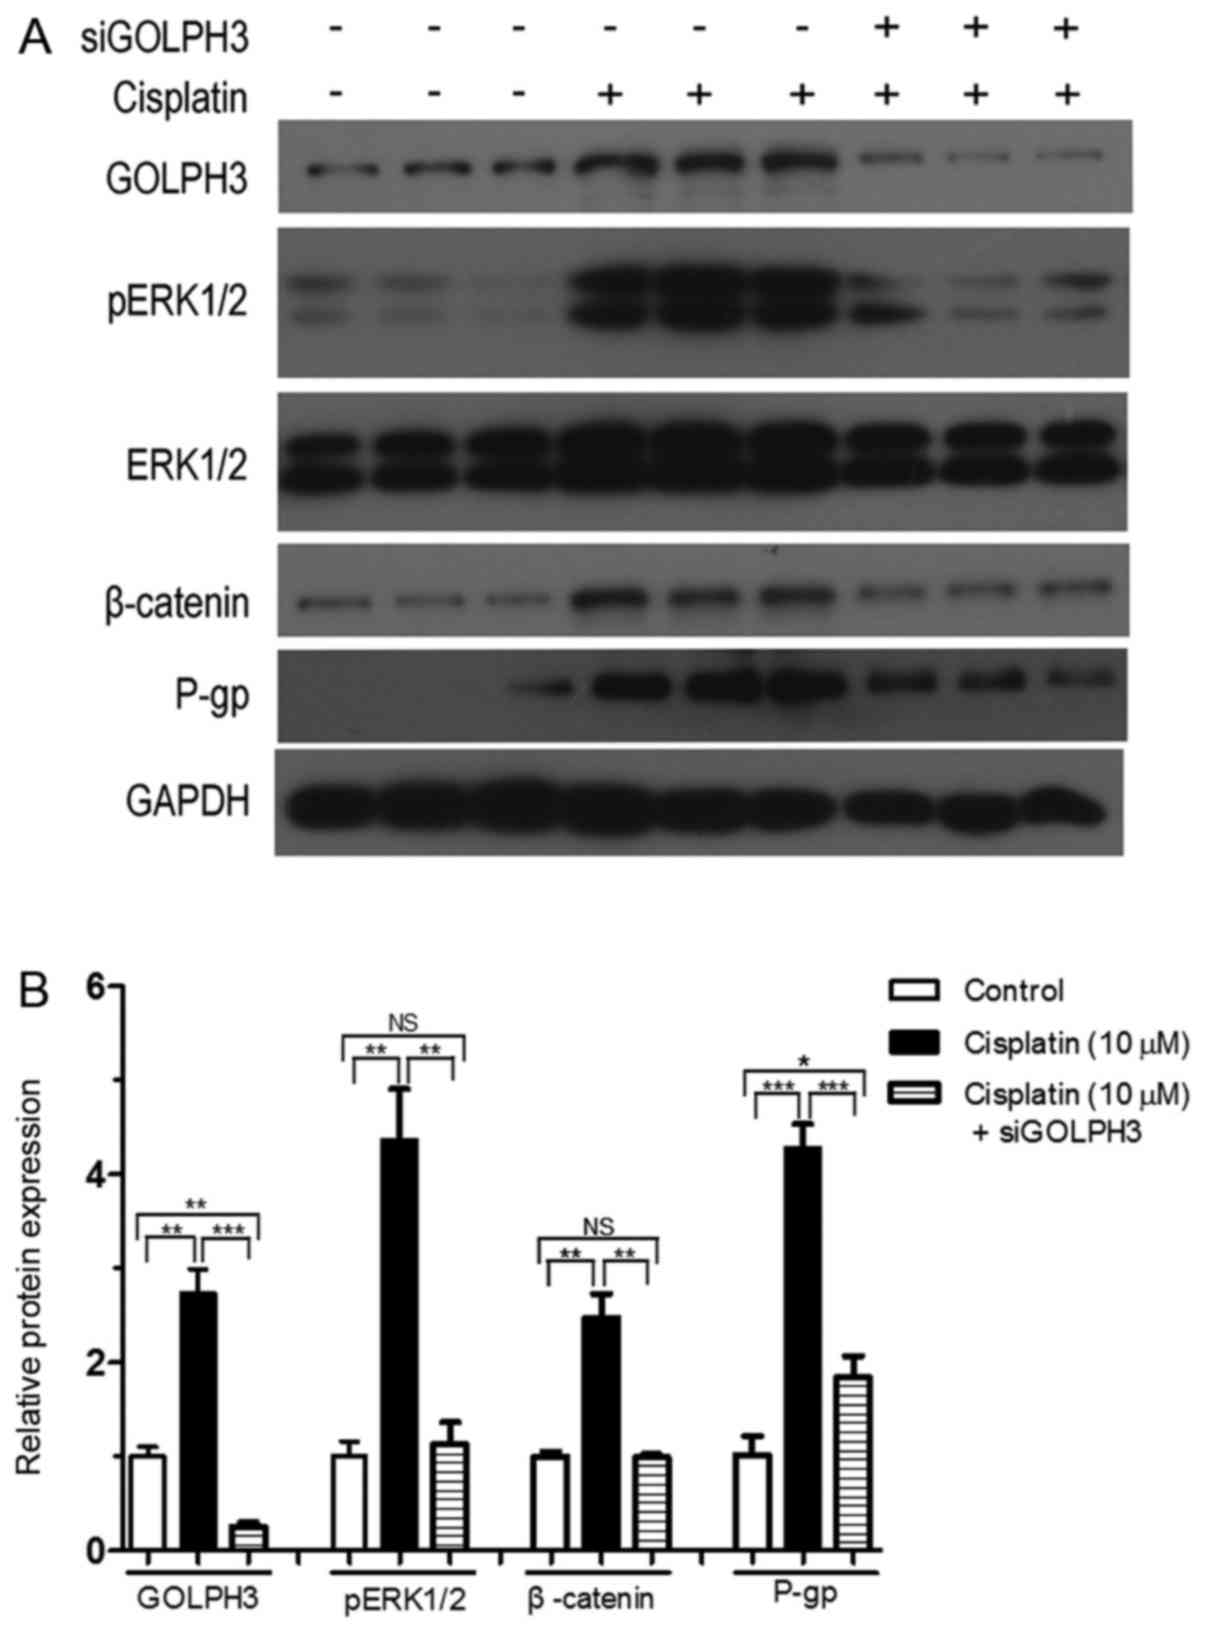
Effects of silencing GOLPH3 on protein
expression under cisplatin treatment
Compared with experimental group 1, GOLPH3 and P-gp
expression was significantly downregulated in experimental group 2
following the silencing of GOLPH3 under cisplatin treatment
(P<0.01) (Fig. 11 and Table II). This result suggested that
silencing GOLPH3 expression reversed resistance to cisplatin in
HT29 cells. There was no significant difference in ERK1/2 protein
expression between the control group, experimental groups 1 and 2.
However, pERK1/2 and β-catenin expression in experimental group 2
was significantly lower compared with experimental group 1
(P<0.01). This indicated that silencing GOLPH3 expression
significantly reduced β-catenin and pERK1/2 expression (active
component of ERK1/2) and inhibited the Wnt/β-catenin and MAPK/ERK
cell signaling pathways under cisplatin treatment. Therefore,
GOLPH3 overexpression is involved in resistance to cisplatin by
activating the MAPK/ERK and Wnt/β-catenin cell signaling pathways
in HT29 cells.
| Table IIProtein expression in experimental
groups 1 and 2. |
Table II
Protein expression in experimental
groups 1 and 2.
| Groups | GOLPH3 | pERK1/2 | β-catenin | P-gp |
|---|
| Control | 1.000±0.173 | 1.004±0.271 | 1.000±0.078 | 1.014±0.346 |
| Cisplatin | 2.734±0.440a | 4.353±0.956b | 2.472±0.444c | 4.269±0.454d |
| Cisplatin +
siGOLPH3 | 0.249±0.084e,f | 1.124±0.410g,h | 0.993±0.052i,j | 1.842±0.383k,l |
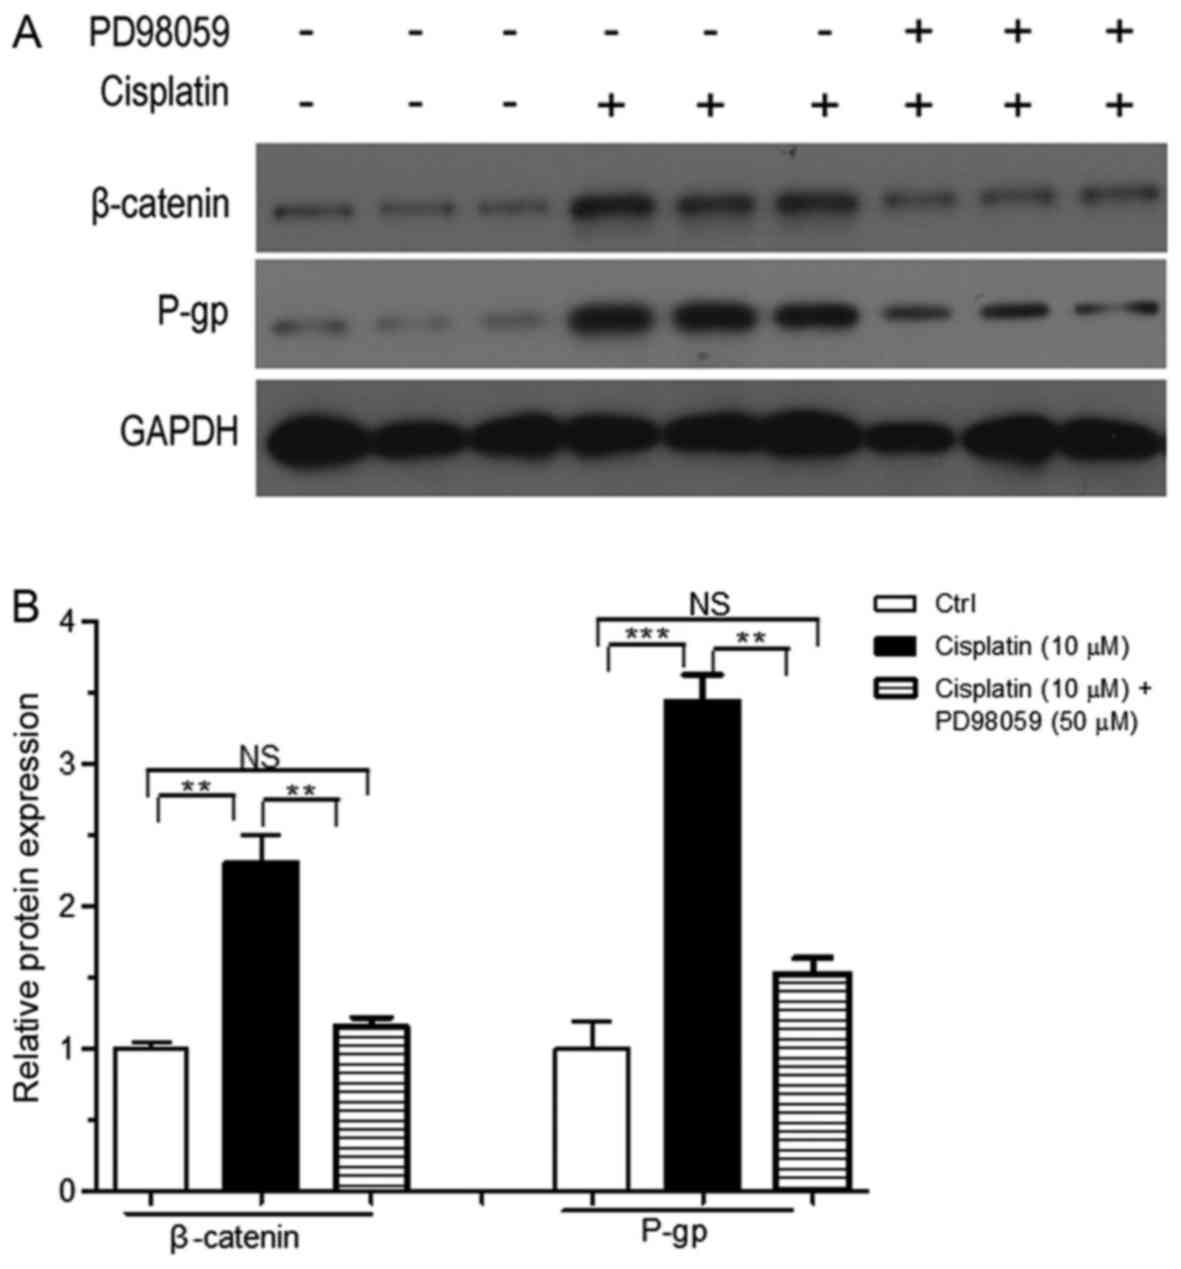
Effects of blocking the MAPK/ERK
signaling pathway on protein expression under cisplatin
treatment
The MAPK/ERK signaling pathway inhibitor PD98059 was
used in a further study to analyze the effects of cisplatin
treatment on HT29 cells. β-catenin and P-gp expression in
experimental group 3 was significantly lower compared with
experimental group 1 (P<0.01) (Fig. 12 and Table III). This finding suggested that
blocking the MAPK/ERK signaling pathway partially reversed
resistance to cisplatin in HT29 cells.
| Table IIIProtein expression in experimental
groups 1 and 3. |
Table III
Protein expression in experimental
groups 1 and 3.
| Groups | β-catenin | P-gp |
|---|
| Control | 1.001±0.072 | 1.004±0.319 |
| Cisplatin | 2.303±0.345a | 3.430±0.335b |
| Cisplatin +
PD98059 |
1.150±0.117c,d |
1.525±0.189e,f |
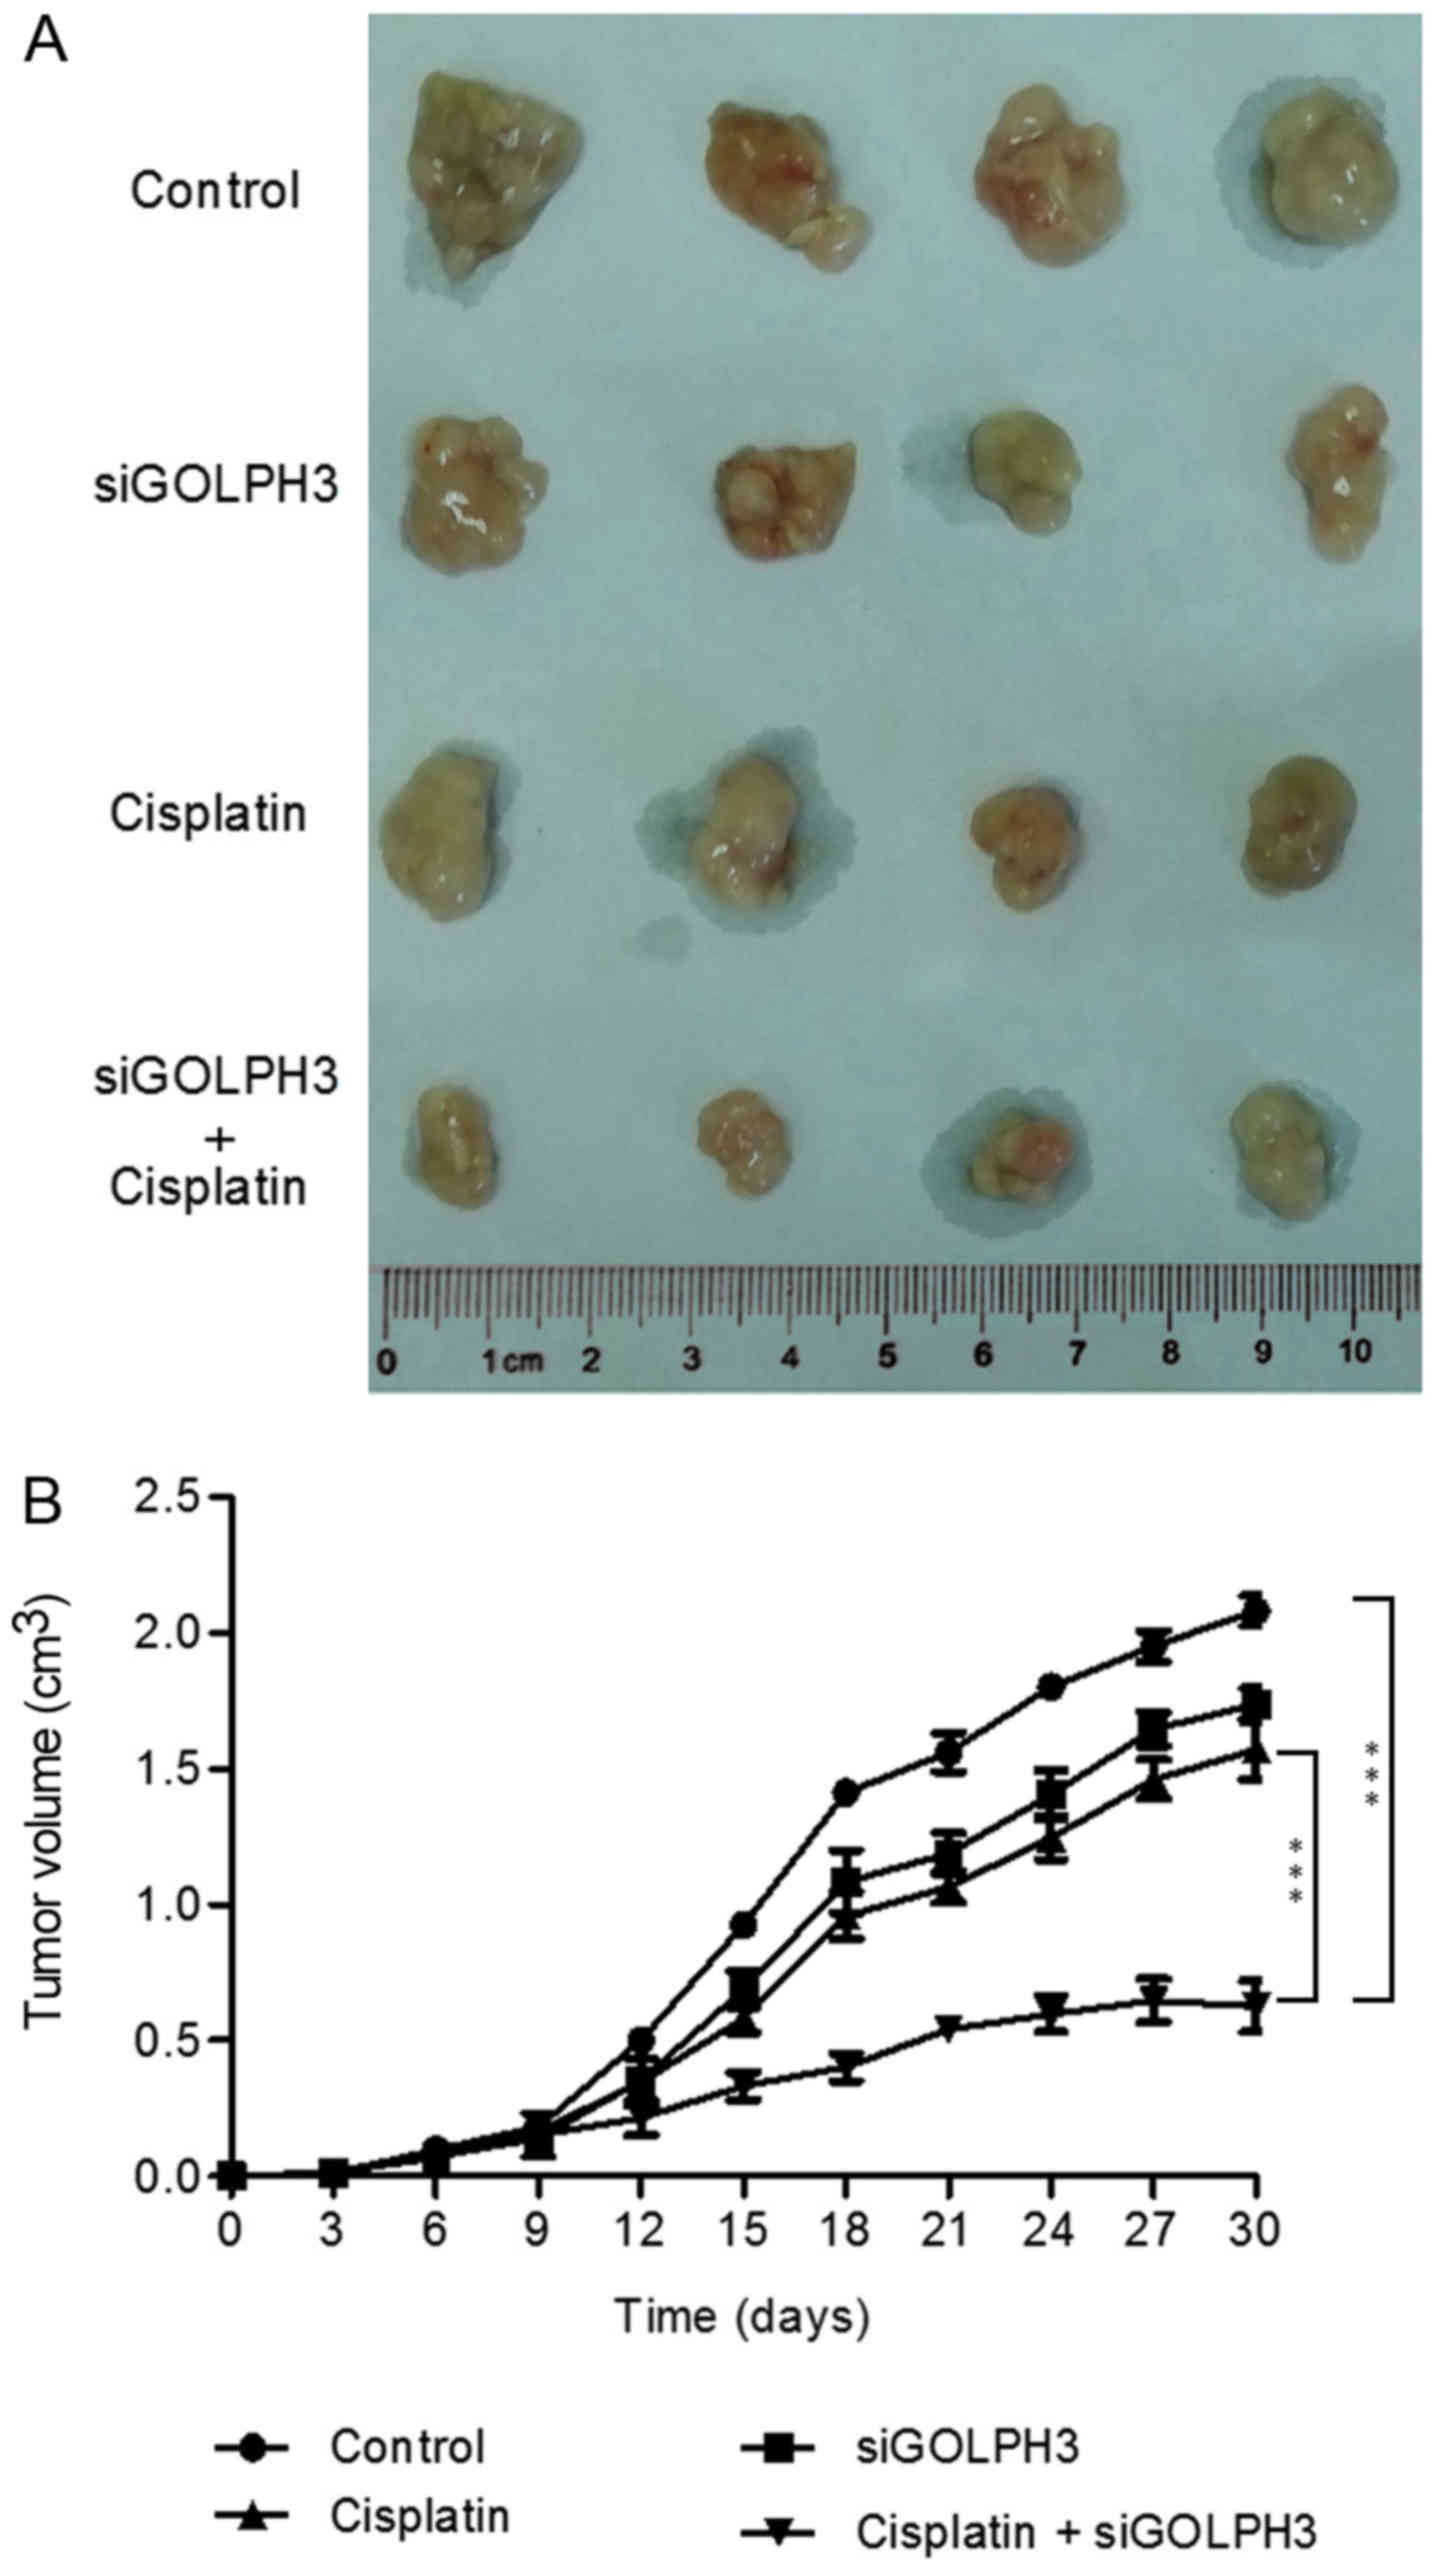
Silencing GOLPH3 gene expression improves
sensitivity of tumor-bearing nude mice to cisplatin
The nude mouse tumor transplantation experiment was
terminated at 30 days following the start of the experiment. The
volume of the axillary subcutaneous tumors in the siRNA group and
experimental groups 1 and 2 was significantly lower compared with
the control group (P<0.05; Fig.
13 and Table IV). In
experimental group 2, the tumor volume of the nude mice was
significantly lower compared with experimental group 1 in the same
period after 15 days (P<0.001). These results verified that
silencing GOLPH3 expression improves the sensitivity of the
transplanted tumors in nude mice to cisplatin chemotherapy, and
that the overexpression of GOLPH3 is involved in resistance to
platinum compounds.
| Table IVComparison of volume of transplanted
tumor in nude mice in each group. |
Table IV
Comparison of volume of transplanted
tumor in nude mice in each group.
| Groups | Volume
(cm3) |
|---|
| Control | 2.083±0.110 |
| siGOLPH3 | 1.738±0.121a |
| Cisplatin | 1.573±0.224b |
| Cisplatin +
siGOLPH3 |
0.625±0.189c,d |
Discussion
Platinum chemotherapeutic drugs exert their
pharmacological effects by targeting DNA. For example, the effect
of cisplatin on DNA formation is mainly the crosslinking between
Pt-AG and Pt-GG chains, and crosslinking can also take place
between the chains and DNA-protein, which can block DNA replication
and transcription at the nucleic acid level, inhibit the division
of tumor cells and induce apoptosis (11,12).
The mechanisms of cisplatin resistance in tumor cells are as
follows: i) Abnormal nucleotide excision repair system (13,14);
ii) activation of the drug detoxification mechanism (15,16);
iii) abnormal gene expression (17,18);
iv) reduction in the movement of drugs into cancer cells and
increased pump activity (19,20)
and v) abnormal activation of cellular signaling pathways (21–23).
Among these mechanisms, abnormal gene expression and cell signaling
pathways have an important role in resistance to chemotherapy, and
the selection of chemotherapeutics in colon cancer is becoming a
research hotspot. GOLPH3, a new oncogene, is overexpressed in
colorectal cancer tissues and is associated with the activation of
cell signaling pathways. Therefore, GOLPH3 may be involved in
resistance to chemotherapy.
The data of the present study demonstrated that, the
expression of GOLPH3, P-gp, pERK1/2 and β-catenin proteins was
upregulated in HT29 cells under cisplatin treatment, causing the
emergence of drug resistance. Silencing GOLPH3 expression
downregulated the expression of GOLPH3, P-gp, pERK1/2 and
β-catenin, increased the sensitivity of HT29 cells to cisplatin,
reduced tumorigenicity and reversed resistance to cisplatin. These
results confirmed that GOLPH3 overexpression is involved in
resistance of HT29 cells to cisplatin. The results of the nude
mouse tumorigenesis experiment verified this conclusion. The change
in pERK1/2 and β-catenin expression indicated that the mechanism
underlying the involvement of GOLPH3 overexpression in cisplatin
resistance was associated with activation of the MAPK/ERK and
Wnt/β-catenin signaling pathways in HT29 cells.
The effect of the MAPK signaling pathway on the
chemoresistance of cancer cells to platinum-based drugs has
attracted increasing attention. Excessive activation of the ERK1/2
signaling pathway is significantly associated with platinum-based
drug resistance in a number of tumors (24,25).
Liu et al (26) found that
high-mobility group box 1 protein (a regulator of autophagy) was
released in colorectal cancer cell lines following chemotherapy
with oxaliplatin and decreased the sensitivity of colorectal cancer
cells to oxaliplatin by activating the MEK/ERK pathway. Zhao et
al (27) confirmed that
silencing WEE1 expression reversed multidrug resistance and
increased the sensitivity of HepG2/DDP cells to cisplatin. The
underlying mechanism was associated with inhibition of the MAPK/ERK
signaling pathway and the downregulated expression of genes that
are associated with multidrug resistance.
The expression of β-catenin and P-gp was
significantly decreased after the MAPK/ERK signaling pathway was
blocked by PD98059. This indicated that blocking the MAPK/ERK
signaling pathway partly reversed the resistance of HT29 cells to
cisplatin. In a previous study by the authors, GOLPH3 activated the
Wnt/β-catenin signaling pathway to promote the proliferation of
colon cancer cells (10), which
was confirmed by the present study.
Platinum-based drugs mainly exert their tumoricidal
activity through DNA damage. It has been demonstrated that the
DNA-PK-GOLPH3-MYO18A pathway is activated after DNA damage and is
able to improve cell survival (28). The DNA-PK-GOLPH3-MYO18A pathway
links response to DNA damage directly with the Golgi apparatus. If
any components of the pathway are removed, the tumoricidal efficacy
of the drugs is enhanced, cell proliferation is inhibited and the
apoptosis rate is increased (29).
Therefore, GOLPH3 overexpression may activate the
DNA-PK/GOLPH3/MYO18A pathway in HT29 cells, which protects cancer
cells against DNA damage caused by platinum drugs and leads to
resistance to chemotherapy.
In summary, GOLPH3 overexpression is implicated in
the resistance of HT29 cells to cisplatin and its action may be
mediated through activation of the Wnt/β-catenin and MAPK/ERK
signaling pathways. Silencing GOLPH3 expression partly reverses
drug resistance. Our findings suggest that GOLPH3 is a potential
target for reversing drug resistance in colon cancer.
Abbreviations:
|
GOLPH3
|
Golgi phosphorylated protein 3
|
|
pERK
|
phosphorylated extracellular
signal-regulated kinase
|
|
FOLFOX
|
folinic acid, 5-fluorouracil and
oxaliplatin
|
Acknowledgments
We sincerely thank Dr Weifang Li and her laboratory
members for advice and support from China Three Gorges University
(Yichang, Hubei, China). We would like to acknowledge Dr Yanta Guo
from the Second Affiliated Hospital of Fujian Medical
University(Fujian, China) for providing experimental
suggestions.
References
|
1
|
Yusup A, Wang HJ, Rahmutula A, Sayim P,
Zhao ZL and Zhang GQ: Clinical features and prognosis in colorectal
cancer patients with different ethnicities in Northwest China.
World J Gastroenterol. 19:7183–7188. 2013. View Article : Google Scholar : PubMed/NCBI
|
|
2
|
Chauvin A, Wang CS, Geha S, Garde-Granger
P, Mathieu AA, Lacasse V and Boisvert FM: The response to
neoadjuvant chemoradiotherapy with 5-fluorouracil in locally
advanced rectal cancer patients: A predictive proteomic signature.
Clin Proteomics. 15:162018. View Article : Google Scholar : PubMed/NCBI
|
|
3
|
Mao L, Li Y, Zhao J, Li Q, Yang B, Wang Y,
Zhu Z, Sun H and Zhai Z: Transforming growth factor-β1 contributes
to oxaliplatin resistance in colorectal cancer via epithelial to
mesenchymal transition. Oncol Lett. 14:647–654. 2017. View Article : Google Scholar : PubMed/NCBI
|
|
4
|
Kunigou O, Nagao H, Kawabata N, Ishidou Y,
Nagano S, Maeda S, Komiya S and Setoguchi T: Role of GOLPH3 and
GOLPH3L in the proliferation of human rhabdomyosarcoma. Oncol Rep.
26:1337–1342. 2011.PubMed/NCBI
|
|
5
|
Zhang LJ, Wang KB, Liu LS, Chen LZ, Peng
BG, Liang LJ, Li Z, Xue L, Li W and Xia JT: Overexpression of
GOLPH3 is associated with poor prognosis and clinical progression
in pancreatic ductal adenocarcinoma. BMC Cancer. 14:5712014.
View Article : Google Scholar : PubMed/NCBI
|
|
6
|
Xue Y, Wu G, Liao Y, Xiao G, Ma X, Zou X,
Zhang G, Xiao R, Wang X, Liu Q, et al: GOLPH3 is a novel marker of
poor prognosis and a potential therapeutic target in human renal
cell carcinoma. Br J Cancer. 110:2250–2260. 2014. View Article : Google Scholar : PubMed/NCBI
|
|
7
|
Ma Y, Wang X, Wu Y, Sun B, Lv H, Rong F
and Zheng X: Overexpression of GOLPH3 protein is associated with
worse prognosis in patients with epithelial ovarian cancer. Tumour
Biol. 35:11845–11849. 2014. View Article : Google Scholar : PubMed/NCBI
|
|
8
|
Li W, Qi K and Wang Z, Gu M, Chen G, Guo F
and Wang Z: Golgi phosphoprotein 3 regulates metastasis of prostate
cancer via matrix metalloproteinase 9. Int J Clin Exp Pathol.
8:3691–3700. 2015.PubMed/NCBI
|
|
9
|
Zhou ZP, Qiu CZ and Yu WS: Relationship
between golgi phosphoprotein 3 expression and Wnt/β-catenin
signaling in colorectal cancer tissue. Chin J Exp Surg.
30:2709–2710. 2013.
|
|
10
|
Qiu CZ, Wang MZ, Yu WS, Guo YT, Wang CX
and Yang XF: Correlation of GOLPH3 gene with Wnt signaling pathway
in human colon cancer cells. J Cancer. 7:928–934. 2016. View Article : Google Scholar : PubMed/NCBI
|
|
11
|
Hato SV, Khong A, de Vries IJ and
Lesterhuis WJ: Molecular pathways: The immunogenic effects of
platinum-based chemotherapeutics. Clin Cancer Res. 20:2831–2837.
2014. View Article : Google Scholar : PubMed/NCBI
|
|
12
|
Dilruba S and Kalayda GV: Platinum-based
drugs: Past, present and future. Cancer Chemother Pharmacol.
77:1103–1124. 2016. View Article : Google Scholar : PubMed/NCBI
|
|
13
|
Hatch SB, Swift LP, Caporali S, Carter R,
Hill EJ, MacGregor TP, D'Atri S, Middleton MR, McHugh PJ and Sharma
RA: XPF protein levels determine sensitivity of malignant melanoma
cells to oxaliplatin chemotherapy: Suitability as a biomarker for
patient selection. Int J Cancer. 134:1495–1503. 2014. View Article : Google Scholar :
|
|
14
|
Sun Y, Wu Y, Li W, Kong Z and Zou X:
Genetic polymorphisms in nucleotide excision repair pathway
influences response to chemotherapy and overall survival in
osteosarcoma. Int J Clin Exp Pathol. 8:7905–7912. 2015.PubMed/NCBI
|
|
15
|
Sawers L, Ferguson MJ, Ihrig BR, Young HC,
Chakravarty P, Wolf CR and Smith G: Glutathione S-transferase P1
(GSTP1) directly influences platinum drug chemosensitivity in
ovarian tumour cell lines. Br J Cancer. 111:1150–1158. 2014.
View Article : Google Scholar : PubMed/NCBI
|
|
16
|
Ye H, Shao M, Shi X, Wu L, Xu B, Qu Q and
Qu J: Predictive assessment in pharmacogenetics of Glutathione
S-transferases genes on efficacy of platinum-based chemotherapy in
non-small cell lung cancer patients. Sci Rep. 7:26702017.
View Article : Google Scholar : PubMed/NCBI
|
|
17
|
Liu L, Bai Z, Ma X, Wang T, Yang Y and
Zhang Z: Effects of taxol resistance gene 1 expression on the
chemosensitivity of SGC-7901 cells to oxaliplatin. Exp Ther Med.
11:846–852. 2016. View Article : Google Scholar : PubMed/NCBI
|
|
18
|
Gao H, Song X, Kang T, Yan B, Feng L, Gao
L, Ai L, Liu X, Yu J and Li H: Long noncoding RNA CRNDE functions
as a competing endogenous RNA to promote metastasis and oxaliplatin
resistance by sponging miR-136 in colorectal cancer. OncoTargets
Ther. 10:205–216. 2017. View Article : Google Scholar
|
|
19
|
Huang BY, Zeng Y, Li YJ, Huang XJ, Hu N,
Yao N, Chen MF, Yang ZG, Chen ZS, Zhang DM, et al: Uncaria
alkaloids reverse ABCB1-mediated cancer multidrug resistance. Int J
Oncol. 51:257–268. 2017. View Article : Google Scholar : PubMed/NCBI
|
|
20
|
Tarapcsák S, Szalóki G, Telbisz Á, Gyöngy
Z, Matúz K, Csősz É, Nagy P, Holb IJ, Rühl R, Nagy L, et al:
Interactions of retinoids with the abc transporters p-glycoprotein
and breast cancer resistance protein. Sci Rep. 7:413762017.
View Article : Google Scholar : PubMed/NCBI
|
|
21
|
Yang J, Zhang K, Wu J, Shi J, Xue J, Li J,
Chen J, Zhu Y, Wei J, He J and Liu X: Wnt5a increases properties of
lung cancer stem cells and resistance to cisplatin through
activation of wnt5a/pkc signaling pathway. Stem Cells Int.
2016:16908962016. View Article : Google Scholar : PubMed/NCBI
|
|
22
|
Miao Y, Zheng W, Li N, Su Z, Zhao L, Zhou
H and Jia L: MicroRNA-130b targets PTEN to mediate drug resistance
and proliferation of breast cancer cells via the PI3K/Akt signaling
pathway. Sci Rep. 7:419422017. View Article : Google Scholar : PubMed/NCBI
|
|
23
|
Xi R, Pan S, Chen X, Hui B, Zhang L, Fu S,
Li X, Zhang X, Gong T, Guo J, et al: Hpv16 e6-e7 induces cancer
stem-like cells phenotypes in esophageal squamous cell carcinoma
through the activation of pi3k/akt signaling pathway in vitro and
in vivo. Oncotarget. 7:57050–57065. 2016. View Article : Google Scholar : PubMed/NCBI
|
|
24
|
Shen L, Yang M, Lin Q, Zhang Z, Miao C and
Zhu B: SKA1 regulates the metastasis and cisplatin resistance of
non-small cell lung cancer. Oncol Rep. 35:2561–2568. 2016.
View Article : Google Scholar : PubMed/NCBI
|
|
25
|
Son DJ, Hong JE, Ban JO, Park JH, Lee HL,
Gu SM, Hwang JY, Jung MH, Lee DW, Han SB, et al: Synergistic
inhibitory effects of cetuximab and cisplatin on human colon cancer
cell growth via inhibition of the erk-dependent egf receptor
signaling pathway. BioMed Res Int. 2015:3975632015. View Article : Google Scholar : PubMed/NCBI
|
|
26
|
Liu W, Zhang Z, Zhang Y, Chen X, Guo S,
Lei Y, Xu Y, Ji C, Bi Z and Wang K: HMGB1-mediated autophagy
modulates sensitivity of colorectal cancer cells to oxaliplatin via
MEK/ERK signaling pathway. Cancer Biol Ther. 16:511–517. 2015.
View Article : Google Scholar : PubMed/NCBI
|
|
27
|
Zhao W, Liu S, Dou Q, Li C, Du J and Ren
W: The role and mechanism of WEE1 on the cisplatin resistance
reversal of the HepG2/DDP human hepatic cancer cell line. Oncol
Lett. 10:3081–3086. 2015. View Article : Google Scholar
|
|
28
|
Farber-Katz SE, Dippold HC, Buschman MD,
Peterman MC, Xing M, Noakes CJ, Tat J, Ng MM, Rahajeng J, Cowan DM,
et al: DNA damage triggers Golgi dispersal via DNA-PK and GOLPH3.
Cell. 156:413–427. 2014. View Article : Google Scholar : PubMed/NCBI
|
|
29
|
Buschman MD, Rahajeng J and Field SJ:
GOLPH3 links the Golgi, DNA damage, and cancer. Cancer Res.
75:624–627. 2015. View Article : Google Scholar : PubMed/NCBI
|