Introduction
Colorectal cancer (CRC) is the third most common
cancer type and the fourth leading cause of cancer-associated
mortality worldwide (1). In 2012,
there were ~1.36 million cases and 0.7 million mortalities
worldwide (2). CRC may be staged
according to the American Joint Committee of Cancer tumor node
metastasis or Dukes staging system (3,4).
Dukes A/B and UICC I/II are considered early-stage CRC, Dukes C/D
and UICC III/IV are considered late-stage CRC (5). Surgical removal is the optimal
treatment choice for CRC when detected early, but is often
diagnosed too late, whereby the only feasible treatment option left
is drugs. Cetuximab and bevacizumab exhibit therapeutic effects on
CRC, but the treatment mechanisms are different. Cetuximab is an
epidermal growth factor receptor (EGFR) monoclonal antibody and
bevacizumab is a vascular endothelial growth factor receptor
(VEGFR) monoclonal antibody. Clinically, EGFR monoclonal antibodies
are considered if the VEGRF expression level of the patient is low.
Thus, the present study focused on EGFR-targeted therapy in CRC
(6,7). It has been reported that
EGFR-targeted drugs exhibit a positive effect on KRAS
proto-oncogene GTPase (KRAS) wild-type (KRASWT) CRC, but
are ineffective on KRAS mutation (KRASMUT) CRC (8). The Food and Drug Administration (FDA)
have approved two monoclonal antibodies (cetuximab and panitumumab)
that inhibit EGFR. Cetuximab is a chimeric IgGl anti-EGFR
monoclonal antibody, while panitumumab is a complete human IgG2
anti-EGFR monoclonal antibody (9).
Cetuximab and panitumumab have been demonstrated to increase the
overall survival rate of CRC; however, cetuximab is <30%
effective in patients (10).
Clinical data has confirmed that KRAS mutations reduce the effect
of cetuximab and panitumumab, resulting in the use of these
monoclonal antibodies only in patients with KRASWT CRC
(11). Identifying drugs that are
effective on KRASWT and KRASMUT CRC has
significance for the treatment of patients with advanced CRC.
Bioinformatics is a field of study that uses
computational methods to store, retrieve and analyze biological
information. It is one of the newest fields of biological research
(12). Bioinformatics analysis
involves the screening of large datasets from gene chips. There are
a number of convenient online analytics tools (GEO2R, GCBI, DAVID,
KEGG and GATHER) and analysis software (BRB-ArrayTools and Funrich)
available. The present study aimed to investigate the common
oncogenes of KRASWT and KRASMUT using
bioinformatics analysis, and to perform gene function and pathway
enrichment analysis. Additionally, the expression of COL1A1 in CRC
tissues and cells was verified, and the association between COL1A1
and clinicopathological parameters in CRC clinical samples was
analyzed.
KRAS mutation rates reached 40% in patients with
CRC, as reported in 2017 (13).
Identifying target genes that are effective against wild-type and
mutant KRAS may aid in identifying more effective drugs for the
treatment of CRC, and provide a theoretical foundation for the
application of relevant targets to clinical medicine.
Materials and methods
Microarray data
The gene expression profiles from the GSE38026
dataset were used for analysis in the presents study (https://www.ncbi.nlm.nih.gov/geo/query/acc.cgi?acc=GSE38026).
GSE38026 was based on the Agilent GPL11532 platform (Affymetrix
Human Gene 1.1 ST Array; Affymetrix; Thermo Fisher Scientific,
Inc., Waltham, MA, USA). The GSE38026 dataset contained 32 samples,
including eight KRASWT healthy control colon mucosa
samples, eight KRASMUT healthy control colon mucosa
samples, eight KRASWT CRC samples and eight
KRASMUT CRC samples.
Tissue samples, tissue microarrays and
cell lines
A total of 24 pairs of CRC tissues and adjacent
non-cancerous controls were collected at Xinxiang Central Hospital
(Xinxiang, China) between June 2016 and December 2016. Samples of
patients with CRC were all diagnosed as primary CRC for the first
time. No patients received radiotherapy, chemotherapy or biological
therapy prior to surgery. The patient age range was 33-78 years
old, including 9 males and 15 females. The present study was
approved by Xinxiang Medical University Ethics Committee, and all
patients provided written informed consent for participation in the
present study. The tissue specimens were frozen in liquid nitrogen
and stored at -80°C. When observed under a microscope, malignant
glandular infiltration exceeding mucosal muscularis to the
submucosa is considered to indicate colorectal adenocarcinoma,
according to the World Health Organization (3). All tissues were confirmed to be
adenocarcinoma. Classifications were based on the system of the
International Union Against Cancer (3). Tissue chips, including 150 points
samples were purchased from Shanghai Outdo Biotech Co., Ltd.
(Shanghai, China). The 150 points samples included 75 cancer and 75
healthy tissues. The CRC cell lines LOVO, DLD-1, Caco2, HT29, SW620
and SW480, as well as control intestinal mucosal epithelial FHC
cells used in the present study were obtained from the American
Type Culture Collection (Manassas, VA, USA) and were cultured in
RPMI-1640 (HyClone; GE Healthcare Life Sciences, Logan, UT, USA)
supplemented with 10% fetal bovine serum (FBS) (Gibco; Thermo
Fisher Scientific, Inc.) at 37°C with 5% CO2. Lovo
(KRASMUT) was derived from a metastatic site of colon
adenocarcinoma cells. SW480 (KRASMUT) was established
from a primary adenocarcinoma of the colon. SW620
(KRASMUT) was derived from a metastasis of the same
tumor from which SW480 was derived (12). DLD-1 (KRASMUT), Caco2
(KRASWT) and HT29 (KRASWT) were derived from
colorectal adenocarcinoma cell lines (14,15).
Identification of differentially
expressed genes (DEGs)
Analysis was performed using GEO2R from the National
Center for Biotechnology Information (16). DEGs from cancer and adjacent
control tissues of KRASWT and KRASMUT
patients were analyzed. Subsequently, the overlap between the two
DEG groups representing similarly behaving genes independent of
KRAS status was analyzed. DEGs were selected with a
≥1.2-fold-change and P<0.05 was considered to indicate a
statistically significant difference.
Gene ontology (GO) and pathway enrichment
analysis of DEGs
GO analysis is used to identify characteristic
biological attributes for DEGs, and Kyoto Encyclopedia of Genes and
Genomes (KEGG) pathway analysis may be used to determine which
signaling pathways are associated with these DEGs. FunRich is a
stand-alone software tool that supports the enrichment analysis for
biological processes, cellular components, molecular functions and
biological pathways (17). GO
enrichment and KEGG pathway analysis were performed using the
FunRich tool. P<0.05 was considered to indicate a statistically
significant difference.
Integration of the protein-protein
interaction (PPI) network and module analysis
STRING (http://www.string-db.org) is a database of known and
predicted PPIs. The STRING database (version 10.0) currently covers
9,643,763 proteins from 2,031 organisms (18). DEGs were mapped to STRING to
analyze interactive associations among DEGs. An interaction score
of >0.4 was considered valid. Subsequently, the network data was
exported as simple tabular text and PPIs were constructed using
Cytoscape software (19). A
plug-in module of MCODE was used to screen for hub proteins
(20). MCODE identifies clusters
(highly interconnected regions) in a network. The criteria were set
as follows: MCODE scores >5 and number of nodes >5.
RNA extraction and reverse
transcription-quantitative polymerase chain reaction (RT-qPCR)
Total RNA was extracted from tissues and cells using
TRIzol reagent (Thermo Fisher Scientific, Inc.) according to the
manufacturer’s protocol. Total RNA was collected from 24 paired CRC
tissues and adjacent control tissues, and six CRC cell lines (LOVO,
DLD-1, Caco2, HT29, SW620 and SW480), as well as control intestinal
mucosal epithelial FHC cells. The detailed information of 24 pair
samples are presented in Table I.
RNA was reverse transcribed to cDNA using a PrimeScript Reverse
Transcription kit (Takara Bio, Inc., Otsu, Japan). The RT reaction
mixture contained 1 µl RNA (500 ng), 2 µl 5X
PrimeScript Buffer, 0.5 µl PrimeScript RT enzyme mix I, 0.5
µl Oligo(dT) primer (50 µM), 0.5 µl random
hexamers (100 µM) and 4.5 µl RNase-free
ddH2O. The tubes were incubated for 37°C for 15 min,
followed by 85°C for 5 sec, and then stored at 4°C in the PCR
instrument. qPCR analysis was performed using SYBR-Green I (Takara
Bio, Inc.) and each experiment was performed in triplicate. The
qPCR reaction mixture contained 10 µl SYBR-Green mix, 0.8
µl forward primer (10 µM), 0.8 µl reverse
primer (10 µM), 1 µl cDNA and 7.4 µl
RNase/DNase free ddH2O. The mixture was centrifuged
(4°C, 1,000 × g, 10 sec) and then placed in an ABI 7500
fluorescence quantitative PCR instrument (Applied Biosystems;
Thermo Fisher Scientific, Inc.). The procedures for the PCR
reaction were as follows: Pre-denaturation at 95°C for 1 min;
denaturation at 95°C for 15 sec; annealing at 60°C for 15 sec; and
extension at 72°C for 34 sec. Following 40 cycles, the Cq value of
each sample was measured. Results were normalized to the expression
of GAPDH as previously described (21). The sequences of the COL1A1 primers
were as follows: Forward, 5′-GAGGGCCAAGACGAAGACATC-3′ and reverse,
5′-CAGATCACGTCATCGCACAAC-3′. The primers were obtained from
PrimerBank (PrimerBank ID 110349771c1), with an amplicon size of
140 bp. The sequences of the GAPDH primers were as follows:
Forward, 5′-GACTCATGACCACAGT CCATGC-3′ and reverse,
5′-AGAGGCAGGGATGATGTT CTG-3′. The 2−ΔΔCq
method was used to calculate relative expression levels of COL1A1
in tissues. ΔCq was calculated as Cq(COL1A1)-Cq(GAPDH), and ΔΔCq
was calculated as ΔCq(Tumor)-ΔCq(Control). As previously described,
GraphPad Prism 6.0 software (GraphPad Software, Inc., La Jolla, CA,
USA) was used for graph construction (22).
 | Table IClinicopathological characteristics
of patients with CRC for RT-qPCR. |
Table I
Clinicopathological characteristics
of patients with CRC for RT-qPCR.
|
Characteristics | Value |
|---|
| Age, years | |
| Range | 33-78 |
| Mean ± SD | 59.25±11.61 |
| Sex, n (%) |
| Male | 9 (37.5) |
| Female | 15 (62.5) |
| AJCC TNM
classification, n (%) |
| I | 1 (4.2) |
| IIA | 2 (8.3) |
| IIB | 8 (33.3) |
| IIIA | 5 (20.8) |
| IIIB | 7 (29.2) |
| IV | 1 (4.2) |
| Lymph node
metastasis, n (%) |
| Yes | 12 (50.0) |
| No | 12 (50.0) |
| Distant metastasis,
n (%) |
| Yes | 1 (4.2) |
| No | 23 (95.8) |
Tissue microarrays and
immunohistochemistry
Tissue microarrays were constructed and
immunostaining was performed using a two-step protocol. The tissue
microarray was purchased from Shanghai Outdo Biotech Co., Ltd.
(catalog no. HCol-Ade150CS-01). Detailed clinicopathological data
of the 75 patients is presented in Table II. The two-step
immunohistochemical detection kit was purchased from Boster
Biological Technology (catalog no. SV0002; Pleasanton, CA, USA).
Experimental procedures were performed according to the
manufacturer’s protocols. COL1A1 expression was measured using the
Q550IW Computerized Image system (Leica Microsystems, Ltd., Milton
Keynes, UK). The images were viewed using Aperio-ImageScope 12.0
software (23). The anti-human
COL1A1 antibody was purchased from Abcam (anti-rabbit; 1:1,000;
catalog no. ab34710; Cambridge, MA, USA). The COL1A1 index was
calculated as the (number of COL1A1-positive cells/total number of
cells) x100% (magnification, x200) as previously described
(24).
| Table IIClinicopathological characteristics
of patients with CRC for immunohistochemistry. |
Table II
Clinicopathological characteristics
of patients with CRC for immunohistochemistry.
|
Characteristics | Value |
|---|
| Age, years |
| Range | 26-83 |
| Mean ± SD | 63.46±12.44 |
| Sex, n (%) | |
| Male | 43 (57.3) |
| Female | 42 (42.7) |
| AJCC TNM
classification, n (%) |
| I | 13 (17.3) |
| IIA | 13 (17.3) |
| IIB | 8 (10.7) |
| IIC | 2 (2.7) |
| IIIB | 24 (32.0) |
| IIIC | 6 (8.0) |
| IVA | 6 (8.0) |
| IVB | 3 (4.0) |
| Lymph node
metastasis, n (%) |
| Yes | 36 (48.0) |
| No | 39 (52.0) |
| Distant metastasis,
n (%) |
| Yes | 9 (12.0) |
| No | 66 (88.0) |
Immunohistochemistry score
The total COL1A1 immunostaining score was calculated
as the sum of the percentage positivity of stained tumor cells and
the staining intensity. The percentage positivity was scored 0-3:
0, <10%; 1, 10-30%; 2, 31-50%; and 3, >50%. The staining
intensity was scored 0-3; 0, no staining; 1, weakly stained; 2,
moderately stained; and 3, strongly stained. The percentage
positivity of cells and staining intensity were decided in a
double-blinded manner. Then, the score of COL1A1 expression was
calculated as the percentage positivity score x staining intensity
score, which ranged between 0 and 9. The final expression level of
COL1A1 was defined as ‘low’ (0-4) and ‘high’ (5-9).
Western blotting
Total proteins were extracted from CRC cells. The
cells were lysed in cold lysis buffer (60 mM Tris-HCl at pH 7.4,
150 mM NaCl, 0.25% SDS and 1% Tergitol-type NP-40) containing 10 mM
NaF, 1 mM Na3VO4 and complete protease
inhibitor (Roche Diagnostics, Basel, Switzerland) for 30 min on
ice, and were then centrifuged at 10,000 × g at 4°C for 15 min as
previously described (25). A
bicinchoninic acid protein assay was used to determine protein
concentration. A total of 45 µg protein was separated on 10%
SDS-PAGE, transferred onto nitrocellulose membranes and blocked
with 5% skimmed milk. Subsequently, the membranes were incubated
with the anti-COL1A1 primary antibody (anti-rabbit; dilution 1:500;
catalog no. ab34710) overnight at 4°C. The next day, membranes were
incubated with the HRP-conjugated goat anti-rabbit secondary
antibody (dilution 1:10,000; catalog no. AS014; ABclonal Biotech
Co., Ltd., Woburn, MA, USA) as previously described (26). Semiquantification of proteins was
performed using a Tanon GIS gel imaging system (Tanon1600; Tanon,
Shanghai, China) as previously described (27).
Construction of a COL1A1 knockout cell
line and transfection
shRNA targeted against COL1A1 was purchased from
Shanghai GenePharma Co., Ltd. (Shanghai, China) with the following
nucleotide sequence: 3′-TTGGTTTGCGATGACGTG-5′. The COL1A1 shRNA (2
µg) and shRNA GFP control plasmids were transfected with
Lipofectamine 2000 (catalog no. 11668019; Invitrogen; Thermo Fisher
Scientific, Inc.) as previously described (26).
Cell counting kit-8 (CCK-8) assay
The CCK-8 proliferation assay kit was purchased from
Nanjing KeyGen Biotech Co., Ltd. (catalog no. KGA317, Nanjing,
China). The cell proliferation assay was performed over 4 days
every 24 h with 1×10³ cells/well. CCK-8 reagent (10
µl) was added to each well, and then the plate was incubated
for 2 h at 37°C. After that, the absorbance was measured at 450 nm
using a Vmax microplate spectrophotometer (Molecular Devices, LLC,
Sunnyvale, CA, USA) as previously described (28). All measurements were performed in
quintuplicate in three separate experiments.
Cell invasion assay
Caco2 and SW480 cells were used for cell invasion
assays. A Transwell filter was purchased from Corning Incorporated
(Corning, NY, USA). The cells were digested with 0.25% trypsin and
seeded into the Transwell upper chamber coated with Matrigel.
RPMI-1640 culture medium was added to the upper chamber, while
RPMI-1640 with FBS was plated into the lower chamber. After 24 h of
culture, the Transwell chamber was removed. Following washing twice
with PBS, the cells were fixed with 4% polyformaldehyde for 20 min
at room temperature, washed twice with PBS and stained with Giemsa
(10 µg/ml) for 20 min at room temperature. Cells that passed
through the Matrigel and the micropores to the lower chamber were
observed under a light microscope. Cells were counted under a light
microscope (magnification, x200) and the invasion percentage was
determined by dividing by the number of cells on the first day as
previously described (29).
Bioinformatics analysis of COL1A1 and
NEK2 expression levels
COL1A1 and NEK2 expression was analyzed in CRC
tissues compared with adjacent tissues based on the Oncomine
microarray dataset (https://www.oncomine.org/resource/login.html). The
genes associated with NEK2 were calculated using GEPIA (http://gepia.cancer-pku.cn/index.html).
Statistical analysis
Data were analyzed using SPSS 20.0 statistical
software (IBM Corp., Armonk, NY, USA). Quantitative data are
presented as the mean ± standard deviation of at least three
independent experiments. The differences between multiple groups
were used analysis of variance followed by the Tukey’s post hoc
test, and two groups were examined using a two-tailed Student’s
t-test. Correlation analysis was determined using Pearson’s
correlation analysis. The associations between COL1A1 expression
and clinicopathological characteristics were determined using the
χ2 test. P<0.05 was considered to indicate a
statistically significant difference. P<0.05; P<0.01;
P<0.001.
Results
Identification of DEGs common for
KRASWT and KRASMUT CRC
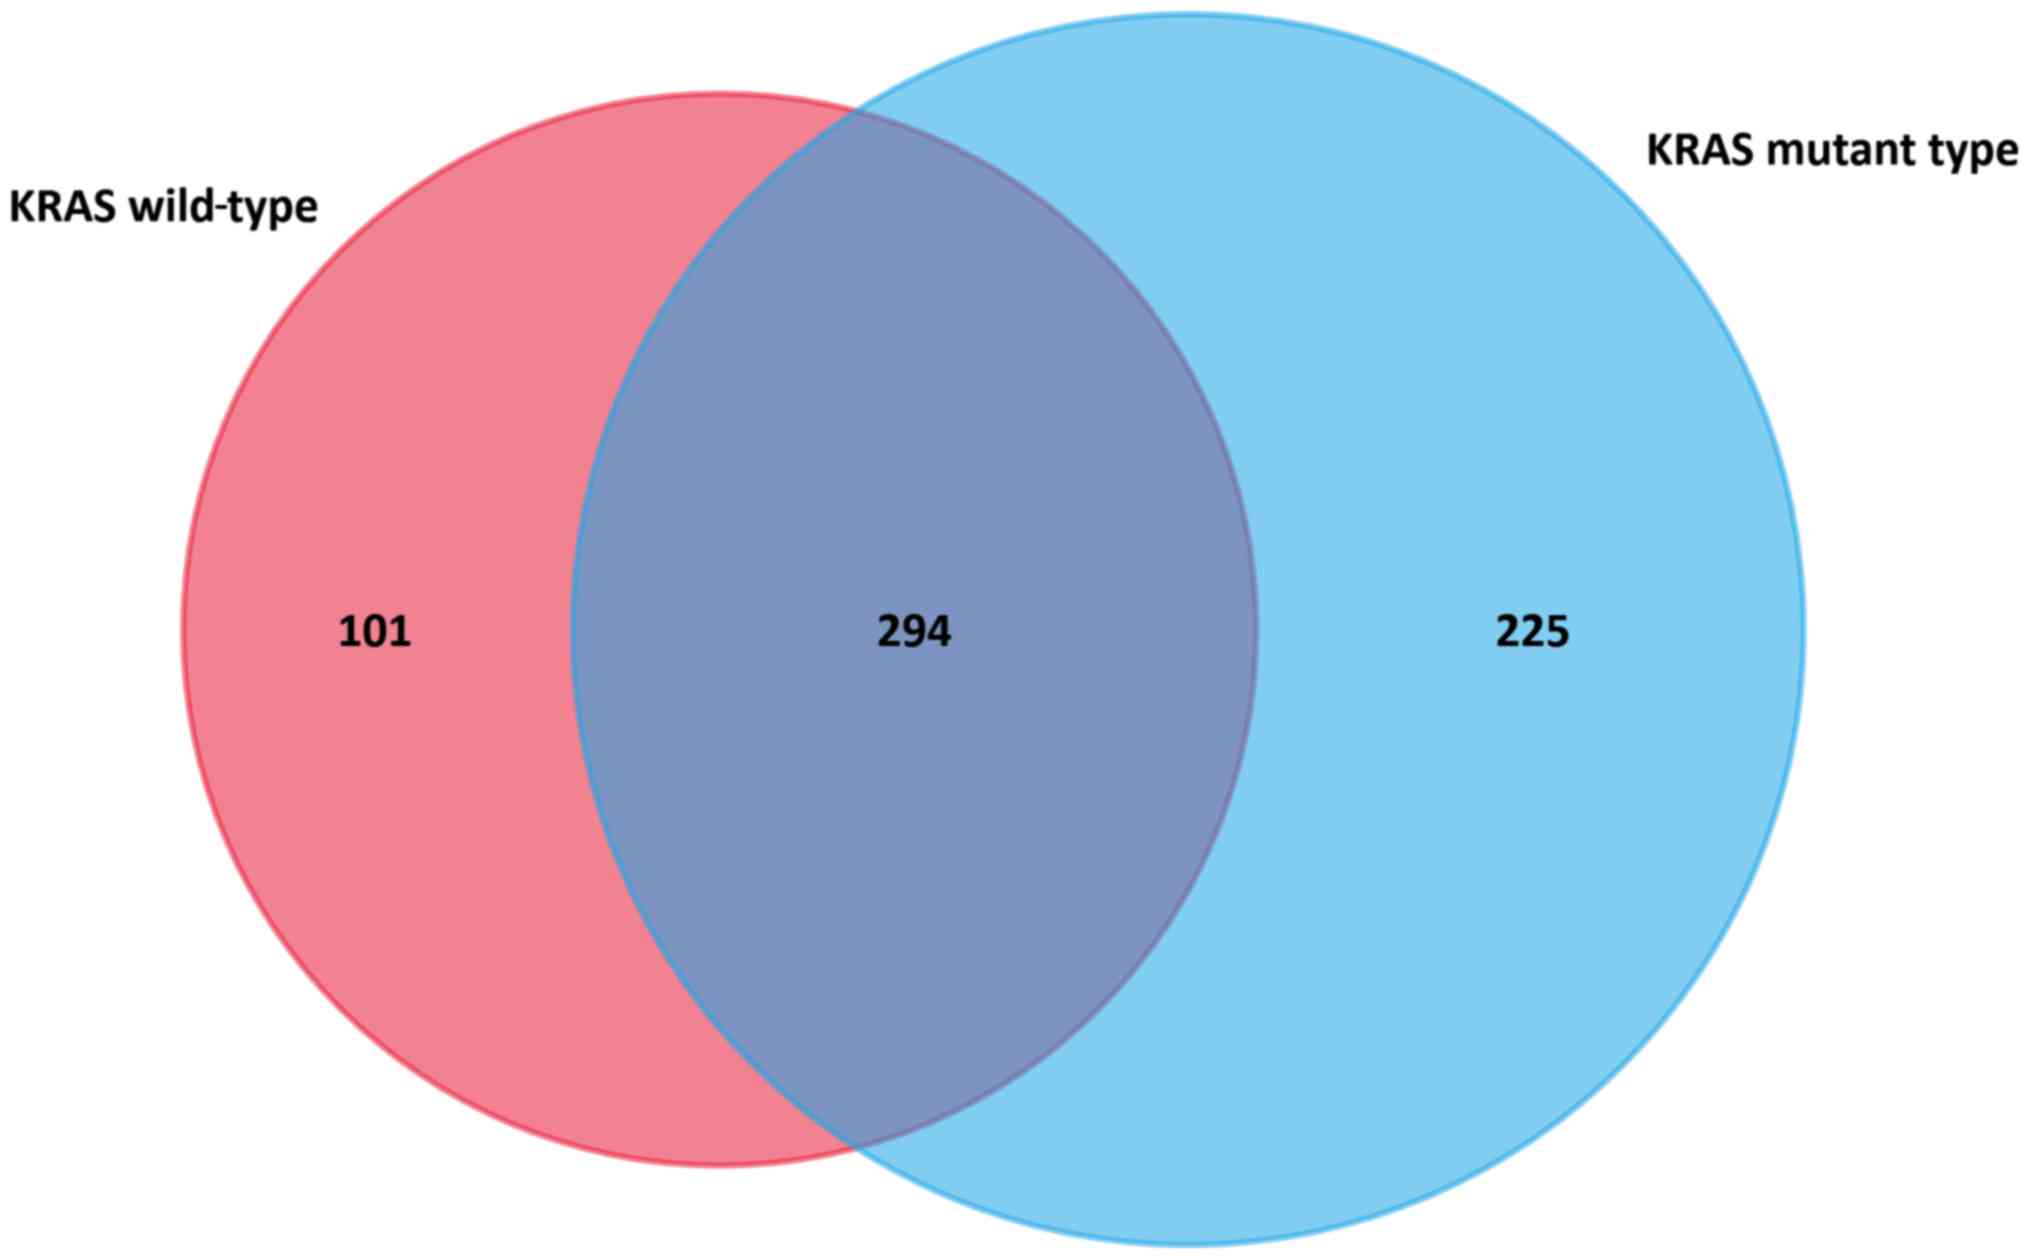
Paired KRASWT cancer samples and adjacent
control tissues were analyzed using GEO2R, which led to the
identification of 395 upregulated DEGs. Similarly, eight paired
KRASMUT cancer samples and adjacent control tissues were
analyzed, whereby 519 upregulated DEGs were identified. The
intersection of DEGs included 294 common DEGs that were independent
of the KRAS genotype (Fig. 1).
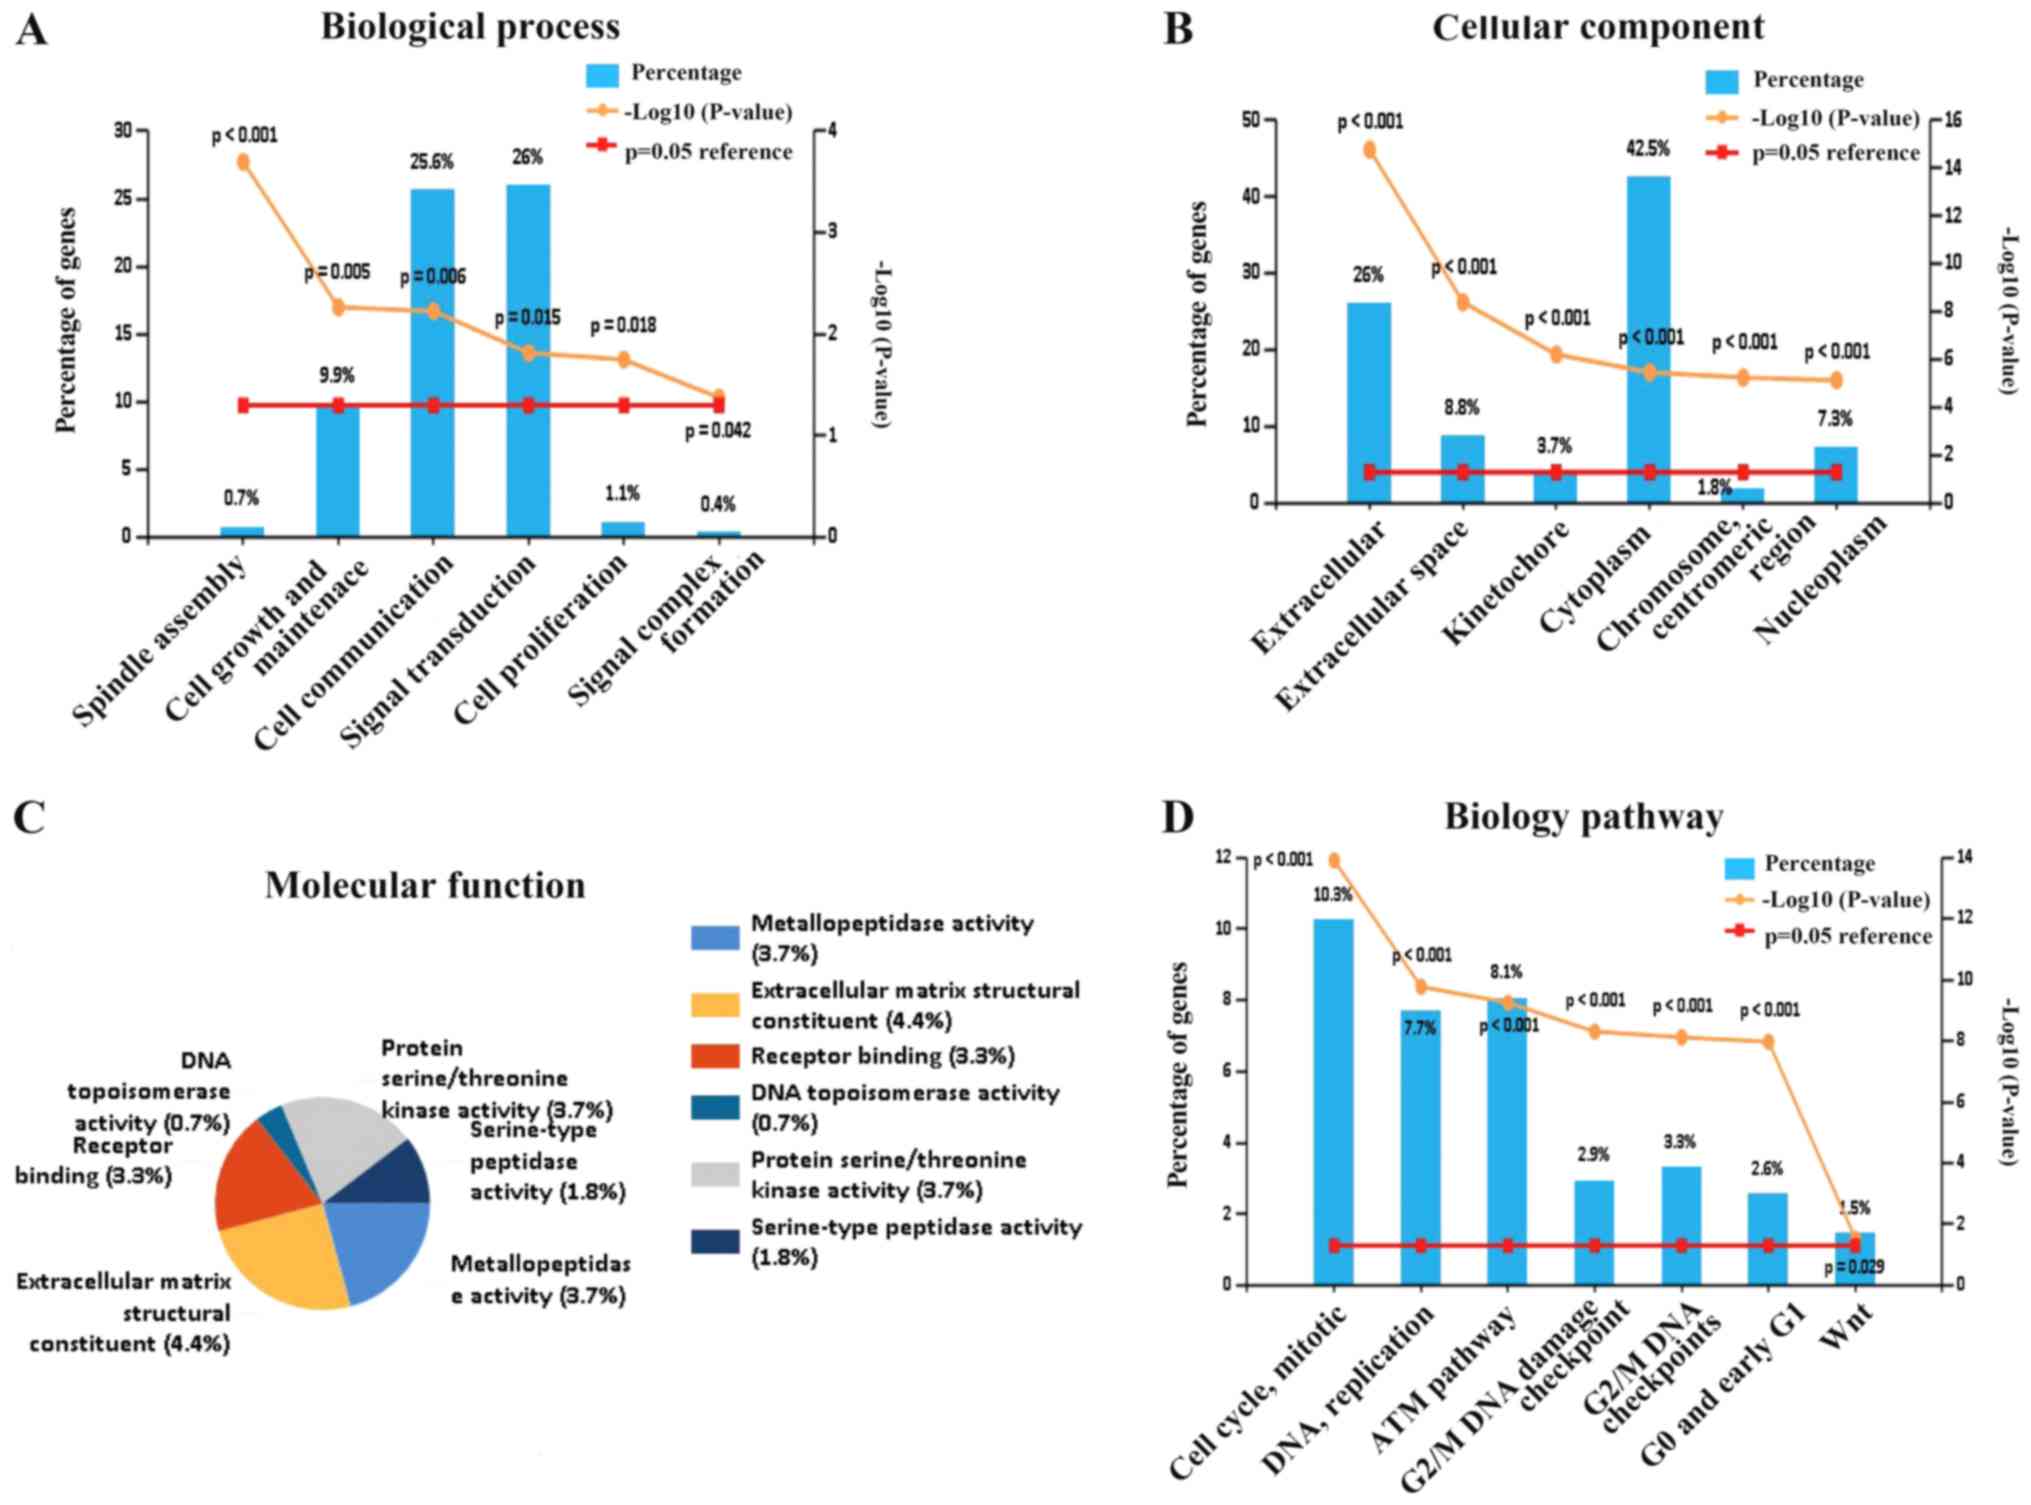
GO and pathway analysis
Regarding biological processes, upregulated common
DEGs exhibited enrichment for cell communication, signal
transduction and cell growth (Fig.
2A). Cell component analysis revealed enrichment in
cytoplasmic, extracellular and extracellular compartments (Fig. 2B). Regarding molecular function,
the DEGs were enriched in metallopeptidase activity, extracellular
matrix structural constituents and receptor binding (Fig. 2C). The pathway analysis revealed
enhanced involvement in cell cycle, DNA replication and the WNT
signaling pathway (Fig. 2D).
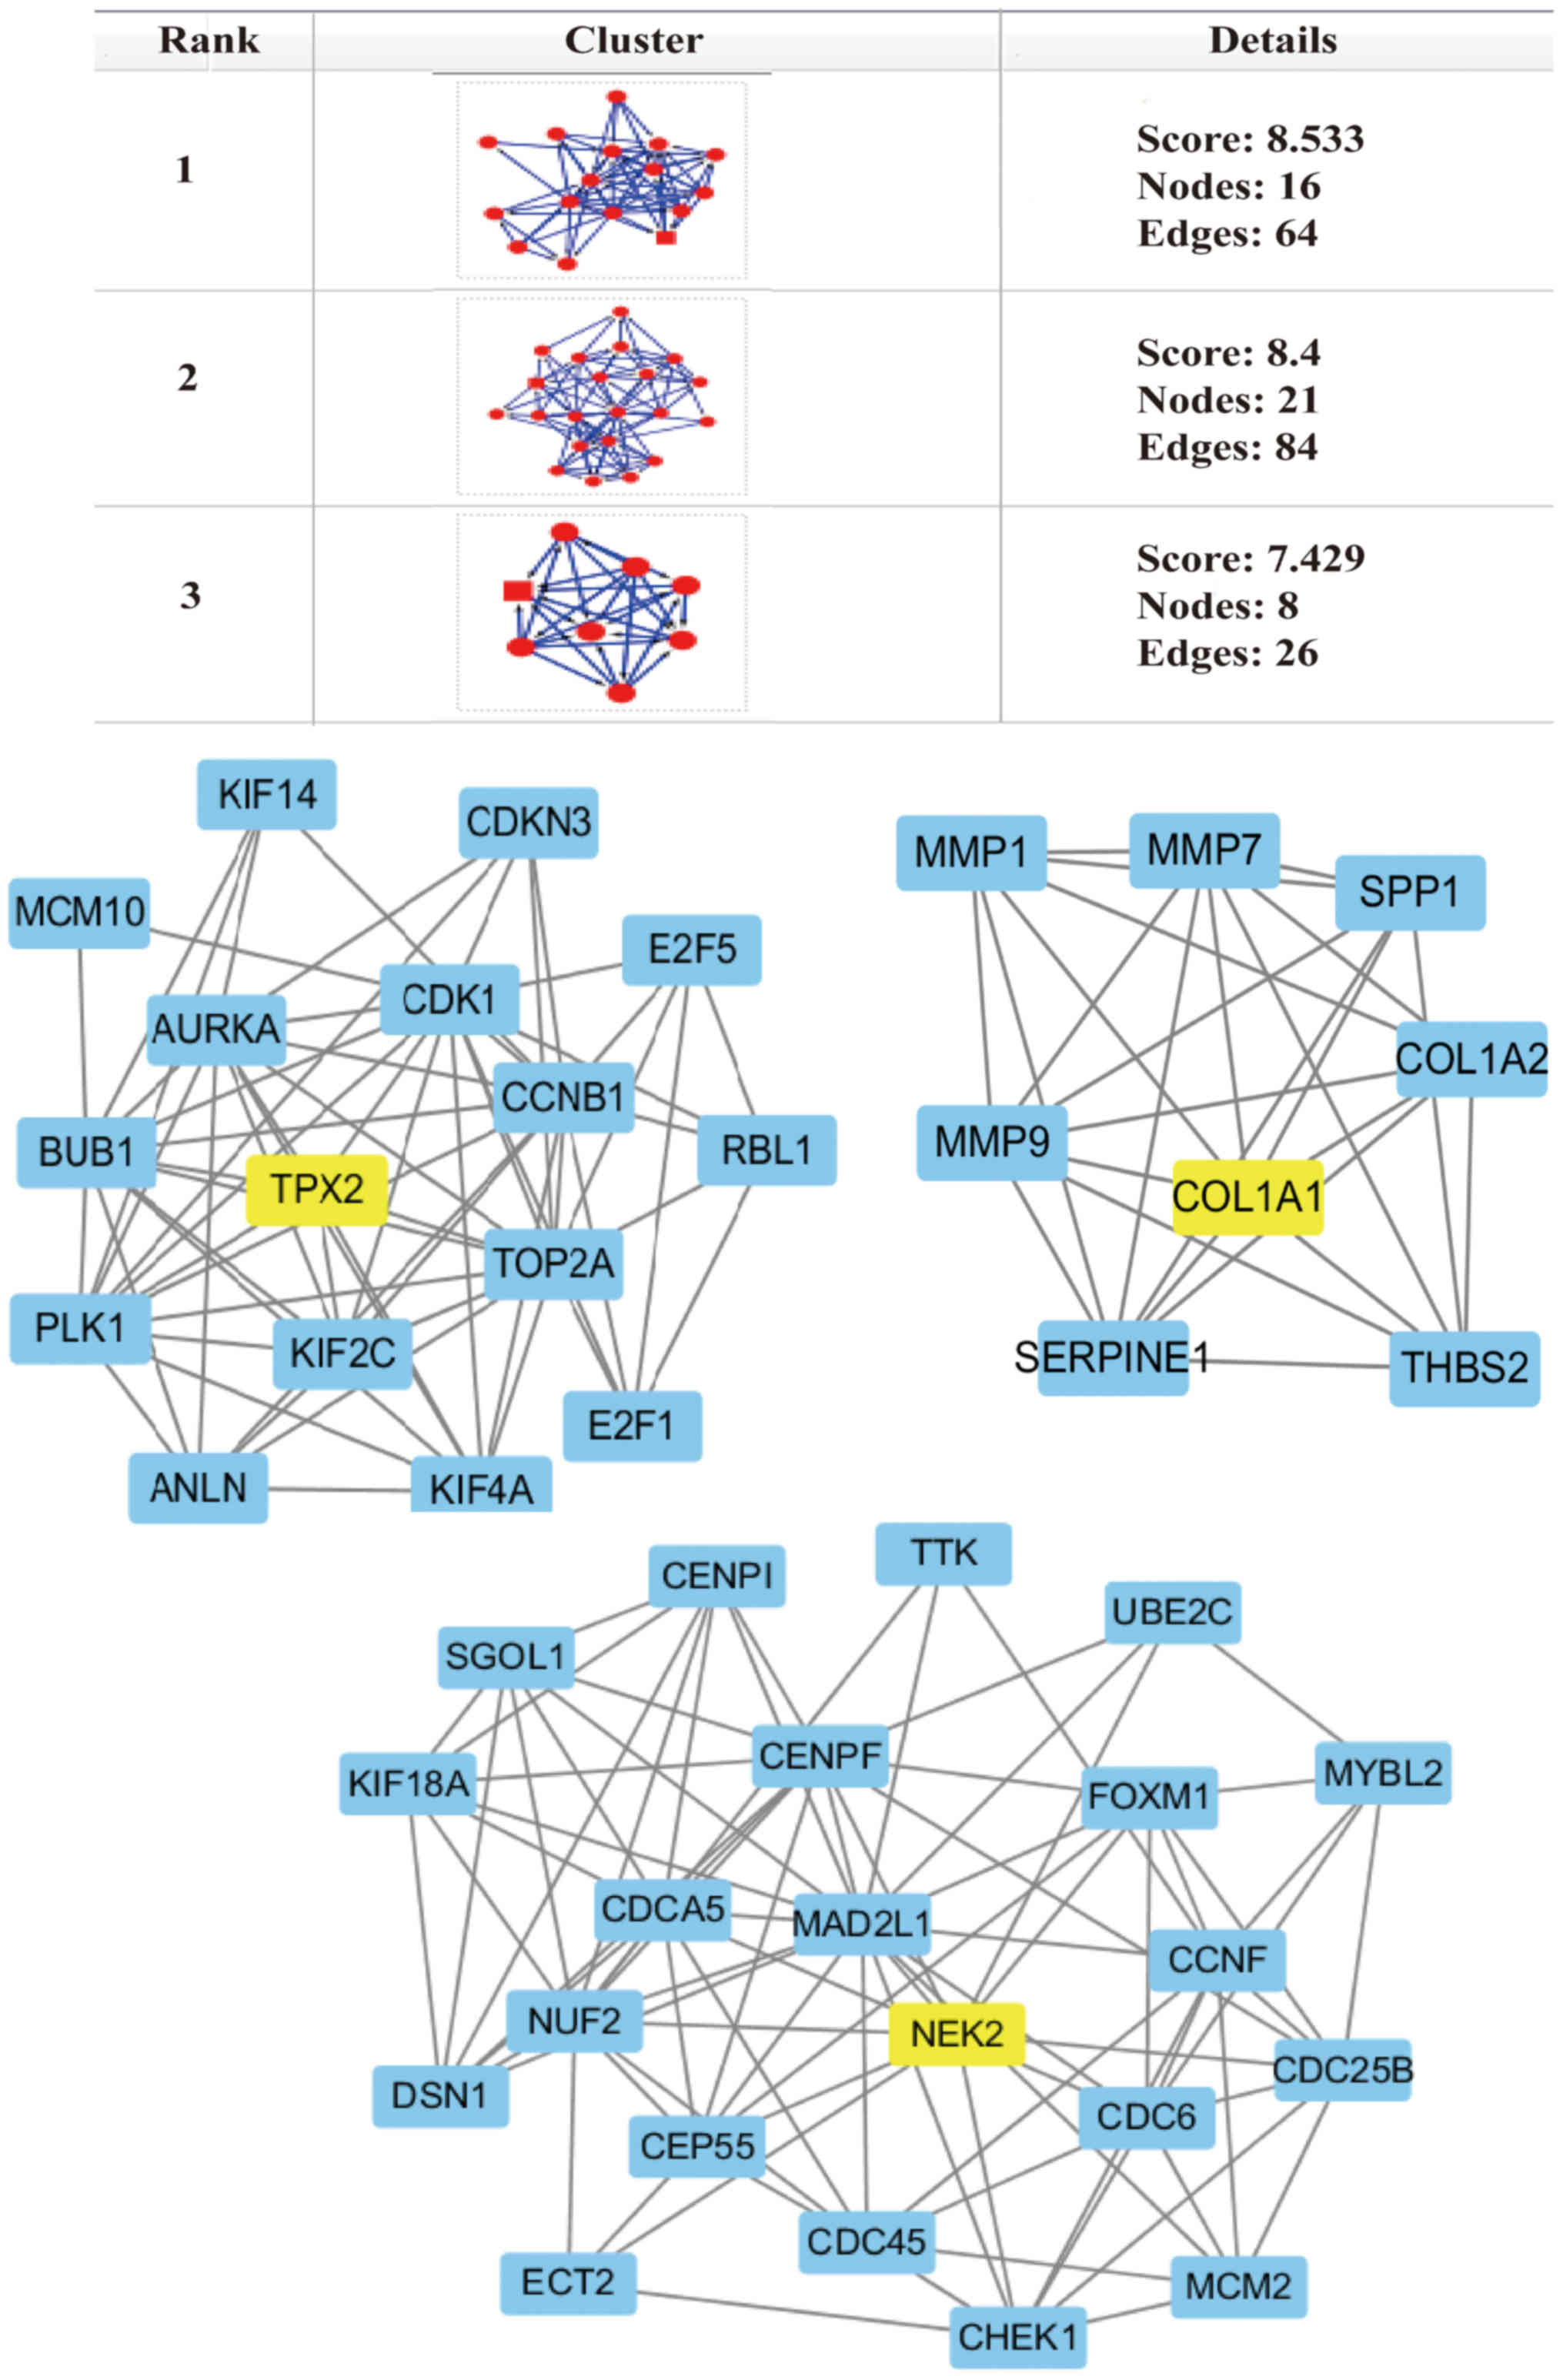
Hub-protein screening from the PPI
network
Based on data from the STRING database, the top
three hub modules that satisfied the preset criteria (MCODE score
>5 with the number of nodes >5), including TPX2 microtubule
nucleation factor (TPX2), NIMA related kinase 2 (NEK2) and COL1A1,
were identified using Cytoscape software analysis (Fig. 3). The expression levels of COL1A1
were upregulated 2.1-fold, while NEK2 was increased 1.5-fold in
cancer tissues compared to healthy tissues. Drugs targeting NEK2
(Drugbank ID, DB07180; https://www.drugbank. ca/drugs/DB07180) and COL1A1
were identified using Drugbank (Drugbank ID, DB04866; https://www.drugbank.ca/drugs/DB04866),
while no drugs targeting TPX2 were identified. Only one type of
drug that targets NEK2 was identified and it is in the experimental
phase. There are four types of drugs that target COL1A1, but only
halofuginone is associated with cancer therapy and is currently in
the approval process. Halofuginone is able to inhibit matrix
metalloproteinase (MMP) and cell proliferation, as well as inhibit
tumor matrix support, vascularization, cell invasion and cell
proliferation (30). Therefore,
COL1A1 and NEK2 may serve key roles in cancer development, and
their target drugs may have important clinical application
value.
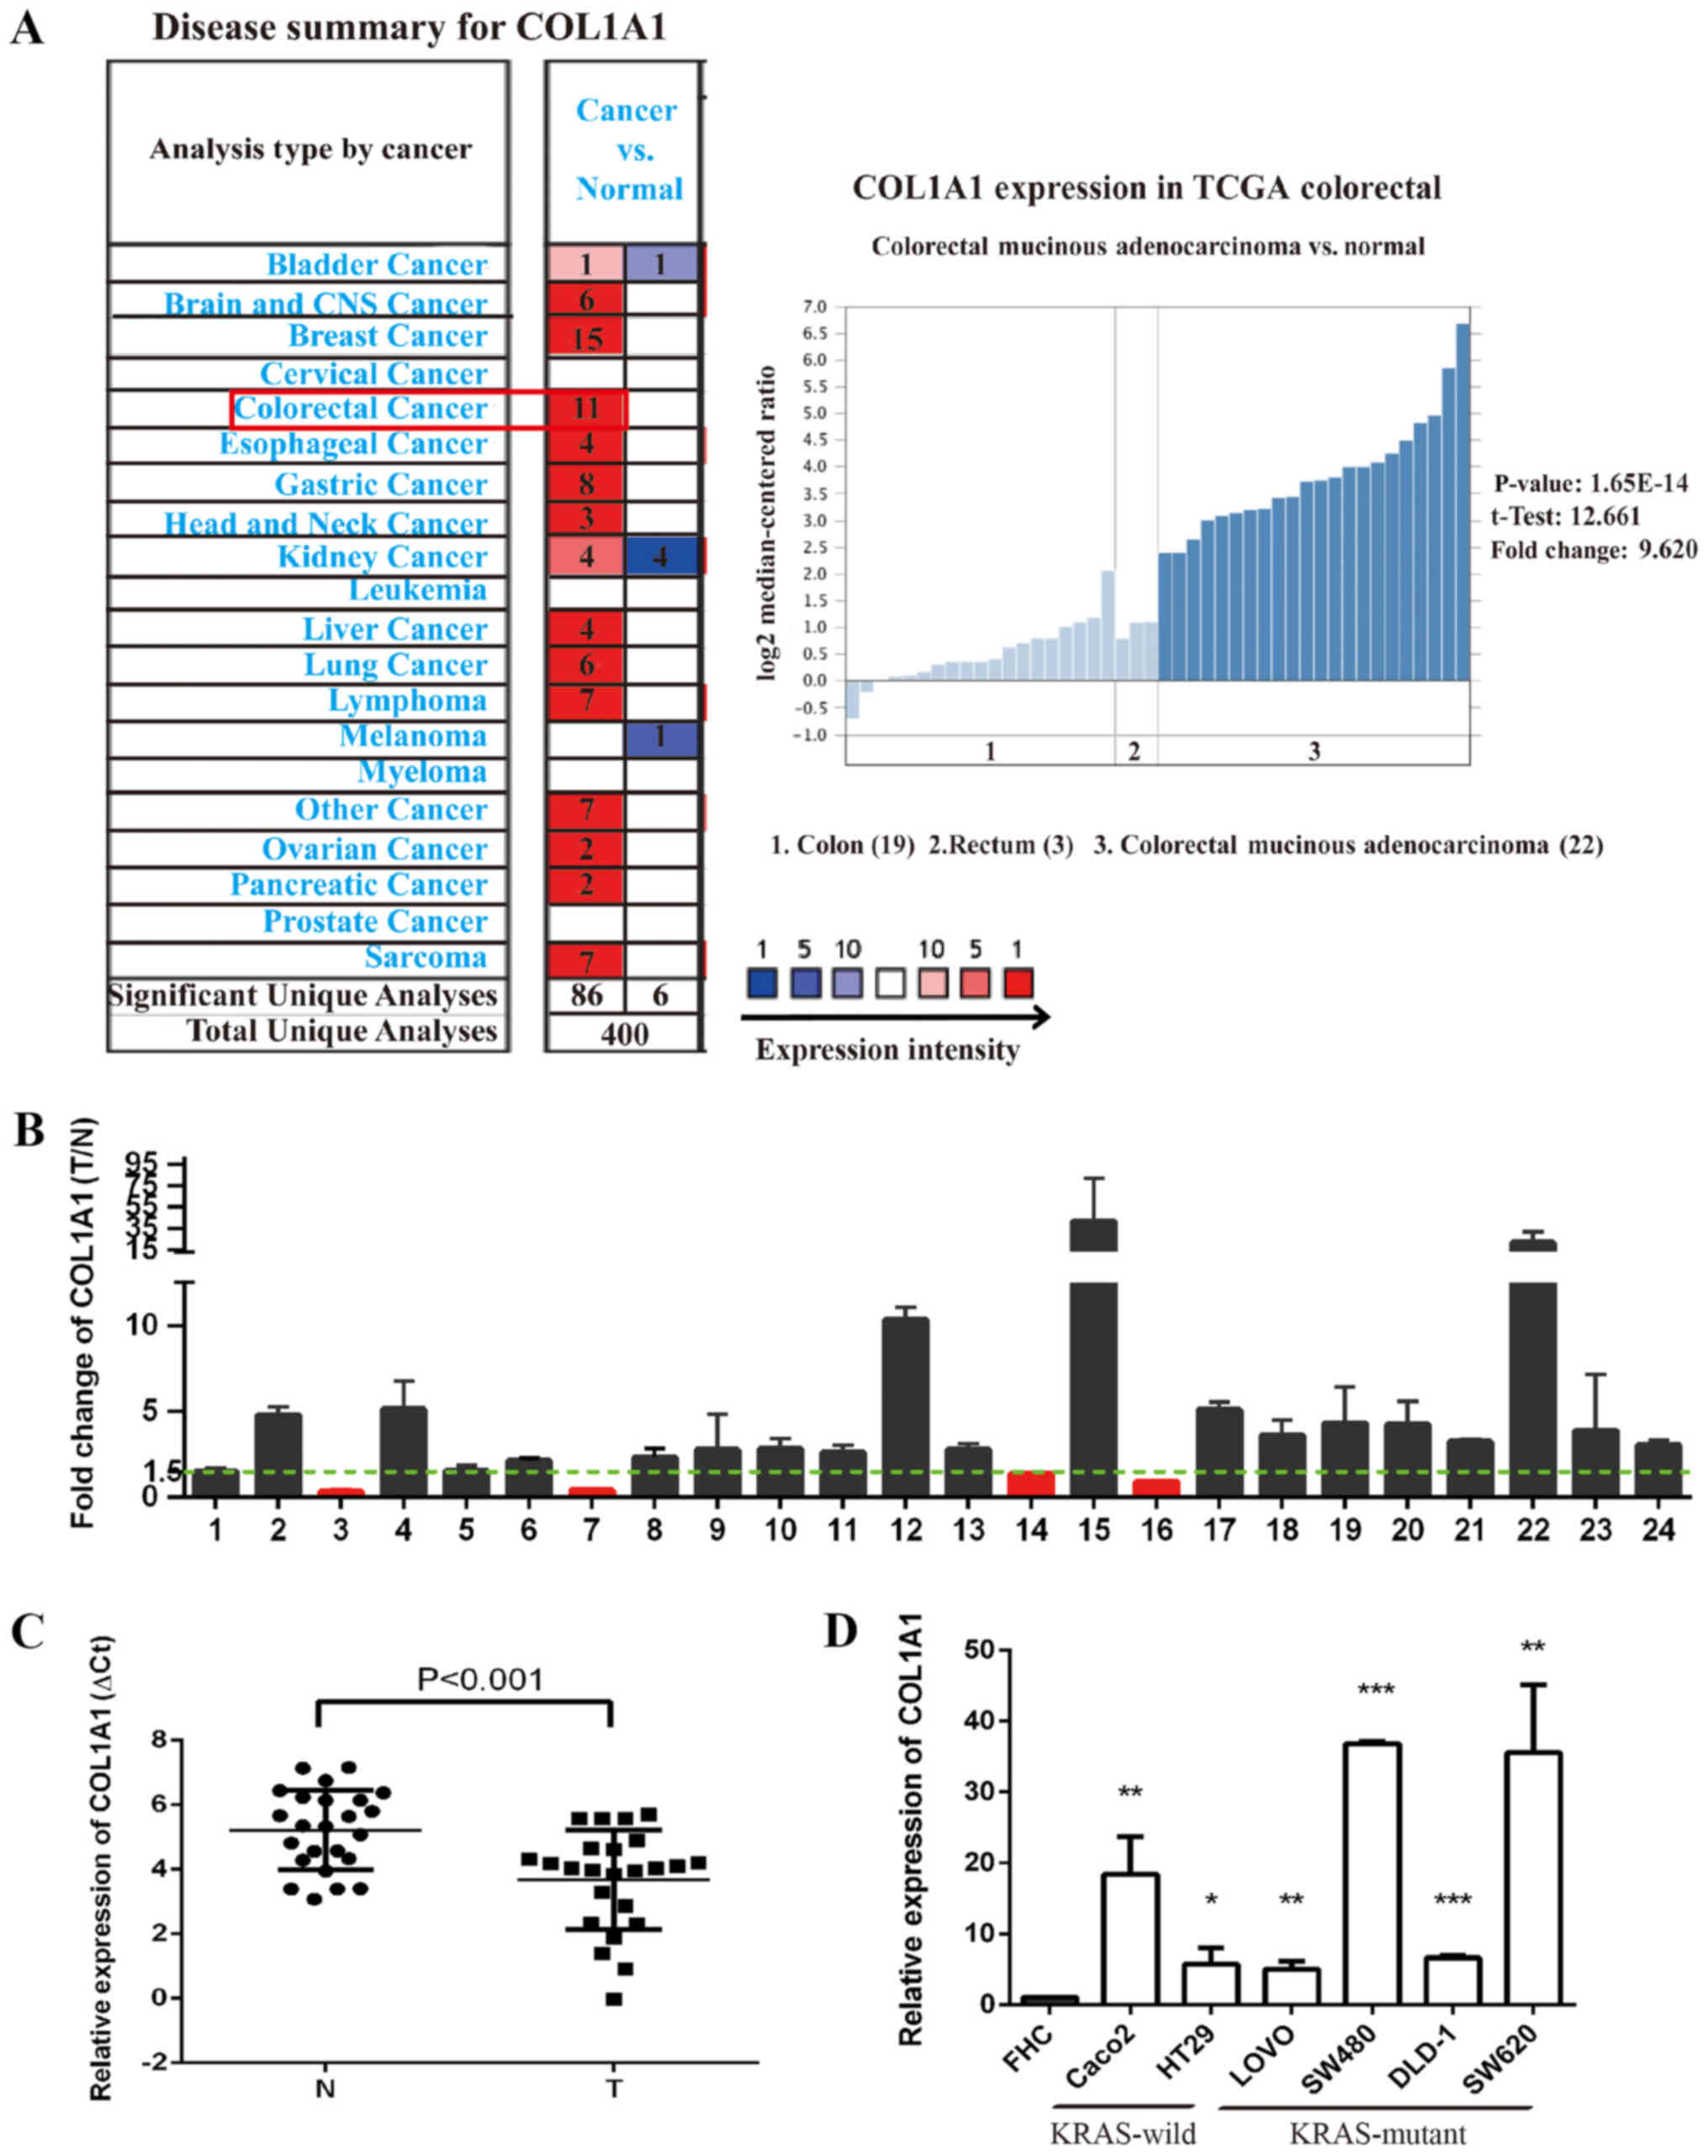
COL1A1 mRNA is upregulated in CRC tissues
and cells regardless of KRAS genotype
COL1A1 was identified to be significantly
upregulated in CRC tissues compared with adjacent tissues based on
the Oncomine microarray dataset, which is a web-based data-mining
platform (31) (Fig. 4A). In the Oncomine database, all
the CRC chip results were upregulated. Of the 11 upregulated
microarray databases, The Cancer Genome Atlas (TCGA; http://cancergenome.nih.gov/) database was selected to
further determine the expression patterns of COL1A1. TCGA is a
powerful database platform for integration of multiple cancer
genome sequencing data. This database included 19 colon specimens,
three rectum specimens and 22 colorectal mucosa adenocarcinoma
specimens. The results demonstrated that COL1A1 expression was
upregulated 9.62-fold in CRC specimens compared with control
colorectal tissue specimens. Additionally, the expression level of
COL1A1 mRNA in tumor and non-tumor tissues from 24 patients with
CRC was confirmed. RT-qPCR analysis revealed significantly higher
COL1A1 mRNA expression in 20/24 CRC specimens compared with the
adjacent control mucosa tissues (P<0.001; Fig. 4B and C). The expression levels of
COL1A1 mRNA were further evaluated in six KRASWT and
KRASMUT CRC cell lines, LOVO, DLD-1, Caco2, HT29, SW620
and SW480. Compared with the control colorectal epithelium FHC
cells, the expression levels of COL1A1 mRNA were significantly
upregulated in all investigated CRC cell lines (Fig. 4D).
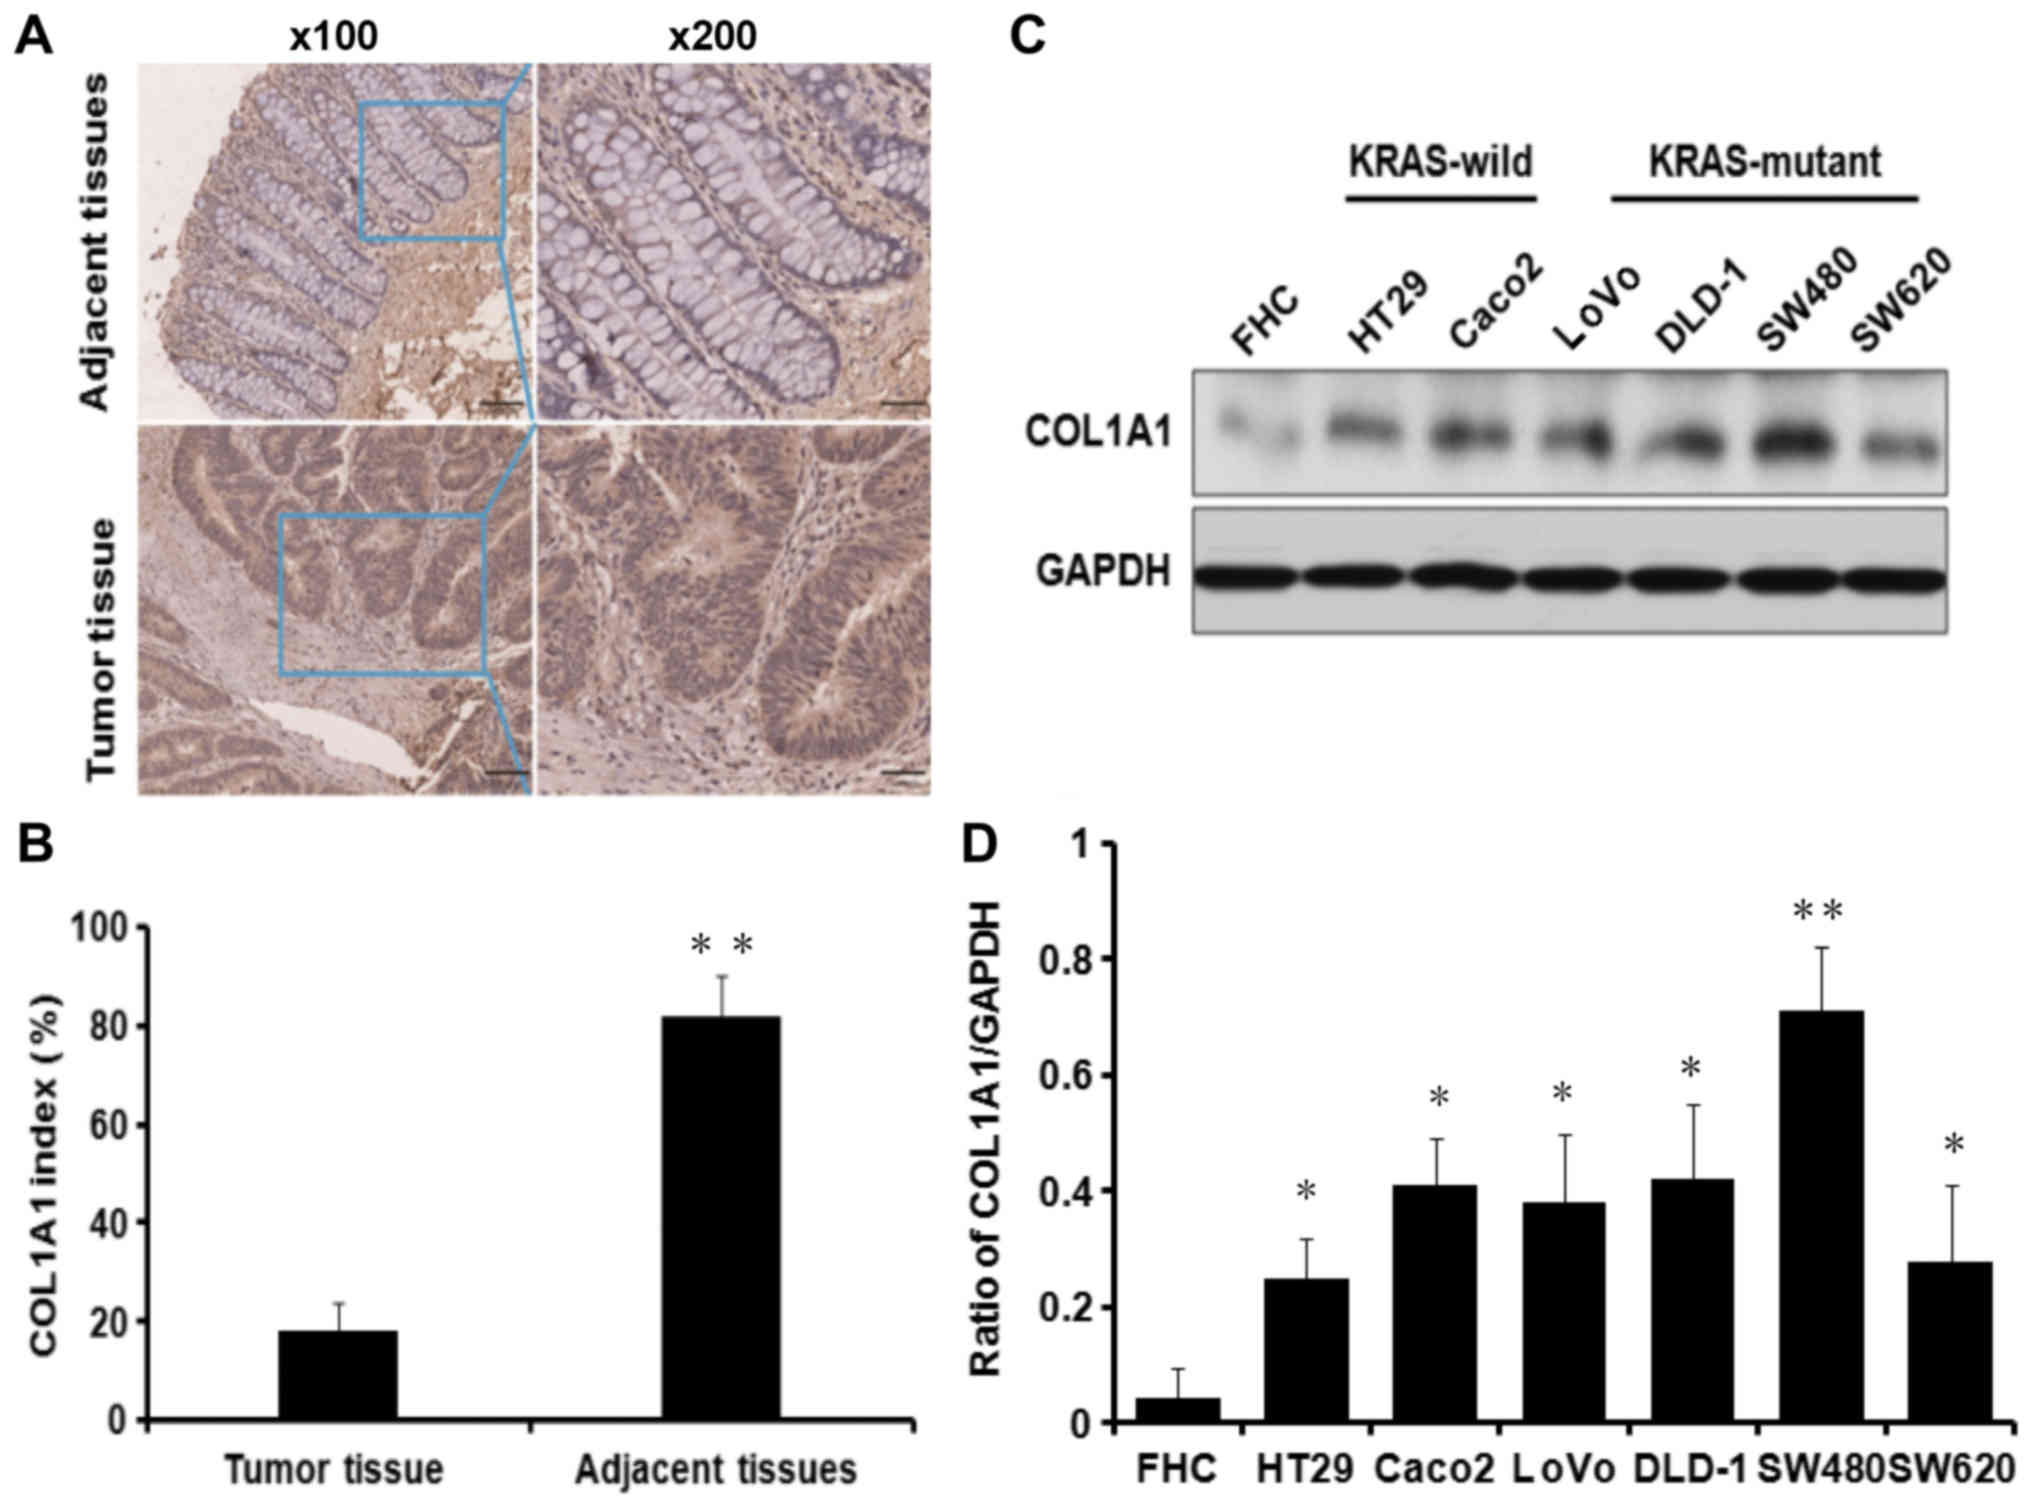
COL1A1 protein is upregulated in CRC
tissues and cells regardless of KRAS genotype
The protein expression levels of COL1A1 in 75 paired
CRC and adjacent control tissues were determined using tissue
microarray. COL1A1 protein expression was significantly higher in
CRC tissues compared with adjacent tissues (Fig. 5A and B). Furthermore, in order to
investigate the clinicopathological significance of COL1A1, the
expression of COL1A1 was divided into a high-expression group
(n=12) and a low-expression group (n=12) based on the median COL1A1
expression level, which was 5.191489802. It was demonstrated that
COL1A1 expression was positively associated with serosal invasion,
lymph node metastasis and distant metastasis in CRC, but not with
sex, age or tumor size (Table
III). The expression of COL1A1 protein was also detected in CRC
cell lines. The expression of COL1A1 protein was significantly
upregulated in the investigated CRC cell lines compared with that
in FHC cells, independent of KRAS status (Fig. 5C and D). These results indicated
that the expression of COL1A1 mRNA and protein in CRC cells was
increased, regardless of whether KRAS was mutated or not.
Therefore, COL1A1 may be effective as a drug target for KRASMU or
KRASWT CRC.
| Table IIIClinicopathological characteristics
of COL1A1 expression in patients with CRC. |
Table III
Clinicopathological characteristics
of COL1A1 expression in patients with CRC.
| Clinicopathological
variables | No. | High
expression | Low expression | χ2 | P-value |
|---|
| Age, yearsa |
| <63 | 32 | 16 | 16 | 0.010 | 0.999 |
| ≥63 | 43 | 22 | 21 | | |
| Sex |
| Male | 43 | 22 | 21 | 0.010 | 0.999 |
| Female | 32 | 16 | 16 | | |
| Tumor size
(cm3)b |
| <36.5 | 52 | 21 | 29 | 0.250 | 0.803 |
| ≥36.5 | 25 | 9 | 16 | | |
| Serosal
invasion |
| Yes | 61 | 27 | 34 | 5.362 | 0.036 |
| No | 14 | 11 | 3 | | |
| Lymph
metastasis |
| Yes | 39 | 15 | 24 | 4.842 | 0.038 |
| No | 36 | 23 | 13 | | |
| Distant
metastasis |
| Yes | 9 | 1 | 8 | 6.402 | 0.014 |
| No | 66 | 37 | 29 | | |
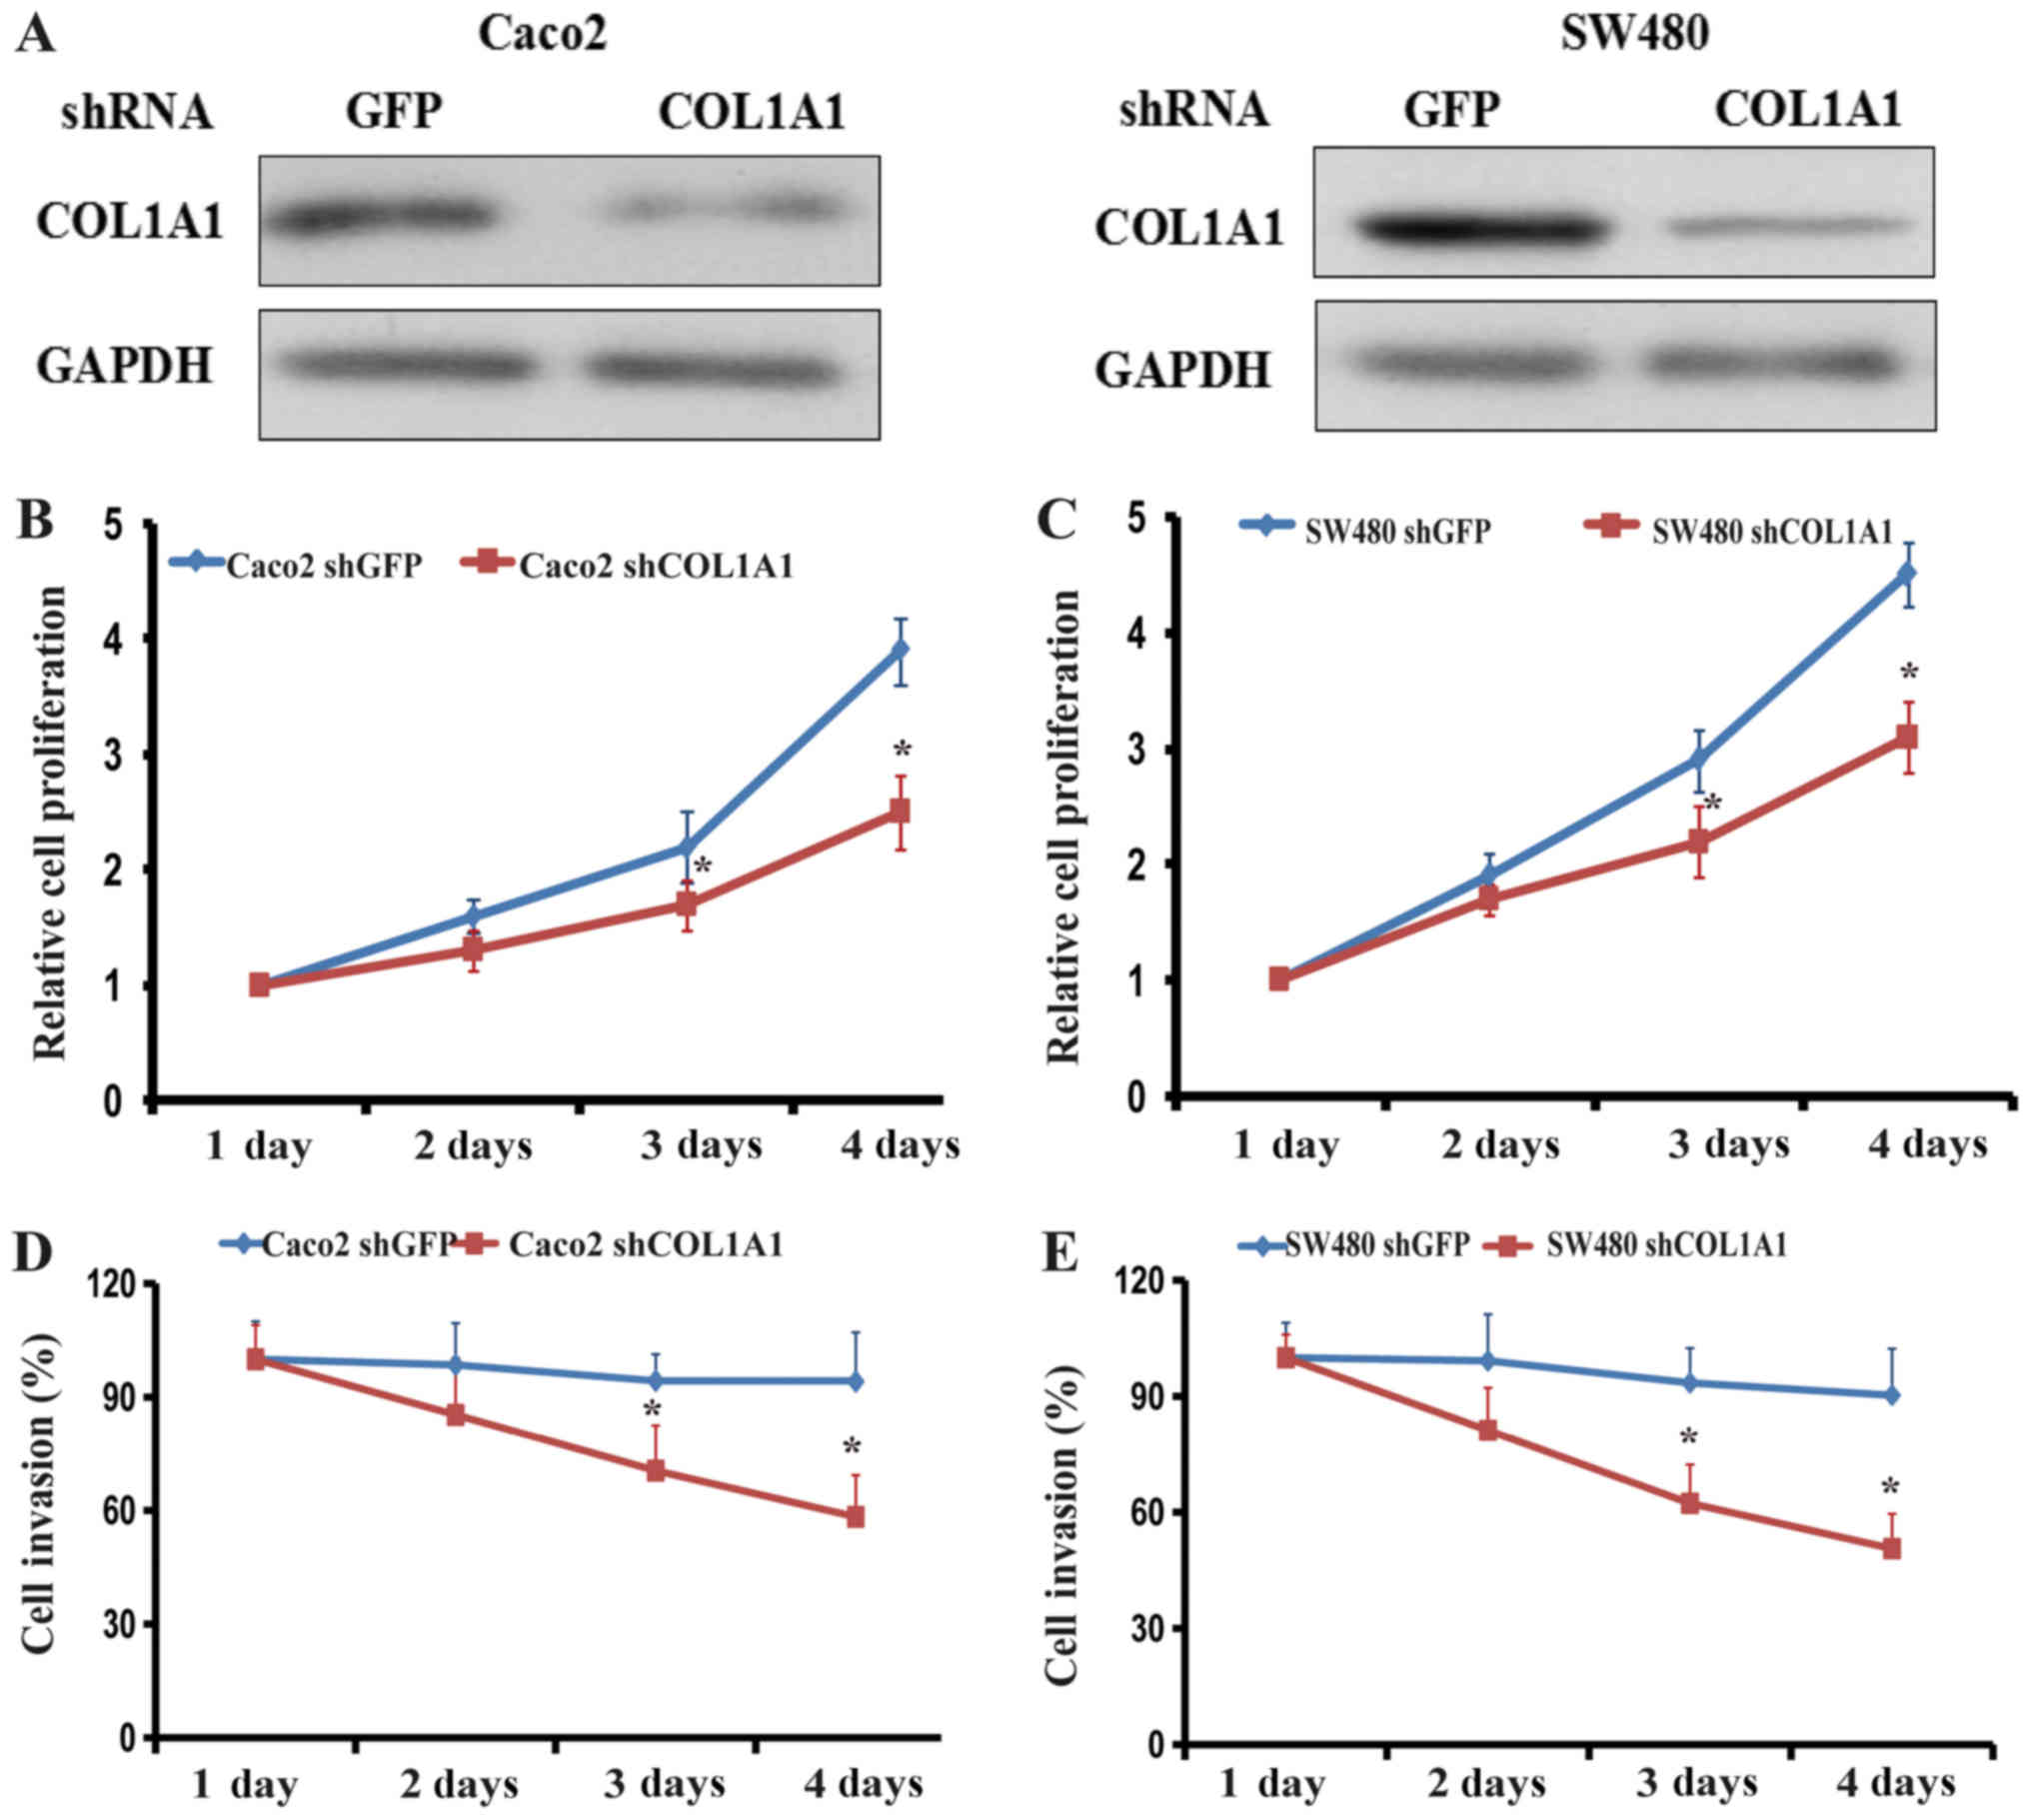
Inhibition of COL1A1 suppresses
proliferation and invasion in KRASWT and
KRASMUT CRC cell lines
Based on the obtained results, two CRC cells lines
Caco2 (KRASWT) and SW480 (KRASMUT) were
selected to explore the role of COL1A1 in cell proliferation and
invasion. shRNA COL1A1 was used to inhibit the expression of the
COL1A1 in the two cell lines and the efficiency of transfection was
assessed by western blotting (Fig.
6A). The cell proliferation assay demonstrated that inhibition
of COL1A1 significantly decreased the proliferation of Caco2 and
SW480 cells (Fig. 6B and C).
Proliferation decreased from the second day and was most notable on
the fourth day in the two cell lines. Similarly, inhibition of
COL1A1 significantly decreased the invasive abilities of Caco2 and
SW480 cells by day 3 (Fig. 6D and
E).
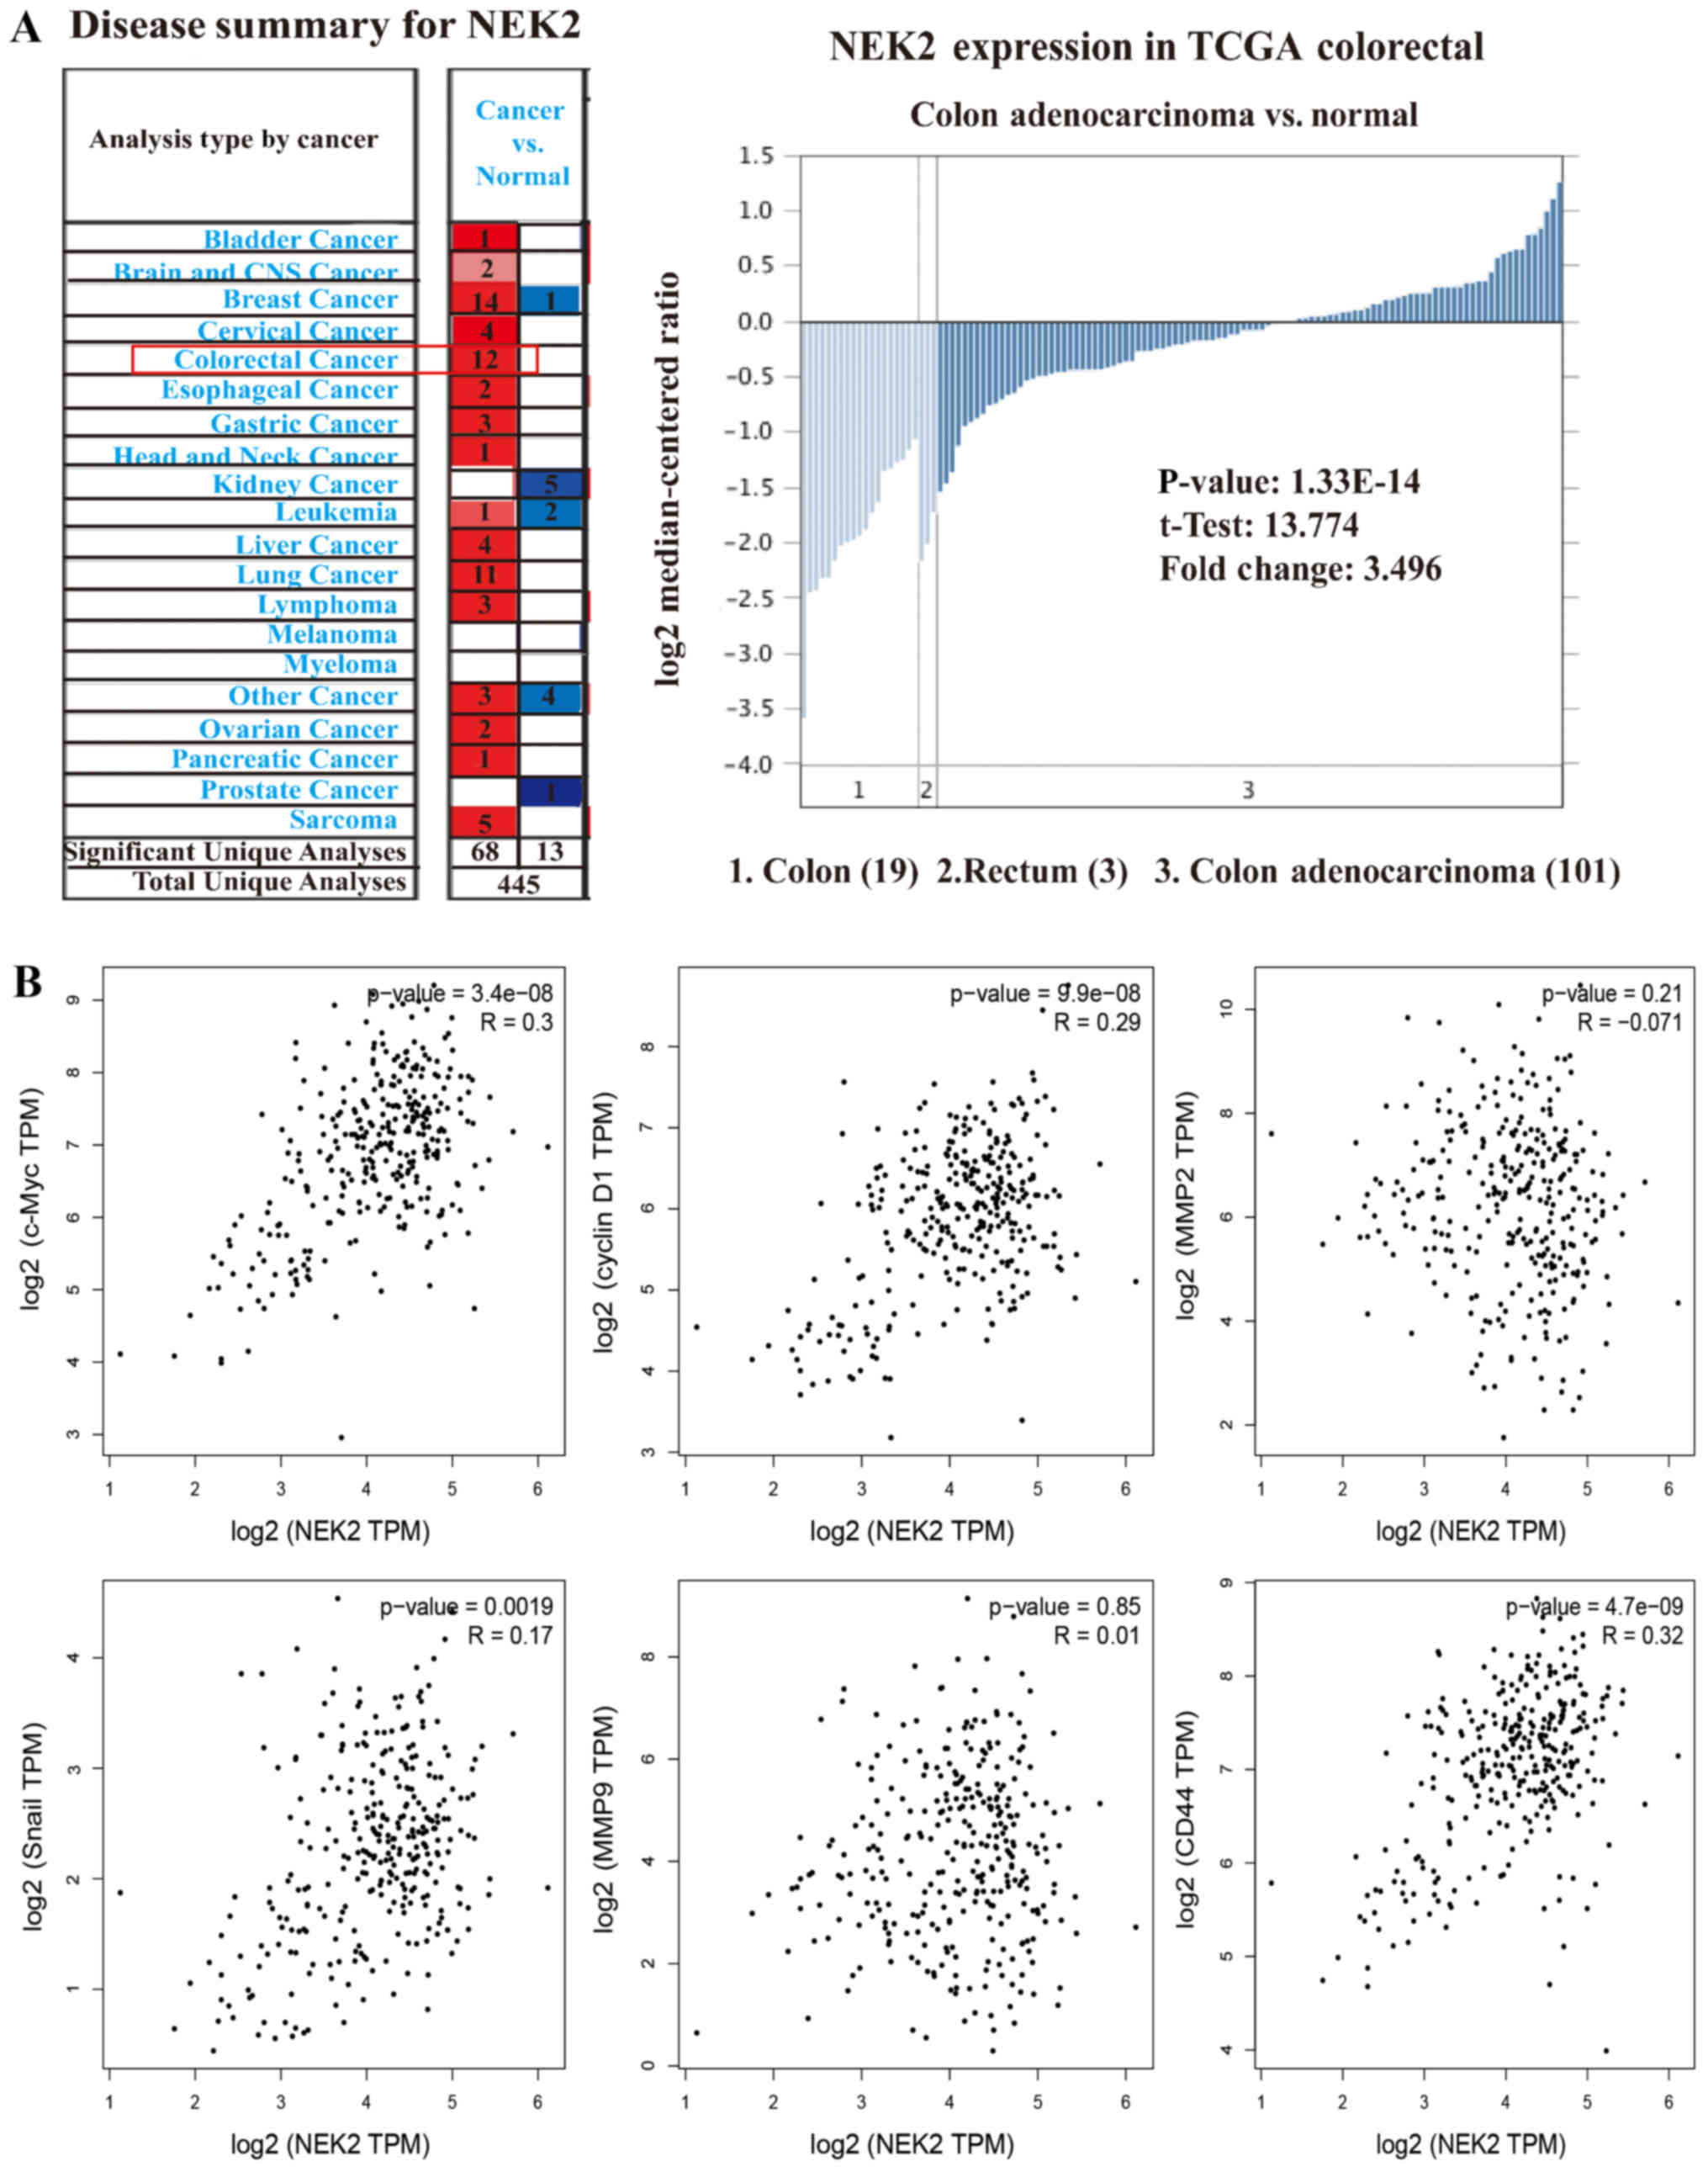
Bioinformatics analysis of NEK2
expression level and function
NEK2 was upregulated in CRC tissues compared with
adjacent tissues based on the Oncomine microarray dataset. The
results of the TCGA database analysis are presented in Fig. 7A. This database included 19 colon
specimens, three rectum specimens and 101 colorectal mucosa
adenocarcinoma specimens. The results demonstrated that NEK2
expression was upregulated 3.496-fold in CRC specimens compared
with control colorectal tissue specimens. Furthermore, the results
from the TCGA data revealed that NEK2 was significantly correlated
with MYC proto-oncogene bHLH transcription factor (c-Myc), Cyclin
D1, cluster of differentiation (CD)44 and Snail genes, but not with
MMP9 or MMP2 (Fig. 7B). The data
were calculated using GEPIA (http://gepia.cancer-pku.cn/index.html) (Fig. 7). These results suggested that NEK2
may serve a role in tumor proliferation and metastasis, but that it
does not promote metastasis by dissolving matrix components.
 | Figure 7Bioinformatics analysis of NEK2
expression level and function. (A) Expression levels of NEK2 mRNA
with CRC tissues and control tissues in Oncomine. Colour changing
from blue to red indicates expression becoming stronger. The graph
on the right is the results from TCGA database. The results showed
that NEK2 expression was upregulated 3.496-fold in CRC specimens
compared with control colorectal tissue specimens. (B) Pearson’s
correlation analysis of NEK2 and associated genes. We used the
services provided by the website GEPIA (http://gepia.cancer-pku.cn/index.html) to examine the
correlations between c-Myc, Cyclin D1, CD44, Snail, MMP9 and MMP2.
CRC, colorectal cancer; KRAS, KRAS proto-oncogene GTPase; NEK2,
NEK2, NIMA related kinase 2; MMP, matrix metalloproteinase; CD,
cluster of differentiation; TCGA, The Cancer Genome Atlas; c-Myc,
MYC proto-oncogene bHLH transcription factor; TPM, trans per
million, a method for the standardization of expression values. |
Discussion
CRC is one of the most common types of malignancies,
with >1.2 million patients being diagnosed with CRC and the
number of mortalities exceeding 600,000 every year worldwide
(32). In the United States and
other Western countries, the incidence of colorectal cancer ranks
third among all malignant tumors, and the mortality rate in males
and in females ranks second and third, respectively (1). Surgical treatment is primarily used
at the early stages; however, ~80% of patients are diagnosed with
colon cancer at the late stage (2).
The FDA has approved cetuximab and panitumumab for
the treatment of advanced CRC. These antibodies target human EGFR
(33). Initially, these targeted
drugs were used in all patients with CRC, but it was later noted
that only KRASWT patients respond well to treatment,
whereas in KRASMUT patients the application of
antibodies may be not only ineffective, but also harmful (7). Since the proportion of
KRASMUT patients is ~40% (34), it is important to explore novel
drug targets for CRC.
In order to identify drugs targeting genes that are
uniformly effective in KRASWT and KRASMUT
CRC, bioinformatics techniques were used to analyze CRC samples
from the GSE38026 gene expression dataset. A total of 294 commonly
upregulated genes outside of the KRAS pathway were identified in
the present study. These genes serve as a pool of potential
uniformly effective therapy targets for CRC.
The results of GO and KEGG analyses demonstrated
that the DEGs were enriched for genes involved in cell
proliferation, signal transduction and tumor pathways. The PPI
network analysis identified three core genes; TPX2,
NEK2 and COL1A1. The expression levels of COL1A1 and
NEK2 in CRC tissues were upregulated by 2.1- and 1.5-fold compared
with healthy tissues, respectively. Drugbank was also searched, and
drugs specifically targeting NEK2 and COL1A1 were identified
(35). The one drug targeting NEK2
is 5-[(Z)-(5-Chloro-2-oxo-1,2-dihydro-3H-indol-3-ylidene)
methyl]-N,2,4-trimethyl-1H-pyrrole-3-carboxamide. This drug is
currently being investigated; thus, its pharmacological effect
remains unclear. There are four drugs targeting COL1A1, only the
role of halofuginone has been associated with cancer treatment, and
is currently in the approval process (36). Halofuginone is an effective
inhibitor of COL1A1 and MMP2 gene expression, and inhibits
extracellular matrix deposition and cell proliferation (36). The profound antitumor effects of
halofuginone are attributed to its combined inhibition of tumor
matrix support, vascularization, invasiveness and cell
proliferation (36). COL1A1 is a
major component of collagen type I, the literature associated with
COL1A1 is primarily focused on osteogenesis, osteoporosis and bone
diseases (37). Previously, it has
been demonstrated that the COL1A1 is deregulated in a variety of
tumors, including breast and gastric cancer, and that the
expression of COL1A1 is higher in tumor tissues and tumor cells
compared with healthy control colon mucosa samples and intestinal
mucosal epithelial FHC cells, respectively (38-43).
To further confirm the results observed through
bioinformatics analysis in the present study, the protein and mRNA
expression levels of COL1A1 in CRC and adjacent control tissues
were analyzed using immunohistochemistry and RT-qPCR, respectively.
The results confirmed that COL1A1 was significantly upregulated in
CRC tissue compared with adjacent tissue. No significant
association was identified between COL1A1 expression and age, sex
or tumor size following analysis of the clinicopathological data of
patients with CRC. However, the expression was significantly
associated with serosal infiltration, lymph node metastasis and
hematogenous metastasis. Furthermore, the effects of COL1A1 on the
growth and invasion abilities of CRC cells were assessed. The
results of the functional experiments demonstrated that COL1A1
knockdown significantly reduced the proliferation and invasiveness
of Caco2 and SW480 cells. Based on the results of our previous
study, COL1A1 was demonstrated to promote CRC cell migration in
vitro (26). Thus, we
hypothesized that COL1A1 may be involved in the proliferation,
invasion and metastasis of CRCs.
The drug target, NEK2, as a hub gene is also of
interest. A previous study demonstrated that the combined treatment
of NEK2 siRNA and cisplatin for CRC improved the antitumor effects
of cisplatin (44). siRNAs are not
widely used in clinical treatment currently; thus, drugs targeting
NEK2 may be more practical at present. The expression and
co-expression of NEK2 was analyzed using an online web service,
GEPIA. The results demonstrated that the expression levels of NEK2
were upregulated in CRC compared with control colorectal tissue
specimens. Furthermore, NEK2 expression was significantly
correlated with c-Myc, Cyclin D1, CD44 and Snail gene expression,
but not with MMP2 and MMP9 expression. C-Myc and Cyclin D1 are
associated with tumor proliferation, CD44 and MMP9 genes are
associated with tumor metastasis, and Snail is associated with
epithelial-mesenchymal transition. These results suggested that
NEK2 may serve a role in CRC proliferation and metastasis, but may
not promote metastasis by dissolving matrix components.
In conclusion, COL1A1 and NEK2 as therapeutic gene
targets may result in improved therapeutic outcomes in
KRASWT and KRASMUT patients with CRC.
Funding
The present study was supported by the Xinxiang
Medical College research funding (grant nos. XYBSKYZZ201632 and
505079), Higher Education Institutions of Henan Province, China
(grant no. 17A310023), The National Natural Science Foundation of
China (grant no. 81702891), and Taihang Young Scholar Foundation of
Xinxiang Medical University and Science and Technology Department
of Henan Province, China (grant nos. 172102310651 and
122102310194).
Availability of data and materials
All data generated or analyzed during this study are
included in this published article
Authors’ contributions
J ZHONG and XW designed the experiments. ZZ, YW, JL,
J ZHANG, CF, YZ and JY performed the experiments and analyzed the
data. J ZHONG wrote the manuscript. XW revised the manuscript. All
of the authors contributed to the manuscript.
Ethics approval and consent to
participate
The present study was approved by Xinxiang Medical
University Ethics Committee, and all patients provided written
informed consent for participation in the present study.
Patient consent for publication
Not applicable.
Competing interests
The authors declare that there are no competing
interests.
Acknowledgments
Not applicable.
References
|
1
|
Siegel RL, Miller KD and Jemal A: Cancer
Statistics, 2017. CA Cancer J Clin. 67:7–30. 2017. View Article : Google Scholar : PubMed/NCBI
|
|
2
|
Shinagawa T, Tanaka T, Nozawa H, Emoto S,
Murono K, Kaneko M, Sasaki K, Otani K, Nishikawa T, Hata K, et al:
Comparison of the guidelines for colorectal cancer in Japan, the
USA and Europe. Ann Gastroenterol Surg. 19:6–12. 2017.
|
|
3
|
Kim SG, Seo HS, Lee HH, Song KY and Park
CH: Comparison of the differences in survival rates between the 7th
and 8th editions of the AJCC TNM staging System for gastric
adenocarcinoma: A single-institution study of 5,507 patients in
Korea. J Gastric Cancer. 17:212–219. 2017. View Article : Google Scholar : PubMed/NCBI
|
|
4
|
Haq AI, Schneeweiss J, Kalsi V and Arya M:
The Dukes staging system: A cornerstone in the clinical management
of colorectal cancer. Lancet Oncol. 10:11282009. View Article : Google Scholar : PubMed/NCBI
|
|
5
|
Laubert T, Freitag-Wolf S, Linnebacher M,
König A, Vollmar B and Habermann JK; North German Tumorbank of
Colorectal Cancer (ColoNet) consortium: Stage-specific frequency
and prognostic significance of aneuploidy in patients with sporadic
colorectal cancer - a meta-analysis and current overview. Int J
Colorectal Dis. 30:1015–1028. 2015. View Article : Google Scholar : PubMed/NCBI
|
|
6
|
Wein A, Siebler J, Goertz R, Wolff K,
Ostermeier N, Busse D, Kremer AE, Koch F, Hagel A, Farnbacher M, et
al: Successful multidisciplinary treatment with secondary
metastatic liver resection after downsizing by palliative
second-line treatment of colorectal cancer: A Curative Option. Case
Rep Oncol. 9:379–386. 2016. View Article : Google Scholar : PubMed/NCBI
|
|
7
|
Gherman A, Căinap C, Constantin AM, Cetean
S and Căinap SS: Molecular targeted treatment of metastatic
colorectal cancer: The cardiovascular adverse effects of
Bevacizumab and Cetuximab. Clujul Med. 90:377–384. 2017. View Article : Google Scholar : PubMed/NCBI
|
|
8
|
Ohhara Y, Fukuda N, Takeuchi S, Honma R,
Shimizu Y, Kinoshita I and Dosaka-Akita H: Role of targeted therapy
in metastatic colorectal cancer. World J Gastrointest Oncol.
8:642–655. 2016. View Article : Google Scholar : PubMed/NCBI
|
|
9
|
Gialeli Ch, Kletsas D, Mavroudis D,
Kalofonos HP, Tzanakakis GN and Karamanos NK: Targeting epidermal
growth factor receptor in solid tumors: Critical evaluation of the
biological importance of therapeutic monoclonal antibodies. Curr
Med Chem. 16:3797–3804. 2009. View Article : Google Scholar : PubMed/NCBI
|
|
10
|
Ptashkin RN, Pagan C, Yaeger R, Middha S,
Shia J, O’Rourke KP, Berger MF, Wang L, Cimera R, Wang J, et al:
Chromosome 20q amplification defines a subtype of microsatellite
stable, left-sided colon cancers with wild-type RAS/RAF and better
overall survival. Mol Cancer Res. 15:708–713. 2017. View Article : Google Scholar : PubMed/NCBI
|
|
11
|
Lo Nigro C, Ricci V, Vivenza D, Granetto
C, Fabozzi T, Miraglio E and Merlano MC: Prognostic and predictive
biomarkers in metastatic colorectal cancer anti-EGFR therapy. World
J Gastroenterol. 22:6944–6954. 2016. View Article : Google Scholar : PubMed/NCBI
|
|
12
|
Tao Z, Shi A, Li R, Wang Y, Wang X and
Zhao J: Microarray bioinformatics in cancer - a review. J BUON.
22:838–843. 2017.PubMed/NCBI
|
|
13
|
Sirisena ND, Deen K, Mandawala DEN, Herath
P and Dissanayake VH: The pattern of KRAS mutations in metastatic
colorectal cancer: A retrospective audit from Sri Lanka. BMC Res
Notes. 10:3922017. View Article : Google Scholar : PubMed/NCBI
|
|
14
|
Bamford S, Dawson E, Forbes S, Clements J,
Pettett R, Dogan A, Flanagan A, Teague J, Futreal PA, Stratton MR,
et al: The COSMIC (Catalogue of Somatic Mutations in Cancer)
database and website. Br J Cancer. 91:355–358. 2004. View Article : Google Scholar : PubMed/NCBI
|
|
15
|
Hiraoka K, Inoue T, Taylor RD, Watanabe T,
Koshikawa N, Yoda H, Shinohara K, Takatori A, Sugimoto H, Maru Y,
et al: Inhibition of KRAS codon 12 mutants using a novel
DNA-alkylating pyrrole-imidazole polyamide conjugate. Nat Commun.
6:67062015. View Article : Google Scholar : PubMed/NCBI
|
|
16
|
Barrett T, Wilhite SE, Ledoux P,
Evangelista C, Kim IF, Tomashevsky M, Marshall KA, Phillippy KH,
Sherman PM, Holko M, et al: NCBI GEO: Archive for functional
genomics data sets - update. Nucleic Acids Res. 41:D991–D995. 2013.
View Article : Google Scholar
|
|
17
|
Pathan M, Keerthikumar S, Ang CS, Gangoda
L, Quek CY, Williamson NA, Mouradov D, Sieber OM, Simpson RJ, Salim
A, et al: FunRich: An open access standalone functional enrichment
and interaction network analysis tool. Proteomics. 15:2597–2601.
2015. View Article : Google Scholar : PubMed/NCBI
|
|
18
|
Geer Wallace MA and Pleil JD: Dataset of
breath research manuscripts curated using PubMed search strings
from 1995-2016. Data Brief. 18:1711–1724. 2018. View Article : Google Scholar : PubMed/NCBI
|
|
19
|
Shannon P, Markiel A, Ozier O, Baliga NS,
Wang JT, Ramage D, Amin N, Schwikowski B and Ideker T: Cytoscape: A
software environment for integrated models of biomolecular
interaction networks. Genome Res. 13:2498–2504. 2003. View Article : Google Scholar : PubMed/NCBI
|
|
20
|
Song E, Song W, Ren M, Xing L, Ni W, Li Y,
Gong M, Zhao M, Ma X, Zhang X, et al: Identification of potential
crucial genes associated with carcinogenesis of clear cell renal
cell carcinoma. J Cell Biochem. 119:5163–5174. 2018. View Article : Google Scholar
|
|
21
|
Liang K, Zhou G, Zhang Q, Li J and Zhang
C: Expression of hippo pathway in colorectal cancer. Saudi J
Gastroenterol. 20:188–194. 2014. View Article : Google Scholar : PubMed/NCBI
|
|
22
|
Mansour RN, Enderami SE, Ardeshirylajimi
A, Fooladsaz K, Fathi M and Ganji SM: Evaluation of hypoxia
inducible factor-1 alpha gene expression in colorectal cancer
stages of Iranian patients. J Cancer Res Ther. 12:1313–1317. 2016.
View Article : Google Scholar
|
|
23
|
Qasim BJ, Al-Wasiti EA and Azzal HS:
Association of global DNA hypomethylation with clinicopathological
variables in colonic tumors of Iraqi patients. Saudi J
Gastroenterol. 22:139–147. 2016.PubMed/NCBI
|
|
24
|
Zhang Z, Zhou C, Chang Y, Zhang Z, Hu Y,
Zhang F, Lu Y, Zheng L, Zhang W, Li X, et al: Long non-coding RNA
CASC11 interacts with hnRNP-K and activates the WNT/β-catenin
pathway to promote growth and metastasis in colorectal cancer.
Cancer Lett. 376:62–73. 2016. View Article : Google Scholar : PubMed/NCBI
|
|
25
|
Zhai F, Song N, Ma J, Gong W, Tian H, Li
X, Jiang C and Wang H: FGF18 inhibits MC3T3 E1 cell osteogenic
differentiation via the ERK signaling pathway. Mol Med Rep.
16:4127–4132. 2017. View Article : Google Scholar : PubMed/NCBI
|
|
26
|
Zhang Z, Wang Y, Zhang J, Zhong J and Yang
R: COL1A1 promotes metastasis in colorectal cancer by regulating
the WNT/PCP pathway. Mol Med Rep. 17:5037–5042. 2018.PubMed/NCBI
|
|
27
|
Chang Z, Shi G, Jin J, Guo H, Guo X, Luo
F, Song Y and Jia X: Dual PI3K/mTOR inhibitor NVP-BEZ235-induced
apoptosis of hepatocellular carcinoma cell lines is enhanced by
inhibitors of autophagy. Int J Mol Med. 31:1449–1456. 2013.
View Article : Google Scholar : PubMed/NCBI
|
|
28
|
Li S, Hu T, Yuan T, Cheng D and Yang Q:
Nucleoside diphosphate kinase B promotes osteosarcoma proliferation
through c-Myc. Cancer Biol Ther. 19:565–572. 2018. View Article : Google Scholar : PubMed/NCBI
|
|
29
|
Huang SD, Yuan Y, Zhuang CW, Li BL, Gong
DJ, Wang SG, Zeng ZY and Cheng HZ: MicroRNA-98 and microRNA-214
post-transcriptionally regulate enhancer of zeste homolog 2 and
inhibit migration and invasion in human esophageal squamous cell
carcinoma. Mol Cancer. 11:512012. View Article : Google Scholar : PubMed/NCBI
|
|
30
|
Biggs MB and Papin JA: Managing
uncertainty in metabolic network structure and improving
predictions using EnsembleFBA. PLOS Comput Biol. 13:pp.
e10054132017, View Article : Google Scholar : PubMed/NCBI
|
|
31
|
Mo CH, Gao L, Zhu XF, Wei KL, Zeng JJ,
Chen G and Feng ZB: The clinicopathological significance of UBE2C
in breast cancer: A study based on immunohistochemistry, microarray
and RNA-sequencing data. Cancer Cell Int. 17:832017. View Article : Google Scholar : PubMed/NCBI
|
|
32
|
Brenner H, Kloor M and Pox CP: Colorectal
cancer. Lancet. 383:1490–1502. 2014. View Article : Google Scholar
|
|
33
|
Bertotti A, Papp E, Jones S, Adleff V,
Anagnostou V, Lupo B, Sausen M, Phallen J, Hruban CA, Tokheim C, et
al: The genomic landscape of response to EGFR blockade in
colorectal cancer. Nature. 526:263–267. 2015. View Article : Google Scholar : PubMed/NCBI
|
|
34
|
Yun J, Mullarky E, Lu C, Bosch KN,
Kavalier A, Rivera K, Roper J, Chio II, Giannopoulou EG, Rago C, et
al: Vitamin C selectively kills KRAS and BRAF mutant colorectal
cancer cells by targeting GAPDH. Science. 350:1391–1396. 2015.
View Article : Google Scholar : PubMed/NCBI
|
|
35
|
Rask-Andersen M, Almén MS and Schiöth HB:
Trends in the exploitation of novel drug targets. Nat Rev Drug
Discov. 10:579–590. 2011. View Article : Google Scholar : PubMed/NCBI
|
|
36
|
Elkin M, Miao HQ, Nagler A, Aingorn E,
Reich R, Hemo I, Dou HL, Pines M and Vlodavsky I: Halofuginone: A
potent inhibitor of critical steps in angiogenesis progression.
FASEB J. 14:2477–2485. 2000. View Article : Google Scholar : PubMed/NCBI
|
|
37
|
Byers PH and Pyott SM: Recessively
inherited forms of osteogenesis imperfecta. Annu Rev Genet.
46:475–497. 2012. View Article : Google Scholar : PubMed/NCBI
|
|
38
|
Li J, Ding Y and Li A: Identification of
COL1A1 and COL1A2 as candidate prognostic factors in gastric
cancer. World J Surg Oncol. 14:2972016. View Article : Google Scholar : PubMed/NCBI
|
|
39
|
Song Y, Kim SH, Kim KM, Choi EK, Kim J and
Seo HR: Activated hepatic stellate cells play pivotal roles in
hepatocellular carcinoma cell chemoresistance and migration in
multicellular tumor spheroids. Sci Rep. 6:367502016. View Article : Google Scholar : PubMed/NCBI
|
|
40
|
Zhang H, Liu B, Xu XF, Jiang TT, Zhang XQ,
Shi YL, Chen Y, Liu F, Gu J, Zhu LJ, et al: Pathophysiology of
chronic pancreatitis induced by dibutyltin dichloride joint ethanol
in mice. World J Gastroenterol. 22:2960–2970. 2016. View Article : Google Scholar : PubMed/NCBI
|
|
41
|
Boguslawska J, Kedzierska H, Poplawski P,
Rybicka B, Tanski Z and Piekielko-Witkowska A: Expression of genes
involved in cellular adhesion and extracellular matrix remodeling
correlates with poor survival of patients with renal cancer. J
Urol. 195:1892–1902. 2016. View Article : Google Scholar
|
|
42
|
Brooks M, Mo Q, Krasnow R, Ho PL, Lee YC,
Xiao J, Kurtova A, Lerner S, Godoy G, Jian W, et al: Positive
association of collagen type I with non-muscle invasive bladder
cancer progression. Oncotarget. 7:82609–82619. 2016. View Article : Google Scholar : PubMed/NCBI
|
|
43
|
Poplawski P, Rybicka B, Boguslawska J,
Rodzik K, Visser TJ, Nauman A and Piekielko-Witkowska A: Induction
of type 1 iodothyronine deiodinase expression inhibits
proliferation and migration of renal cancer cells. Mol Cell
Endocrinol. 442:58–67. 2017. View Article : Google Scholar
|
|
44
|
Suzuki K, Kokuryo T, Senga T, Yokoyama Y,
Nagino M and Hamaguchi M: Novel combination treatment for
colorectal cancer using Nek2 siRNA and cisplatin. Cancer Sci.
101:1163–1169. 2010. View Article : Google Scholar : PubMed/NCBI
|