Introduction
Myelodysplastic syndrome (MDS) is a heterogeneous
hema-topoietic malignancy that is characterized by ineffective
hematopoiesis, and is accompanied by abnormal maturation and
dysplasia in one or more blood cell lineages (1). The pathogenesis of MDS is currently
unclear; however, it has been reported to be associated with gene
mutations, immune dysregulation, chromosomal abnormalities,
epigenetic abnormalities and other factors. DNA methylation is an
important research topic in epigenetics, which has been
demonstrated to be involved in the development and progression of
MDS. In addition, it is a biomarker for the diagnosis, treatment
and survival of patients with MDS (2-5).
In our previous study, six genes [4-aminobutyrate
aminotransferase (ABAT), dual adaptor of phosphotyrosine and
3-phosphoinositides 1, Fas-associated via death domain, LRR-binding
FLII-interacting protein 1, phospholipase B domain-containing 1 and
sphingomyelin phosphodiesterase 3] were screened out through
genome-wide DNA methylation profiling and gene expression
microarray in four patients with MDS and four controls (4). In addition, significant alterations
have been observed in the expression levels of ABAT, as
compared with other genes, after leukemia cell lines are treated
with decitabine, which is a hypomethylating agent (6). Therefore, this gene was selected as a
target gene.
ABAT encodes γ-aminobutyrate aminotransferase
(GABAT), which participates in catabolism of the inhibitory
neurotransmitter γ-aminobutyric acid (GABA) (7). Recently, Besse et al reported
an essential role for ABAT in the mitochondrial nucleoside
salvage pathway, which may facilitate the conversion of
deoxyribonucleoside diphosphate into deoxyribonucleoside
triphosphate, and maintain the function of the mitochondrial
membrane (8). Furthermore,
alterations in the expression levels of ABAT take part in
the development of breast cancer and hepatocellular carcinoma
(9-11). However, to the best of our
knowledge, no studies have focused on the pathogenic mechanisms and
prognostic value of ABAT in patients with MDS.
In the present study, the expression and methylation
levels of ABAT were detected in 152 patients with MDS, 29
patients with acute myeloid leukemia (AML) and 40 controls using
reverse transcription-quantitative polymerase chain reaction
(RT-qPCR) and methylation-sensitive high resolution melting
(MS-HRM), respectively. The expression and methylation levels of
ABAT were found to be associated with overall survival (OS)
in patients with MDS. In addition, cell viability, cell apoptosis
and cell cycle progression were analyzed in leukemia cell lines
with ABAT gene silencing or in cell lines treated with a
GABAT inhibitor, in order to demonstrate the role of ABAT in
the pathogenesis of MDS.
Materials and methods
Patients and bone marrow samples
Bone marrow samples were extracted from 152 adult
patients with MDS and 29 patients with AML. All patients were
diagnosed according to the 2008 World Health Organization (WHO)
criteria (12). Of the patients
with MDS, 92 were men and 60 were women, with a median age of 56
years (range, 18-86 years). A total of 84 patients had refractory
cytopenia with multilineage dysplasia (RCMD), 8 had RCMD with ring
sideroblasts (RCMD-RS), 17 had refractory anemia with an excess of
blasts type 1 (RAEB-1), 29 had RAEB-2, five had refractory anemia
(RA), two had refractory anemia with ring sideroblasts (RARS), six
had an unclassifiable form of MDS (MDS-U) and one had 5q-syndrome.
Of the patients with AML, 16 were diagnosed with acute
myelomonocytic leukemia, six with acute monocytic leukemia (AML-M5)
and seven with AML with mixed-lineage leukemia rearrangements. The
prognostic score for each patient with MDS was calculated using the
International Prognostic Scoring System (IPSS) (13). All subjects with MDS were recruited
on January 1, 2008 by the Sino-U.S. Shanghai Leukemia Cooperative
Group (School of Public Health, Fudan University, Shanghai, China),
and were followed up until they succumbed to the disease or until
the last follow-up date (December 30, 2015). Two subjects did not
undergo chromosomal examination due to examination failure.
Finally, 69 subjects succumbed and 14 subjects progressed to AML.
In addition, bone marrow samples from 40 subjects without
hematological malignancies were obtained between December 30, 2015
and January 1, 2018, and were analyzed as controls. The control
subjects were diagnosed as having immune thrombocytopenia by bone
marrow smears and chromosomal examinations. Subsequently, a 2-year
follow-up period ensured that these controls did not develop MDS or
other clonal disorders. No statistical difference was found with
regards to age and sex among the subjects with MDS and AML and the
controls. The present study was approved by the Ethics Committee of
Huashan Hospital, Fudan University (approval no. KY2015-269;
Shanghai, China), and informed consent was obtained from each
participant.
RNA isolation and RT-qPCR
The mononuclear cells were harvested by bone marrow
aspiration and were isolated by centrifugation (600 × g for 20 min
at room temperature) in lymphocyte separation medium
(Ficoll® Paque Plus; GE Healthcare, Chicago, IL, USA).
Total RNA was isolated from bone marrow mononuclear cells using the
QIAamp RNA Blood Mini kit (Qiagen GmbH, Hilden, Germany).
TRIzol® reagent (Invitrogen; Thermo Fisher Scientific,
Inc., Waltham, MA, USA) was used to isolate total RNA from the
cultured leukemia cells after culture medium was removed and the
cells were washed with pre-cooled PBS (4°C) three times. The purity
of RNA was assessed by measuring the optical density (OD) 260/280
ratio using a NanoDrop spectrophotometer (NanoDrop Technologies;
Thermo Fisher Scientific, Inc., Wilmington, DE, USA). The RNA
samples were then reverse transcribed into cDNA using Takara
PrimeScript RT Master Mix (Takara Bio, Inc., Otsu, Japan). The
10-µl reaction mixture comprised 2 µl 5X PrimeScript
RT Master Mix, 500 ng RNA and RNase-Free distilled H2O,
which was used to ensure the total reached 10 µl.
Subsequently, the mixture was amplified at 37°C for 15 min, 85°C
for 5 sec and was stored at 4°C for further use.
For RT-qPCR, cDNA samples were amplified using an
ABI Prism 7500 Sequence Detection system (Applied Biosystems;
Thermo Fisher Scientific, Inc.) with Takara SYBR Premix Ex Taq PCR
reagents (Takara Bio, Inc.). A 20-µl reaction mixture
containing 10 µl SYBR-Green premix, 0.4 µl each
primer (10 µM), 0.4 µl ROX Reference Dye II, 2
µl cDNA and 6.8 µl DEPC-treated water was amplified
at 95°C for 30 sec, followed by 40 cycles at 95°C for 5 sec and
60°C for 34 sec. The PCR primer sequences for ABAT were as
follows: Forward, 5′-TTTTCTGTCTCCTCCACCTGTC-3′ and reverse,
5′-CTGGCT GGGTTCATCCTAAG-3′, which resulted in amplification of a
113-bp PCR band. The GAPDH pr i mer sequences were as
follows: For wa rd, 5′-TGGATGAAGTTGGTGGTGAG-3′ and reverse,
5′-CAGCATCAGGAGTGGACAGA-3′, which resulted in amplification of an
87-bp PCR band. The relative abundance of ABAT mRNA was
normalized to the levels of GAPDH mRNA using the
2−ΔΔCq (fold change) method (14).
DNA isolation and MS-HRM
Total DNA was isolated from bone marrow mononuclear
cells using QIAamp DNA Blood Mini kit (Qiagen GmbH), according to
the manufacturer’s protocol. DNA quality and purity were assessed
using the aforementioned methods, and DNA samples were stored at
−20°C for further use.
For MS-HRM, DNA samples from all patients, and human
methylated and nonmethylated DNA standards (Zymo Research Corp.,
Irvine, CA, USA) were modified using the EZ DNA Methylation-Gold
kit (Zymo Research Corp.), according to the manufacturer’s
protocol. In addition, the human methylated and nonmethylated DNA
standards were mixed at a ratio of 1:9, 1:3, 1:1 and 3:1 to perform
DNA methylation modification. All modified DNA samples were
amplified using the C1000 Touch Thermal Cycler (Bio-Rad
Laboratories, Inc.) with Takara Premix Taq Hot Start Version
(Takara Bio, Inc.). A 25-µl reaction mixture containing 12.5
µl Premix Taq Hot Start Version, 1 µl each primer (10
µM), 1 µl modified DNA and 9.5 µl DEPC-treated
water was amplified at 95°C for 2 min, followed by 40 cycles at
95°C for 30 sec, 59°C for 30 sec and 72°C for 30 sec, and an
extension step at 72°C for 5 min. Subsequently, the amplified
product was added to 0.9 µl SYTO 9 Green Fluorescent Nucleic
Acid Stain (Invitrogen; Thermo Fisher Scientific, Inc.) and reacted
at 94°C for 60 sec and 40°C for 60 sec. Data were collected between
75°C and 85°C using Rotor Gene 6000 (Qiagen GmbH). The methylation
primers for ABAT were as follows: Forward,
5′-GTAAGAAGGGTTGGTAGGGTTTT-3′ and reverse,
5′-ACCATTTACACCCTCAAAACTACA-3′, which resulted in amplification of
a 183-bp PCR band.
Cell culture and short hairpin (sh)RNA
knockdown of ABAT
In the present study, SKM-1 and THP-1 leukemia cell
lines were used. The SKM-1 cell line is derived from a patient with
leukemia transformed from MDS; therefore, this cell line has
similar characteristics to MDS. The THP-1 cell line is derived from
a patient with AML-M5. Mutations in the ABAT gene were
detected in both cell lines used in this study. The ABAT
gene mutations detected in the SKM-1 cell line were as follows:
309C>T, V103V; 984C>A, V328V and 167G>A, Q56R. The
ABAT gene mutations in the THP-1 cell line were: 984C>A,
V328V and 167G>A, Q56R. The mutation sites have no influence on
enzyme activity; therefore, these two cell lines were used in the
present functional study. The human myeloid leukemia cell line
THP-1 was obtained from the Chinese Academy of Sciences (Beijing,
China), and the SKM-1 cell line was purchased from Health Science
Research Resources Bank (Sennan, Japan). All cells were cultured in
RPMI-1640 (HyClone; GE Healthcare Life Sciences, Logan, UT, USA)
supplemented with 10% fetal bovine serum (Gibco; Thermo Fisher
Scientific, Inc.) at 37°C in an atmosphere containing 5%
CO2.
shRNA sequences that targeted the 3′ untranslated
region of ABAT were designed and cloned into pGMLV-SC5
lentiviral vectors (Genomeditech, Shanghai, China). The
oligonucleotide sequences were: Sh1-ABAT,
5′-GCGGGAGGACCTGCTAAATAA-3′; Sh2-ABAT,
5′-GCTGGAGACGTGCATGATTAA-3′; and Sh3-ABAT,
5′-GGTGACAAATCCATTCGTTTC-3′. SKM-1 and THP-1 cells
(1×10⁵) were infected with three independent shRNA
lentiviruses and a scramble lentivirus (negative control, NC;
Genomeditech) at a multiplicity of infection of 80 at 37°C; cells
without lentiviral infection were considered normal control cells.
Infection efficiency was evaluated by flow cytometry, according to
the percentage of green fluorescent protein (GFP)-positive cells,
and RT-qPCR and western blotting after 72 h. Puromycin (cat. no.
P8230; Beijing Solarbio Science & Technology Co., Ltd.,
Beijing, China) was used to improve the percentage of GFP-positive
cells at 72 h.
Drug treatment
For drug treatment, the two cell lines were cultured
in complete medium supplemented with 0, 100, 200 and 400
µmol/l (±)-vigabatrin (Sigma-Aldrich; Merck KGaA, Darmstadt,
Germany), which is a specific inhibitor of the GABAT enzyme; the
medium was replaced by new complete medium containing
(±)-vigabatrin every 24 h. After 10 days, the cells were harvested
for further use (15).
GABAT enzymatic activity assay
GABAT enzymatic activity was detected using the
GABAT assay kit (cat. no. E-134; Biomedical Research Service
Center, University at Buffalo, Buffalo, NY, USA), according to a
previous report (15). Briefly,
this assay is based on sequential GABA transamination reaction and
glutamate dehydrogenase reaction, which couples the reduction of
iodonitrotetrazolium to iodonitrotetrazolium-formazan (ε = 18
mM−1cm−1 at 492 nm). Reactions were
terminated by adding 3% acetic acid (cat. no. A6283; Sigma-Aldrich;
Merck KGaA) and OD was measured at 492 nm using a plate reader
(Thermo Fisher Scientific, Inc.). A mean of the readings was
obtained, and control well readings were subtracted from sample
well readings (ΔOD). GABAT activity was calculated using the
following formula: GABAT activity [µmol/(l•min)] = (ΔOD ×
1,000 × 150 µl)/(60 min × 0.6 cm × 18 × 5 µl) = ΔOD ×
46.3, where 150 µl is the total reaction volume, 0.6 cm is
the light path in the 96-well plate, and 5 µl is the volume
of the sample in each well.
Cell viability assay
Cell viability was measured using the Cell Counting
Kit-8 (CCK-8; Dojindo Molecular Technologies, Inc., Rockville, MD,
USA) according to the manufacturer’s protocol. Briefly, cells
treated with the GABAT inhibitor, cells infected with shRNA
lentiviruses, NC cells and normal control cells were seeded in a
96-well plate at 5×10³ cells/well. The plates were then
incubated for 24, 48 and 72 h at 37°C in a humidified incubator
containing 5% CO2. Subsequently, 10 µl CCK-8
reagent was added to each well. After 4 h at 37°C, absorbance was
measured at 450 nm. Three independent experiments were
performed.
Measurement of cell apoptosis and cell
cycle distribution using flow cytometry
The two cell lines (1×10⁵ cells) infected
with lentiviral vectors or treated with a GABAT inhibitor were
harvested and washed with PBS. Cell apoptosis was assessed using
Phycoerythrin (PE) Annexin V Apoptosis Detection kit I (cat. no.
559763) and Fluorescein Isothiocyanate (FITC) Annexin V Apoptosis
Detection kit I (cat. no. 556547) (both from BD Biosciences,
Franklin Lakes, NJ, USA), respectively. Briefly, the cells were
harvested and the supernatant was discarded; subsequently, cells
were suspended in PBS containing 3% bovine serum albumin (BSA; cat.
no. A8020; Beijing Solarbio Science & Technology Co., Ltd.) and
were adjusted to 1×10⁶ cells/ml. A 100-µl aliquot
was labeled with 5 µl PE and 5 µl 7-aminoactinomycin
D (7-AAD) for cells transfected with lentiviruses, or with 5
µl FITC and 5 µl propidium iodide (PI) for cells
treated with drugs, and cells were incubated at room temperature
for 25 min. Flow cytometry was performed immediately after
incubation. Data acquisition and analysis were performed using the
BD FACSCanto flow cytometer (BD Biosciences) with FCS Express 3.0
software (De Novo Software, Glendale, CA, USA) and FlowJo 7.6
software (FlowJo LLC, Ashland, OR, USA). Normal controls were used
to set voltage for flow cytometry. Cells that were Annexin
V-positive and 7-amino-actinomycin D (7-AAD)/propidium iodide
(PI)-negative were the early apoptotic fraction, whereas cells that
were double positive were the late apoptotic fraction.
For cell cycle analysis, the aforementioned leukemia
cells (1×10⁵ cells) were harvested, washed twice with
ice-cold PBS, and fixed with 75% ethanol at −20°C overnight. Prior
to analysis, the fixed cells were washed twice with ice-cold PBS
and suspended in 300 µl PI for 15 min in the dark at 4°C.
The data were acquired using the BD FACSCanto flow cytometer with
FCS Express 3.0 software. Data were analyzed using ModFit LT
software (version 3.2; Verity Software House, Inc., Topsham, ME,
USA).
Western blot analysis
For western blot analysis, total protein was
extracted from the cultured cells using protein lysis buffer (cat.
no. 89900; Thermo Fisher Scientific, Inc.) and was quantified using
a bicinchoninic acid assay kit (Beyotime Biotechnology, Haimen,
China), with BSA (Beijing Solarbio Science & Technology Co.,
Ltd.) as a standard. Proteins (20 µg) were fractionated by
10% SDS-PAGE and were transferred onto polyvinylidene fluoride
membranes (Bio-Rad Laboratories, Inc.). The membranes were blocked
in 5% non-fat dry milk at room temperature for 2 h and were
immunostained overnight at 4°C using antibodies against ABAT
(cat. no. ab216465, 1:1,000; Abcam, Cambridge, MA, USA), cyclin D1
(cat. no. 2978S, 1:1,000), cyclin D3 (cat. no. 2936S, 1:1,000),
cyclin-dependent kinase (CDK)4 (cat. no. 12790S, 1:1,000), CDK6
(cat. no. 13331S, 1:1,000), p16INK4a (cat. no. 80772S,
1:1,000), p21Waf1/Cip1 (cat. no. 2947S, 1:1,000),
caspase-3 (cat. no. 9665T, 1:1,000), cleaved caspase-3 (cat. no.
9664T, 1:1,000), B-cell lymphoma-2 (Bcl-2)-associated X protein
(Bax; cat. no. 2772T, 1:1,000), Bcl-2 (cat. no. 4223T, 1:1,000),
GAPDH (cat. no. 2118S, 1:1,000) and β-actin (cat. no. 8457S,
1:1,000) (Cell Signaling Technology, Danvers, MA, USA). GAPDH and
β-actin antibodies were used as loading controls. After washing
with Tris-buffered saline containing 0.1% Tween, the membranes were
incubated with the following secondary antibodies: Anti-rabbit
immunoglobulin G (IgG) (cat. no. 7074P2, 1:5,000; Cell Signaling
Technology, Inc.) and anti-mouse IgG (cat. no. ab6728, 1:5,000;
Abcam) at room temperature for 1 h. The protein bands were
visualized using the enhanced chemiluminescence system (Beyotime
Institute of Biotechnology). Densitometric analysis of the protein
bands was conducted using ImageJ software (ImageJ 1.48v; National
Institutes of Health, Bethesda, MD, USA). The ratio was calculated
by comparing the gray value of proteins to GAPDH or β-actin.
Statistical analysis
All statistical analyses were performed using Stata
version 14.0 software (StataCorp LP, College Station, TX, USA);
comparisons between two groups were analyzed by independent t-test
when data conformed to normal distribution, if not, a
non-parametric Kruskal-Wallis test was performed. The 95%
confidence interval (CI) of the expression and methylation levels
of ABAT in the 40 control samples was defined as the normal
level. Values that were below or above the confidence limit were
considered low or high expression/methylation. The independent
t-test was used to compare the levels between two groups. One-way
analysis of variance followed by Bonferroni post hoc test was used
for multiple comparisons. χ2 tests or Fisher’s exact
tests were used for prognostic analysis.
OS was assessed from the day of diagnosis until
death due to any cause, or until the last follow-up date (December
30, 2015). Subjects who succumbed prior to leukemia evolution were
censored at the time of death. Kaplan-Meier curves were generated
to assess the association of gene expression and methylation with
survival, and the log-rank test was performed to analyze the
association between different clinical indicators and survival. The
Cox regression model was used for multivariate analysis, in order
to identify independent prognostic factors affecting OS. P<0.05
was considered to indicate a statistically significant
difference.
Results
mRNA expression levels of ABAT in
patients with MDS and AML, and control individuals
The mRNA expression and methylation levels of
ABAT were detected in samples obtained from 152 patients
with MDS, 29 patients with AML and 40 controls individuals
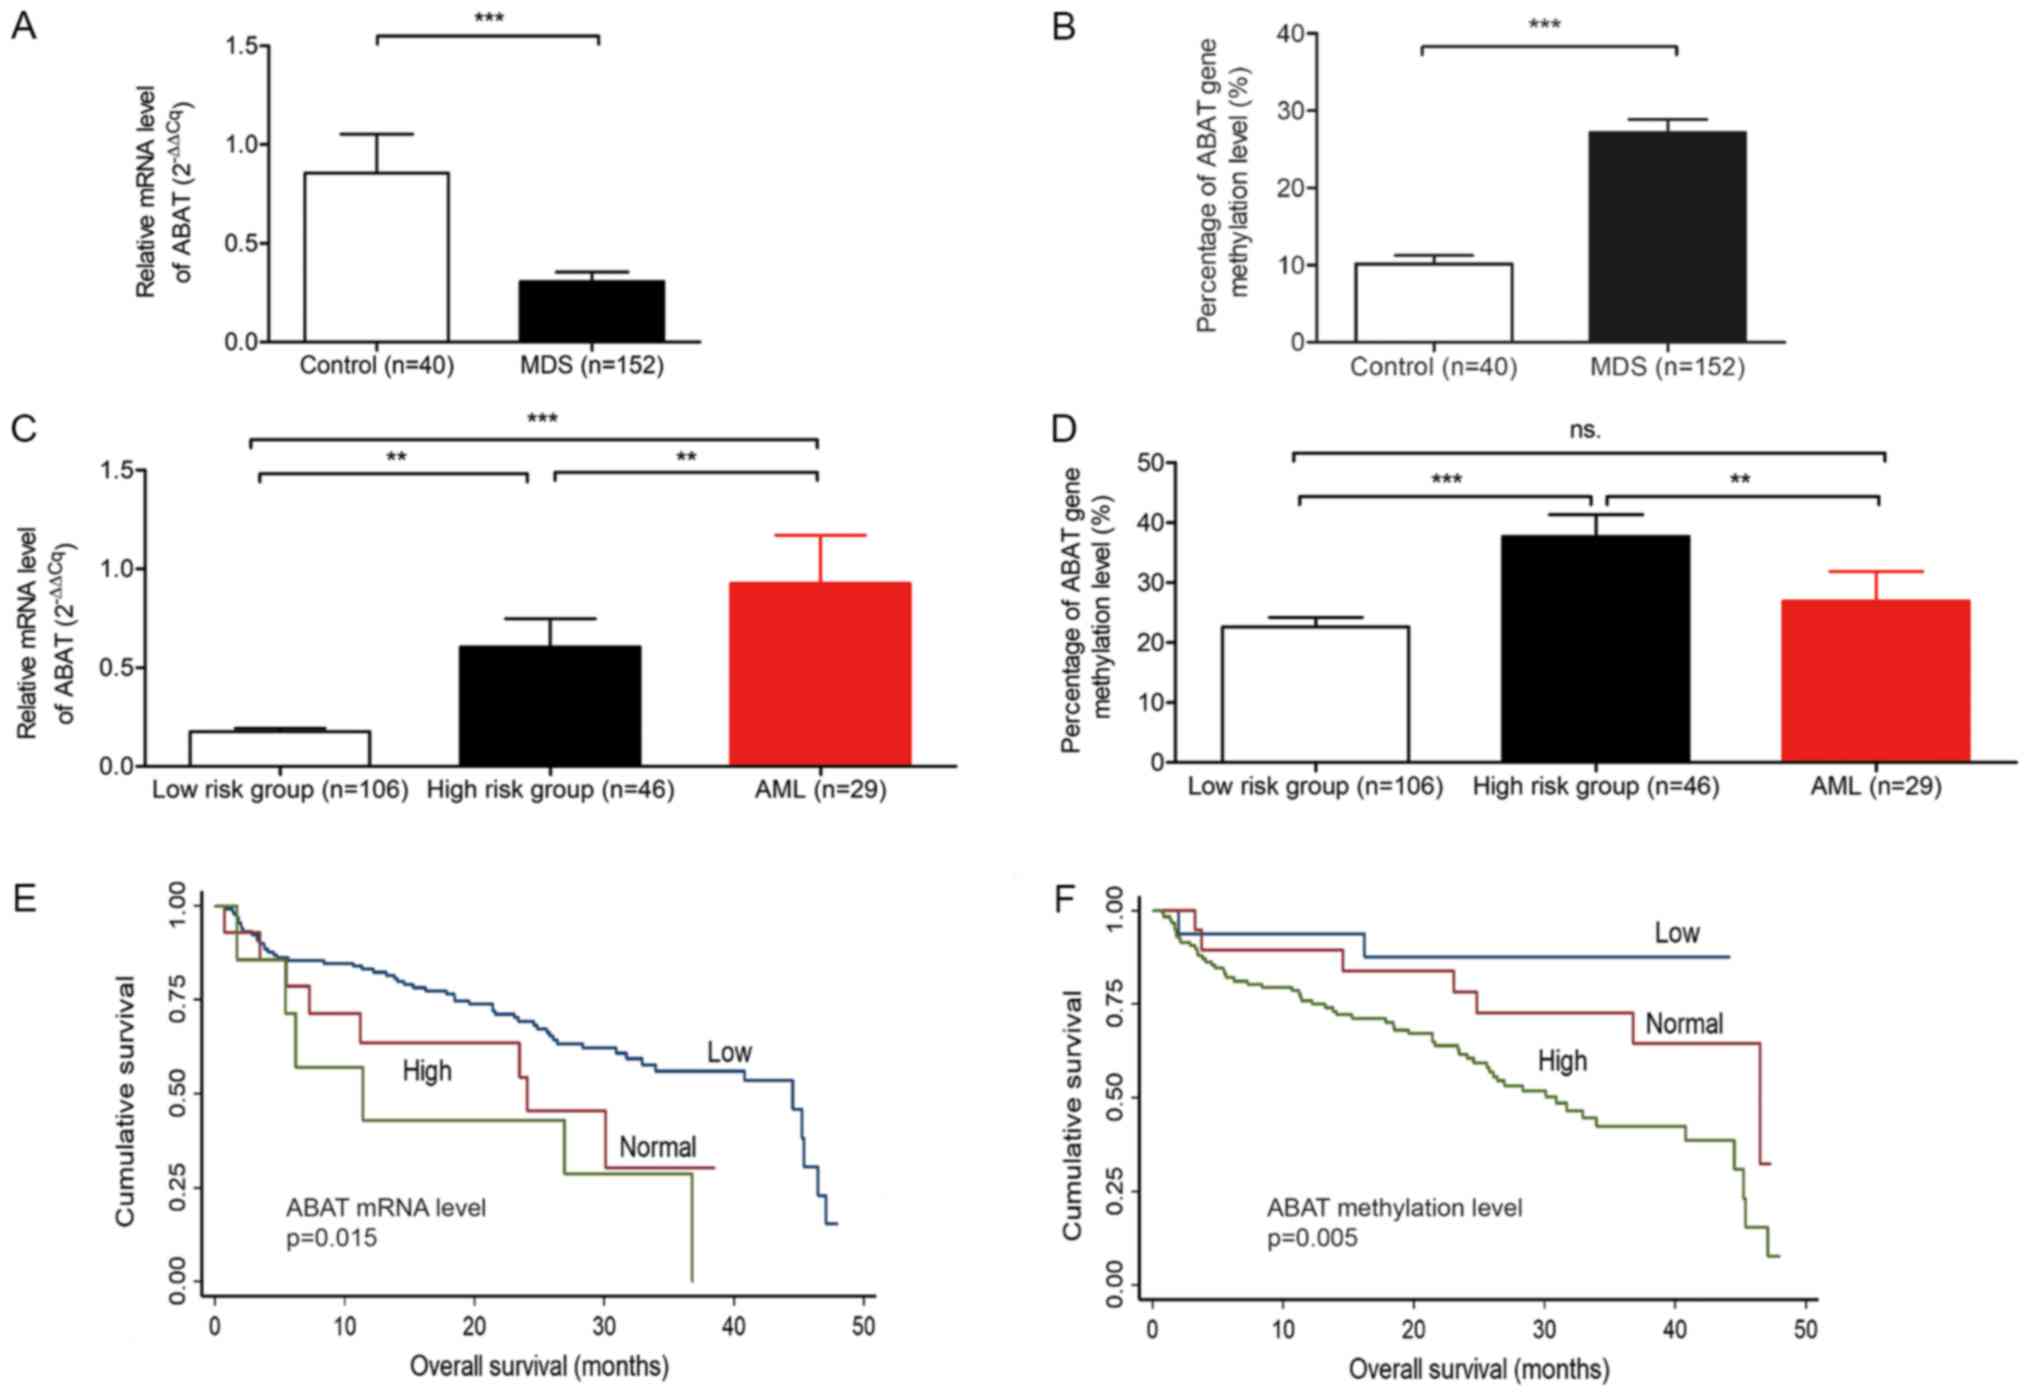
(Fig. 1A-D). The average
expression level in the 152 patients with MDS was 0.31 (0.21-0.40),
which was significantly lower compared with in the controls
(P<0.0001; Fig. 1A and Table I). When the number of bone marrow
blast cells was increased, the mRNA expression levels of
ABAT were also upregulated (Table I). According to the WHO subtypes of
MDS, patients with high-risk subtypes (i.e. RAEB-1 and RAEB-2)
exhibited high expression levels compared with low-risk subtypes
(i.e., RA, RARS, RCMD, RCMD-RS, 5q-syndrome and MDS-U) (P=0.09;
Fig. 1C and Table I). The low-risk and high-risk
subgroups of patients with MDS exhibited lower expression levels
than patients with AML (P=0.0001 and P=0.0039, respectively).
 | Table IABAT mRNA expression and
methylation in patients with MDS and AML, and control
individuals. |
Table I
ABAT mRNA expression and
methylation in patients with MDS and AML, and control
individuals.
| Variable | No. of
patients | Relative
ABAT mRNA levels (95% CI) | P-value | Degree of
ABAT methylation, % (95% CI) | P-value |
|---|
| Group | | | <0.0001 | | <0.0001 |
| Controls | 40 | 0.86
(0.46-1.25) | | 10.18
(7.98-12.39) | |
| MDS patients | 152 | 0.31
(0.21-0.40) | | 27.23
(23.95-30.51) | |
| AML patients | 29 | 0.93
(0.43-1.43) | | 26.99
(16.94-37.06) | |
| Age (years) | | | 0.542 | | 0.947 |
| <60 | 83 | 0.31
(0.18-0.45) | | 26.98
(22.38-31.57) | |
| ≥60 | 69 | 0.29
(0.15-0.43) | | 27.52
(22.75-32.30) | |
| Sex | | | 0.386 | | 0.788 |
| Male | 92 | 0.34
(0.21-0.47) | | 26.74
(22.76-30.72) | |
| Female | 60 | 0.25
(0.11-0.39) | | 27.97
(22.19-33.76) | |
| WBCs
(×109/l) | | | 0.472 | | 0.575 |
| <4 | 129 | 0.33
(0.21-0.44) | | 26.15
(22.94-29.37) | |
| ≥4 | 23 | 0.19
(0.13-0.25) | | 33.25
(20.68-45.82) | |
| Neutrophils
(×109/l) | | | 0.289 | | 0.286 |
| <1.5 | 114 | 0.32
(0.20-0.45) | | 25.83
(22.34-29.32) | |
| ≥1.5 | 38 | 0.25
(0.15-0.36) | | 31.41
(23.33-39.49) | |
| Hemoglobin
(g/dl) | | | 0.336 | | 0.477 |
| <9 | 115 | 0.34
(0.22-0.46) | | 27.04
(23.59-30.49) | |
| ≥9 | 37 | 0.20
(0.12-0.28) | | 27.80
(19.30-36.31) | |
| PLTs
(×109/l) | | | 0.146 | | 0.896 |
| <100 | 112 | 0.34
(0.21-0.46) | | 26.79
(23.10-30.48) | |
| ≥100 | 40 | 0.21
(0.11-0.31) | | 28.45
(21.22-36.68) | |
| WHO
classification | | | 0.004 | | <0.0001 |
| RA, RARS, RCMD,
RCMD-RS, MDS-U, 5q-syndrome | 106 | 0.18
(0.15-0.21) | | 22.62
(19.47-25.77) | |
| RAEB-1,
RAEB-2 | 46 | 0.41
(0.31-0.89) | | 37.84
(30.48-45.20) | |
| BM blasts (%) | | | 0.049 | | <0.0001 |
| <5 | 106 | 0.18
(0.15-0.21) | | 22.68
(19.54-25.82) | |
| 5-9 | 21 | 0.44
(0.16-0.71) | | 46.26
(33.73-58.79) | |
| 10-19 | 25 | 0.72
(0.22-1.21) | | 30.86
(22.29-39.42) | |
| IPSS
karyotypea | | | 0.654 | | 0.056 |
| Good | 104 | 0.27
(0.17-0.36) | | 25.27
(21.36-29.16) | |
| Intermediate | 29 | 0.38
(0.13-0.64) | | 28.48
(20.87-36.08) | |
| Poor | 17 | 0.39
(0.07-0.85) | | 36.14
(24.87-47.41) | |
| IPSS
cytopeniasb | | | 0.358 | | 0.807 |
| 0/1 | 19 | 0.27
(0.07-0.48) | | 29.14
(16.98-41.30) | |
| 2/3 | 133 | 0.31
(0.21-0.41) | | 26.96
(23.56-30.35) | |
| IPSS risk
groupc | | | 0.007 | | 0.004 |
| Low | 13 | 0.20
(0.06-0.35) | |
23.45(9.06-37.83) | |
| INT-1 | 96 | 0.20
(0.14-0.26) | | 23.72
(20.34-27.11) | |
| INT-2 | 26 | 0.44
(0.11-0.77) | | 34.75
(25.13-44.37) | |
| High | 15 | 0.81
(0.15-1.47) | | 38.73
(24.08-53.39) | |
MS-HRM of patients with MDS and AML, and
control individuals
The fluorescence intensities of 0, 10, 25, 50, 75
and 100% methylated DNA standards were detected (data not shown)
and the fluorescence intensity of nonmethylated DNA standards was
subtracted to determine differential fluorescence intensity. A
standard curve was established, with y = 0.622x + 0.326,
R2=0.998 (data not shown). Subsequently, the
fluorescence intensities of DNA methylation of 152 patients with
MDS, 29 patients with AML and 40 controls were detected, in order
to calculate the percentage of ABAT methylation according to
the standard curve. The percentage of ABAT gene methylation
was higher in subjects with MDS than in controls (P=0.0001)
(Table I and Fig. 1B). The high-risk subgroup of MDS
patients exhibited a higher degree of methylation compared with the
low-risk subgroup (P<0.0001). No difference was determined
between patients with AML and low-risk subjects (P=0.417; Fig. 1D).
Association of the expression and
methylation levels of ABAT with the prognosis of patients with
MDS
Univariate analysis revealed that age, hemoglobin
levels, WHO classification, marrow blast percentage, IPSS
karyotype, IPSS cytopenias, IPSS risk group, and the expression and
methylation levels of ABAT were significant associated with
OS in patients with MDS (Table
II). The normal expression levels of ABAT (95% CI,
0.46-1.25) and the normal methylation percentage of ABAT
(95% CI, 7.98-12.39) were defined in the 40 control samples
(Table I). Values below the lower
confidence limit were considered the low-expression and
low-methylation group; values above the high confidence limit were
considered the high-expression and high-methylation group; the
other values were considered normal. Therefore, according to this
classification, subjects with MDS were categorized into 14 normal-,
131 low- and 7 high-expression patients. In terms of ABAT
gene methylation, subjects were categorized into 16 low-, 19
normal- and 117 high-methylation subjects (Table II).
| Table IIUnivariate analysis of prognostic
factors for patients with MDS. |
Table II
Univariate analysis of prognostic
factors for patients with MDS.
| Variable | No. of
patients | Cases of
mortality | P-value |
|---|
| Age (years) | | | 0.004 |
| <60 | 83 | 31 | |
| ≥60 | 69 | 38 | |
| Sex | | | 0.996 |
| Male | 92 | 41 | |
| Female | 60 | 28 | |
| WBCs
(×109/l) | | | 0.804 |
| <4 | 129 | 59 | |
| ≥4 | 23 | 10 | |
| Neutrophils
(×109/l) | | | 0.310 |
| <1.5 | 114 | 56 | |
| ≥1.5 | 38 | 13 | |
| Hemoglobin
(g/dl) | | | 0.005 |
| <9 | 115 | 59 | |
| ≥9 | 37 | 10 | |
| PLTs
(×109/l) | | | 0.070 |
| <100 | 112 | 56 | |
| ≥100 | 40 | 13 | |
| WHO
classification | | | <0.001 |
| RA, RARS, RCMD,
RCMD-RS, 5q-syndrome, MDS-U | 106 | 33 | |
| RAEB-1,
RAEB-2 | 46 | 36 | |
| BM blasts (%) | | | <0.001 |
| <5 | 106 | 32 | |
| 5-9 | 21 | 17 | |
| 10-19 | 25 | 20 | |
| IPSS
karyotypea | | | 0.007 |
| Good | 104 | 41 | |
| Intermediate | 29 | 15 | |
| Poor | 17 | 12 | |
| IPSS
cytopeniasb | | | 0.045 |
| 0/1 | 19 | 4 | |
| 2/3 | 133 | 65 | |
| IPSS risk
groupsc | | | <0.001 |
| Low | 13 | 2 | |
| INT-1 | 96 | 33 | |
| INT-2 | 26 | 21 | |
| High | 15 | 12 | |
| ABAT mRNA
expression | | | 0.015 |
| Low
(<0.46) | 131 | 55 | |
| Normal
(0.46-1.25) | 14 | 8 | |
| High
(>1.25) | 7 | 6 | |
| ABAT
methylation degree (%) | | | 0.005 |
| Low
(<7.98) | 16 | 2 | |
| Normal
(7.98-12.39) | 19 | 7 | |
| High
(>12.39) | 117 | 60 | |
Subjects with normal and high ABAT mRNA
expression had a shorter OS compared with those with low expression
(P=0.015; Fig. 1E). The median
survival time of subjects with high expression was 17.88 months.
Furthermore, when the degree of methylation increased, OS decreased
(P=0.005; Fig. 1F).
The multivariate Cox regression analysis
demonstrated that old age, high blast count and high methylation
had a strong impact on the OS of patients with MDS (hazard
ratios=2.51, 2.26 and 1.93, respectively); therefore, these were
considered independent risk factors for the survival of patients
with MDS (Table III). Although
ABAT mRNA expression had prognostic value in the univariate
analysis, the multivariate analysis revealed that the expression of
ABAT was not an independent factor affecting OS
(P=0.856).
| Table IIIMultivariate analysis of prognostic
factors in patients with myelodysplastic syndrome. |
Table III
Multivariate analysis of prognostic
factors in patients with myelodysplastic syndrome.
| Variable | HR (95% CI) | P-value |
|---|
| Age (≥60
years) | 2.51
(1.48-4.25) | 0.001 |
| Hemoglobin (<9
g/dl) | 0.79
(0.36-1.74) | 0.573 |
| BM blasts
(≥5%) | 2.26
(1.66-3.09) | <0.0001 |
| IPSS karyotype
(poor) | 1.27
(0.91-1.78) | 0.145 |
| IPSS cytopenias
(2/3) | 1.38
(0.89-2.16) | 0.148 |
| ABAT mRNA
expression (high) | 1.04
(0.68-1.57) | 0.856 |
| Degree of
ABAT methylation (high) | 1.93
(1.09-3.40) | 0.022 |
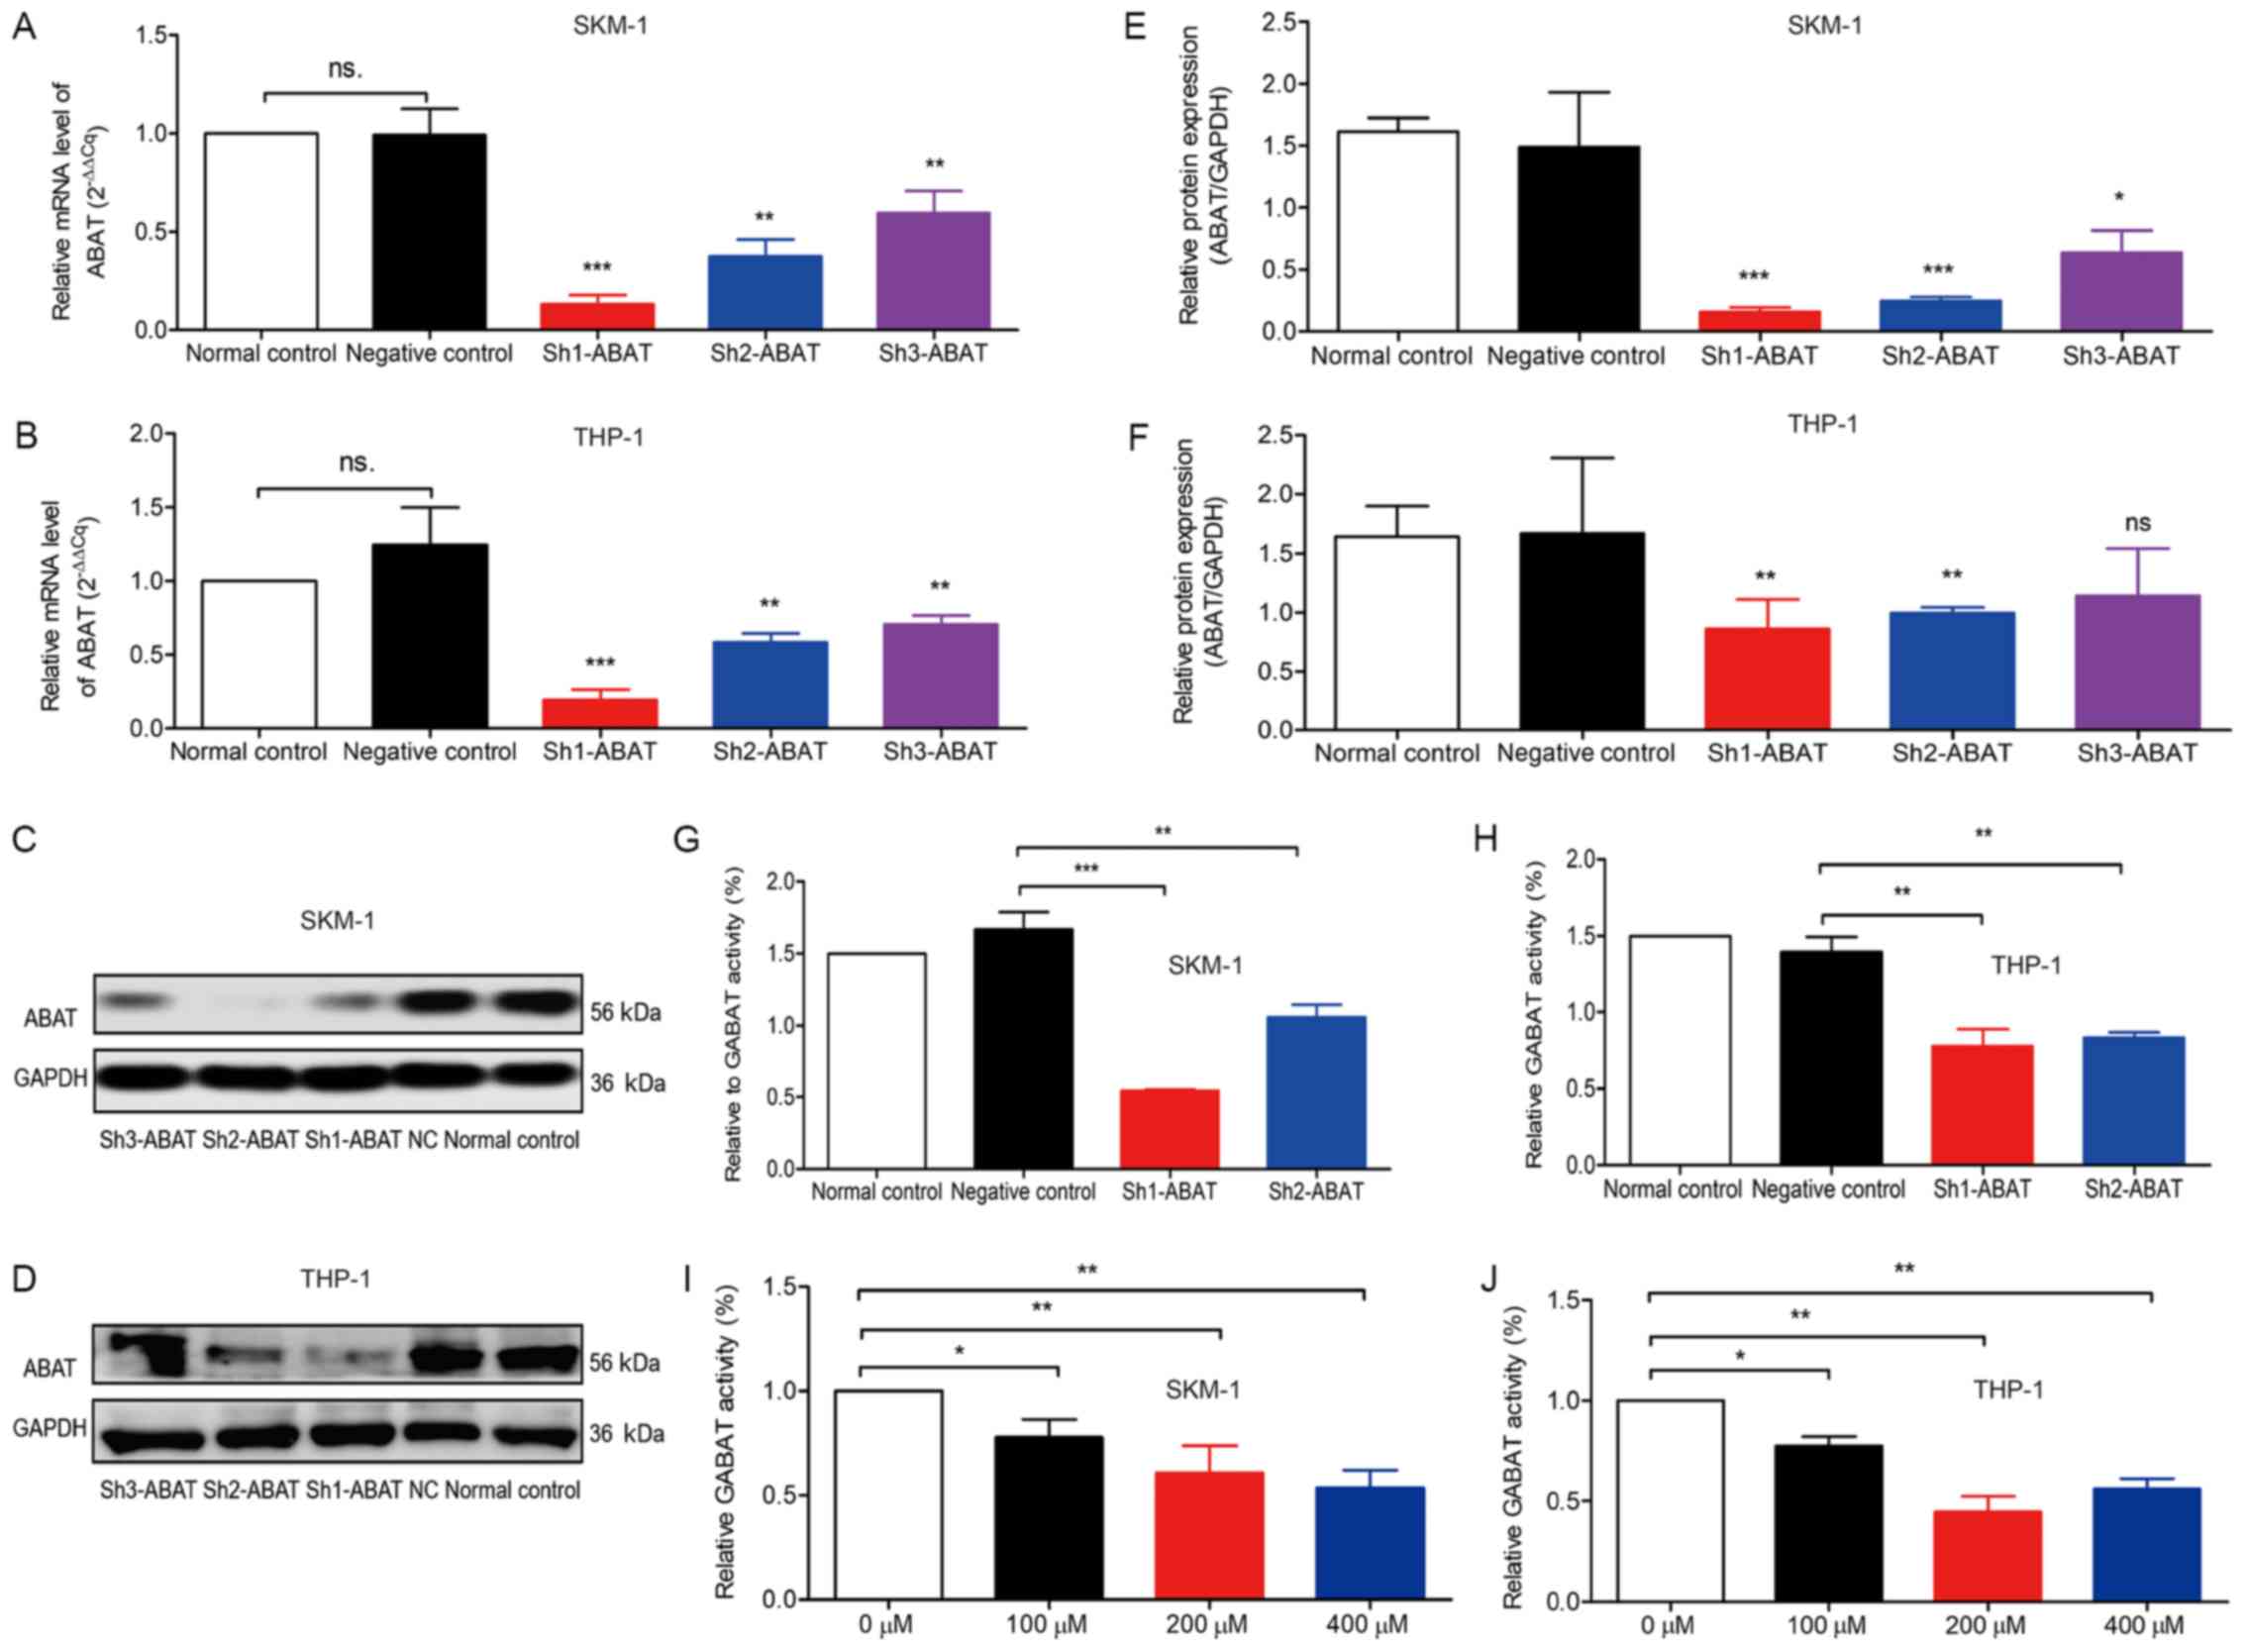
Effects of ABAT shRNA on SKM-1 and THP-1
cells
The mRNA and protein expression levels of
ABAT were detected in the various cell groups (Fig. 2). There was no difference in
ABAT expression between SKM-1 and THP-1 cell lines (data not
shown). HL-60 is also a human leukemia cell line; however, due to
its low expression of ABAT (data not shown), SKM-1 and THP-1
cells were used in this study. Three lentiviral vectors were
constructed containing three different shRNA sequences (i.e.
Sh1-ABAT, Sh2-ABAT and Sh3-ABAT), in order to
explore the biological function of ABAT in leukemia cell
lines. Following infection with the three vectors, the mRNA
expression levels of ABAT were decreased by 90, 70 and 50%
in SKM-1 cells compared with the NC group, respectively (Fig. 2A). In THP-1 cells, following
infection with the three vectors, the mRNA expression levels of
ABAT were decreased by 80, 60 and 40%, respectively
(Fig. 2B). There was no difference
between the normal control and negative control groups with regards
to ABAT mRNA expression. The protein expression levels of
ABAT were decreased by ~90, 80 and 50% (Fig. 2C and E) in the Sh1-ABAT,
Sh2-ABAT and Sh3-ABAT SKM-1 cells, and by 60, 55 and
30% in the THP-1 cells (Fig. 2D and
F) compared with the NC group, respectively. Since the
Sh3-ABAT lentivirus exerted minor effects on the mRNA and
protein expression levels of ABAT, Sh1-ABAT and
Sh2-ABAT lentiviruses were used for further functional
analysis.
Relative activity of GABAT in cells
infected with shRNA lentiviruses and treated with a GABAT
inhibitor
Relative GABAT activity was detected following
infection of SKM-1 and THP-1 cells with shRNA lentiviruses.
Relative GABAT activity was decreased by 65 and 40% in the
Sh1-ABAT and Sh2-ABAT groups compared with in the NC
group in SKM-1 cells (Fig. 2G),
and by 35 and 40% in THP-1 cells (Fig.
2H), respectively. (±)-vigabatrin is a specific inhibitor of
GABAT; therefore, relative activity of GABAT was also detected in
cells following vigabatrin treatment. When the dose of vigabatrin
was increased, GABAT activity was decreased to 70% in the 100
µM group, 60% in the 200 µM group and 55% in the 400
µM group compared with in the control group in SKM-1 cells
(Fig. 2I). In THP-1 cells,
relative GABAT activity was decreased to 70, 40 and 45% in the 100,
200 and 400 µM groups, respectively, compared with in the
control group (Fig. 2J).
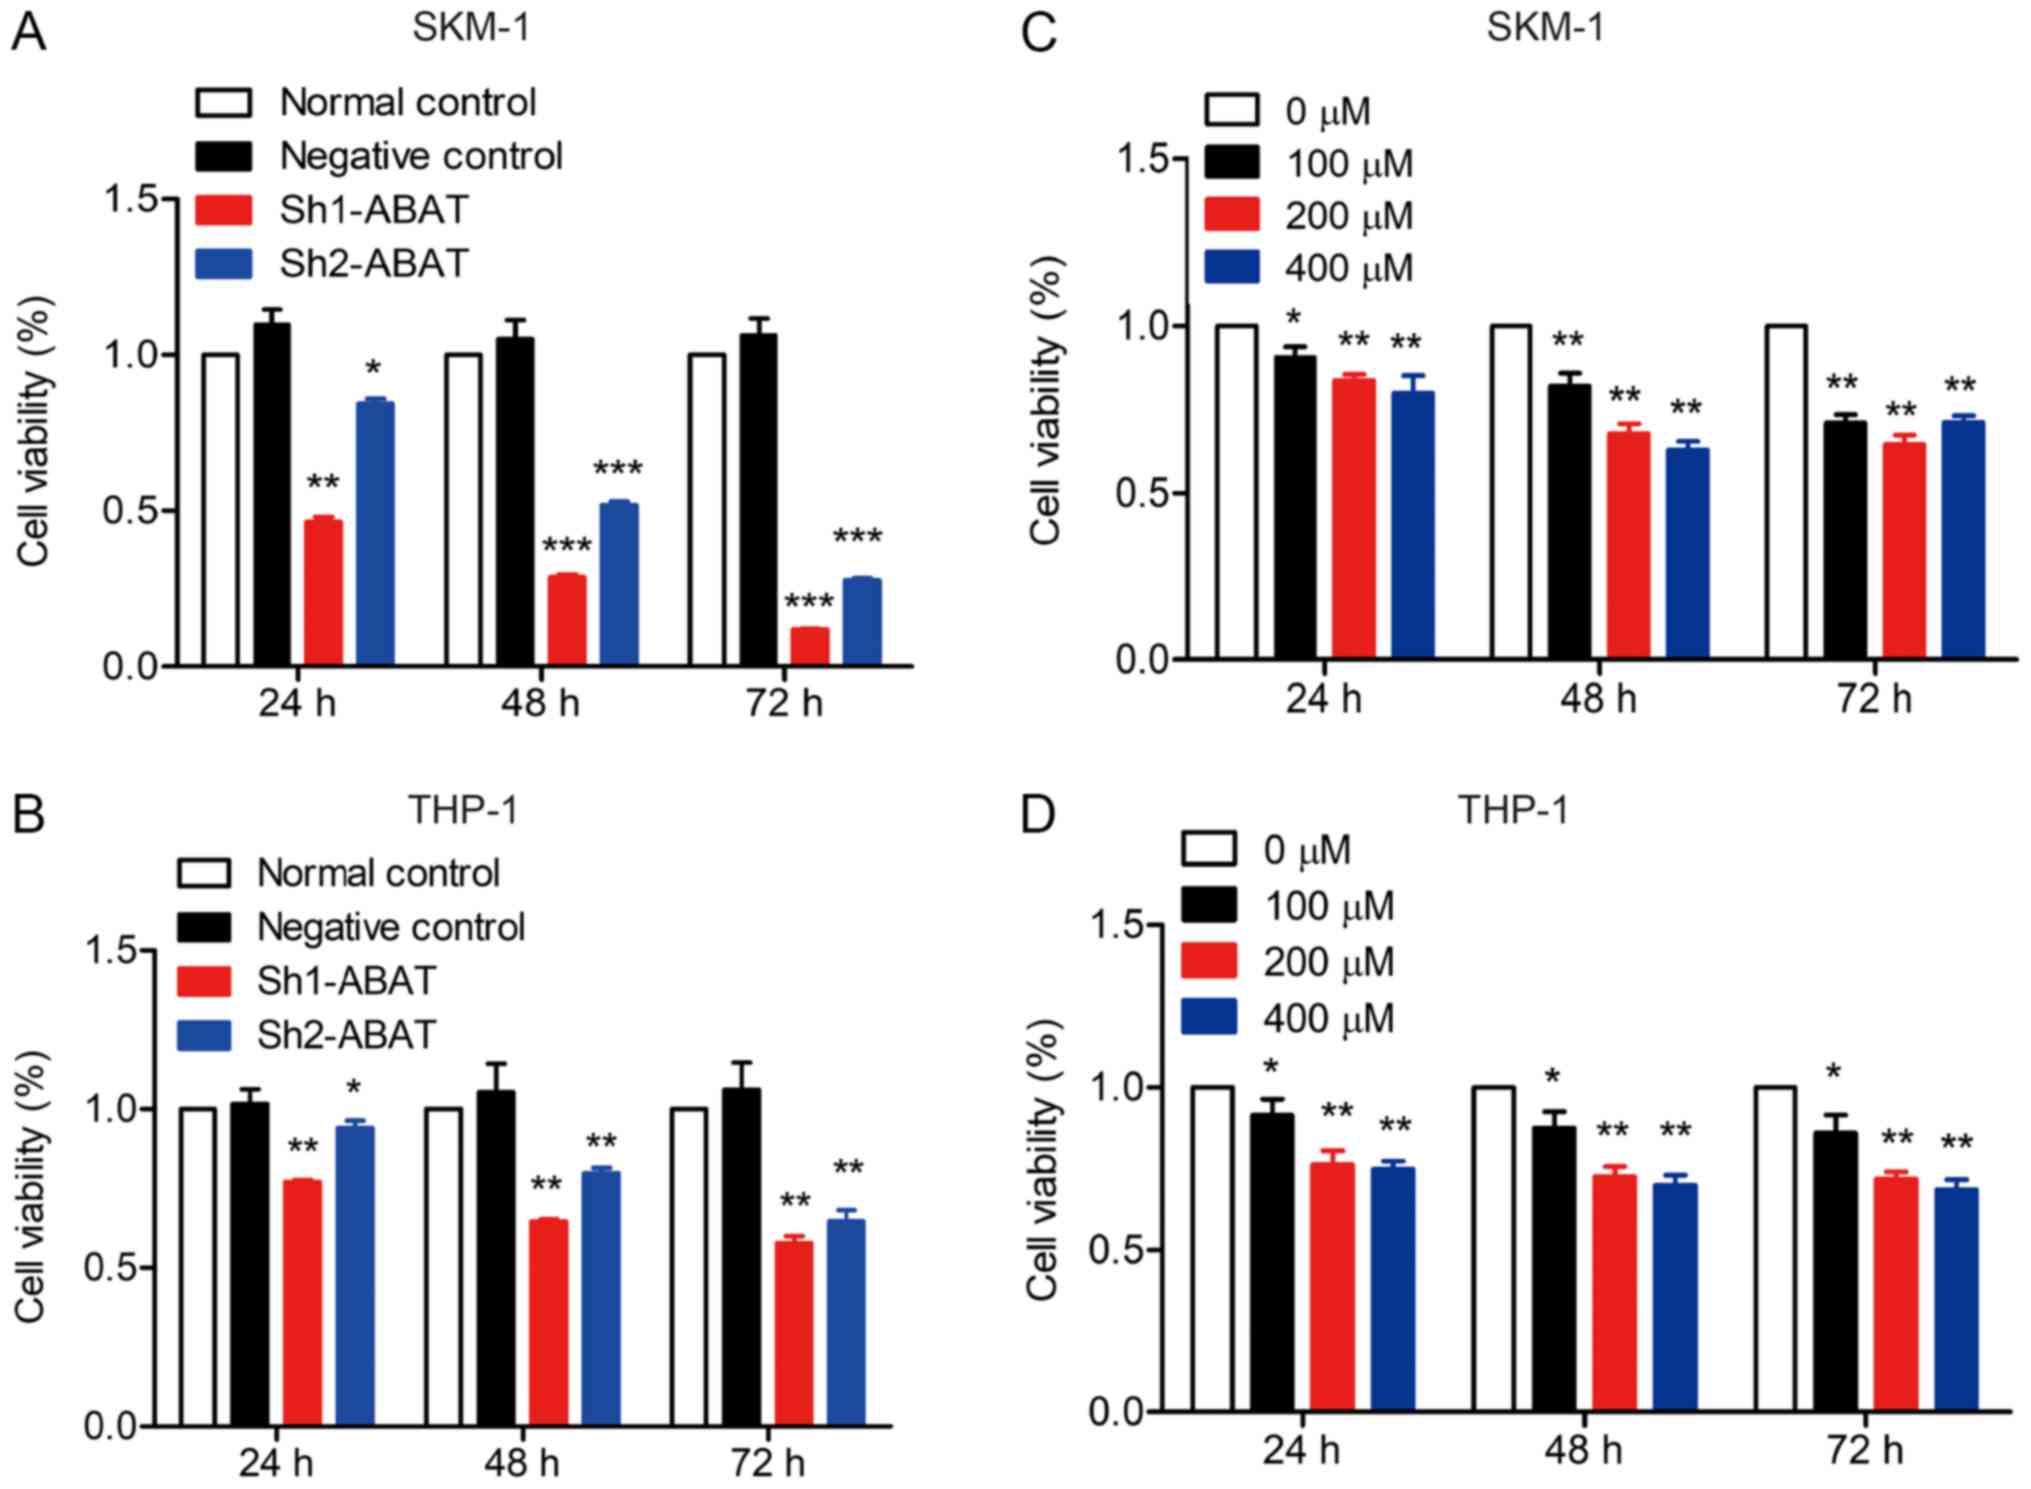
ABAT gene silencing and GABAT inhibition
inhibits leukemia cell viability
SKM-1 and THP-1 cells were infected with shRNA
lentiviruses and the effects of ABAT knockdown on viability
were evaluated. Cells that were not infected with lentivirus or
treated with the GABAT inhibitor were considered normal controls;
all results were compared to the normal control group. The results
revealed that when the expression levels of ABAT were
decreased, cell viability was significantly inhibited (Fig. 3A and B). Furthermore, treatment
with the GABAT inhibitor also inhibited the viability of SKM-1 and
THP-1 cells (Fig. 3C and D). Taken
together, these data indicated important roles for ABAT and
GABAT in the pathogenesis of MDS.
Apoptosis of cells with ABAT gene silencing
and following treatment with a GABAT inhibitor
Cell apoptosis is generally used as an indicator of
alterations in biological behavior. Annexin V-PE/7-AAD and Annexin
V/PI staining, followed by flow cytometry, were used to analyze
apoptosis of cells infected with lentiviruses and treated with
vigabatrin, in order to determine whether cell apoptosis was
affected by ABAT gene silencing and GABAT inhibition. As
shown in Fig. 4, the percentage of
cell apoptosis increased following ABAT gene knockdown using
Sh1-ABAT and Sh2-ABAT lentiviruses. The fraction of
apoptotic cells was 29.07±0.21 and 11.40±0.57% in Sh1-ABAT-
and Sh2-ABAT-infected SKM-1 cells, and 3.04±0.27% in the
negative control group (Fig. 4A and
C). The percentage of apoptotic cells was 18.53±0.81
(P<0.001) and 17.18±1.6% (P<0.001) in Sh1-ABAT- and
Sh2-ABAT-infected THP-1 cells compared with in the negative
control group (Fig. 4B and D). The
expression levels of apoptosis-associated proteins, including
cleaved caspase-3 and Bax were increased, whereas the expression
levels of the anti-apoptotic protein Bcl-2 were decreased in SKM-1
(Fig. 4E and F) and THP-1 cells
(Fig. 4G and H) in response to
ABAT knockdown.
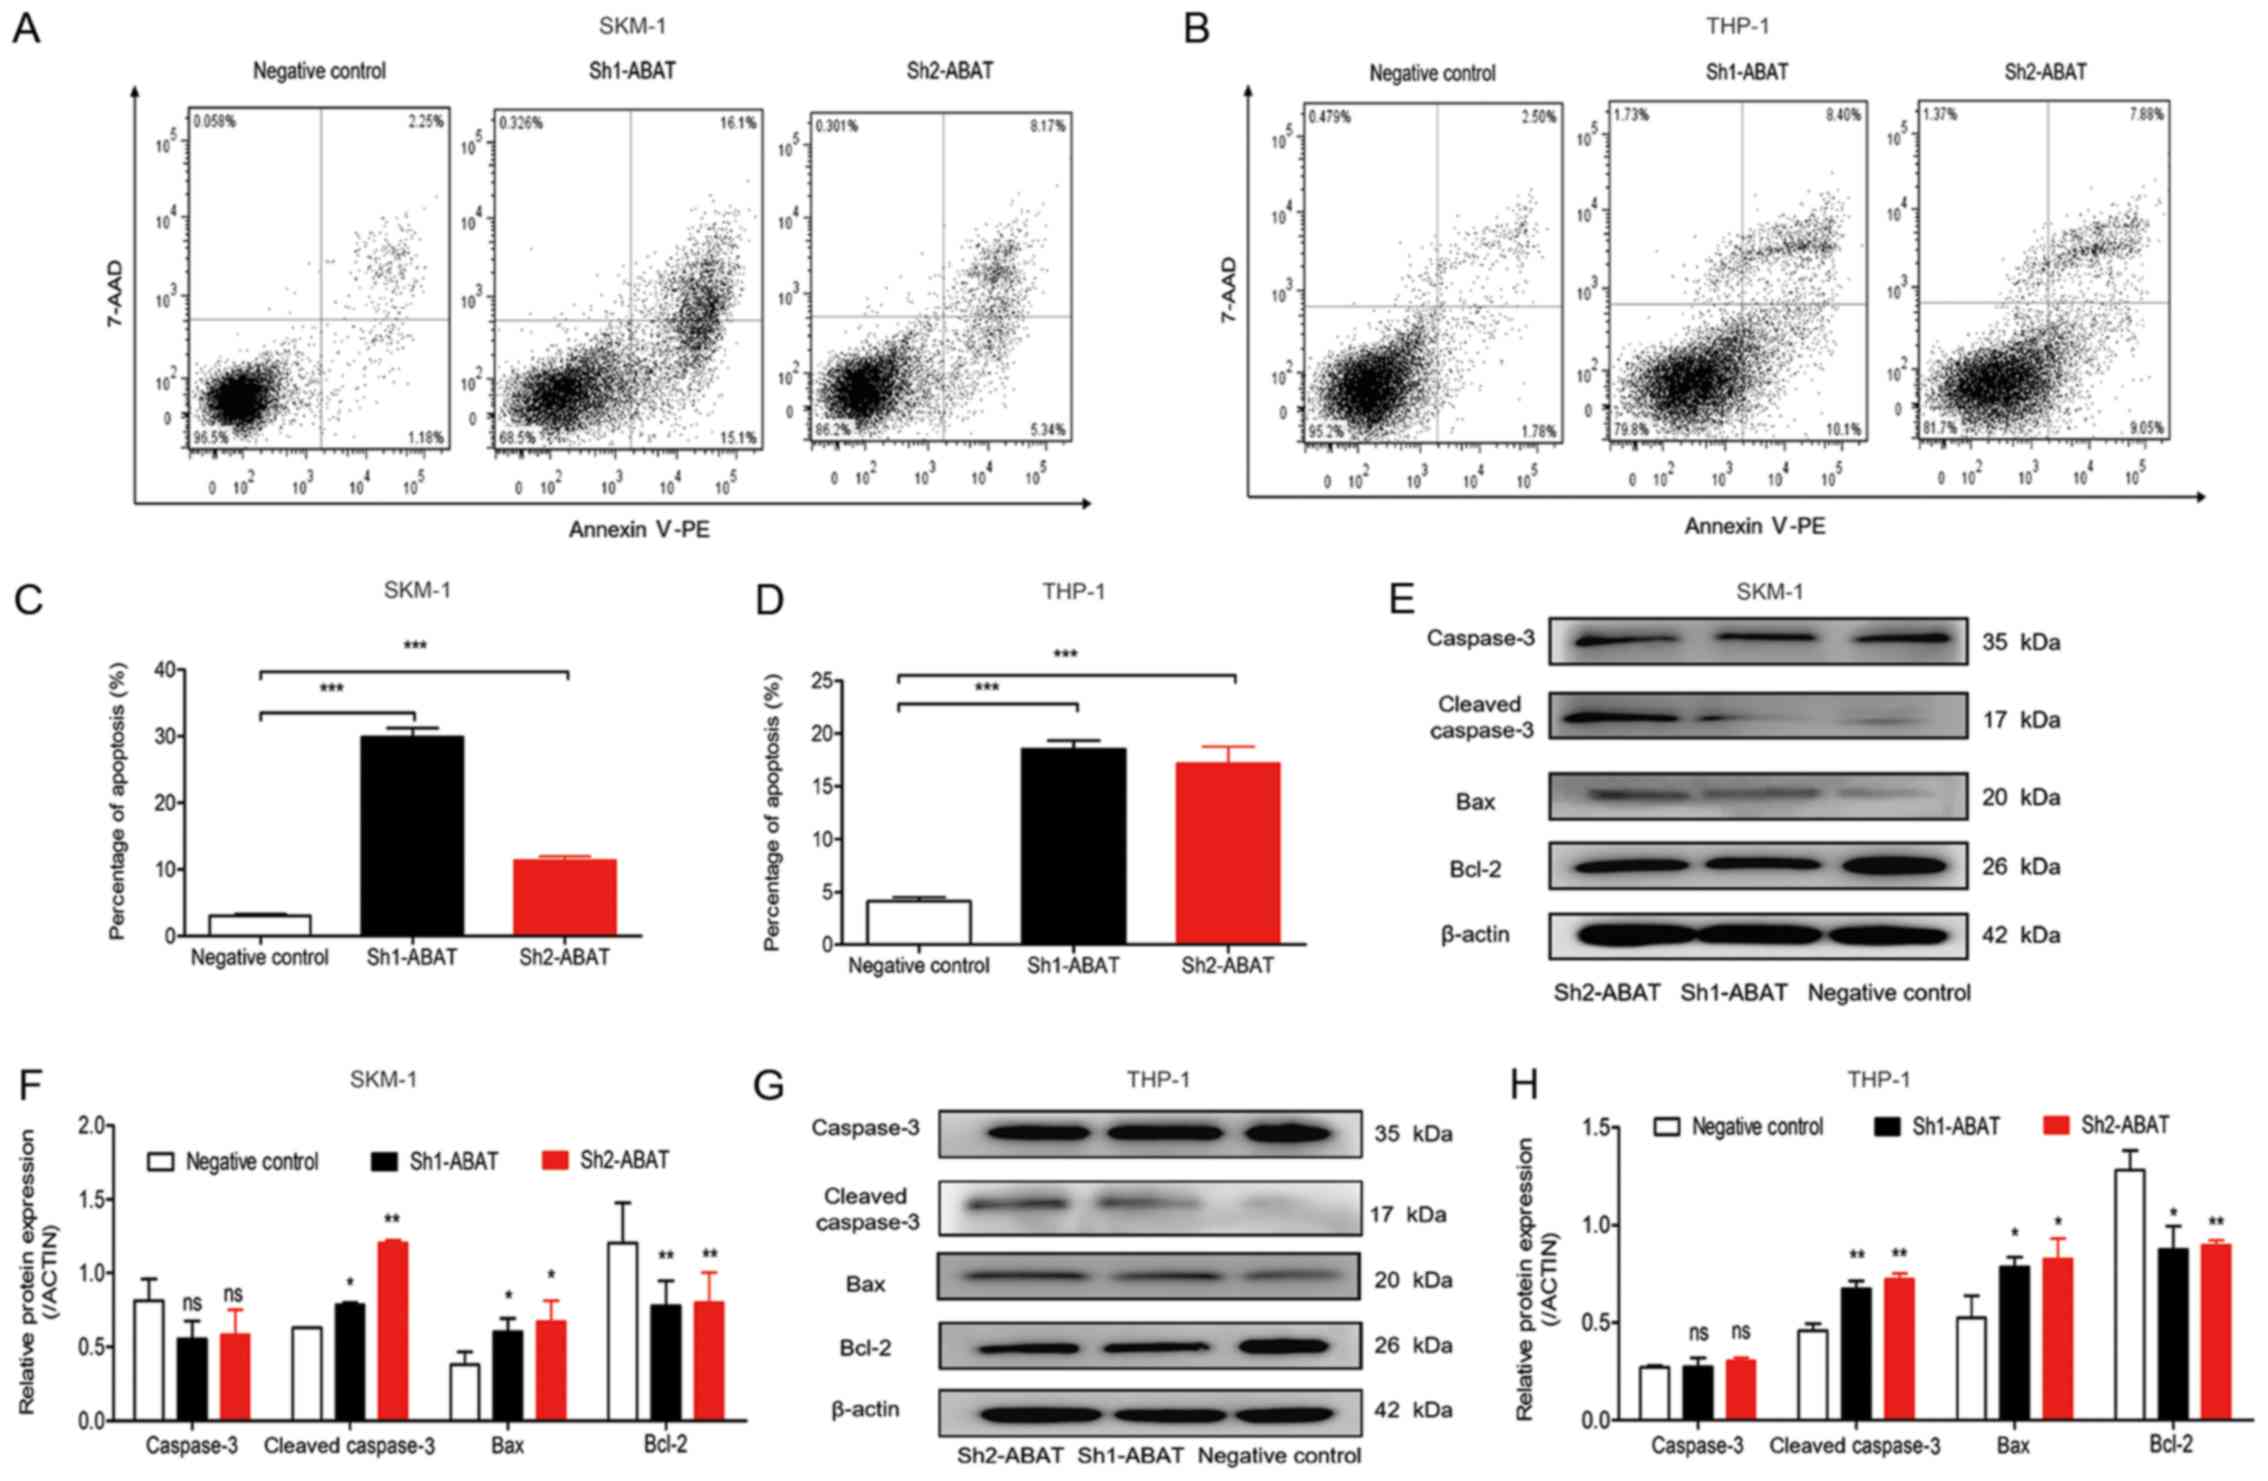 | Figure 4Apoptosis analysis of SKM-1 and THP-1
cells following ABAT gene silencing using flow cytometry and
western blotting. Apoptosis of (A) SKM-1 and (B) THP-1 cells with
ABAT gene silencing, as determined by Annexin V-PE/7-AAD
staining at 72 h. (C) Percentage of apoptotic (C) SKM-1 and (D)
THP-1 cells following infection with negative control and shRNA
lentiviruses. Western blot analysis of apoptosis-associated
proteins in (E and F) SKM-1 and (G and H) THP-1 cells with
ABAT gene silencing at 72 h, including caspase-3, cleaved
caspase-3, Bax and Bcl-2. (F and H) Gray value analysis of
apoptotic proteins was conducted. Data are presented as the means
±standard deviation. *P<0.05, **P<0.01
and ***P<0.001 vs. negative control or as indicated.
7-AAD, 7-aminoactinomycin D; ABAT, 4-aminobutyrate
aminotransferase; Bax, Bcl-2-associated X protein; Bcl-2, B-cell
lymphoma-2; PE, phycoerythrin; sh/shRNA, short hairpin RNA. |
Cell apoptosis was also detected following drug
treatment. Treatment with a GABAT inhibitor had a minor impact on
cell apoptosis. In SKM-1 cells, the percentage of apoptotic cells
was 5.35±0.65, 5.50±0.46, 6.67±0.19 and 6.84±1.15% following
treatment with 0, 100, 200 and 400 µM vigabatrin,
respectively (data not shown). In THP-1 cells, the percentage of
apoptotic cells was 4.97±0.82, 5.07±0.13, 5.80±0.94 and 5.49±1.2%
following treatment with 0, 100, 200 and 400 µM vigabatrin,
respectively; no statistically significant difference was detected
between the groups (data not shown). In addition, the expression
levels of apoptosis-associated proteins exhibited no difference
between the control and drug-treated groups (data no shown).
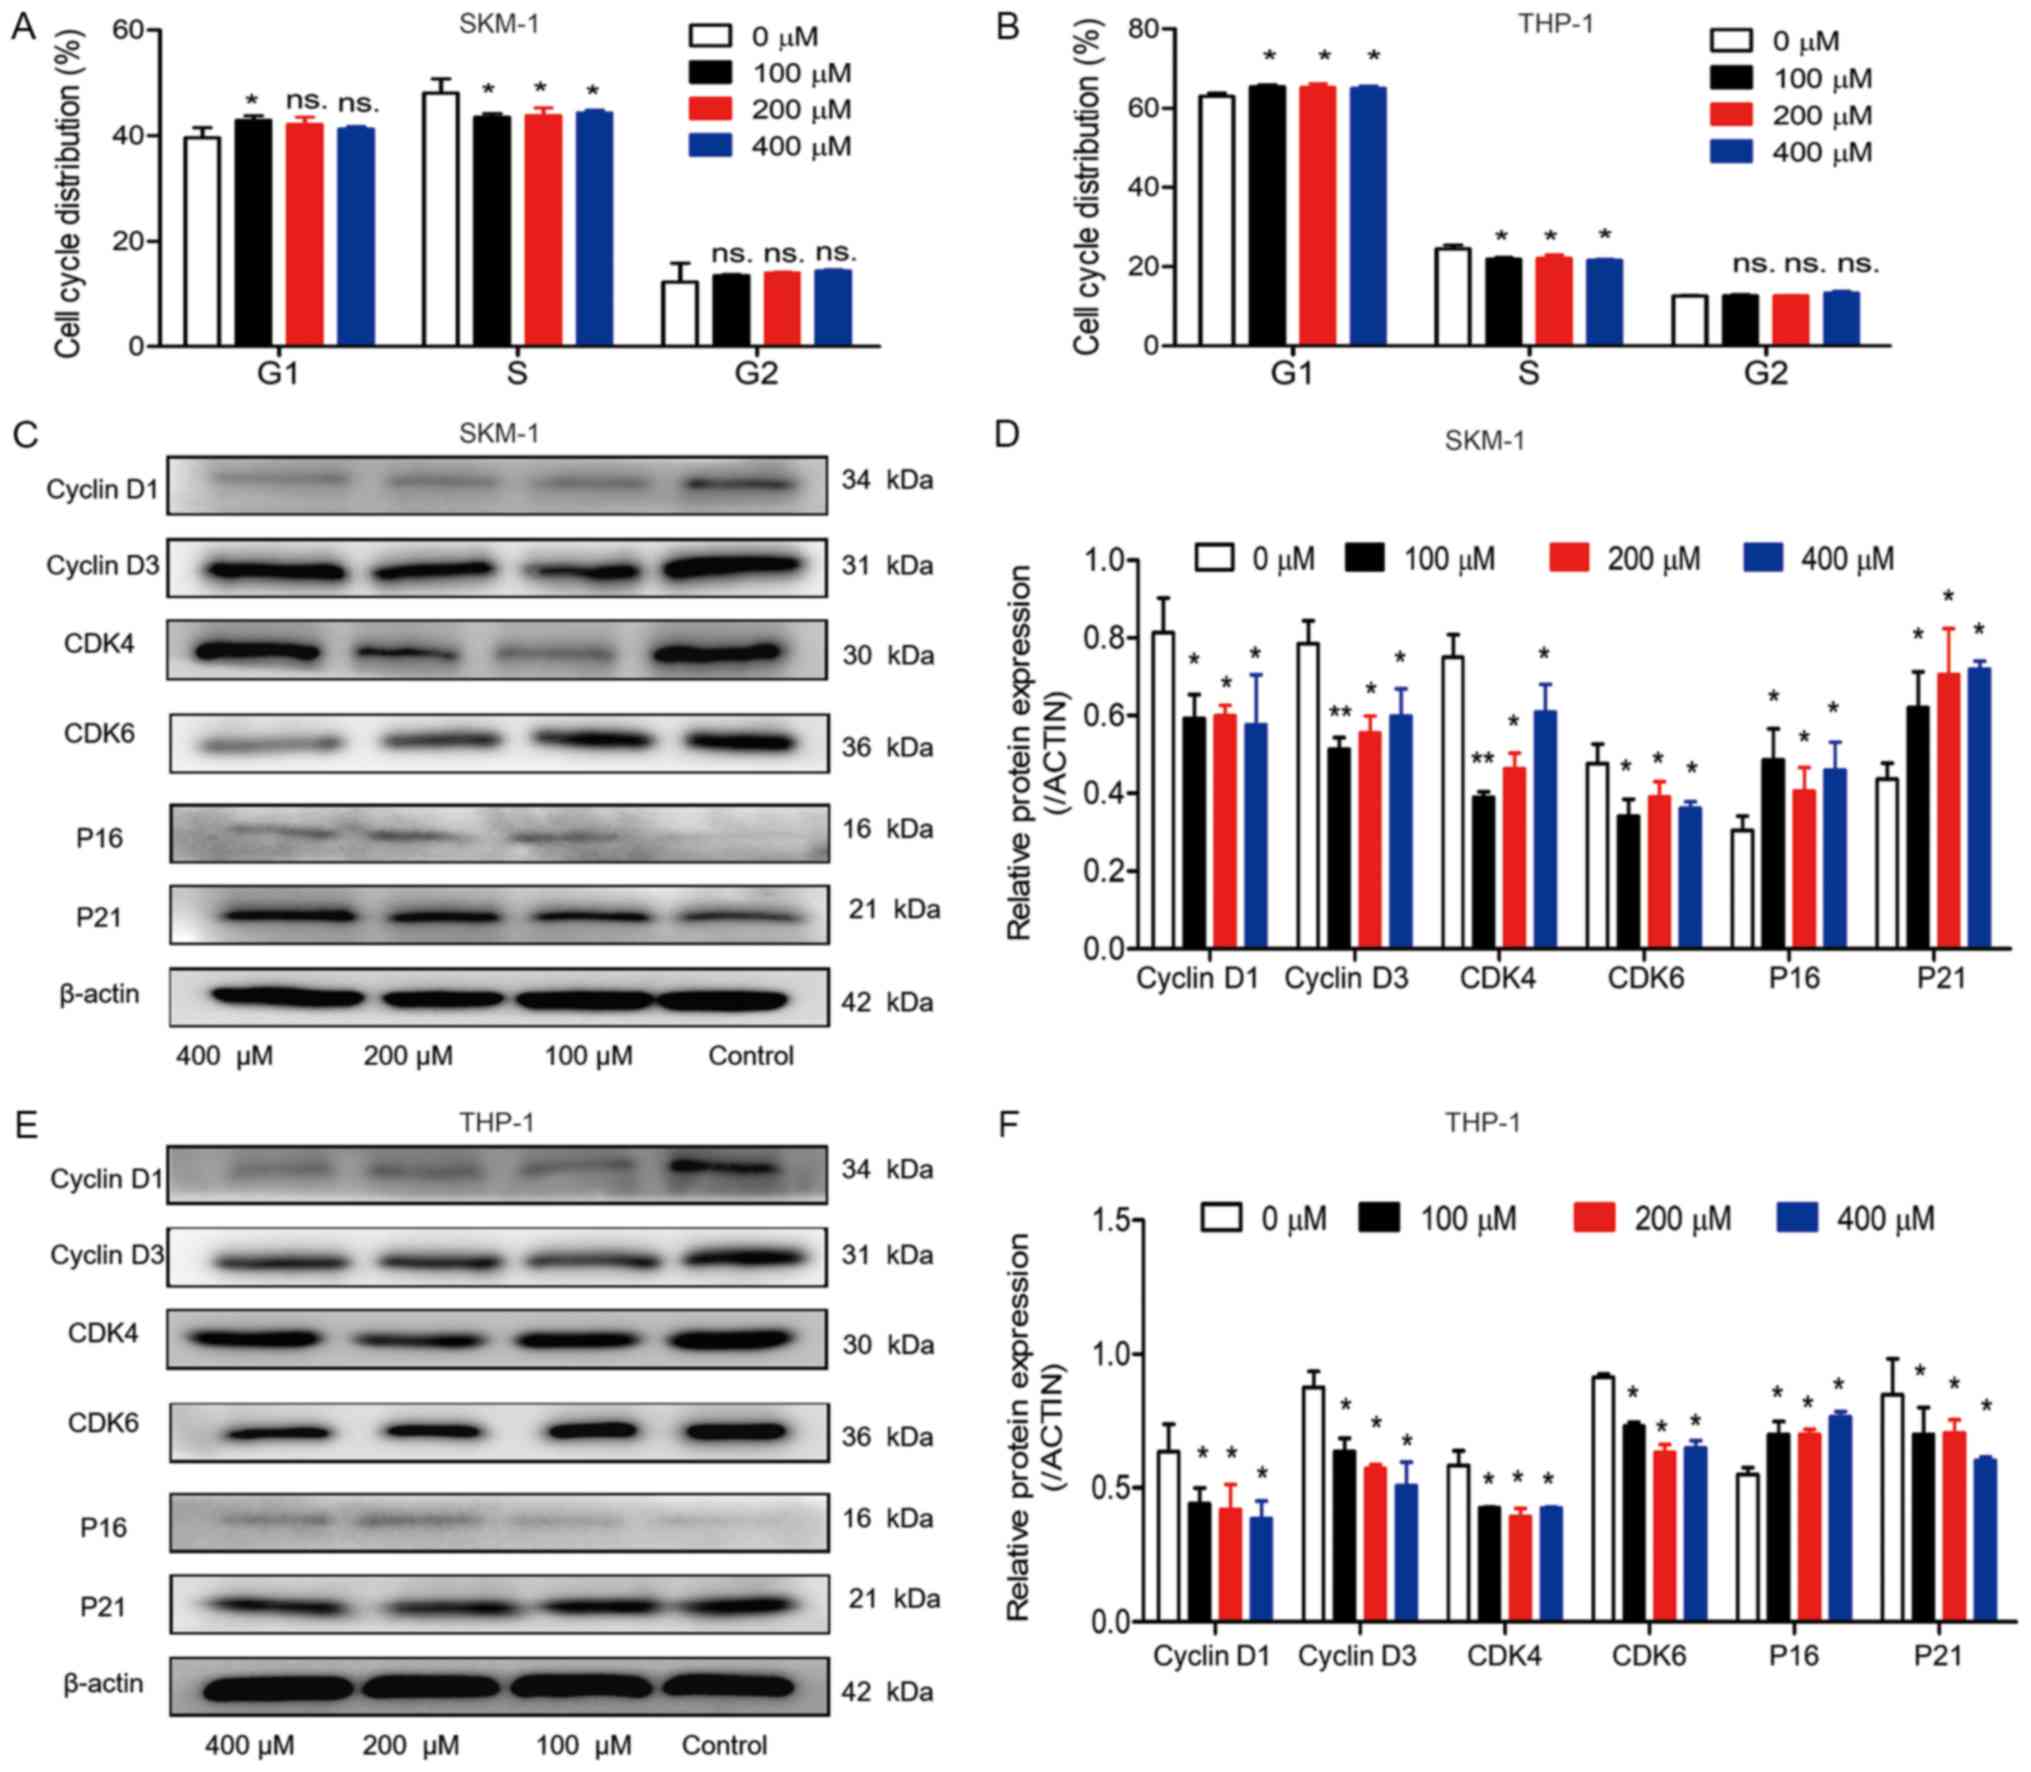
Effects of ABAT gene silencing and GABAT
inhibition on cell cycle distribution
Cell cycle distribution was detected in the two cell
lines, in order to identify whether the inhibitory effects of
ABAT gene silencing and GABAT inhibition on growth could be
explained by alterations in the cell cycle. In SKM-1 cells,
following infection with Sh1-ABAT and Sh2-ABAT, the
percentage of cells in G1 phase was increased to
53.09±4.69 (P<0.01) and 52.85±2.54% (P<0.01) compared with in
the negative control group, and the percentage of cells in S phase
was decreased to 34.28±0.29 and 34.89±0.22%, respectively (Fig. 5A). The same trend was observed in
the THP-1 cells (Fig. 5B). There
was no difference between the negative control and normal control
groups. In these two cell lines, cell cycle-associated proteins
were also detected. The protein expression levels of CDK6, CDK4,
cyclin D1 and cyclin D3 were significantly downregulated, whereas
the expression levels of the periodic inhibitory proteins,
p16INK4a and p21Waf1/Cip1, were upregulated
in SKM-1 cells in response to ABAT knockdown (Fig. 5C and D). Conversely, in THP-1
cells, the expression of p21Waf1/Cip1 was decreased
(Fig. 5E and F).
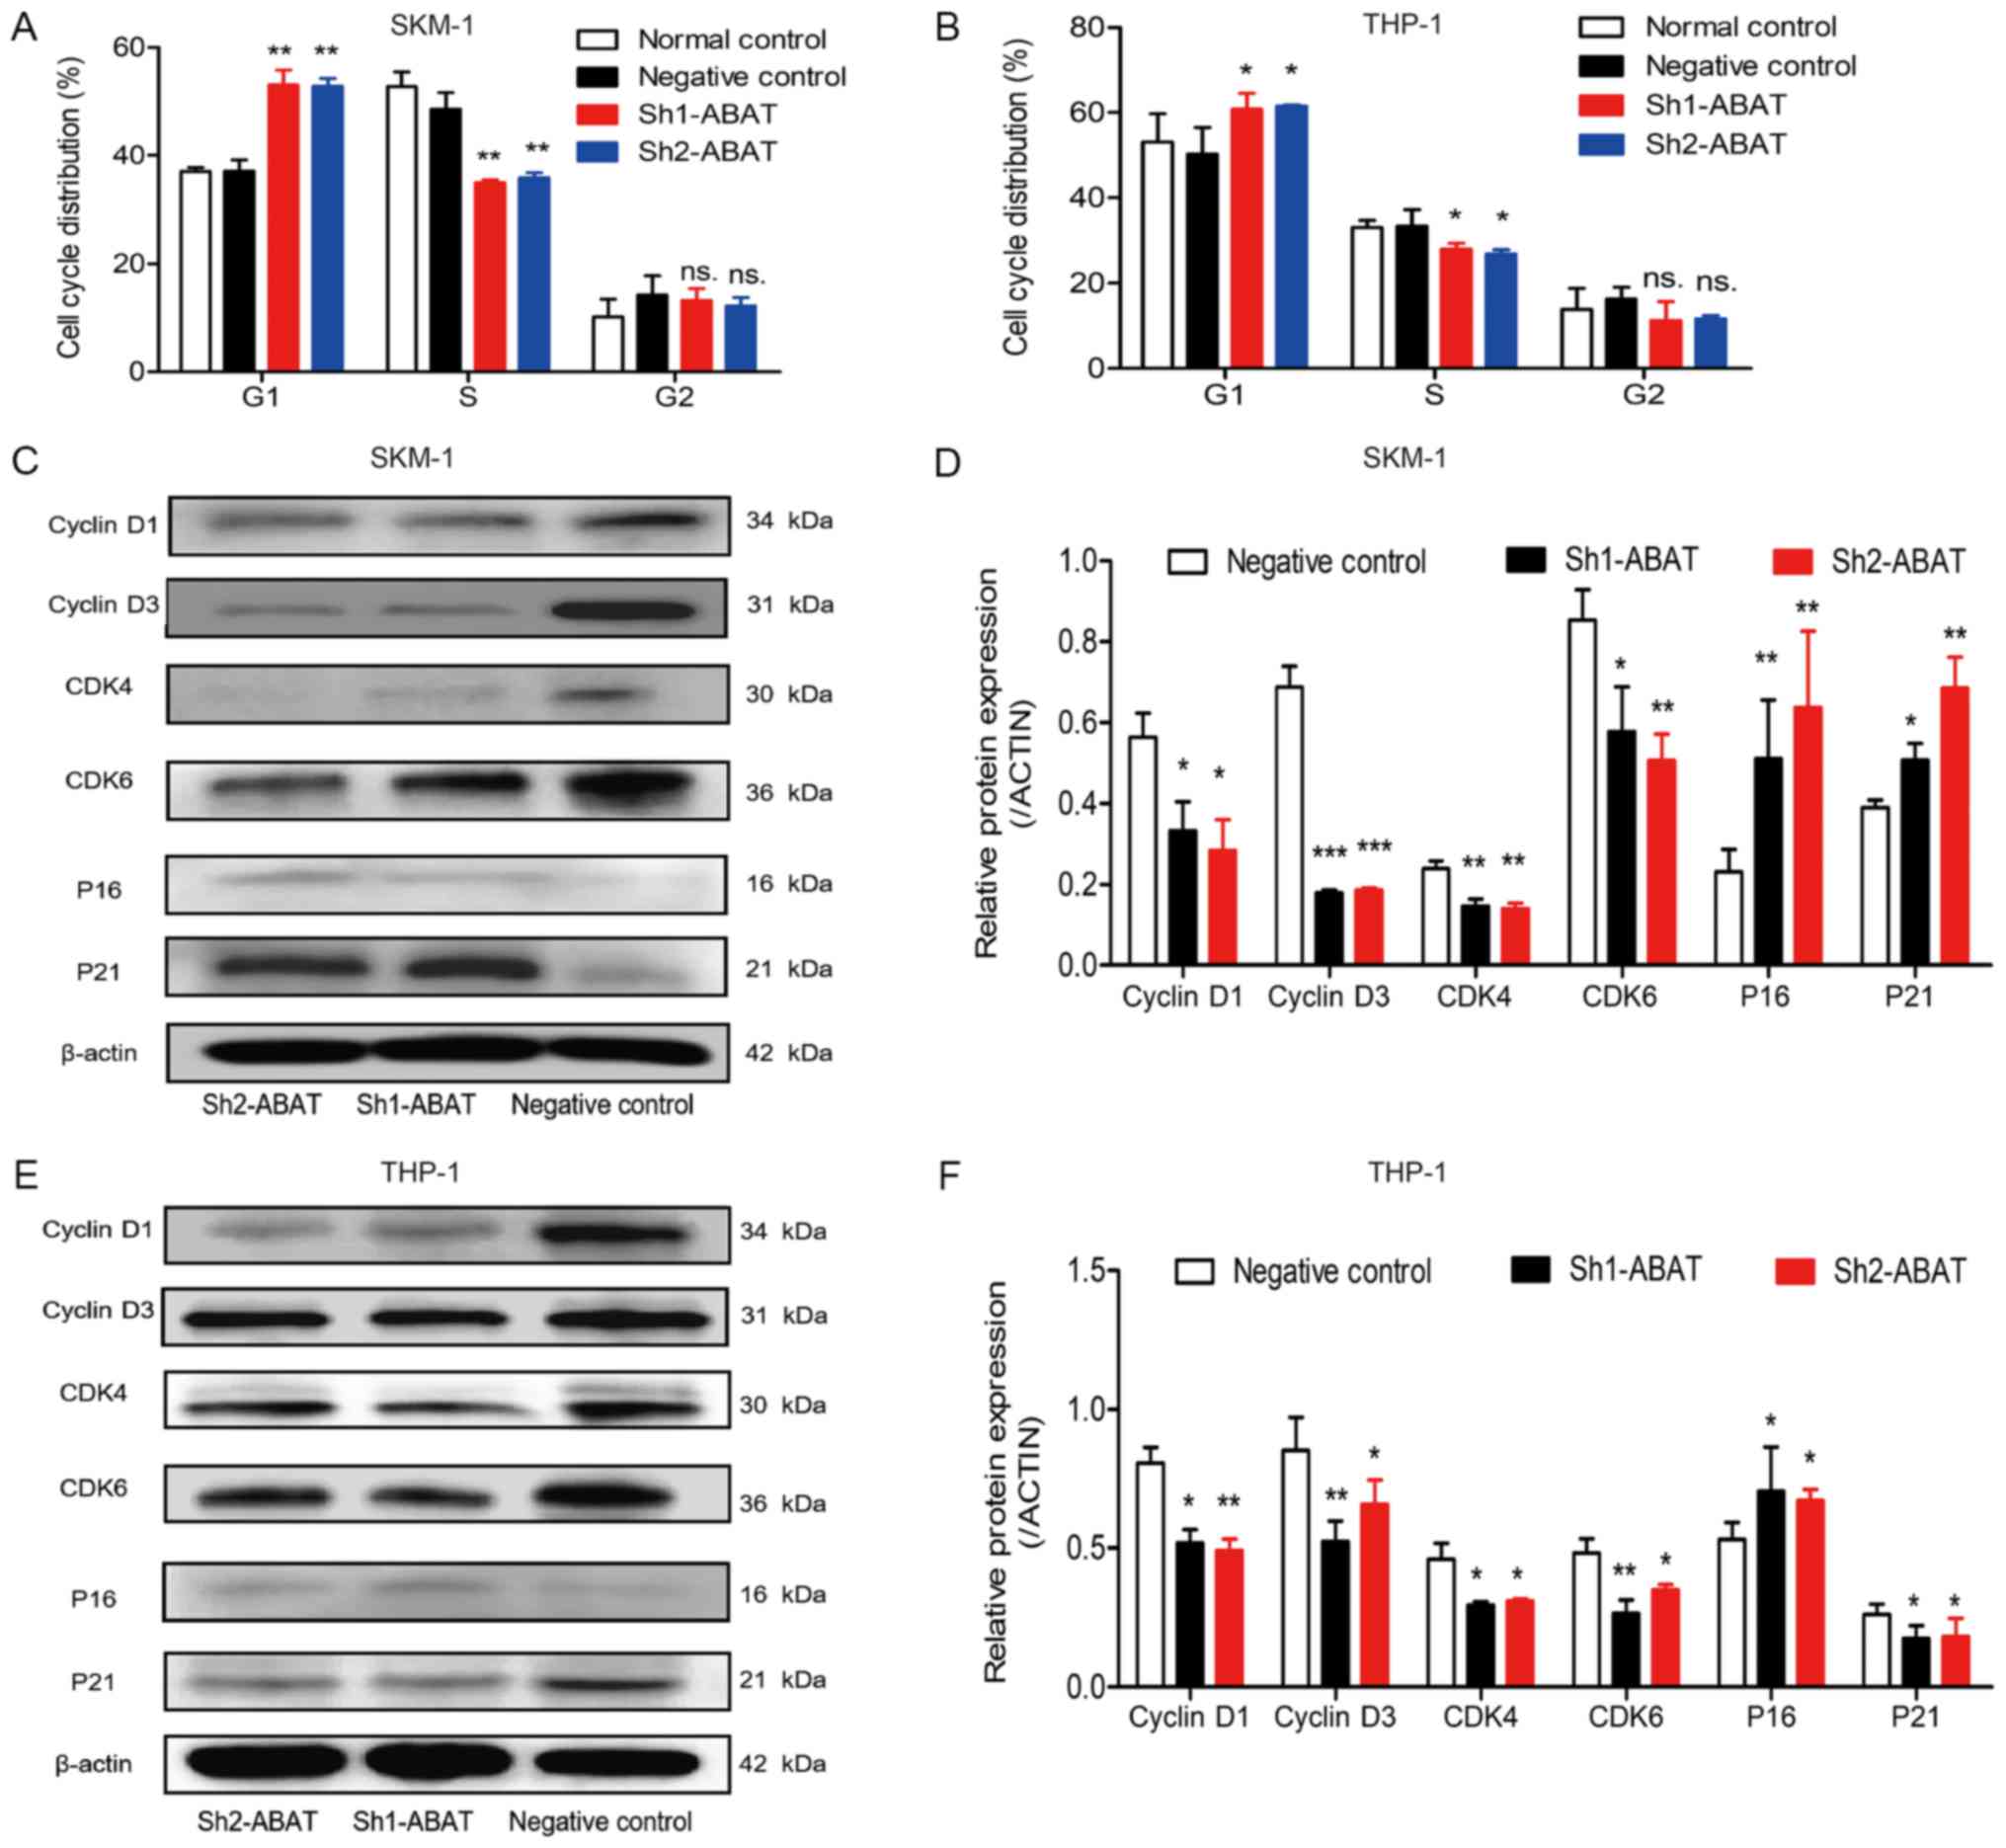 | Figure 5Cell cycle distribution and
associated protein expression in SKM-1 and THP-1 cells following
ABAT gene silencing. Cell cycle distribution of (A) SKM-1
and (B) THP-1 cells in the normal control, negative control and
sh-ABAT groups. Expression levels of cell cycle proteins in
(C and D) SKM-1 cells and (E and F) THP-1 cells with ABAT
gene silencing, including cyclin D1, cyclin D3, CDK4, CDK6, p16 and
p21. (D and F) Gray value analysis of cell cycle-associated
proteins was conducted. *P<0.05,
**P<0.01 and ***P<0.001 vs. the
negative control group or normal control group. ABAT,
4-aminobutyrate aminotransferase; CDK, cyclin-dependent kinase; ns,
not significant; sh, short hairpin RNA. |
Cell cycle distribution was also measured following
drug treatment. When SKM-1 and THP-1 cells were treated with 100,
200 and 400 µM vigabatrin for 10 days, the percentage of
cells in G0/G1 phase was slightly increased
(Fig. 6A and B). Furthermore, in
SKM-1 cells, the percentage of cells in S phase was decreased from
50.28±5.82% to 43.51±1.12, 43.83±2.49 and 44.32±0.87% in response
to 100, 200 and 400 µM vigabatrin (Fig. 6A). In THP-1 cells, the percentage
of cells in S phase was decreased from 25.44±1.65% to 21.90±0.61,
22.09±1.44 and 21.61±0.30% in response to 100, 200 and 400
µM vigabatrin (Fig. 6B).
The expression levels of cell cycle-associated proteins were also
detected by western blotting. A similar trend was observed in cells
treated with the GABAT inhibitor as in cells with ABAT gene
knockdown (Fig. 6C-F).
Discussion
Alterations in DNA methylation have been implicated
in the pathogenesis of MDS and AML, and methylation serves as an
indicator for disease progression and treatment efficacy (5). Several genes have been reported to be
highly methylated in patients with MDS, including fragile histidine
triad, inhibitor of DNA binding 4, HLH protein, suppressor of
cytokine signaling 1 and glutathione peroxidase 3. As the disease
progresses, these genes exhibit a higher methylation degree in
high-risk groups compared with in low-risk groups (16-20).
In the present study, high-risk patients (RAEB-1 and RAEB-2) with
MDS exhibited a higher degree of ABAT gene methylation
compared with low-risk subjects. Furthermore, patients with high
methylation of ABAT had a poor prognosis, which was in
concordance with previous reports on other genes in patients with
MDS (16,18,21,22).
Notably, when the number of bone marrow blasts and the IPSS risk
group increased, the degree of ABAT methylation also
increased. Therefore, it may be concluded that increased
methylation of ABAT could indicate progression in patients
with MDS.
Chromosomal abnormalities and gene mutations are
considered progression-associated drivers in patients with MDS
(23). Several gene mutations,
including in isocitrate dehydrogenase (NADP(+)) 1, cytosolic
(IDH1), isocitrate dehydrogenase (NADP(+)) 2, mitochondrial
(IDH2), tet methylcytosine dioxygenase 2, ASXL
transcriptional regulator 1 and enhancer of zeste 2 polycomb
repressive complex 2 subunit, have been revealed to induce
epigenetic alterations in hematological malignancies (24). GABAT can catalyze the conversion of
GABA into succinic semialdehyde (SSA). SSA is then reduced by SSA
dehydrogenase to form succinic acid, which enters the tricarboxylic
acid (TCA) cycle (25,26). Mutations in IDH1 and
IDH2 genes, which serve an important role in the TCA cycle,
have been reported to participate in the pathogenesis and
progression of MDS (27);
therefore, it was hypothesized that mutations in the ABAT
gene may be involved in the pathogenesis of MDS, due to its
relation to the TCA cycle. However, the frequency of ABAT
mutations is very low; the mutation sites include 631C>T,
275G>A, 1433T>C, 659G>A, 454C>T and 888G>T (8,15,28).
ABAT mutations can lead to inactivation of ABAT and
elevated GABA concentrations. Patients with these mutations display
symptoms, including severe psychomotor retardation, hypotonia,
hyperreflexia, seizures, high-pitched cry, growth acceleration and
early mortality (8). However, in
the present study, the patients with MDS exhibited no such
symptoms; therefore, it was hypothesized that these patients did
not have ABAT mutations. Single-nucleotide polymorphisms
(SNPs) of ABAT have been reported to be closely associated
with numerous diseases, including autism, gastroesophageal reflux
disease and affective disorder (29-31).
Therefore, the existence of SNPs and their correlation with MDS may
be worth exploring.
In the present study, it was suggested that altered
expression levels of ABAT may participate in the
pathogenesis of MDS; therefore, the expression levels of
ABAT were detected in patients with MDS and AML, and control
individuals. Control patients had immune thrombocytopenia, and were
considered suitable controls for MDS. In terms of routine blood
examination, MDS and immune thrombocytopenia both present with
cytopenia; in addition, MDS is a hemopoietic clonal disease,
whereas immune thrombocytopenia is not a clonal disease of the
blood system. The results demonstrated that the mRNA expression
levels of ABAT were reduced in patients with MDS compared
with in the controls. The present findings indicated that reduced
ABAT expression in patients with MDS may be associated with
high methylation of the ABAT gene. Notably, as the number of
bone marrow blasts increased, so did the expression levels of
ABAT. Subjects in the high-risk group exhibited higher
ABAT expression compared with in the low-risk group;
therefore, it was suggested that high ABAT expression may be
used to predict disease progression for patients with MDS. However,
in this study, ABAT gene expression was higher in control
patients compared with in patients with MDS. Using multivariate
analysis, it was demonstrated that the expression of ABAT
was not an independent factor for prognosis. Gene expression can be
regulated at the DNA and RNA level; therefore, ABAT
expression may not be a good predictor for disease progression.
However, low expression levels of ABAT have been reported to
be associated with poor prognosis in patients with breast cancer
and hepatocellular carcinoma (9-11).
Disease types and the complexity of disease pathogenesis may be
important factors.
In patients with cancer, aberrant hypermethylation
in the promoter region often results in reduced gene expression
(1). In our previous study, it was
hypothesized that ABAT gene hypermethylation led to reduced
expression (6). In the present
study, when analyzing the expression and methylation levels of
ABAT in patients with MDS and AML, the same trend was
observed with regards to methylation and mRNA expression. The
results of a survival analysis indicated that higher ABAT
methylation was associated with poor prognosis in patients. In
multivariate analysis, ABAT gene methylation was revealed to
be an independent indicator for disease progression. In addition,
the methylation degree of ABAT was revealed to be an
independent prognostic factor. In AML, an inverse correlation has
been detected between gene expression (CCAAT enhancer binding
protein α and CCAAT enhancer binding protein δ) and methylation
(32). In addition to methylation,
several other factors influence gene expression, including
chromatin remodeling, transcriptional activation from a new
transcription start site (33),
intragenic DNA methylation (34)
and abnormal histone acetylation (35). The exact mechanisms underlying gene
regulation require further exploration in patients with MDS.
It has previously been demonstrated that conversion
of GABA into SSA and glutamate is catalyzed by GABAT (26). GABAT-derived glutamate is then
catabolized by glutamate dehydrogenase into α-ketoglutaric acid,
which enters the TCA cycle (26).
The ABAT gene also participates in the mitochondrial
nucleoside salvage pathway. If ABAT gene expression is
knocked down and relative activity of GABAT is decreased, DNA
depletion of mitochondria occurs (8). Since ABAT is closely
associated with the TCA cycle and mitochondrial nucleoside salvage
pathway, and the methylation level of ABAT was considered a
prognostic indicator for patients with MDS, the biological function
of ABAT in leukemia cells was determined, in order to
evaluate its involvement in the pathogenesis of MDS.
In the present study, when ABAT was knocked
down, the percentage of apoptosis was significantly increased, and
the expression levels of apoptosis-associated proteins, including
cleaved caspase-3 and Bax, were upregulated. Simultaneously, cell
cycle distribution was detected by flow cytometry, and it was
revealed that cell cycle progression was blocked in G1/S
phase in response to ABAT knockdown. Furthermore, the
expression levels of associated proteins, including CDK4, CDK6,
cyclin D1 and cyclin D3, were decreased. In tumor cells, the
CDK/cyclin D-retinoblastoma protein kinase complex regulates
G1/S transition, and decreased CDK/cyclin D activity can
result from the low expression of D-type cyclins or CDK4/6
(36). In the present study,
knockdown of ABAT gene expression led to reduced CDK/cyclin
D protein expression and blockage of G1/S phase, thus
indicating that the ABAT gene may be crucial in the
pathogenesis of MDS. Notably, two groups of CDK inhibitors (CDKIs)
regulate CDK/cyclin D activity: The INK4 family (notably
p16INK4a) and Cip/Kip family (p21Waf1/Cip1,
p27 and p57) (37). High
expression of CDKIs is often associated with inhibition of CDK
expression. Correspondingly, cells with low expression of CDK4 and
CDK6 frequently exhibit upregulation of antiperiodic proteins
p16INK4a and p21Waf1/Cip1 (38). In THP-1 cells, p16 expression was
similar to that in SKM-1 cells; however, the expression of
p21Waf1/Cip1 protein was downregulated in response to
ABAT knockdown. p21Waf1/Cip1, as a CDKI, is a
characterized modulator of p53-induced cell cycle arrest, which is
recognized as an important tumor suppressor gene; inactivation of
p53 can lead to reduced expression of p21Waf1/Cip1
(39). In THP-1 cells, p53
activity should be determined following ABAT knockdown. When
these cells were treated with the GABAT inhibitor vigabatrin, cell
cycle progression was also blocked at the G1/S phase;
however, the inhibitor had no effect on cell apoptosis. The present
study hypothesized that the role of GABAT in MDS pathogenesis did
not work only through enzyme activity. The mechanism in patients
with MDS and leukemia cell lines requires further exploration.
In conclusion, the present study revealed that
ABAT was highly methylated in patients with MDS. The mRNA
expression levels and degree of methylation of ABAT in
patients with MDS was dynamically altered with progression of
disease. The age of subjects with MDS, hemoglobin levels, WHO
classification, marrow blast levels, IPSS cytopenias, karyotypes
and risk group, mRNA levels of ABAT, and methylation
percentages were all associated with OS of patients with MDS,
whereas age, marrow blast count and the degree of ABAT
methylation were independent factors for the survival of patients
with MDS. Biological function analysis revealed that cell apoptosis
and cell cycle distribution were closely associated with
ABAT gene expression. Future studies should investigate the
role of the ABAT gene in the molecular mechanisms in
patients with MDS. In the future, molecular inhibitors may be
designed that target the TCA cycle, in order to offset the function
of the ABAT gene in leukemia, or that can be combined with
other inhibitors to provide possible strategies for clinical
treatment.
Funding
The present study was supported by grants from The
Natural Science Foundation of Shanghai (grant nos. 16ZR1404400 and
17ZR1403600) and The Key Construction Building Subject of
Three-year Action Plan of Fourth Round of Public Health Project in
Shanghai (grant no. 15GWZK0801).
Availability of data and materials
The datasets used and/or analyzed during the
current study are available from the corresponding author on
reasonable request.
Authors’ contributions
JG and XW designed the experiments. GZ performed
and analyzed most of the experiments, and wrote the manuscript. SL
and WW collected and analyzed MDS patient blood samples. NL
performed some experiments. All authors read and approved the final
manuscript.
Ethics approval and consent to
participate
All procedures involving human participants were
performed in accordance with the ethical standards of the
institutional research committee and with the 1964 Helsinki
declaration and its later amendments or comparable ethical
standards. The present study was approved by the Ethics Committee
of Huashan Hospital, Fudan University (approval no. KY2015-269).
Patients provided informed consent.
Patient consent for publication
Informed consent was obtained from all individual
participant included in the study.
Competing interests
The authors declare that they have no competing
interests.
Acknowledgments
The authors would like to thank Dr Yan Wang
(Huashan Hospital, Fudan University) for his operation and analysis
of flow cytometry.
References
|
1
|
del Rey M, O’Hagan K, Dellett M, Aibar S,
Colyer HA, Alonso ME, Díez-Campelo M, Armstrong RN, Sharpe DJ,
Gutiérrez NC, et al: Genome-wide profiling of methylation
identifies novel targets with aberrant hypermethylation and reduced
expression in low-risk myelodysplastic syndromes. Leukemia.
27:610–618. 2013. View Article : Google Scholar
|
|
2
|
Leone G, Voso MT, Teofili L and Lübbert M:
Inhibitors of DNA methylation in the treatment of hematological
malignancies and MDS. Clin Immunol. 109:89–102. 2003. View Article : Google Scholar
|
|
3
|
Khan H, Vale C, Bhagat T and Verma A: Role
of DNA methylation in the pathogenesis and treatment of
myelodysplastic syndromes. Semin Hematol. 50:16–37. 2013.
View Article : Google Scholar
|
|
4
|
Zhao X, Yang F, Li S, Liu M, Ying S, Jia X
and Wang X: CpG island methylator phenotype of myelodysplastic
syndrome identified through genome-wide profiling of DNA
methylation and gene expression. Br J Haematol. 165:649–658. 2014.
View Article : Google Scholar
|
|
5
|
Dexheimer GM, Alves J, Reckziegel L,
Lazzaretti G and Abujamra AL: DNA methylation events as markers for
diagnosis and management of acute myeloid leukemia and
myelodysplastic syndrome. Dis Markers. 2017.5472893:2017.
|
|
6
|
Li N, Chen Q, Gu J, Li S, Zhao G, Wang W,
Wang Z and Wang X: Synergistic inhibitory effects of deferasirox in
combination with decitabine on leukemia cell lines SKM-1, THP-1,
and K-562. Oncotarget. 8:36517–36530. 2017.
|
|
7
|
Schwab C, Yu S, Wong W, McGeer EG and
McGeer PL: GAD65, GAD67, and GABAT immunostaining in human brain
and apparent GAD65 loss in Alzheimer’s disease. J Alzheimers Dis.
33:1073–1088. 2013. View Article : Google Scholar
|
|
8
|
Besse A, Wu P, Bruni F, Donti T, Graham
BH, Craigen WJ, McFarland R, Moretti P, Lalani S, Scott KL, et al:
The GABA transaminase, ABAT, is essential for mitochondrial
nucleoside metabolism. Cell Metab. 21:417–427. 2015. View Article : Google Scholar
|
|
9
|
Budczies J, Brockmöller SF, Müller BM,
Barupal DK, Richter-Ehrenstein C, Kleine-Tebbe A, Griffin JL,
Orešič M, Dietel M, Denkert C, et al: Comparative metabolomics of
estrogen receptor positive and estrogen receptor negative breast
cancer: Alterations in glutamine and beta-alanine metabolism. J
Proteomics. 94:279–288. 2013. View Article : Google Scholar
|
|
10
|
Jansen MP, Sas L, Sieuwerts AM, Van
Cauwenberghe C, Ramirez-Ardila D, Look M, Ruigrok-Ritstier K,
Finetti P, Bertucci F, Timmermans MM, et al: Decreased expression
of ABAT and STC2 hallmarks ER-positive inflammatory breast cancer
and endocrine therapy resistance in advanced disease. Mol Oncol.
9:1218–1233. 2015. View Article : Google Scholar : PubMed/NCBI
|
|
11
|
Chen P, Wang F, Feng J, Zhou R, Chang Y,
Liu J and Zhao Q: Co-expression network analysis identified six hub
genes in association with metastasis risk and prognosis in
hepatocellular carcinoma. Oncotarget. 8:48948–48958. 2017.
|
|
12
|
Bennett JM: World Health Organization
classification of the acute leukemias and myelodysplastic syndrome.
Int J Hematol. 72:131–133. 2000.
|
|
13
|
Greenberg P, Cox C, LeBeau MM, Fenaux P,
Morel P, Sanz G, Sanz M, Vallespi T, Hamblin T, Oscier D, et al:
International scoring system for evaluating prognosis in
myelodysplastic syndromes. Blood. 89:2079–2088. 1997.
|
|
14
|
Livak KJ and Schmittgen TD: Analysis of
relative gene expression data using real-time quantitative PCR and
the 2(−Delta Delta C(T)) method. Methods. 25:402–408. 2001.
View Article : Google Scholar
|
|
15
|
Besse A, Petersen AK, Hunter JV, Appadurai
V, Lalani SR and Bonnen PE: Personalized medicine approach confirms
a milder case of ABAT deficiency. Mol Brain. 9:932016. View Article : Google Scholar
|
|
16
|
Lin J, Yao DM, Qian J, Wang YL, Han LX,
Jiang YW, Fei X, Cen JN and Chen ZX: Methylation status of fragile
histidine triad (FHIT) gene and its clinical impact on prognosis of
patients with myelodysplastic syndrome. Leuk Res. 32:1541–1545.
2008. View Article : Google Scholar : PubMed/NCBI
|
|
17
|
Iwai M, Kiyoi H, Ozeki K, Kinoshita T, Emi
N, Ohno R and Naoe T: Expression and methylation status of the FHIT
gene in acute myeloid leukemia and myelodysplastic syndrome.
Leukemia. 19:1367–1375. 2005. View Article : Google Scholar
|
|
18
|
Wang H, Wang XQ, Xu XP and Lin GW: ID4
methylation predicts high risk of leukemic transformation in
patients with myelodysplastic syndrome. Leuk Res. 34:598–604. 2010.
View Article : Google Scholar
|
|
19
|
Wu SJ, Yao M, Chou WC, Tang JL, Chen CY,
Ko BS, Huang SY, Tsay W, Chen YC, Shen MC, et al: Clinical
implications of SOCS1 methylation in myelodysplastic syndrome. Br J
Haematol. 135:317–323. 2006. View Article : Google Scholar
|
|
20
|
Zhou JD, Lin J, Zhang TJ, Ma JC, Yang L,
Wen XM, Guo H, Yang J, Deng ZQ and Qian J: GPX3 methylation in bone
marrow predicts adverse prognosis and leukemia transformation in
myelodysplastic syndrome. Cancer Med. 6:267–274. 2017. View Article : Google Scholar
|
|
21
|
Calvo X, Nomdedeu M, Navarro A, Tejero R,
Costa D, Muñoz C, Pereira A, Peña O, Risueño RM, Monzó M, et al:
High levels of global DNA methylation are an independent adverse
prognostic factor in a series of 90 patients with de novo
myelodysplastic syndrome. Leuk Res. 38:874–881. 2014. View Article : Google Scholar
|
|
22
|
Tien HF, Tang JH, Tsay W, Liu MC, Lee FY,
Wang CH, Chen YC and Shen MC: Methylation of the p15(INK4B) gene in
myelodysplastic syndrome: It can be detected early at diagnosis or
during disease progression and is highly associated with leukaemic
transformation. Br J Haematol. 112:148–154. 2001. View Article : Google Scholar
|
|
23
|
Dan C, Chi J and Wang L: Molecular
mechanisms of the progression of myelodysplastic syndrome to
secondary acute myeloid leukaemia and implication for therapy. Ann
Med. 47:209–217. 2015. View Article : Google Scholar : PubMed/NCBI
|
|
24
|
Woods BA and Levine RL: The role of
mutations in epigenetic regulators in myeloid malignancies. Immunol
Rev. 263:22–35. 2015. View Article : Google Scholar
|
|
25
|
Ben-Menachem E: Mechanism of action of
vigabatrin: Correcting misperceptions. Acta Neurol Scand Suppl.
192:5–15. 2011. View Article : Google Scholar
|
|
26
|
Maguire SE, Rhoades S, Chen WF, Sengupta
A, Yue Z, Lim JC, Mitchell CH, Weljie AM and Sehgal A: Independent
effects of gamma-Aminobutyric acid transaminase (GABAT) on
metabolic and sleep homeostasis. J Biol Chem. 290:20407–20416.
2015. View Article : Google Scholar
|
|
27
|
DiNardo CD, Jabbour E, Ravandi F,
Takahashi K, Daver N, Routbort M, Patel KP, Brandt M, Pierce S,
Kantarjian H, et al: IDH1 and IDH2 mutations in myelodysplastic
syndromes and role in disease progression. Leukemia. 30:980–984.
2016. View Article : Google Scholar :
|
|
28
|
Louro P, Ramos L, Robalo C, Cancelinha C,
Dinis A, Veiga R, Pina R, Rebelo O, Pop A, Diogo L, et al:
Phenotyping GABA transaminase deficiency: A case description and
literature review. J Inherit Metab Dis. 39:743–747. 2016.
View Article : Google Scholar
|
|
29
|
Barnby G, Abbott A, Sykes N, Morris A,
Weeks DE, Mott R, Lamb J, Bailey AJ and Monaco AP; International
Molecular Genetics Study of Autism Consortium: Candidate-gene
screening and association analysis at the autism-susceptibility
locus on chromosome 16p: Evidence of association at GRIN2A and
ABAT. Am J Hum Genet. 76:950–966. 2005. View Article : Google Scholar
|
|
30
|
Jirholt J, Asling B, Hammond P, Davidson
G, Knutsson M, Walentinsson A, Jensen JM, Lehmann A, Agreus L and
Lagerström-Fermer M: 4-aminobutyrate aminotransferase (ABAT):
Genetic and pharmacological evidence for an involvement in gastro
esophageal reflux disease. PLoS One. 6:e190952011. View Article : Google Scholar
|
|
31
|
Wegerer M, Adena S, Pfennig A, Czamara D,
Sailer U, Bettecken T, Müller-Myhsok B, Modell S and Ising M:
Variants within the GABA transaminase (ABAT) gene region are
associated with somatosensory evoked EEG potentials in families at
high risk for affective disorders. Psychol Med. 43:1207–1217. 2013.
View Article : Google Scholar
|
|
32
|
Musialik E, Bujko M, Kober P, Grygorowicz
MA, Libura M, Przestrzelska M, Juszczyński P, Borg K, Florek I,
Jakóbczyk M, et al: Comparison of promoter DNA methylation and
expression levels of genes encoding CCAAT/enhancer binding proteins
in AML patients. Leuk Res. 38:850–856. 2014. View Article : Google Scholar
|
|
33
|
Bert SA, Robinson MD, Strbenac D, Statham
AL, Song JZ, Hulf T, Sutherland RL, Coolen MW, Stirzaker C and
Clark SJ: Regional activation of the cancer genome by long-range
epigenetic remodeling. Cancer Cell. 23:9–22. 2013. View Article : Google Scholar
|
|
34
|
Lee SM, Choi WY, Lee J and Kim YJ: The
regulatory mechanisms of intragenic DNA methylation. Epigenomics.
7:527–531. 2015. View Article : Google Scholar : PubMed/NCBI
|
|
35
|
Bergman Y and Cedar H: DNA methylation
dynamics in health and disease. Nat Struct Mol Biol. 20:274–281.
2013. View Article : Google Scholar
|
|
36
|
Ouzounoglou E, Dionysiou D and Stamatakos
GS: Differentiation resistance through altered retinoblastoma
protein function in acute lymphoblastic leukemia: In silico
modeling of the deregulations in the G1/S restriction point
pathway. BMC Syst Biol. 10:232016. View Article : Google Scholar
|
|
37
|
Besson A, Dowdy SF and Roberts JM: CDK
inhibitors: Cell cycle regulators and beyond. Dev Cell. 14:159–169.
2008. View Article : Google Scholar
|
|
38
|
Bonelli P, Tuccillo FM, Borrelli A,
Schiattarella A and Buonaguro FM: CDK/CCN and CDKI alterations for
cancer prognosis and therapeutic predictivity. BioMed Res Int.
2014.361020:2014.
|
|
39
|
Davies C, Hogarth LA, Dietrich PA,
Bachmann PS, Mackenzie KL, Hall AG and Lock RB: p53-independent
epigenetic repression of the p21(WAF1) gene in T-cell acute
lymphoblastic leukemia. J Biol Chem. 286:37639–37650. 2011.
View Article : Google Scholar :
|