Introduction
Prostate cancer, the most common neoplastic disease,
is the second leading cause of cancer mortality in males. Although
prostate cancers at early stages are able to be cured with surgery
or radiation, other treatment options are necessary due to the high
recurrence rates of this cancer (1). There are limited treatment options
available for this disease. Chemotherapy and radiation therapy are
largely ineffective and metastatic disease invariably recurs even
following potentially curative surgery (2,3).
Therefore, the development of novel anti-prostate cancer agents is
required.
A novel derivative of gossypol, apogossypolone
(ApoG2), has been synthesized. Compared with gossypol, ApoG2 has a
higher binding affinity for anti-apoptotic Bcl-2 family proteins
myeloid cell leukemia 1 and B-cell lymphoma 2 (Bcl-2) (4). Previous studies have demonstrated
that ApoG2 induced significant growth inhibition in vitro
and in vivo, including in a follicular small cleaved cell
lymphoma model (4), lymphoma U937
cells (5), nasopharyngeal
carcinoma xenografts (6) and
hepatocellular carcinoma (7).
It is reported that in androgen-independent prostate
cancer, members of the Bcl-2 family proteins are overexpressed
(8). Whether ApoG2 has anti-tumor
activity against androgen-independent prostate cancer remains to be
elucidated. Apart from inducing apoptosis of tumor cells, whether
ApoG2 is able to induce tumor cell death through other mechanisms
is unclear. The aim of the present study was to evaluate whether
ApoG2 is able to induce apoptosis and autophagy in the prostate
cancer cell line LNCaP and whether it possesses anti-tumor activity
in LNCaP cells in an animal model. In addition, the associated
molecules involved in ApoG2-induced cell death were assessed. It
was hypothesized that ApoG2 inhibits cell growth and induces
autophagic cell death in vitro, and effectively inhibits
LNCaP xenograft growth in nude mice in vivo.
Materials and methods
Materials
ApoG2, obtained from Xi’an Jiaotong University
(Xi’an, China), was prepared at a stock concentration of 0.20
mmol/l in dimethyl sulfoxide (DMSO). RPMI-1640 medium, L-glutamine,
trypsin-ethylenediaminetetraacetic acid, penicillin/streptomycin
and fetal bovine serum (FBS) were obtained from HyClone
Laboratories (Logan, UT, USA). The reagents used for the terminal
deoxynucleotidyl transferase dUTP nick end labeling (TUNEL) assay
were purchased from Boehringer Mannheim (Mannheim, Germany).
Acridine orange was purchased from Molecular Probes (Eugene, OR,
USA). Rabbit anti-LC-3B and rabbit anti-beclin-1 were purchased
from Abcam (Cambridge, UK). MTT, 3-methyladenine (3-MA), annexin
V-fluorescein isothiocyanate (FITC), propidium iodide (PI), Hoechst
33342, formaldehyde, HEPES, sodium pyruvate, glucose and DMSO were
obtained from Sigma (St. Louis, MO, USA). All other reagents are
commercially available and were of analytical grade.
Cell culture and treatment
LNCaP cells, an androgen-independent human prostate
carcinoma cell line, were obtained from the American Type Culture
Collection (ATCC, Manassas, VA, USA) and cultured in RPMI-1640
supplemented with 10% FBS, 10 mmol/l HEPES, 1 mmol/l sodium
pyruvate, 0.2% glucose and antibiotics. The cells were maintained
at 37°C in an atmosphere of 95% air and 5% CO2.
For ApoG2 treatment, final concentrations of 0.01,
0.02 and 0.04 mmol/l were added and incubated for the indicated
time periods. For 3-MA treatment, a final concentration of 10
mmol/l was added and incubated for the indicated time periods. For
the control group, an equal volume of DMSO was added.
MTT assay
LNCaP cell viability was assessed using an MTT assay
as described by Romijn et al (9). Briefly, LNCaP cells were collected
and resuspended in RPMI-1640 with 10% FBS and seeded into 96-well
plates at a density of 5×10⁵ cells/well. Following
incubation for 24 h to achieve attachment, 3-MA (10 mmol/l) and
serial diluted ApoG2 (0.01, 0.02 and 0.04 mmol/l) were added.
Following culturing the cells at 37°C for 24, 48, 72 and 96 h, the
cells were incubated with MTT for 4 h. The plates were processed
and the absorbance value was measured. Eight duplicate wells were
used. The percentage of surviving cells was defined as follows:
(mean absorbance of treated wells / mean absorbance of untreated
wells) × 100%.
Ultrastructural observation of LNCaP
cells
The experiment was performed as described previously
in PC-3 cells (10). Briefly,
LNCaP cells (2×10⁵) were plated in six-well plates and
incubated overnight to allow for attachment. The cells were then
treated with DMSO or 0.01, 0.02 and 0.04 mmol/l ApoG2 for 24, 48,
72 or 96 h at 37°C. The cells were collected, washed twice with
phosphate-buffered saline (PBS) and fixed with 2.5% ice-cold
electron microscopy grade glutaraldehyde in 0.1 mol/l PBS (pH 7.3).
The specimens were then rinsed with PBS and post fixed in 1% (w/v)
osmium tetroxide. Following this, the specimens were dehydrated
through a graded series of ethanol (30–90%) and embedded in Epon
812 resin. Using a LKB NOVA ultra-microtome (LKB, Bromma, Sweden),
ultra-thin (100 nm) sections were cut and then stained with 2%
(w/v) uranyl acetate and lead citrate. The sections were then
examined using a JEM-2000EX transmission electron microscope (JEOL,
Tokyo, Japan).
Autophagy detection using acridine orange
staining
Acridine orange staining was used to visualize the
volume of the cellular acidic compartment (11). Briefly, cells were seeded in
96-well flat-bottom microtiter plates and treated as described
above for the cell viability assay. At the appropriate time points
following ApoG2 treatment, the cells were incubated with culture
medium containing 1 mg/ml acridine orange for 15 min. The acridine
orange was removed and fluorescent micrographs were captured using
a DM-IRB inverted fluorescent microscope (Leica, Wetzlar, Germany).
For each experiment condition, autophagy was quantified based on
the mean number of cells exhibiting intense red staining in three
fields (containing at least 50 cells per field).
Autophagy analysis by flow cytometry
The percentage of autophagic cell death was analyzed
using flow cytometry as previously described (11). Briefly, the cells were treated with
DMSO (control) or 0.01, 0.02 and 0.04 mmol/l ApoG2 for 48 h at
37°C. The cells were then stained with acridine orange for 20 min.
The adhering cells and the suspending cells in the medium were
collected in phenol red-free RPMI-1640 medium. The fluorescence
emission of green and red was measured using a flow cytometer
(FACSAri; Becton Dickinson, Mountain View, CA, USA) using CellQuest
software (BD Biosciences San Jose, CA, USA). The percentage of
autophagy was calculated by adding the values from the upper-left
and upper-right quadrants. 3-MA was added to detect its effect on
ApoG2-induced cell death. The cells were treated with 10 mmol/l
3-MA and 0.02 mmol/l ApoG2 for 48 h and the percentage of
autophagic cell death was analyzed as described above.
Apoptosis analysis by flow cytometry
Apoptosis was analyzed by annexin V/propidium iodide
(PI) staining according to a previous study (10). In brief, LNCaP cells were treated
with DMSO or 0.01, 0.02 and 0.04 mmol/l ApoG2 for 24, 48, 72 and 96
h at 37°C. The cells were trypsinized and washed in cold PBS.
Subsequently, the cells were stained with FITC-labeled annexin V
and PI for 15 min and were then analyzed by flow cytometry. The
percentage of apoptosis was calculated by the addition of primary
apoptosis (annexin V+/PI−) and late apoptosis (annexin V+/PI+).
Apoptosis analysis using the TUNEL
assay
The TUNEL assay was performed according to the
manufacturer’s instructions. Briefly, following treatment with 0.02
mmol/l ApoG2 and 10 mmol/l 3-MA, the cells were fixed. The cells
were then washed, stained and images were captured using the
Olympus FV1000 laser scanning confocal microscope (Olympus, Tokyo,
Japan). Treatment with DNaseI prior to TUNEL staining was used as a
positive control. For quantitative analysis, the percentage of
TUNEL-positive cells among 200 cancer cells in three visual fields
per section was determined (magnification, ×200).
Cell cycle analysis by flow
cytometry
The cells were processed for cell cycle analysis 48
h after ApoG2 treatment. Briefly, cells (1×10⁶/ml) were
fixed in chilled methanol overnight prior to staining with 50 mg/ml
PI, 1 mg/ml RNase and 0.1% NP40. Analysis was performed immediately
following staining using a FACSAri flow cytometer (Becton
Dickinson). All experiments were independently performed at least
three times.
Immunofluorescence
LNCaP cells (1×10⁵) were grown on cover
slips and incubated overnight to allow for attachment. Then, cells
were treated with ApoG2 for the desired time period at 37°C, washed
with PBS and fixed at 4°C overnight using 4% paraformaldehyde.
Subsequently, the cells were washed with PBS and blocked with PBS
containing 0.5% bovine serum albumin (BSA) and 0.15% glycine (BSA
buffer) for 1 h at room temperature. Finally, the cells were
labeled with primary antibodies (rabbit anti-human anti-LC-3B
monoclonal antibody and rabbit anti-human anti-beclin-1 monoclonal
antibody; Abcam) and secondary antibodies (FITC-conjugated goat
anti-rabbit polyclonal antibody; Abcam) for 1 h at room
temperature, respectively. In negative controls, the primary
antibodies were omitted. For fluorescence observation, the slides
were examined under an Olympus fluorescence microscope.
Analysis of cysteine aspartate protease
(caspase)-3 and caspase-8 activity
Caspase-3 and caspase-8 activities were detected
according to the manufacturer’s instructions of the caspase
colorimetric assay kit (Sigma). Briefly, cells (108
cell/ml) were collected and resuspended in ice-cold buffer.
Following lysis, cell lysates were centrifuged at 12,000 × g for 10
min and the extracts containing 50 μg of protein were incubated
with 100 μl of Ac-DEVD-pNA substrate at 37°C for 2 h. The
colorimetric release of p-nitroaniline from the Ac-DEVD-pNA
substrate was measured at 405 nm.
Semi-quantitative reverse
transcription-polymerase chain reaction (RT-PCR)
The cells were collected and TRIzol extraction of
total RNA was performed 48 h after ApoG2 treatment according to the
manufacturer’s instructions (Qiagen GmbH, Hilden, Germany).
Semi-quantitative RT-PCR was performed using the RNA PCR kit. The
following PCR procedures were used: pre-denaturation at 94°C for 3
min, 30 cycles of 95°C 30 sec, 57°C 30 sec, 72°C 1 min and a final
extension at 72°C for 1 min. The primer pairs used are shown in
Table I. GAPDH was used as an
internal control. The PCR products and DNA marker were run on
ethidium bromide-stained 1.5% agarose gels in tris-borate-EDTA.
Images were acquired and quantification of the bands was performed
by image analysis software for Gel Electrophoresis samples. Band
intensity was expressed as relative absorbance units. Following
normalization to GAPDH, the mean value and the standard deviation
were calculated.
 | Table IPrimers used in the present
study. |
Table I
Primers used in the present
study.
| Gene | Primer | Primer
sequence |
|---|
| Bcl-2 | Bcl-2F |
5′-gagttcgccgagatgtccag-3′ |
| Bcl-2R |
5′-tcacttgtggctcagatagg-3′ |
| Bak | BakF |
5′-acgctatgactcagagttcc-3′ |
| BakR |
5′-cttcgtaccacaaactggcc-3′ |
| GAPDH | GAPDH_F |
5′-acatcgctcagacaccatgg-3′ |
| GAPDH_R |
5′-gtagttgaggtcaatgaaggg-3′ |
Western blotting
The cells were lysed for western blot analysis 48 h
after ApoG2 treatment. Cell lysates were resolved by 10% sodium
dodecyl sulfate polyacrylamide gel electrophoresis and
electrotransferred onto nitrocellulose membranes. Membranes were
blocked with 5% dry milk in PBS-Tween for 1 h at room temperature
and then incubated with the primary antibodies overnight at 4°C.
Primary antibodies included mouse anti-human anti-Bcl-2 (1:1,000)
and mouse anti-human anti-Bak monoclonal antibodies (1:500; Abcam).
Additionally, β-actin was used as an internal control. Following
incubation with primary antibodies, the membranes were washed and
incubated with horseradish peroxidase-labeled secondary antibodies
for 1 h at room temperature. The membranes were subsequently
incubated with the ECL for 1 min and autoradiographed using X-ray
film.
Animals and experimental design
Male BALB/c nude mice (4 weeks old, weighing 18–22
g) were purchased from the Laboratory Animal Center of the Fourth
Military Medical University (Xi’an, Shaanxi, China). They were kept
in standard conditions. A total of 40 mice were injected with
1.0×10⁷ LNCaP cells subcutaneously on the two sides of
the lower back above the tail. Palpable tumors (volume 200
mm3) were formed following 7 days and the mice were
randomly divided into four groups, including the negative control
group and the 2.5, 5.0 and 10.0 mg/kg ApoG2 treatment groups. The
negative control group received 0.9% normal saline containing 1%
DMSO. All of these drugs were injected intraperitoneally daily up
to 30 days. The tumor size was measured once every 2 days in two
perpendiculars and tumor volume (TV) was calculated using the
following formula: (ab2) / 2, where a and b refer to the
longer and shorter dimension, respectively (12). A technician from the Laboratory
Animal Center of the Fourth Military Medical University measured
the tumor sizes and animal body weights daily without knowledge of
the treatment. All animal experiments were performed according to
the protocol approved by the Fourth Military Medical University
Guidelines for the Use and Care of Animals. Tumor growth inhibition
(T/C%) values for these in vivo studies were calculated as
described previously (13). If the
mouse died, the transplanting tumor and its liver, kidney, heart
and intestines were removed for histological analysis. The tissues
were fixed overnight in 4% paraformaldehyde in PBS and embedded in
paraffin. Sections (5 μm) were deparaffinized, rehydrated and
stained with hematoxylin and eosin (H&E). The tumor growth
inhibition rate was calculated using the following formula:
inhibition rate (%) = (mean tumor weight of negative control group
- mean tumor weight of treatment group) / mean tumor weight of the
negative control group.
Immunohistochemistry
The expression levels of Bcl-2, CD31, caspase-3,
caspase-8, LC-3B and Beclin-1 in tumor tissues were detected by
immunohistochemistry. Briefly, tumor tissues were embedded in
paraffin. Sections (5 μm) were deparaffinized, rehydrated and
blocked for 1 h at room temperature. Following labeling with
primary and secondary antibodies, slides were mounted and examined
under an Olympus fluorescence microscope. In negative controls, the
primary antibodies were omitted. The fluorescence intensity of each
protein was semi-quantitatively analyzed using ImagePro Plus 6.0
software (Media Cybernetics, Silver Spring, MD, USA). Five visual
fields in each section were selected for the determination of the
integrated fluorescence intensity and area. The expression level
was represented by the integrated fluorescence intensity per unit
area.
Microvessel density (MVD) assessment
Using a two-headed microscope, immunohistochemical
reactions for CD31 antigen were independently interpreted by two
authors. Within the tumor, the two most vascularized areas (‘hot
spots’) were selected (magnification, ×10) and the vessels were
counted in a representative high magnification (x200) field in each
of these two areas. Next, the high-magnification fields were marked
for subsequent image cytometric analysis. Single immunoreactive
endothelial cells or endothelial cell clusters that were separate
from other microvessels were counted as individual microvessels.
Mean visible microvessel density for CD31 was calculated as the
average of five counts.
Statistical analysis
SPSS version 11.0 (SPSS, Inc., Chicago, IL, USA) for
Windows was used for all statistical analyses. All data are
presented as the mean ± standard deviation. Analysis of variance
followed by the Tukey test or Dunnett’s test were used to analyze
the significance of any difference among groups. P<0.05 was
considered to indicate a statistically significant difference.
Results
ApoG2 inhibits the growth of LNCaP
cells
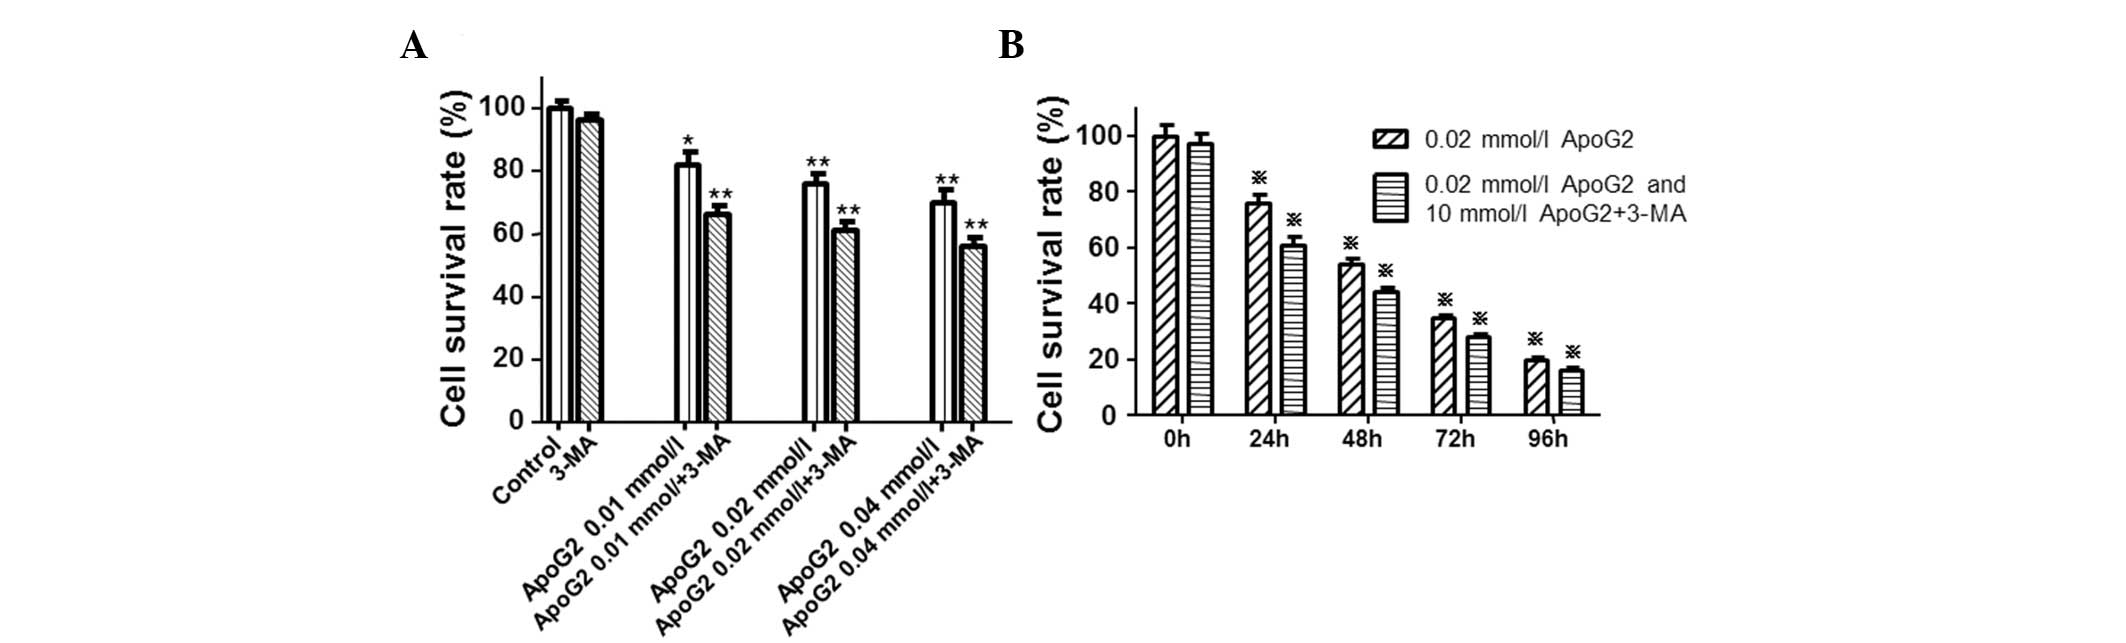
To determine the effect of ApoG2 on cell viability
in LNCaP cells, the cells were initially treated with ApoG2 (0.01,
0.02 and 0.04 mmol/l) and cell viability was measured using the MTT
assay. Compared with the control cells (Fig. 1A), cell viability in cells treated
with ApoG2 was significantly lower (*P<0.05
and **P<0.01). In addition, ApoG2 inhibited the
growth of LNCaP cells in a dose-dependent manner. However, when
cells were treated with ApoG2 and 3-MA, cell viability was
significantly decreased (Fig. 1A).
Notably, ApoG2 also inhibited the growth of LNCaP cells in a
time-dependent manner (Fig. 1B).
The inhibition pattern of ApoG2 was similar to that in Fig. 1A. Furthermore, 3-MA aggravated the
inhibitory effect of ApoG2. Following treatment for 72 h with
ApoG2, the IC50 was 0.009 mmol/l (Fig. 1). IC50 values were
calculated using the CelTox software available from Aniara
Corporation (Mason, OH, USA). These results indicated that ApoG2
inhibited the growth of LNCaP cells in a time- and dose-dependent
manner.
Characteristic autophagic alterations at
the ultrastructural level induced by ApoG2
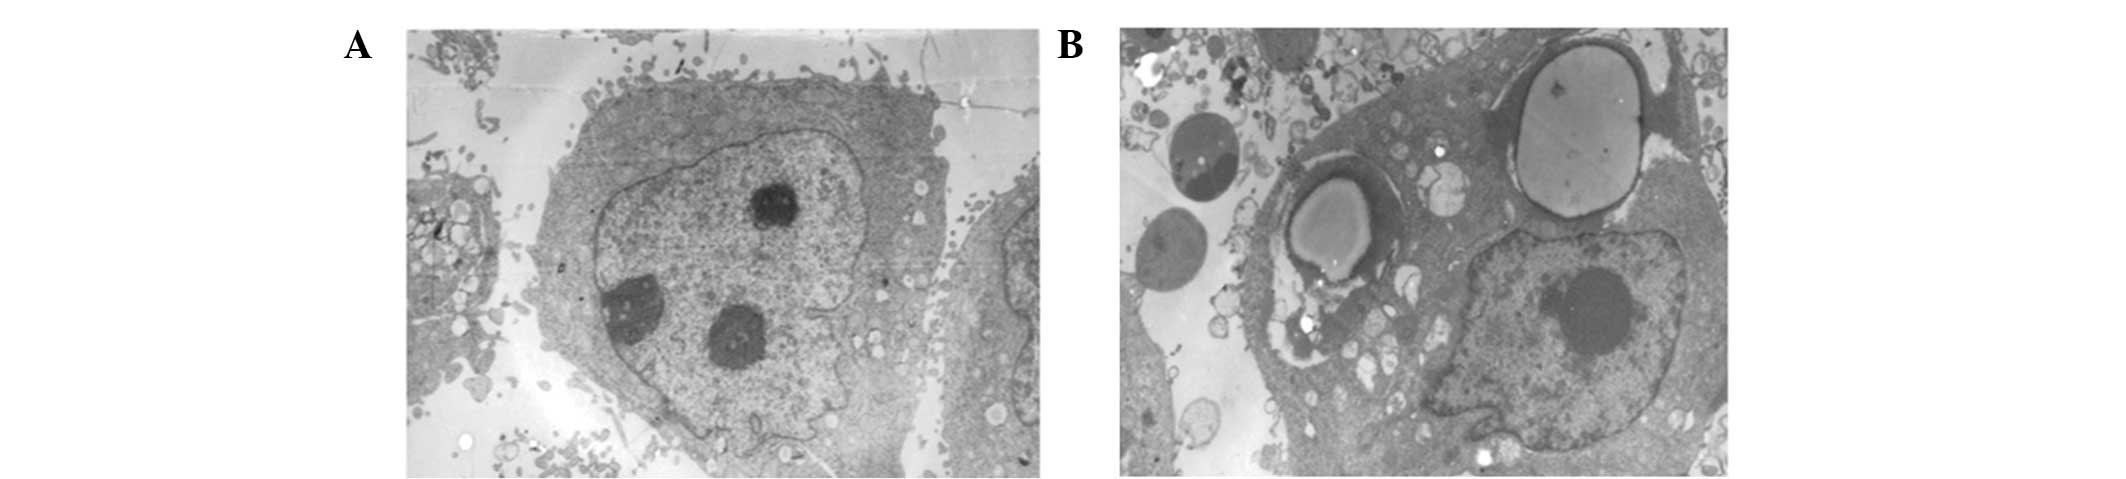
To determine whether ApoG2 was able to induce
autophagy, the ultrastructural alterations of LNCaP cells were
observed under a JEM-2000EX transmission electron microscope (JEOL
Ltd., Tokyo, Japan). In untreated cells, no autophagic vacuoles
were observed and clear microvilli were observed on LNCaP cell
surfaces, with euchromatin-dominant nuclei and clear nucleoli
(Fig. 2A). However, following
treatment with ApoG2, characteristic autophagic morphological
alterations were observed. Surface microvilli were decreased,
numerous autophagic vacuoles were observed and the vacuoles were
packed with membrane structures and cell debris (Fig. 2B). This result suggested that ApoG2
was able to induce autophagy in LNCaP cells.
ApoG2 induces apoptosis and cell cycle
arrest in LNCaP cells
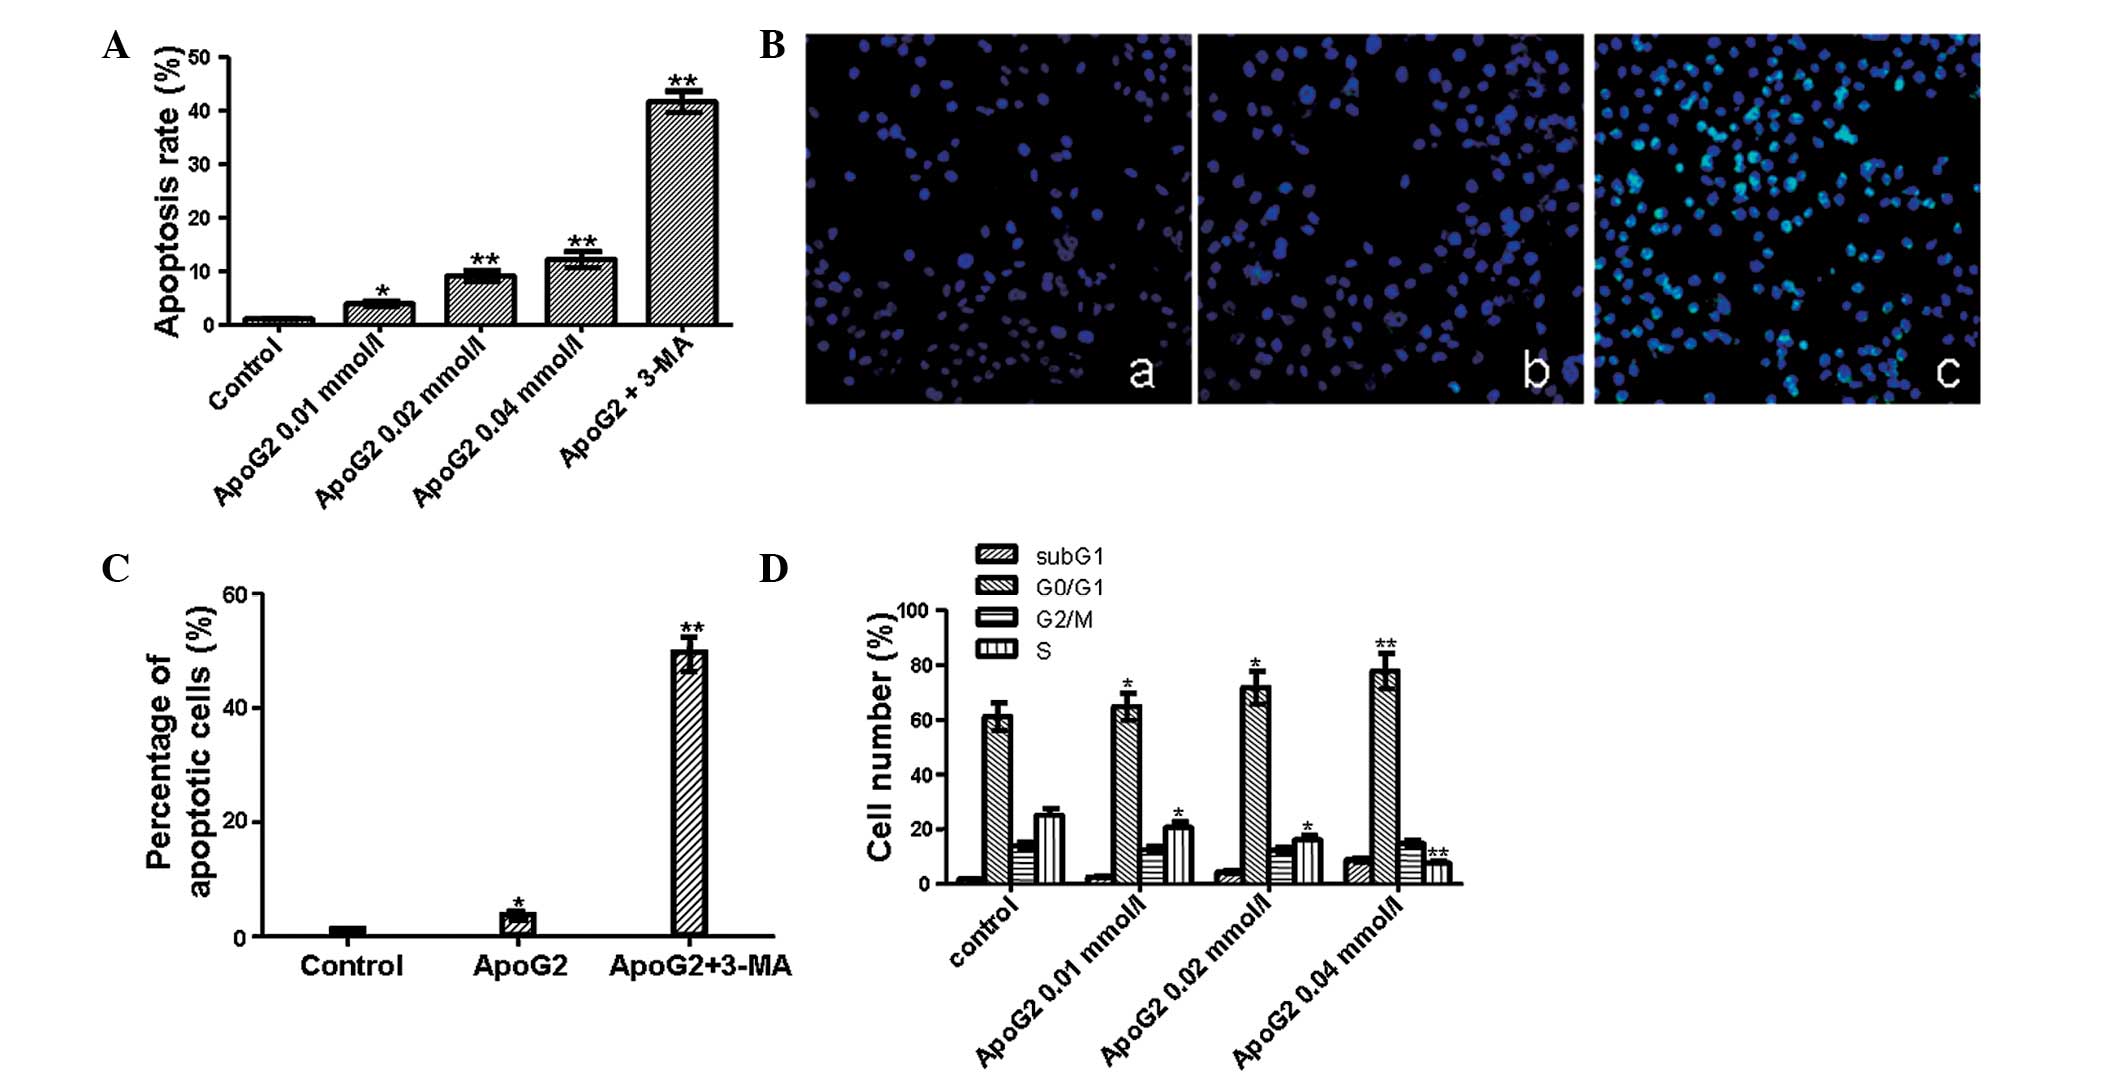
To investigate the effect of ApoG2 on apoptosis,
flow cytometry and a TUNEL assay were performed. Flow cytometric
results (Fig. 3A) demonstrated
that the apoptotic rate was 2.8, 8 and 11.1% at 0.01, 0.02 and 0.04
mmol/l of ApoG2 treatment and that the apoptotic rate was 40.6%
when cells were treated with ApoG2 and 3-MA. The increase in the
apoptotic rate was significant (*P<0.05 and
**P<0.01). These data suggested that ApoG2 was able
to induce apoptosis in a dose-dependent manner and inhibition of
autophagy was able to increase the apoptosis of LNCaP cells. This
result was further verified using a TUNEL assay. TUNEL-positive
nuclei in ApoG2-treated LNCaP cells (Fig. 3B) was similar to that in the
control, whereas TUNEL-positive nuclei in cells treated with ApoG2
and 3-MA were significantly increased (*P<0.05 and
**P<0.01). Quantitative results are shown in Fig. 3C. In the control cells, the
apoptotic rate (1.2±0.1%) was lower than that in cells treated with
ApoG2 (3.2±0.3%). However, the difference between the two groups
was not significant (P>0.05). When cells were treated with ApoG2
and 3-MA, the percentage of apoptotic cells induced by ApoG2
increased up to 45.6±1.4%. Compared with the ApoG2 only group, the
apoptotic rate induced by 3-MA and ApoG2 was significantly
increased (P<0.01).
Next, the effect of ApoG2 on the cell cycle
distribution of LNCaP cells was analyzed. As shown in Fig. 3D, a clear subG1 peak was
identified, suggesting that the percentage of apoptotic cells
induced by ApoG2 was increased with the increase in ApoG2
concentration. The number of cells in the G1 phase was also
increased following treatment with ApoG2. The percentage of cells
in the G1 phase was 60% in the control, whereas it was increased to
65–80% following treatment with ApoG2. In addition, along with the
increasing concentration of ApoG2, the percentage of cells in the S
phase decreased. Furthermore, a significant decrease in cells in
the S phase was noted following treatment with 0.02 mmol/l ApoG2.
ApoG2 resulted in a dose-dependent cell cycle arrest in the G0/G1
phase.
Expression of Bcl-2 and Bak at the mRNA
and protein level
RT-PCR was performed to investigate the effect of
ApoG2 on Bak and Bcl-2 mRNA expression (data not shown). The mRNA
expression level of Bcl-2 (Bcl-2/GAPDH value 0.429) in
ApoG2-treated LNCaP cells was lower than that in the control cells
(Bcl-2/GAPDH value 0.6267). By contrast, the mRNA expression level
of Bak (Bak/GAPDH value 0.4743) was higher in ApoG2-treated LNCaP
cells than in the control cells (Bak/GAPDH value 0.2667). The
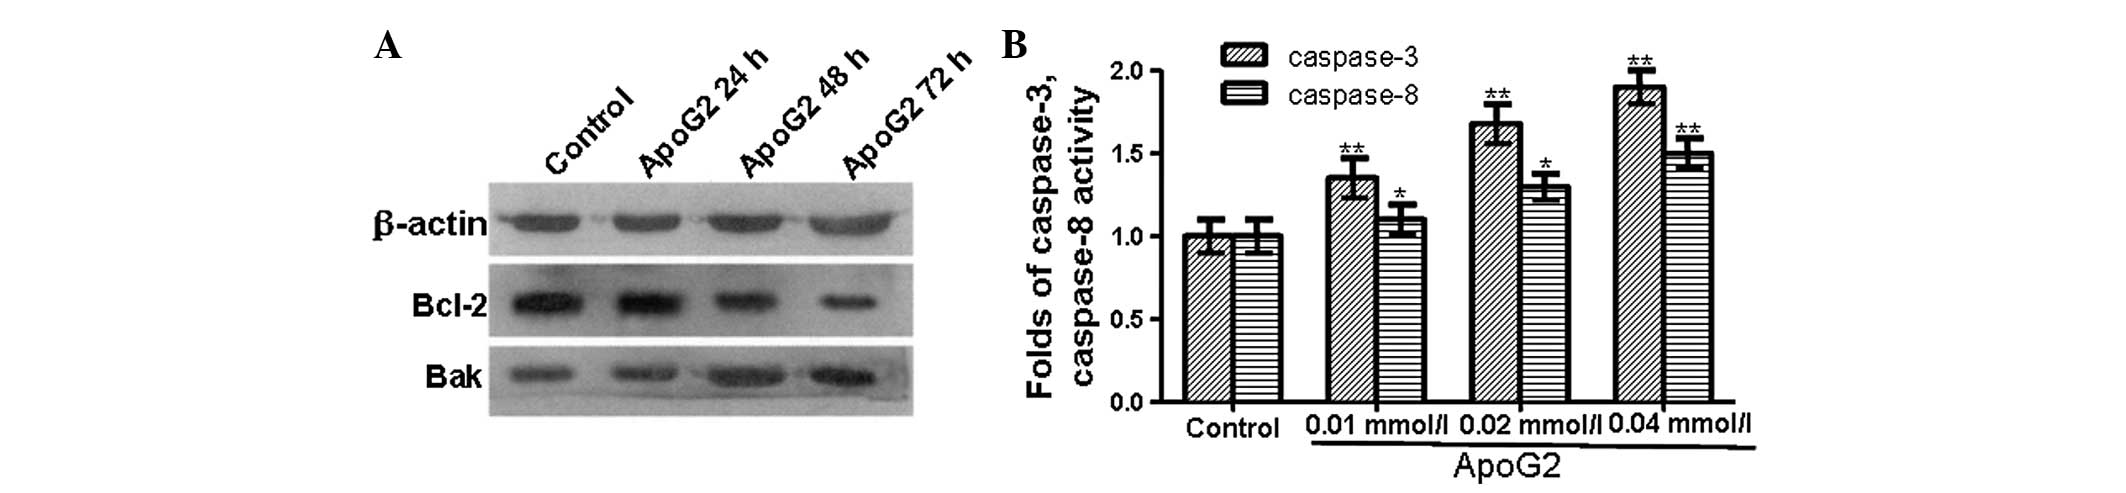
expression levels of Bak and Bcl-2 at the protein level were
detected by western blot analysis (Fig. 4A). At 24 h after ApoG2 treatment,
the expression level of the Bcl-2 protein in ApoG2-treated LNCaP
cells was similar to that in the control cells. However, 48 and 72
h after ApoG2 treatment, the expression level of Bcl-2 protein in
ApoG2-treated cells was lower than that in the control cells.
Similarly, 24 h after ApoG2 treatment, the expression level of the
Bak protein in ApoG2-treated LNCaP cells was similar to that in the
control cells. While at 48 and 72 h after ApoG2 treatment, the
expression level of the Bak protein in ApoG2-treated LNCaP cells
was higher than that in the control cells. These data demonstrated
that the expression level of the anti-apoptotic protein Bcl-2 was
decreased while the expression level of pro-apoptotic protein Bak
was increased.
Caspase-3 and caspase-8 are activated in
ApoG2-treated cells
Caspases, a family of cysteine proteases, have a
central role in the execution of apoptosis. To examine whether
ApoG2 induces apoptosis through the activation of caspases, a
colorimetric substrate Ac-DEVD-pNA for caspases was used to detect
caspase activity. As shown in Fig.
4B, the activity of caspase-3 and caspase-8 in LNCaP cells
treated with ApoG2 was significantly higher than that in the
control cells. This suggested that ApoG2 induced apoptosis by
triggering the activation of caspase cascades.
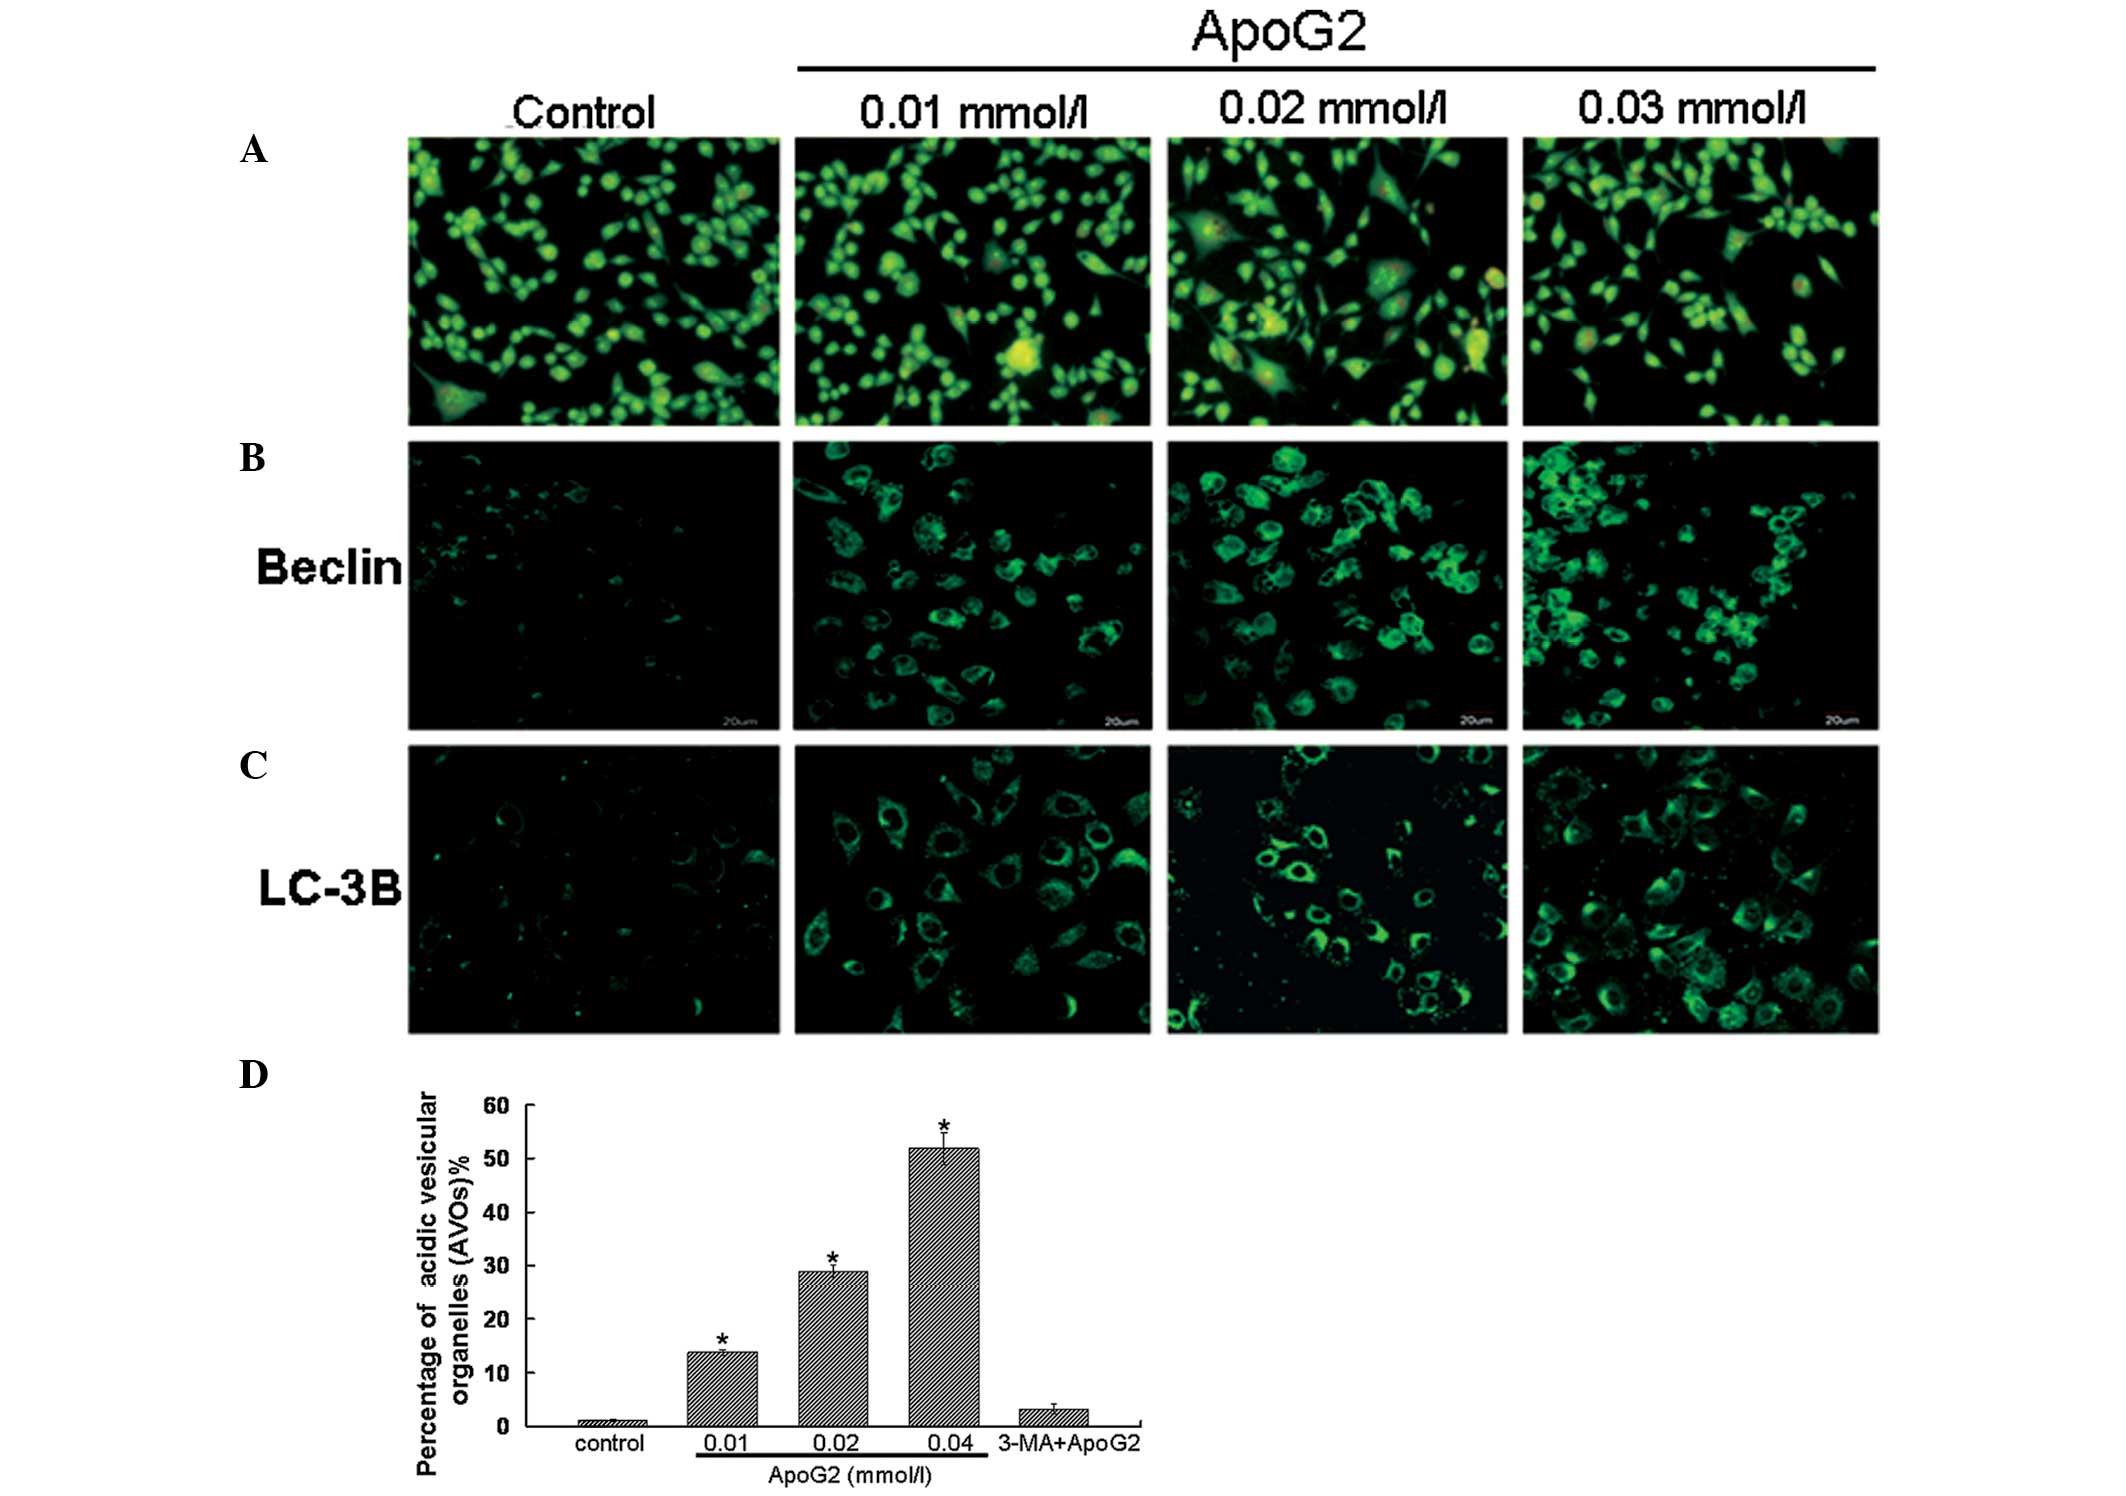
ApoG2 induces the formation of acidic
vesicular organelles (AVOs) in LNCaP cells
Formation of AVOs is another characteristic feature
of cells engaged in autophagy (2,11).
Therefore, the effect of ApoG2 treatment on the formation of AVOs
in LNCaP cells following acridine orange staining was assessed
(Fig. 5A). Acridine orange is a
weak base that has the ability to move freely across biological
membranes in an uncharged state and is characterized by green
fluorescence. Acridine orange, in its protonated form, accumulates
in acidic compartments and forms aggregates, which are
characterized by red fluorescence. As shown in Fig. 5A, control LNCaP cells primarily
exhibited green fluorescence, indicating a lack of AVOs. By
contrast, treatment of LNCaP cells with ApoG2 induced the formation
of red fluorescent AVOs. In addition, compared with the 0.01 mmol/l
ApoG2 treatment group, the red fluorescent AVOs were more marked at
0.02 and 0.04 mmol/l of ApoG2 treatment. These results were
consistent with the flow cytometric results and provided further
evidence to indicate that ApoG2 treatment caused autophagy in LNCaP
cells.
ApoG2 induces the expression of Beclin-1
and LC-3B protein in LNCaP cells
LC-3B reflects autophagic activity and detecting
LC-3B by immunofluorescence has become a reliable method for
monitoring autophagy. Beclin-1 is important in autophagy and is
involved in the formation of autophagosomes. The immunofluorescence
results demonstrated that in the control cells, no clear Beclin-1
and LC-3B expression was observed. However, in LNCaP cells treated
with ApoG2, Beclin-1 (Fig. 5B) and
LC-3B (Fig. 5C) expression
exhibited a punctate pattern. These results indicated the presence
of autolysosomes or autophagolysosomes in LNCaP cells following
treatment with ApoG2 (14).
Autophagy detection with acridine orange
staining and flow cytometry
The fluorescence of the cytoplasm and nucleolus was
bright green and dim red in acridine orange-stained cells, whereas
the acidic compartments were characterized by bright red
fluorescence (15). Thus, the
intensity of the red fluorescence was proportional to the degree of
acidity. Therefore, the volume of the cellular acidic compartment
was able to be quantified (16).
To further quantify the formation of AVOs in LNCaP cells,
acridine-stained cells were analyzed by flow cytometry.
Quantitative results are shown in Fig.
5D. The percentage of AVOs in 0.01, 0.02 and 0.04 mmol/l ApoG2
treatment groups was 13.7, 28.9 and 51.8%, respectively. When the
cells were treated with 3-MA and ApoG2, the ratio of AVOs in LNCaP
cells decreased to 3.2%. This result further confirmed that ApoG2
treatment was able to induce autophagy in LNCaP cells.
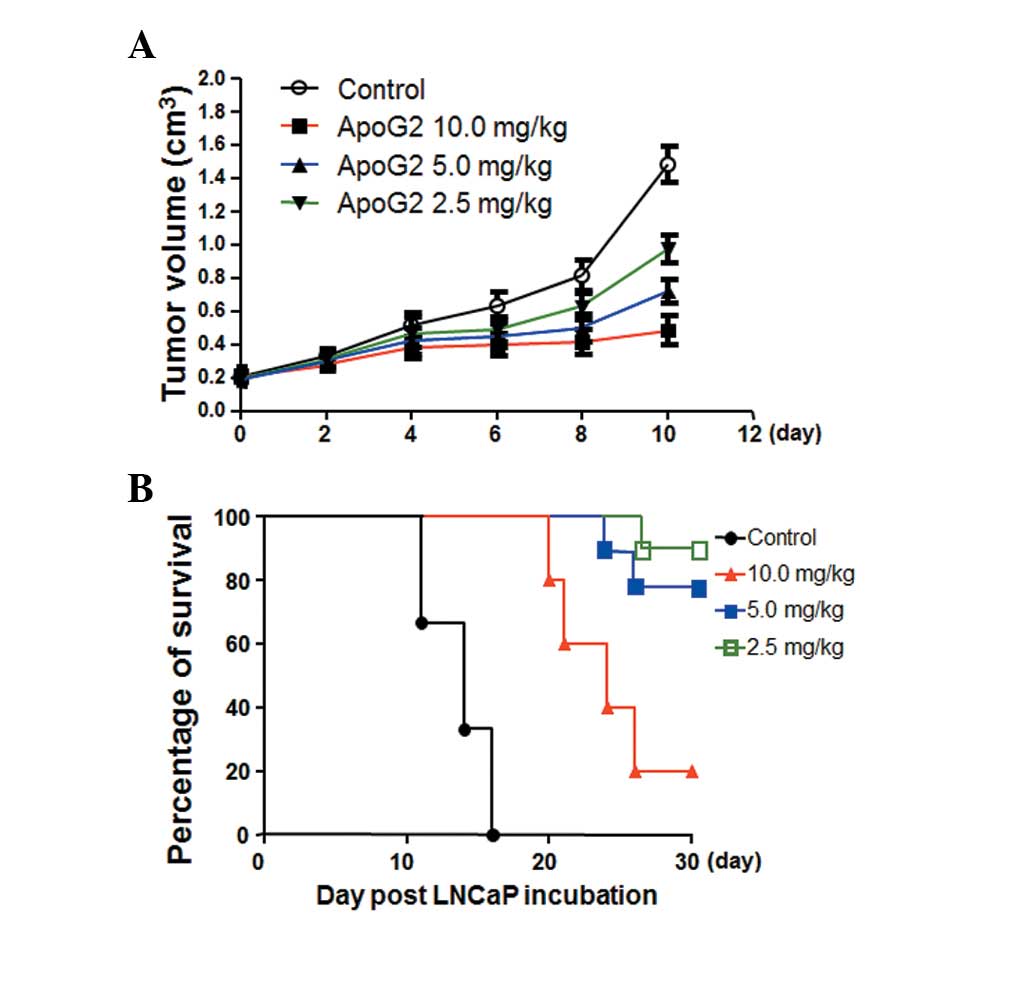
Effects of ApoG2 on tumor growth and
animal survival rate
Tumor volumes were recorded every 2 days until day
10. On day 4, tumor volumes in the 5.0 and 10.0 mg/kg ApoG2
treatment groups were significantly decreased. On day 10, there was
a 6.5-fold increase in tumor volumes in the control group. However,
the elevation in tumor volumes in the ApoG2 treatment groups was
2.5-fold (10.0 mg/kg), 3.7-fold (5.0 mg/kg) and 4.8-fold (2.5
mg/kg), respectively (Fig.
6A).
The tumor growth inhibition (T/C%) ratio was
calculated as previously described (13) and is summarized in Table II. According to the National
Cancer Institute (NCI) criteria, a reagent with a T/C% <42% is
considered to have significant anti-tumor activity. A reagent with
a T/C% <10% is considered to have highly significant anti-tumor
activity and this is also the criteria used by the NCI to justify a
clinical trial (12). The T/C% in
the 10 mg/kg ApoG2 treatment group was 21.3%, indicating that ApoG2
possesses significant anti-tumor activity.
| Table IIComparison of tumor growth inhibition
(T/C%) versus initial tumor sizes in the in vivo
experiments. |
Table II
Comparison of tumor growth inhibition
(T/C%) versus initial tumor sizes in the in vivo
experiments.
| Group | Initial tumor size
(cm3) | T/C% |
|---|
| Control | 0.220 | 100.0 |
| ApoG2 2.5
mg/kg | 0.231 | 82.1 |
| ApoG2 5.0
mg/kg | 0.225 | 67.9 |
| ApoG2 10.0
mg/kg | 0.228 | 21.3 |
All the nude mice with xenografts died after 16
days. As shown in Fig. 6B, the
survival rate of the 10.0 mg/kg group was 20% on day 21. The
survival rate of the 5.0 mg/kg group was 80% on day 26 and the
survival rate of the 2.5 mg/kg group was 20% at the end of the
experiment. The Log-rank inspection analysis demonstrated a
significant difference between the survival rates of the animals at
different doses of ApoG2 when compared with the control group.
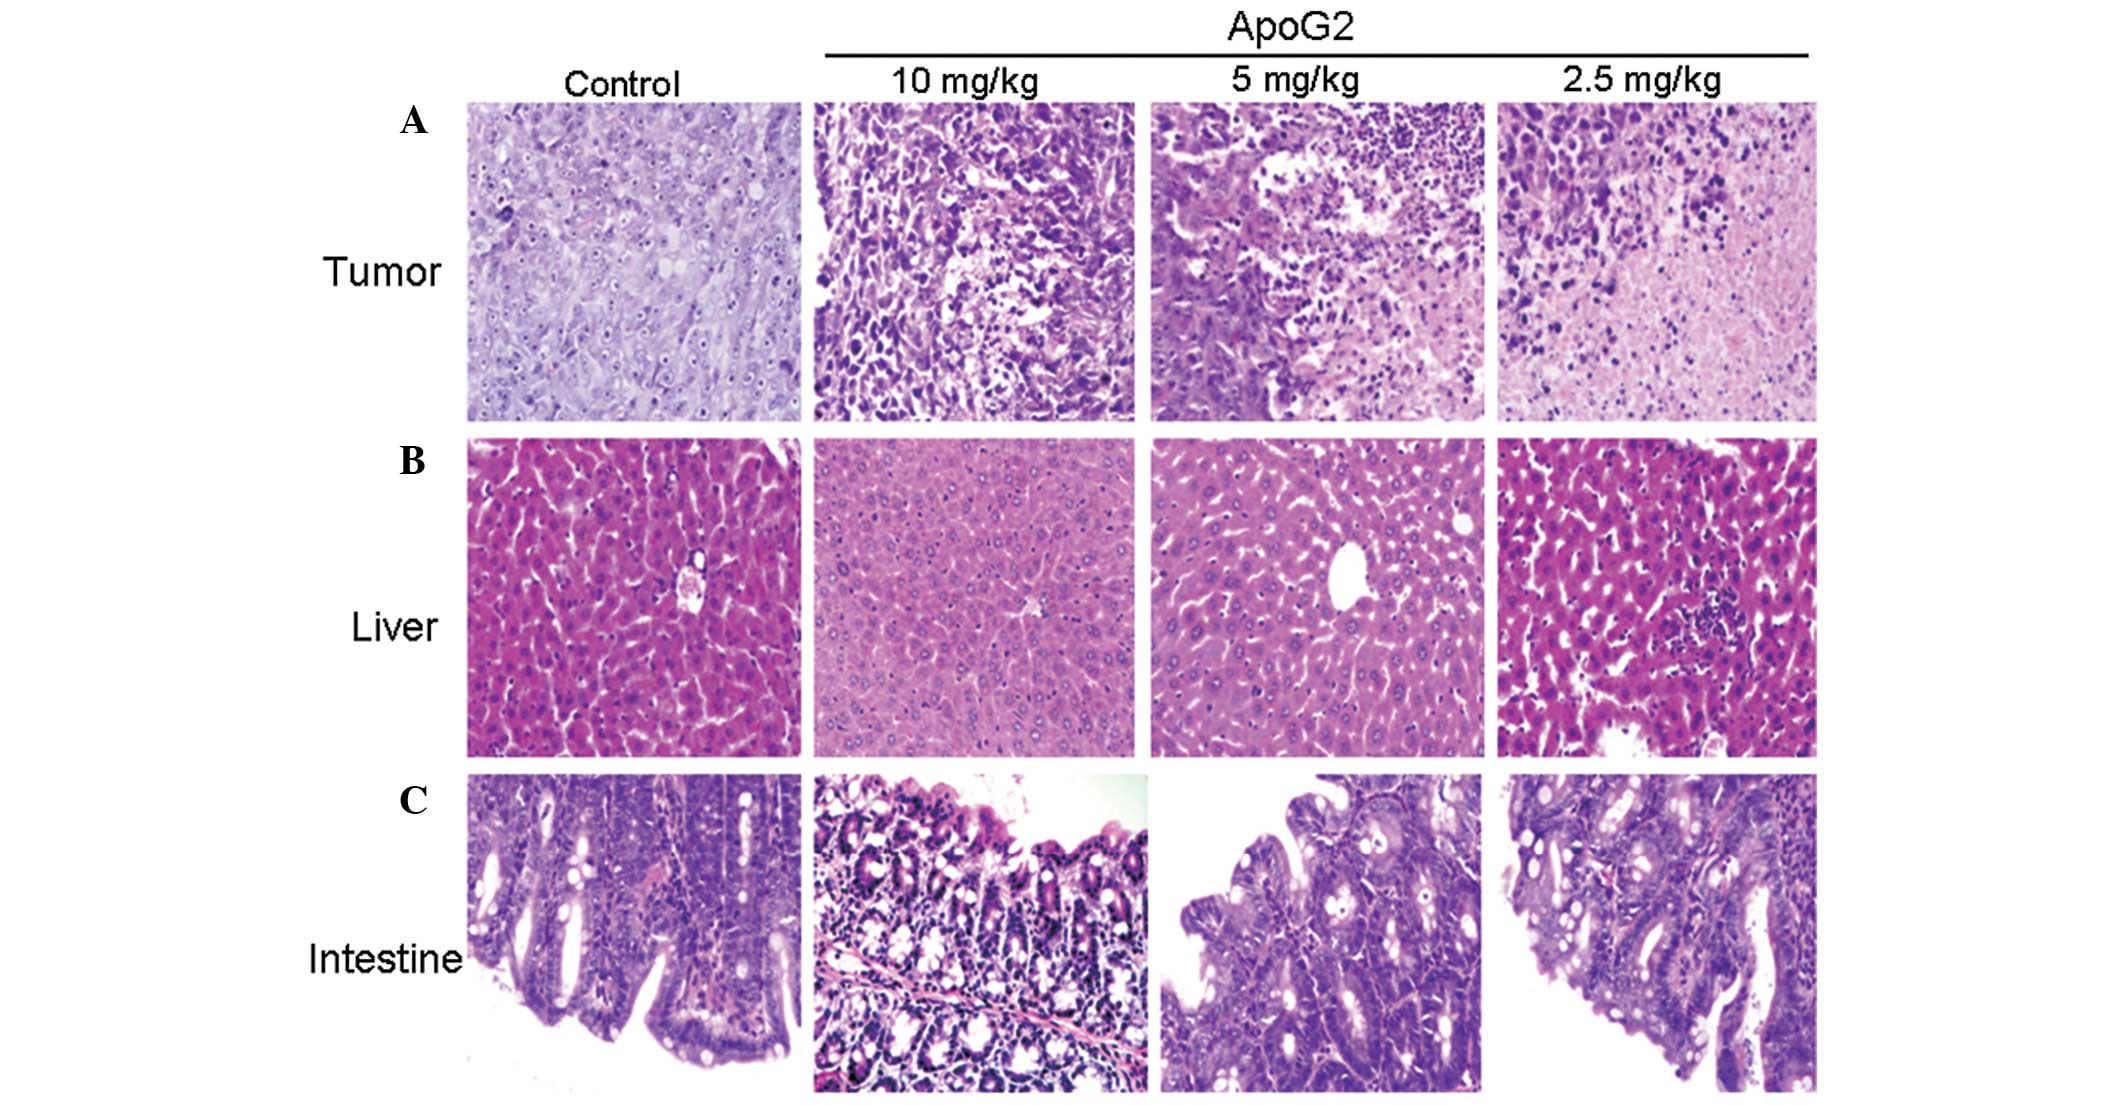
Histopathological features of
transplanted tumors
The histopathologic alterations of transplanted
tumor were analyzed by H&E staining. As shown in Fig. 7A, areas of necrosis were not
observed in the control group. However, the percentage of cells
undergoing necrosis in the three ApoG2 groups (2.5, 5.0 and 10.0
mg/kg) was 3.5±0.3, 20.3±2.5 and 53.3±3.6% of total nucleated
cells, respectively.
Histopathological features of the liver
and intestine in ApoG2-treated mice
In order to determine whether ApoG2 had a toxic
effect in other organs, the histopathological changes of the liver
and intestine were observed by H&E staining. As shown in
Fig. 7B, in the 10.0 mg/kg ApoG2
treatment group there was partial pathological alterations with
spotty necrosis, inflammatory cell infiltration and integral
hepatic lobule in the liver. In the 5.0 and 2.5 mg/kg ApoG2
treatment group no significant pathological alterations in the
liver were observed.
A similar pattern was observed in the intestine
(Fig. 7C). An integral intestinal
mucosa structure and normal epithelial cells were observed in the
10.0 mg/kg ApoG2 treatment group in the small intestine. While no
significant pathological changes were observed in the small
intestine in the 5.0 and 2.5 mg/kg ApoG2 treatment groups.
These results indicated that the ApoG2 doses used in
the present study do not have toxic effects on the liver and
intestine.
Expression of caspase-3 and caspase-8 in
tumor tissues
As mentioned above, caspase-3 and caspase-8 were
activated in ApoG2-treated LNCaP cells. Furthermore, whether
caspase-3 and caspase-8 were activated in tumor tissues was
analyzed. As shown in Fig. 8A and
B, the expression levels of caspase-3 and caspase-8 were
extremely low and hardly detectable in the negative control group.
However, following treatment with ApoG2, the expression levels of
caspase-3 and caspase-8 were increased. Compared with the negative
control group, significant differences in the 10.0 mg/kg ApoG2
treatment group were identified for caspase-3 (Fig. 8A) and in the 5 and 2.5 mg/kg ApoG2
treatment group for caspase-8 (Fig.
8B). These data suggested that tumor tissue underwent apoptotic
cell death following ApoG2 treatment.
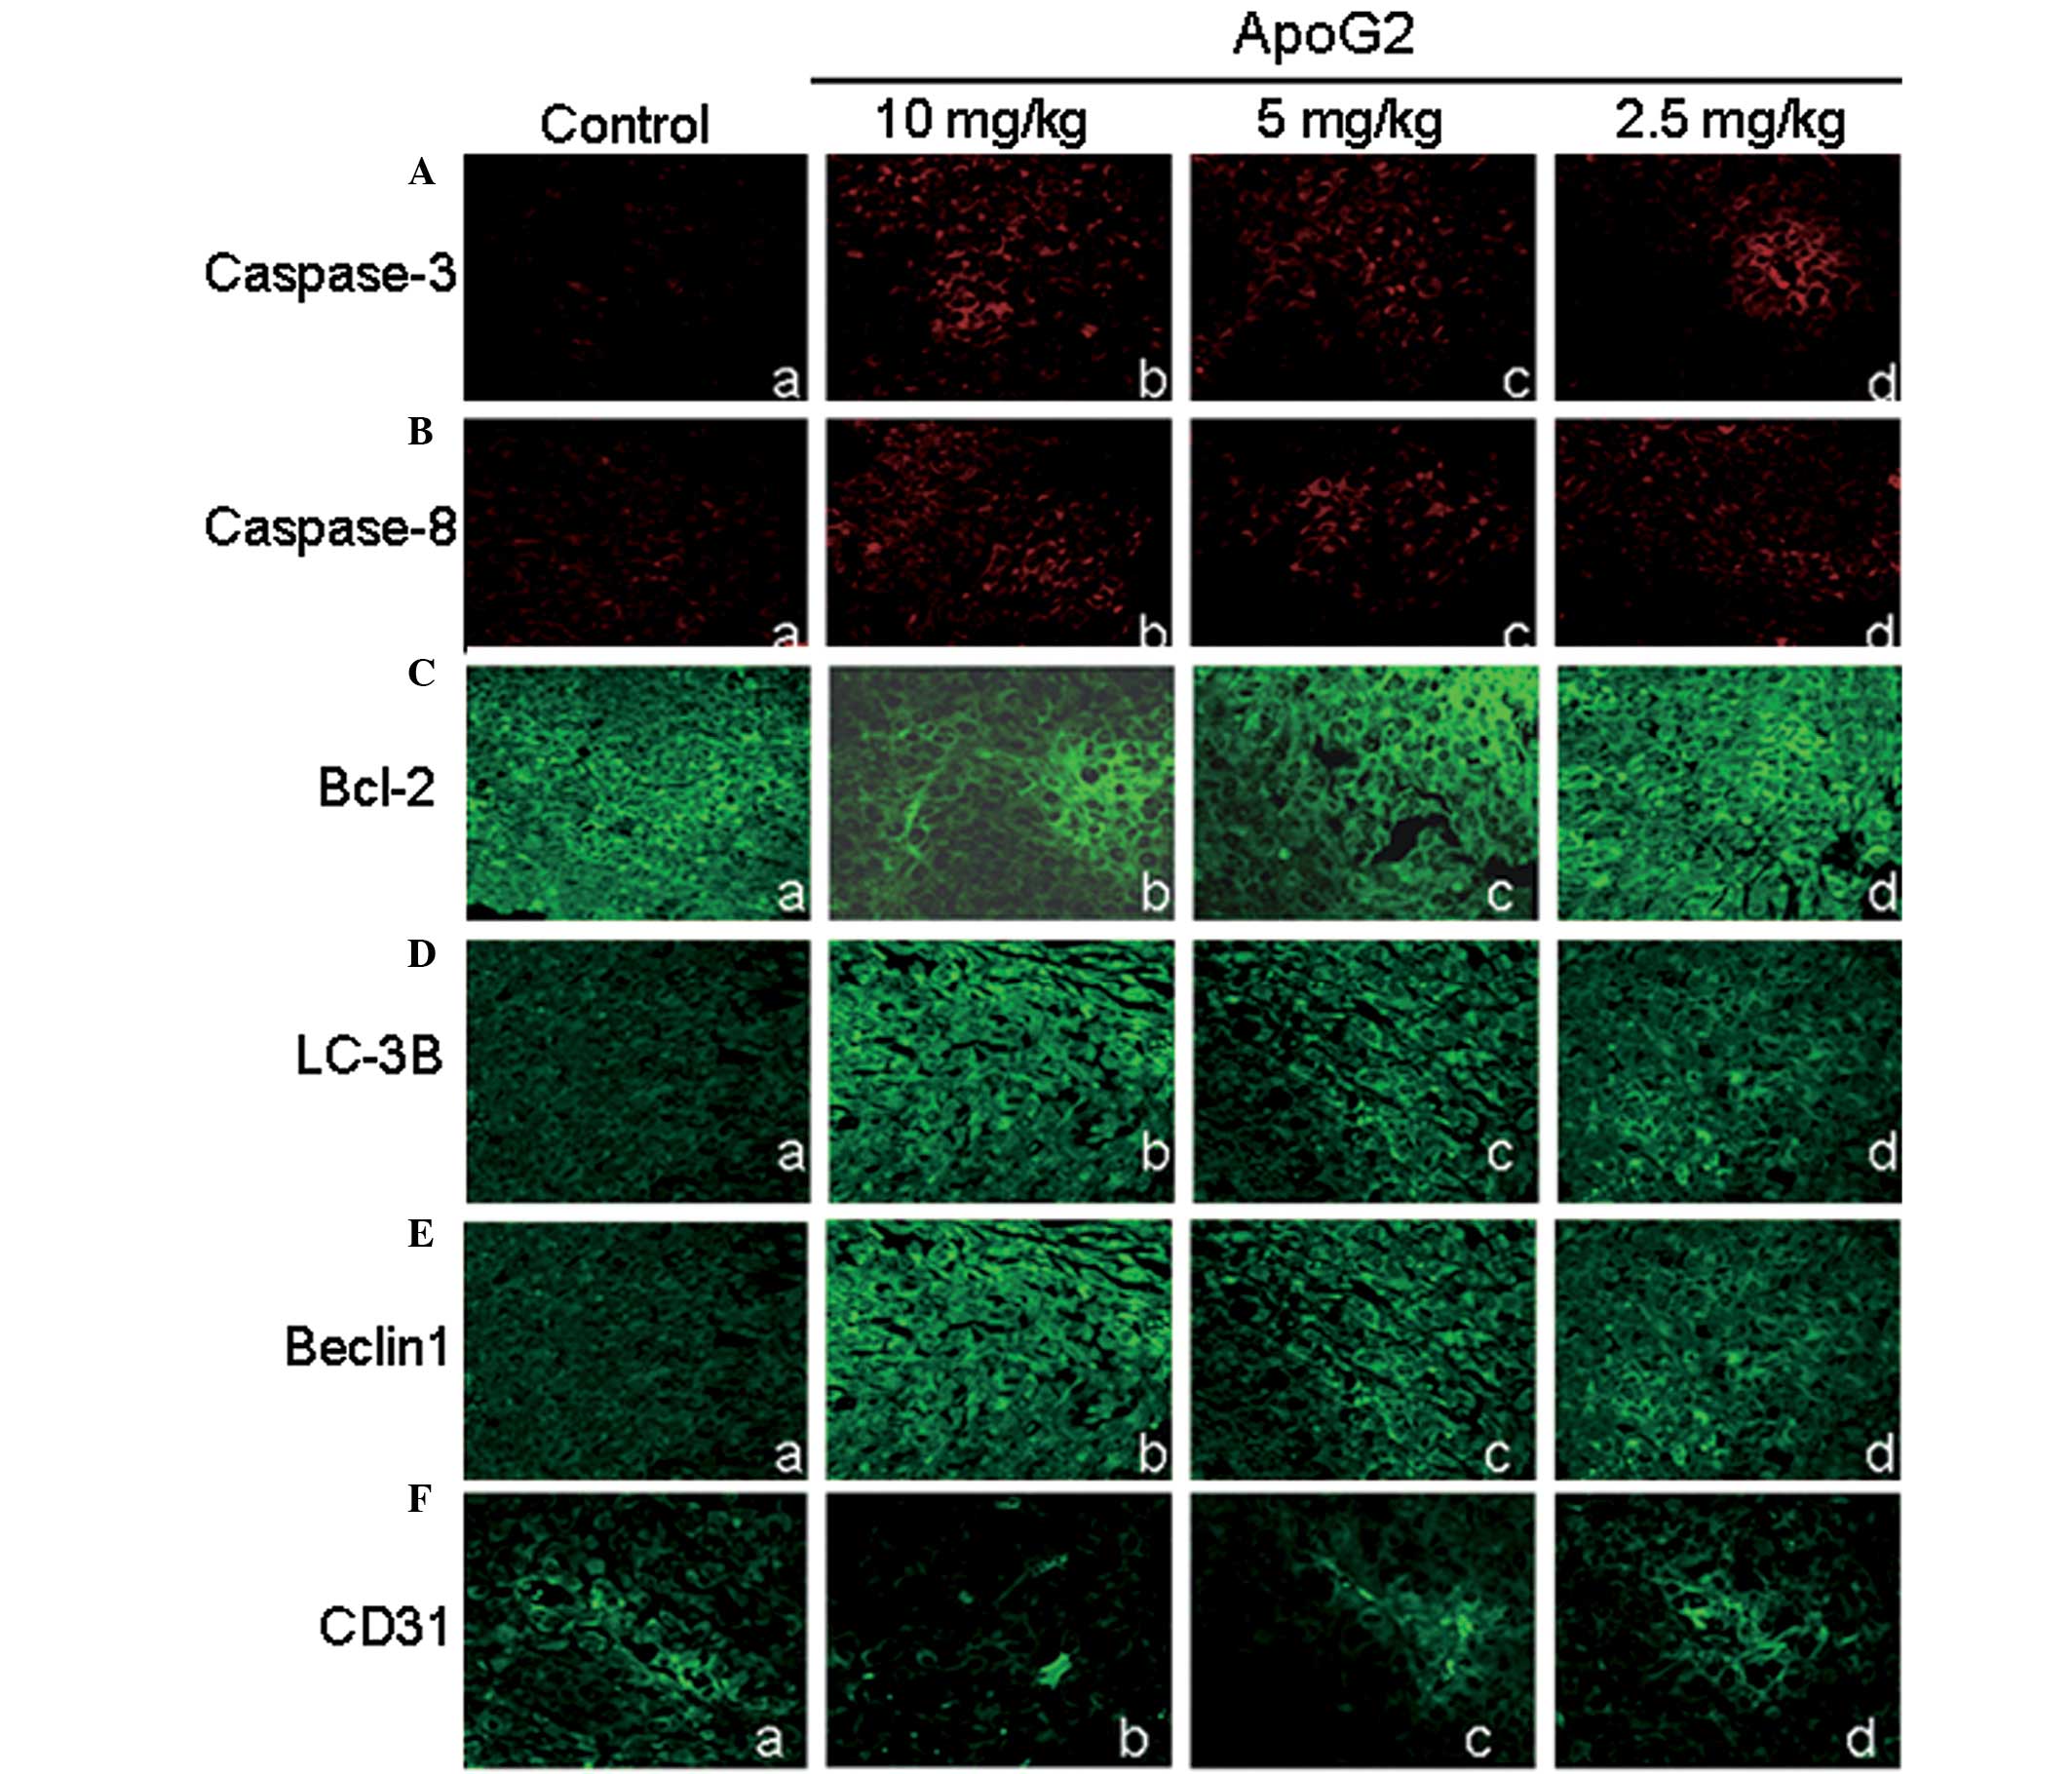 | Figure 8Immunohistochemical analysis of
caspase-3, caspase-8, Bcl-2, LC-3B, Beclin 1 and CD31 in tumor
tissues. The LNCaP xenograft was treated with ApoG2 for 10 days.
Representative immunohistochemical results are shown. (A)
Expression of caspase-3 (magnification, ×400). (B) Expression of
caspase-8 (magnification, ×400). (C) Expression of Bcl-2
(magnification, ×400). (D) Expression of LC-3B (magnification,
×400). (E) Expression of beclin 1 (magnification, ×400). (F)
Expression of CD31 (magnification, ×400). All results are expressed
as the mean ± standard error of the mean of three independent
experiments. Bcl-2, Bcl-2, B-cell lymphoma-2; ApoG2,
apogossypolone; caspase, cysteine aspartate protease. |
Expression of Bcl-2, Beclin-1 and
LC-3B in tumor tissues in vivo
As revealed by RT-PCR and western blot results
(Fig. 4A), Bcl-2 expression levels
were downregulated in ApoG2-treated LNCaP cells.
Immunohistochemistry for Bcl-2 was performed to determine whether
this was also the case in tumor tissues. As shown in Fig. 8C, the Bcl-2 fluorescent intensity
in ApoG2-treated cells were only partially decreased. No
significant difference was identified among the control group and
the ApoG2 treatment group. This result indicated that the impact of
ApoG2 on the expression of Bcl-2 in human prostatic cancer
xenograft tissues was not significant.
As shown in Fig. 5,
ApoG2 induced the expression of Beclin 1 and LC-3B in LNCaP cells
in vitro. In fact, this was also true in tumor tissues in
vivo. In the control group, Beclin 1 and LC-3B fluorescence
intensity were extremely low. However, following treatment with
ApoG2, the fluorescence intensity of Beclin 1 (Fig. 8D) and LC-3B (Fig. 8E) increased in a dose-dependent
manner. Compared with the control group, the Beclin 1 and LC-3B
fluorescence intensity of the ApoG2 treatment group were
significantly higher.
ApoG2 affects the angiogenesis of tumor
tissues
To evaluate the effect of ApoG2 on the angiogenesis
of tumor tissues, MVD was analyzed by labeling CD31, which was
expressed in the cytoplasm of vascular endothelial cells. As shown
in Fig. 8F, CD31 expression in
tumor tissues of the control group was clear and connected into a
network. However, the expression of CD31 in tumor tissues of ApoG2
treatment groups decreased by various degrees. The decrease in CD31
expression in the 10.0 mg/kg ApoG2 treatment group was most marked.
In addition, the decrease in CD31 expression of the 5.0 mg/kg ApoG2
treatment group was also significant. In the 2.5 mg/kg ApoG2
treatment group, CD31 expression remained clear but with decreased
vessel density, suggesting that these vessels were not connected
into a network. The MVD count analysis demonstrated that the MVD in
each ApoG2 treatment group was significantly smaller than that of
the negative control group (Fig.
8F). These data suggested that angiogenesis was impaired in
ApoG2-treated tumor tissues.
Discussion
Prostatic cancers are a type of malignant tumor that
endanger the health of males. The incidence rate of prostate cancer
in America has exceeded lung cancer and its mortality rate is in
second place to lung cancer (1).
Furthermore, the incidence rate and the morality rate of the
prostatic cancers also show an increasing trend year after year.
There are various methods used for the treatment of prostatic
cancer, including surgery, chemotherapy, endocrine therapy and
immune therapy. Among them, endocrine therapy is an important and
essential method for the treatment of prostatic cancer, which may
prolong the survival time of patients with terminal prostatic
cancer. However, due to steroid resistance or transfer, the
conditions of a considerable number of patients still worsen,
leading to mortality. Therefore, the investigation and development
of new agents with high efficiency and low toxicity has drawn the
attention of scientists, particularly scientists in the field of
phytochemistry. The levorotation gossypol is a natural product
derived from the seeds and roots of cotton and has been used as
male contraceptive drugs for >30 years in China (17). In 1984, Tuszynski et al
(18) revealed that gossypol had
anti-tumor activity against melanoma and colorectal cancer. Since
then numerous studies have reported the anti-proliferation activity
of the gossypol against tumor cells, including colon cancer cells
(19), head cervical squamous
carcinoma cells (20), diffuse
large cell lymphoma cells (21)
and prostatic cancer cells (22).
However, the gossypol may result in larger toxic side effects. The
stable Schiff’s alkali is easily formed between the two chemically
active aldehyde groups of the gossypol and the amino acid residues
of the proteins. ApoG2 is the derivative of the gossypol with the
two aldehyde groups removed. It was able to inhibit Bcl-2 and have
a higher anti-tumor activity than the gossypol (23).
The present study found that the tumor volume of the
tumor-bearing mice was significantly smaller than that of the
control group following ten days treatment with ApoG2. Furthermore,
no weight loss occurred during the treatment, demonstrating that
the ApoG2 dosage used in the present study was not toxic to the
animals. Additionally, the histopathological examination results
demonstrated that the animals had no heart and kidney injuries
following consecutive 23 days treatment with ApoG2. The hepatic and
intestinal toxicity was extremely small and significantly lower
than the (−) - gossypol (data not shown). Therefore, ApoG2 had
improved tumor specificity. All the results indicate that ApoG2 may
be a safe and effective drug for the treatment of prostatic
cancer.
It is reported that autophagy is important in the
development of tumor and that the autophagosome degradation
capacity of the tumor cells is smaller than that of normal cells
(24). Several studies have
demonstrated that in mammals autophagy may interact with apoptosis
under certain conditions (25,26).
Autophagy is possibly one of the prerequisites of apoptosis. It
occurs prior to apoptosis and may enhance the activity of the
latter. By contrast, autophagy and apoptosis may be subjected to
the antagonist effect or inter-conversion (27–29).
The association between the two cell death pathways, including the
effect of apoptotic deficiencies on autophagy requires further
investigation. Our experimental data demonstrated that, following
the effect of ApoG2, LNCap cells exhibited clear characteristics of
autophagy, including the appearance of membranous vacuoles in the
cytoplasm and formation of AVOs, as well an increase in the
expression of the autophagy-associated proteins LC-3B and beclin 1.
In addition, 3-MA, a phosphatidylinositol 3-kinase inhibitor, which
is commonly used as a specific inhibitor of autophagic
sequestration, increased cell apoptosis, demonstrating that
autophagy and apoptosis may convert with each other under certain
conditions. The present study reported that ApoG2 induced apoptotic
and autophagic cell death in LNCaP cells. The pro-apoptotic
proteins (including Bak, Bax and Bad) and autophagic proteins may
all merge with the same area of Bcl-2/Bcl-XL. Therefore, it may be
inferred that ApoG2 simultaneously induces autophagic cell death
and apoptotic cell death of LNCap cells, making ApoG2 an attractive
molecular tool to investigate the association between autophagic
cell death and apoptotic cell death.
In conclusion, data from the present study
demonstrated that ApoG2 may significantly inhibit the growth of
LNCaP cells through inducing autophagic cell death and that ApoG2
may be a potentially effective chemical drug for the treatment of
prostatic cancer.
Acknowledgements
This study was supported by the National Nature
Science Foundation of China (no. 81101100), the Natural Science
Basic Research Plan in Shanxi Province of China under Grant (no.
2012JQ4015) and the Fundamental Research Funds for the Central
Universities (nos. K50510100002 and K50510100004).
References
|
1
|
Jemal A and Murray T: Cancer statistics,
2005. CA Cancer J Clin. 55:10–30. 2005. View Article : Google Scholar
|
|
2
|
Diaz M and Patterson SG: Management of
androgen-independent prostate cancer. Cancer Control. 11:364–373.
2004.PubMed/NCBI
|
|
3
|
Gioeli D: Signal transduction in prostate
cancer progression. Clin Sci (Lond). 108:293–308. 2005. View Article : Google Scholar : PubMed/NCBI
|
|
4
|
Arnold AA and Aboukameel A: Preclinical
studies of Apogossypolone: a new nonpeptidic pan small-molecule
inhibitor of Bcl-2, Bcl-XL and Mcl-1 proteins in Follicular Small
Cleaved Cell Lymphoma model. Mol Cancer. 7:202008. View Article : Google Scholar : PubMed/NCBI
|
|
5
|
Sun J and Li ZM: ApoG2 inhibits
antiapoptotic Bcl-2 family proteins and induces
mitochondria-dependent apoptosis in human lymphoma U937 cells.
Anticancer Drugs. 19:967–974. 2008. View Article : Google Scholar : PubMed/NCBI
|
|
6
|
Hu ZY and Zhu XF: ApoG2, a novel inhibitor
of antiapoptotic Bcl-2 family proteins, induces apoptosis and
suppresses tumor growth in nasopharyngeal carcinoma xenografts. Int
J Cancer. 123:2418–2429. 2008. View Article : Google Scholar : PubMed/NCBI
|
|
7
|
Mi JX and Wang GF: Synergistic antitumoral
activity and induction of apoptosis by novel pan Bcl-2 proteins
inhibitor apogossypolone with adriamycin in human hepatocellular
carcinoma. Acta Pharmacol Sin. 29:1467–1477. 2008. View Article : Google Scholar : PubMed/NCBI
|
|
8
|
Burton JL, Oakley N and Anderson JB:
Recent advances in the histopathology and molecular biology of
prostate cancer. BJU Int. 85:87–94. 2000. View Article : Google Scholar : PubMed/NCBI
|
|
9
|
Romijn JC, Verkoelen CF and Schroeder FH:
Application of the MTT assay to human prostate cancer cell lines in
vitro: establishment of test conditions and assessment of
hormone-stimulated growth and drug-induced cytostatic and cytotoxic
effects. Prostate. 12:99–110. 1988. View Article : Google Scholar
|
|
10
|
Zhang XQ, Huang XF and Mu SJ: Inhibition
of proliferation of prostate cancer cell line, PC-3, in vitro and
in vivo using (−)-gossypol. Asian J Androl. 12:390–399. 2010.
|
|
11
|
Paglin S and Hollister T: A novel response
of cancer cells to radiation involves autophagy and formation of
acidic vesicles. Cancer Res. 61:439–444. 2001.
|
|
12
|
Alessandri G and Filippeschi S: Influence
of gangliosides on primary and metastatic neoplastic growth in
human and murine cells. Cancer Res. 47:4243–4247. 1987.PubMed/NCBI
|
|
13
|
Deng R, Tang J, Xie BF, et al: SYUNZ-16, a
newly synthesized alkannin derivative, induces tumor cells
apoptosis and suppresses tumor growth through inhibition of PKB/AKT
kinase activity and blockade of AKT/FOXO signal pathway. Int J
Cancer. 127:220–229. 2010. View Article : Google Scholar
|
|
14
|
Klionsky DJ, Abeliovich H, Agostinis P, et
al: Guidelines for the use and interpretation of assays for
monitoring autophagy in higher eukaryotes. Autophagy. 4:151–175.
2008. View Article : Google Scholar
|
|
15
|
Mains RE and May V: The role of a low pH
intracellular compartment in the processing, storage, and secretion
of ACTH and endorphin. J Biol Chem. 263:7887–7894. 1988.PubMed/NCBI
|
|
16
|
Traganos F and Darzynkiewicz Z: Lysosomal
proton pump activity: supravital cell staining with acridine orange
differentiates leukocyte subpopulations. Methods Cell Biol.
41:185–194. 1994. View Article : Google Scholar
|
|
17
|
Wu D: An overview of the clinical
pharmacology and therapeutic potential of gossypol as a male
contraceptive agent and in gynaecological disease. Drugs.
38:333–341. 1989. View Article : Google Scholar : PubMed/NCBI
|
|
18
|
Tuszynski GP and Cossu G: Differential
cytotoxic effect of gossypol on human melanoma, colon carcinoma,
and other tissue culture cell lines. Cancer Res. 44:768–771.
1984.
|
|
19
|
Wang X, Wang J and Wong SC: Cytotoxic
effect of gossypol on colon carcinoma cells. Life Sci.
67:2663–2671. 2000. View Article : Google Scholar : PubMed/NCBI
|
|
20
|
Oliver CL, Bauer JA, Wolter KG, et al: In
vitro effects of the BH3 mimetic, (−)-gossypol, on head and neck
squamous cell carcinoma cells. Clin Cancer Res. 10:7757–7763.
2004.
|
|
21
|
Mohammad RM, Wang S, Aboukameel A, et al:
Preclinical studies of a nonpeptidic small-molecule inhibitor of
Bcl-2 and Bcl-X(L) [(−)-gossypol] against diffuse large cell
lymphoma. Mol Cancer Ther. 4:13–21. 2005.
|
|
22
|
Xu L, Yang D, Wang S, et al: (−)-Gossypol
enhances response to radiation therapy and results in tumor
regression of human prostate cancer. Mol Cancer Ther. 4:197–205.
2005.
|
|
23
|
Arnold AA, Aboukameel A, Chen J, et al:
Preclinical studies of apogossypolone: a new nonpeptidic pan
small-molecule inhibitor of Bcl-2, Bcl-XL and Mcl-1 proteins in
follicular small cleaved cell lymphoma model. Mol Cancer. 7:20–29.
2008. View Article : Google Scholar : PubMed/NCBI
|
|
24
|
Kisen GO, Tessitore L, Costelli P, et al:
Reduced autophagic activity in primary rat hepatocellular carcinoma
and ascites hepatoma cells. Carcinogenesis. 14:2501–2505. 1993.
View Article : Google Scholar : PubMed/NCBI
|
|
25
|
Pattingre S, Tassa A, Qu X, et al: Bcl-2
antiapoptotic proteins inhibit Beclin 1-dependent autophagy. Cell.
122:927–939. 2005. View Article : Google Scholar : PubMed/NCBI
|
|
26
|
Wang L and Yu C: TMEM166, a novel
transmembrane protein, regulates cell autophagy and apoptosis.
Apoptosis. 12:1489–1502. 2007. View Article : Google Scholar : PubMed/NCBI
|
|
27
|
Xue L, Fletcher GC and Tolkovsky AM:
Autophagy is activated by apoptotic signalling in sympathetic
neurons: an alternative mechanism of death execution. Mol Cell
Neurosci. 14:180–198. 1999. View Article : Google Scholar : PubMed/NCBI
|
|
28
|
Bauvy C and Gane P: Autophagy delays
sulindac sulfide-induced apoptosis in the human intestinal colon
cancer cell line HT-29. Exp Cell Res. 268:139–149. 2001. View Article : Google Scholar : PubMed/NCBI
|
|
29
|
Cui Q and Tashiro S: Autophagy preceded
apoptosis in oridonin-treated human breast cancer MCF-7 cells. Biol
Pharm Bull. 30:859–864. 2007. View Article : Google Scholar : PubMed/NCBI
|