Introduction
The number of patients with type 2 diabetes mellitus
(T2DM) increases annually in China, as well as in other countries.
Patients with T2DM have hyperinsulinemia, due to impaired cellular
sensitivity to insulin, and hyperglycemia, due to insulin
resistance. Hyperglycemia and hyperinsulinemia cause numerous
complications, including nephropathy, neuropathy and retinopathy.
Osteoporosis, along with an elevated risk of fragility fractures,
has been observed in patients with T2DM (1). Epidemiological evidence has also
demonstrated that there is an increased risk of hip, humerus and
foot fractures in diabetic subjects (2). Furthermore, patients with T2DM have a
higher risk of nonunion fracture, which leads to burdens on society
(3).
Impaired bone turnover as a result of diabetes is
widely accepted (4); however,
there are limited data on the underlying mechanism. A number of
studies have reported that type 1 diabetes changes bone remodeling
by impairing bone formation, leading to osteopenia (2,5). By
contrast, bone loss in T2DM is less accepted, with reports of bone
mineral density (BMD) ranging from low to high in T2DM (6–8).
Therefore, the present study investigated whether T2DM causes
osteoporosis and explored the underlying mechanisms involved in
this process by performing histological, cellular and biomechanical
experiments on male KK/Upj-Ay/J (KK-Ay) mice.
Materials and methods
Animals
Male KK-Ay mice with a C57BL/6 background and male
C57BL/6 mice were purchased from Beijing HFK Bio-Technology, Co.,
Ltd. (Beijing, China), aged 5–6 weeks. Male KK-Ay mice develop T2DM
between 7 and 8 weeks of age. The C57BL/6 mice were non-diabetic
and served as controls. Animals were housed with a 12-h light/dark
cycle and fed KK-Ay Diet 1K65 (HFK Bio-Technology, Co., Ltd.) and
water ad libitum. All procedures were approved by the Animal
Care and Use Committee, Tongji Medical College, Huazhong University
of Science and Technology (Wuhan, China).
At the age of 7–8 weeks, nonfasting blood glucose
measurements were obtained using blood from the lateral saphenous
vein and a glucometer (Bayer, Whippany, NJ, USA). Mice with blood
glucose levels >300 mg/dl were considered diabetic.
Animals were euthanized by CO2 inhalation and cervical
dislocation 4 weeks subsequent to confirmation of diabetes. Weights
of the bilateral inguinal fat and right tibiae were recorded. Bone
marrow was harvested from both femora. Left tibiae and L5 vertebrae
were analyzed using micro-computed tomography (mCT).
Serum analysis
Blood serum samples were obtained from blood
collected by cardiac puncture immediately subsequent to euthanasia.
Serum measurements of glucose, insulin, triglyceride (TG),
cholesterol (TC), alkaline phosphatase (ALP), tartrate-resistant
acid phosphatase (TRAP) and osteocalcin (OCN) were performed using
a glucometer and ELISA kits (Wuhan Boster Biological Technology,
Ltd., Wuhan, China).
mCT analysis
mCT analysis was performed using a Scanco μCT 50
(Scanco Medical AG, Bassersdorf, Switzerland). Scans were performed
under the following conditions: Voltage, 70 KVp; current, 110 μA;
increment, 5 μm; threshold value, 289. Parameters, including images
and BMD, describing the tibiae and vertebrae were computed using
the Scanco μCT 50 system.
Osteoblastogenesis assay
Bone marrow stromal cells were collected and seeded
at a density of 2.5×10⁵/cm2 in 24-well plates
with osteoblast differentiation-inducing media containing α-Minimum
Essential Media (α-MEM; Gibco-BRL, Carlsbad, CA, USA) supplemented
with 15% fetal bovine serum (FBS; Gibco-BRL), 100 μM ascorbate
phosphate, 5 M β-glycerol phosphate and 10 nM dexamethasone. The
media were changed every 2 days. Cells were harvested after 7, 14
and 21 days for von Kossa staining and measurement of ALP
activity.
Osteoclastogenesis assay
Primary bone marrow cells were collected and seeded
at a density of 2.5×10⁵/cm2 in the presence
of α-MEM (Gibco-BRL) supplemented with 15% FBS (Gibco-BRL).
Floating, non-adherent cells were harvested after 24 h and seeded
at a density of 2×10⁵/cm2 into 48-well plates
using medium supplemented with 50 ng/ml macrophage
colony-stimulating factor and 50 ng/ml receptor activator of
nuclear factor κ-B ligand (RANKL; R&D Systems, Minneapolis, MN,
USA). The media were changed every 2 days. After 4 days of growth,
cells were harvested for TRAP staining and measurement of TRAP
activity.
ALP and TRAP activity measurement
To measure ALP activity, the harvested cells were
washed with phosphate-buffered saline twice, prior to the addition
of lysis buffer [1.5 M Tris-HCl (pH 9.2), 0.1 M ZnCl2,
0.5 M MgCl2-6H2O and Triton X-100]. The cells
in each well were sonicated for 10 sec, and the sonicated samples
were then added to substrate solution containing 4-nitrophenyl
phosphate (Sigma, St Louis, MO, USA), 1.5 M alkaline buffer
solution (Sigma) and H2O and incubated for 20 min at
37°C. The reaction was subsequently, terminated by the addition of
2 N NaOH. The absorbance of the samples was measured at 405 nm
using a microplate reader (Multiskan™ FC Microplate Photometer,
Thermo Fisher Scientific, Inc., Waltham, MA, USA).
For the measurement of TRAP activity, the harvested
cells were fixed with 10% formalin for 10 min and 95% ethanol for 1
min. A total of 100 μl citrate buffer (50 mM, pH 4.6) containing 10
mM sodium tartrate and 5 mM p-nitrophenylphosphate (Sigma) was
subsequently added to the wells containing fixed cells in the
plates. Following incubation with the citrate buffer for 1 h,
enzyme reaction mixtures in the wells were transferred to new
plates containing an equal volume of 0.1 N NaOH. The absorbance was
measured at 405 nm using a microplate reader (Multiskan FC
Microplate Photometer, Thermo Fisher Scientific, Inc.). Each
experiment was performed in triplicate.
RNA isolation and quantitative polymerase
chain reaction (qPCR) analysis
Total RNA was isolated using TRIzol®
Reagent (Invitrogen Life Technologies, Carlsbad, CA, USA). Gene
expression analysis was performed using the Real-Time PCR Detection
System IQ™5 (Bio-Rad, Hercules, CA, USA) and normalized against 18S
RNA. Table I shows the primers
used for qPCR.
 | Table IPrimer sequences. |
Table I
Primer sequences.
| Gene | Primer | Product size
(bp) | Accession no. |
|---|
| 18S | F:
TTCGAACGTCTGCCCTATCAA
R: ATGGTAGGCACGGGGACTA | 50 | M35283.1 |
| RUNX2 | F:
GACTGTGGTTACCGTCATGGC
R: ACTTGGTTTTTCATAACAGCGGA | 84 | NM_001146038 |
| ALP | F:
GCCTTACCAACTCTTTTGTGCC
R: GCTTGCTGTCGCCAGTAAC | 61 | NM_007431 |
| OCN | F:
CTGACCTCACAGATCCCAAGC
R: TGGTCTGATAGCTCGTCACAAG | 187 | NM_031368 |
| Cathepsin k | F:
GAAGAAGACTCACCAGAAGCAG
R: CTGTATTCCCCGTTGTGTAGC | 136 | NM_007802 |
| TRAP | F:
CACTCCCACCCTGAGATTTGT
R: CATCGTCTGCACGGTTCTG | 118 | NM_001102405 |
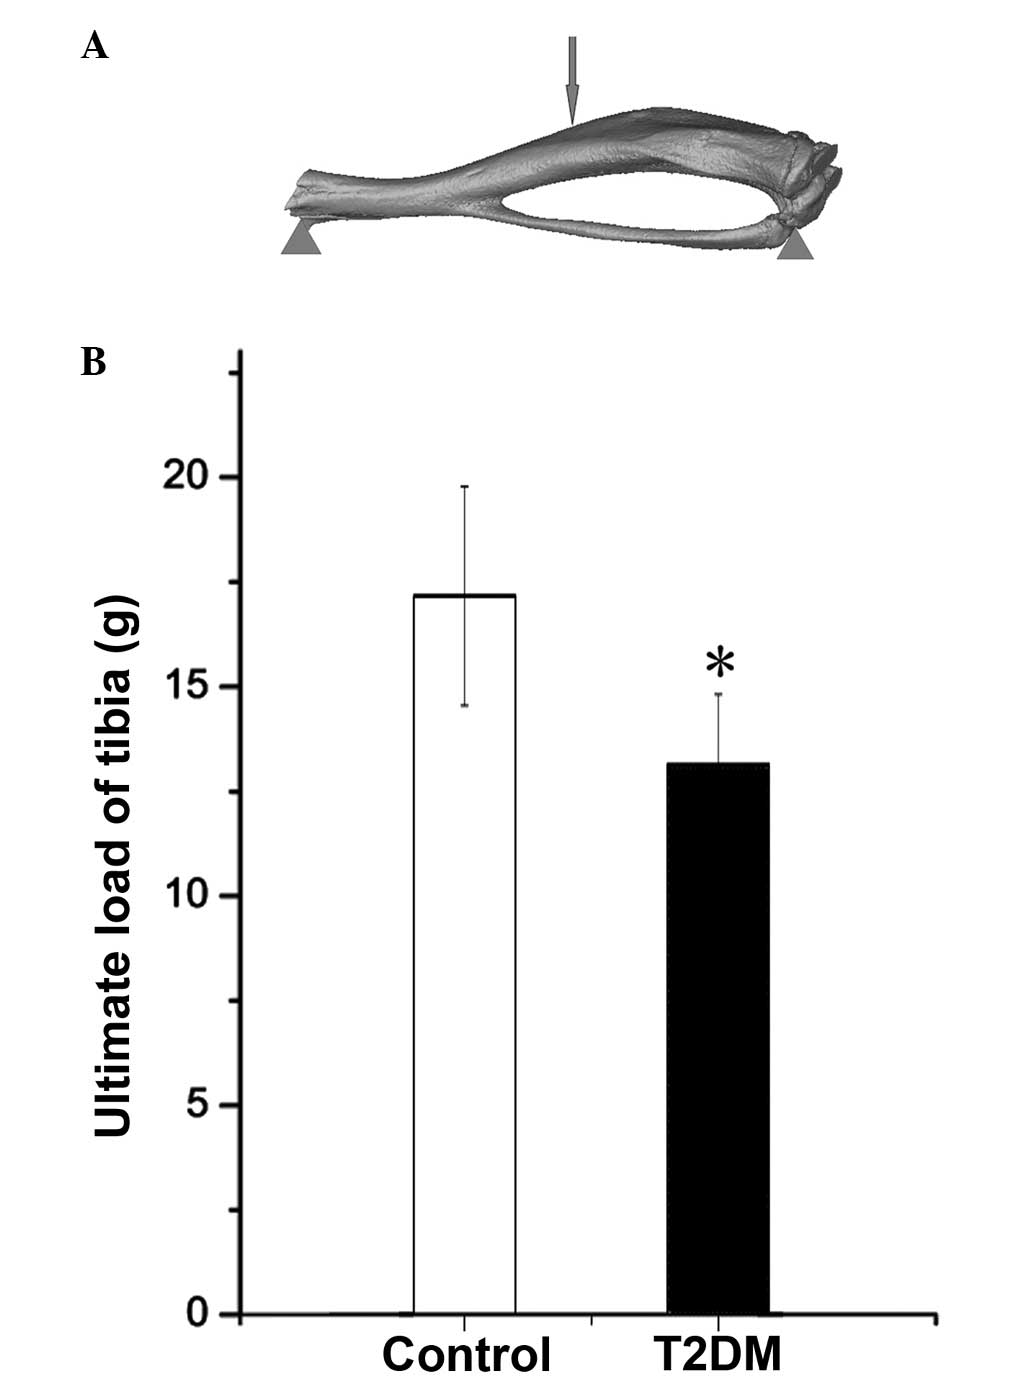
Biomechanical analysis
The strength of the tibial midshaft was measured
using a universal testing machine (Instron, Norwood, MA, USA). Load
was applied on the bone as shown in Fig. 1A, and the ultimate load for each
sample was measured.
Statistical analysis
Statistical analyses were performed using the
Student’s t-test with all values expressed as the mean ± standard
deviation. All experiments were repeated in triplicate, and
P<0.05 was considered to indicate a statistically significant
difference.
Results
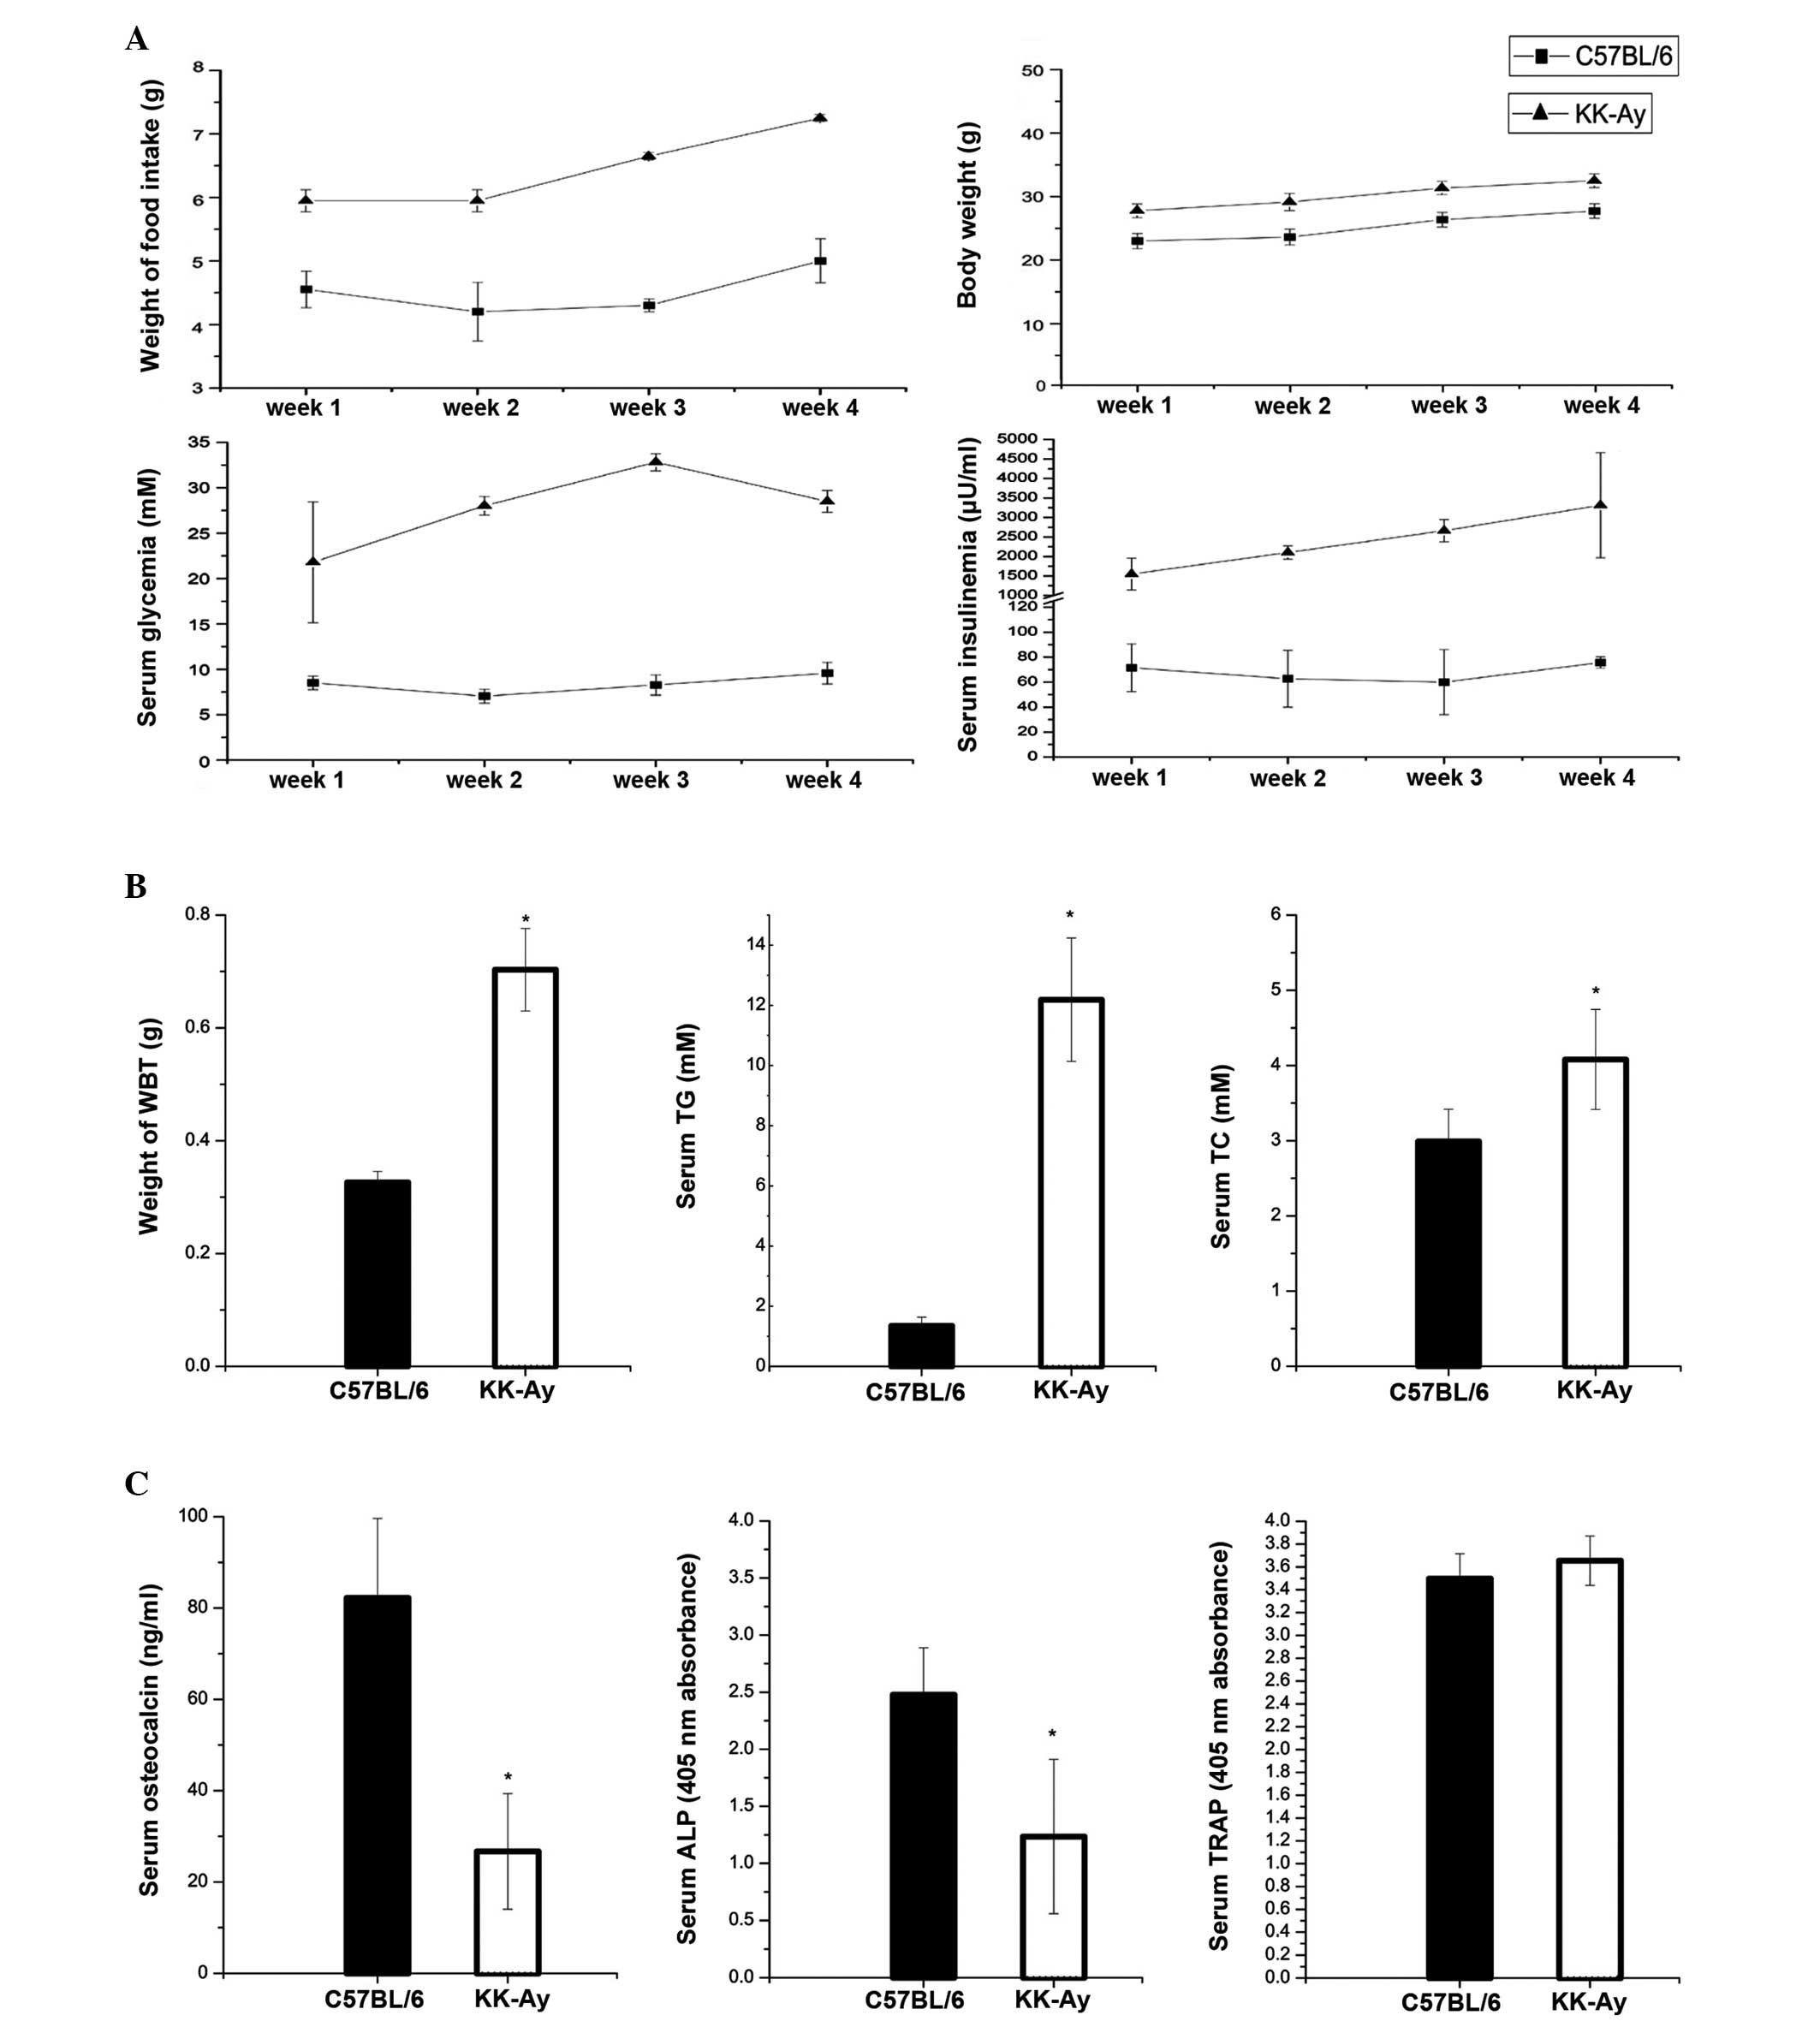
KK-Ay mice are hyperglycemic,
hyperinsulinemic, obese and exhibit high food consumption
KK-Ay mice exhibited elevated body weights with
increased topical fat weight and high intake of food. They also had
higher levels of serum insulin and non-fasting levels of glucose
compared with the control mice (Fig.
2A). With regard to fat metabolism, KK-Ay mice had higher
levels of serum TC and TG compared with the control animals, and
the weight of the bilateral inguinal fat tissue from the KK-Ay mice
was heavier than that from the control mice (Fig. 2B).
Alterations in serum bone turnover
markers, including bone-specific alkaline phosphatase (BALP) enzyme
activity, serum TRAP levels and serum OCN levels
In addition to higher serum glucose and insulin
levels in diabetic mice, alterations were observed in the levels of
certain bone formation markers. BALP enzyme activity was lower in
diabetic mice than that in non-diabetic mice. Serum TRAP levels, a
bone resorption marker, were unchanged in diabetic mice; however,
the serum OCN levels were markedly lower in diabetic mice (Fig. 2C).
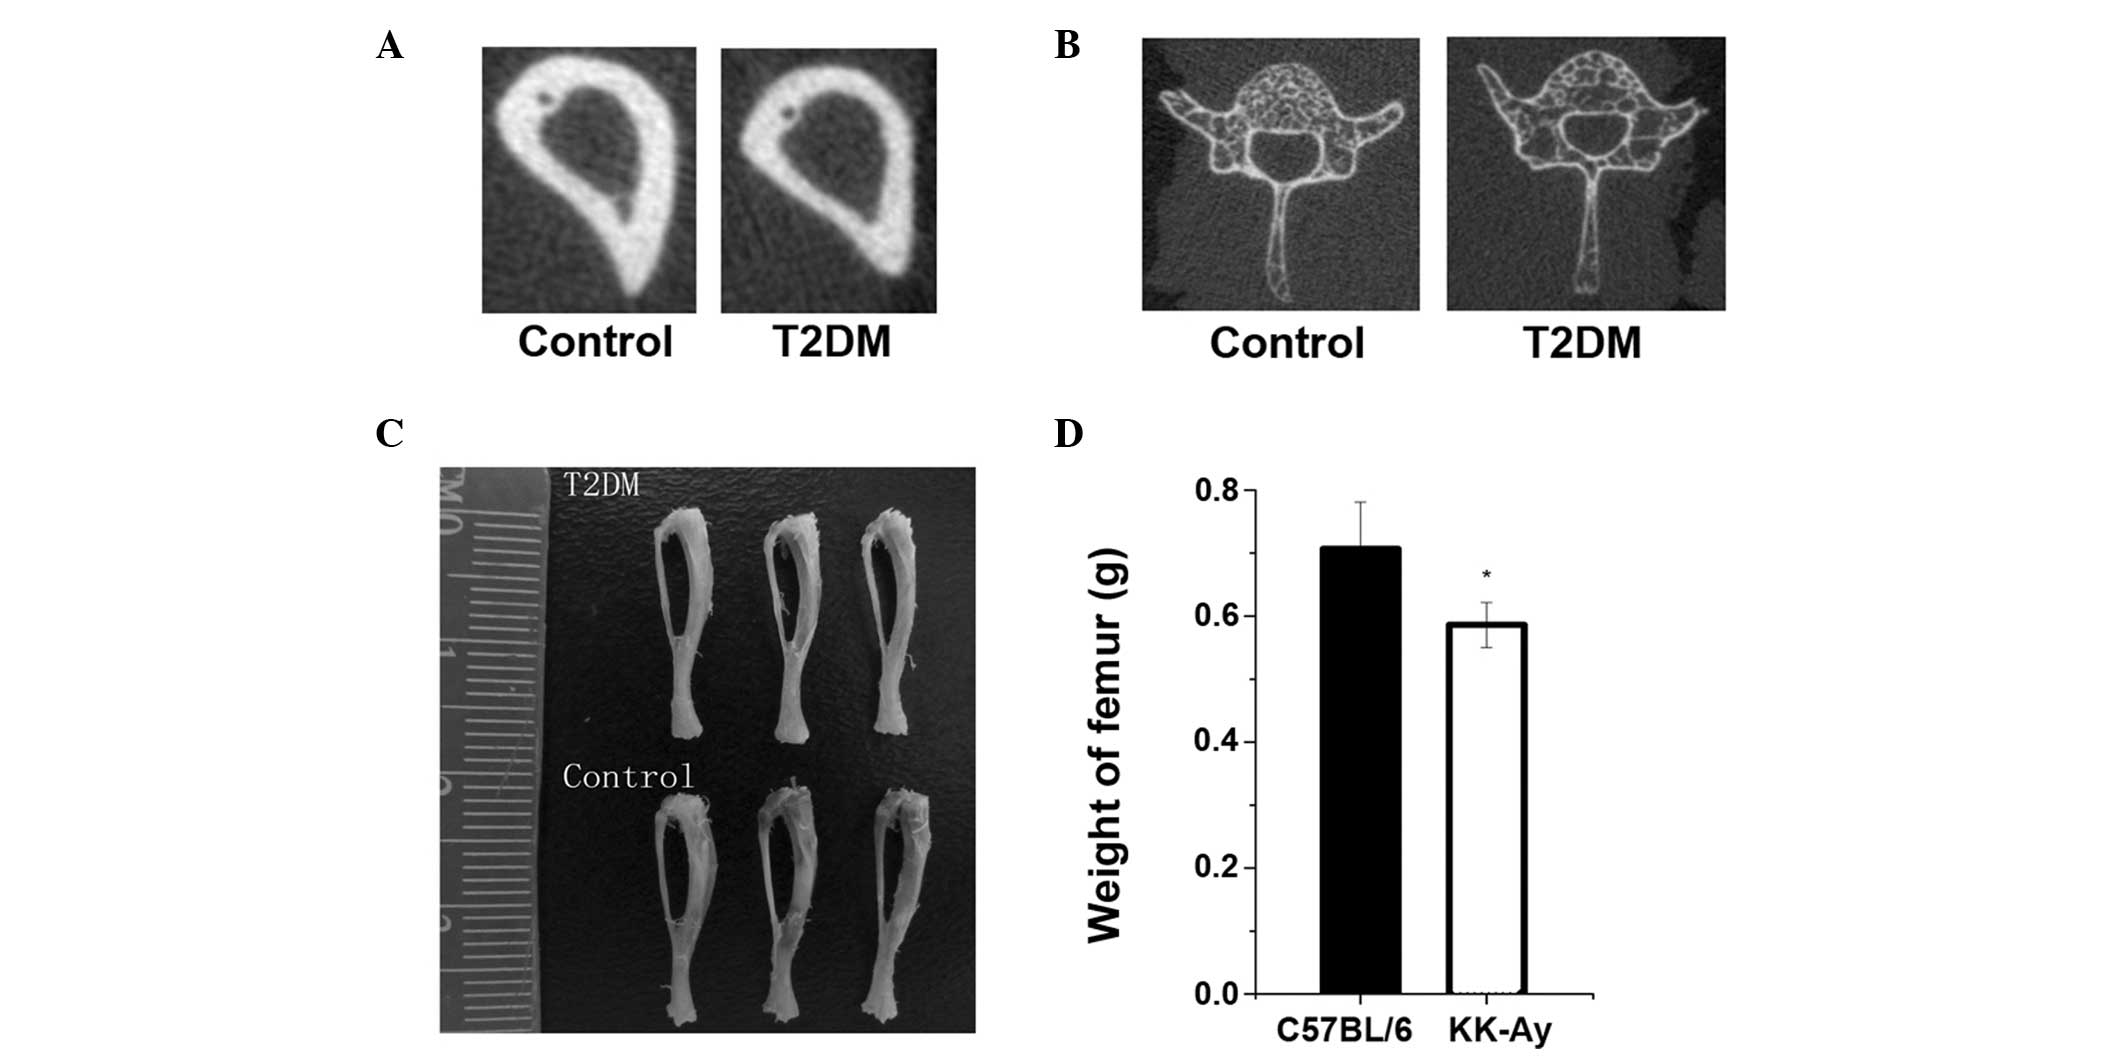
KK-Ay mice have lower BMD and trabecular
and cortical bone mass
The femora and tibiae in the T2DM group were smaller
and weighed less than those in the control group (Fig. 3). The bone mineralization density
distribution of trabecular and cortical bone was similar in the
KK-Ay and control mice; however, the density distribution in KK-Ay
mice was slightly lower than that in the control mice (Fig. 3), and the T2DM group had a
decreased bone content in the tibia compared with the control
group. Data regarding cortical bone geometry from the midshaft of
the tibia showed that T2DM bone also had a smaller cortical
perimeter due to decreased cortical area and thickness (Fig. 3 and Table II).
| Table IIBMD of cortical bone in C57BL/6 and
KK-Ay mice. |
Table II
BMD of cortical bone in C57BL/6 and
KK-Ay mice.
| Parameter | C57BL/6 mice,
n=8 | KK-Ay mice, n=8 | P-value |
|---|
| BMD (mg HA/cm) | 1321.7±108.2 | 803.4±87.2a | 0.004 |
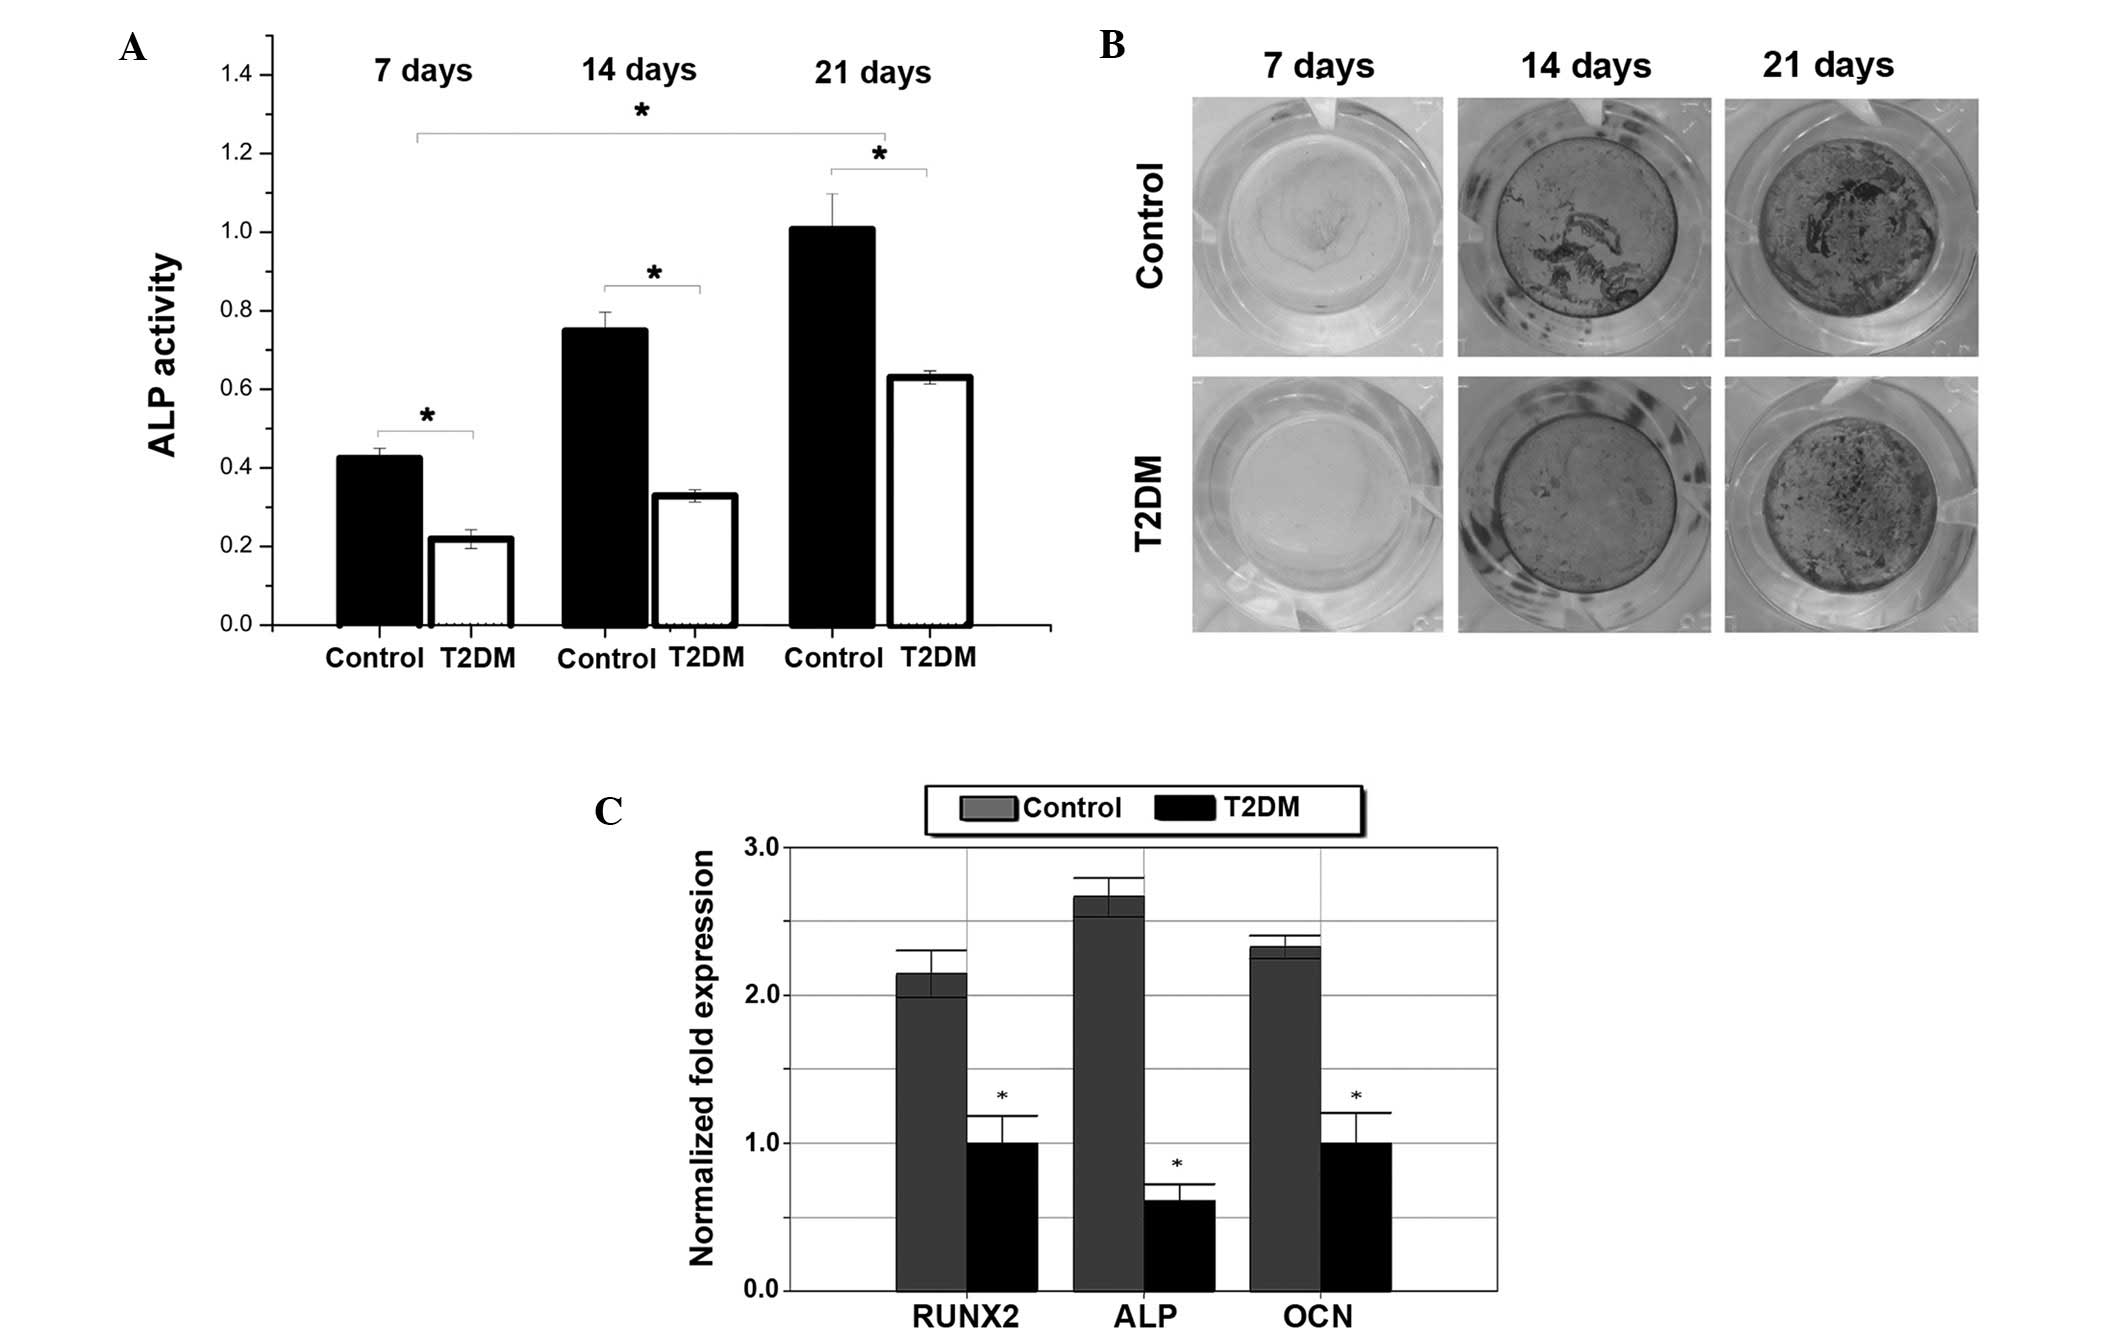
Impaired osteoblastic and osteoclastic
function in diabetic mice
To investigate the cellular mechanism for the low
bone mass in T2DM mice, osteoblast and osteoclast biology was
analyzed. The ALP activity of osteoblasts was reduced in T2DM mice
(Fig. 4A). The results from the
von Kossa staining showed impaired osteoblastogenesis in T2DM mice
compared with control mice (Fig.
4B). Furthermore, runt-related transcription factor 2 (RUNX2),
ALP and OCN levels were found to be reduced after 21 days of
osteogenic differentiation (Fig.
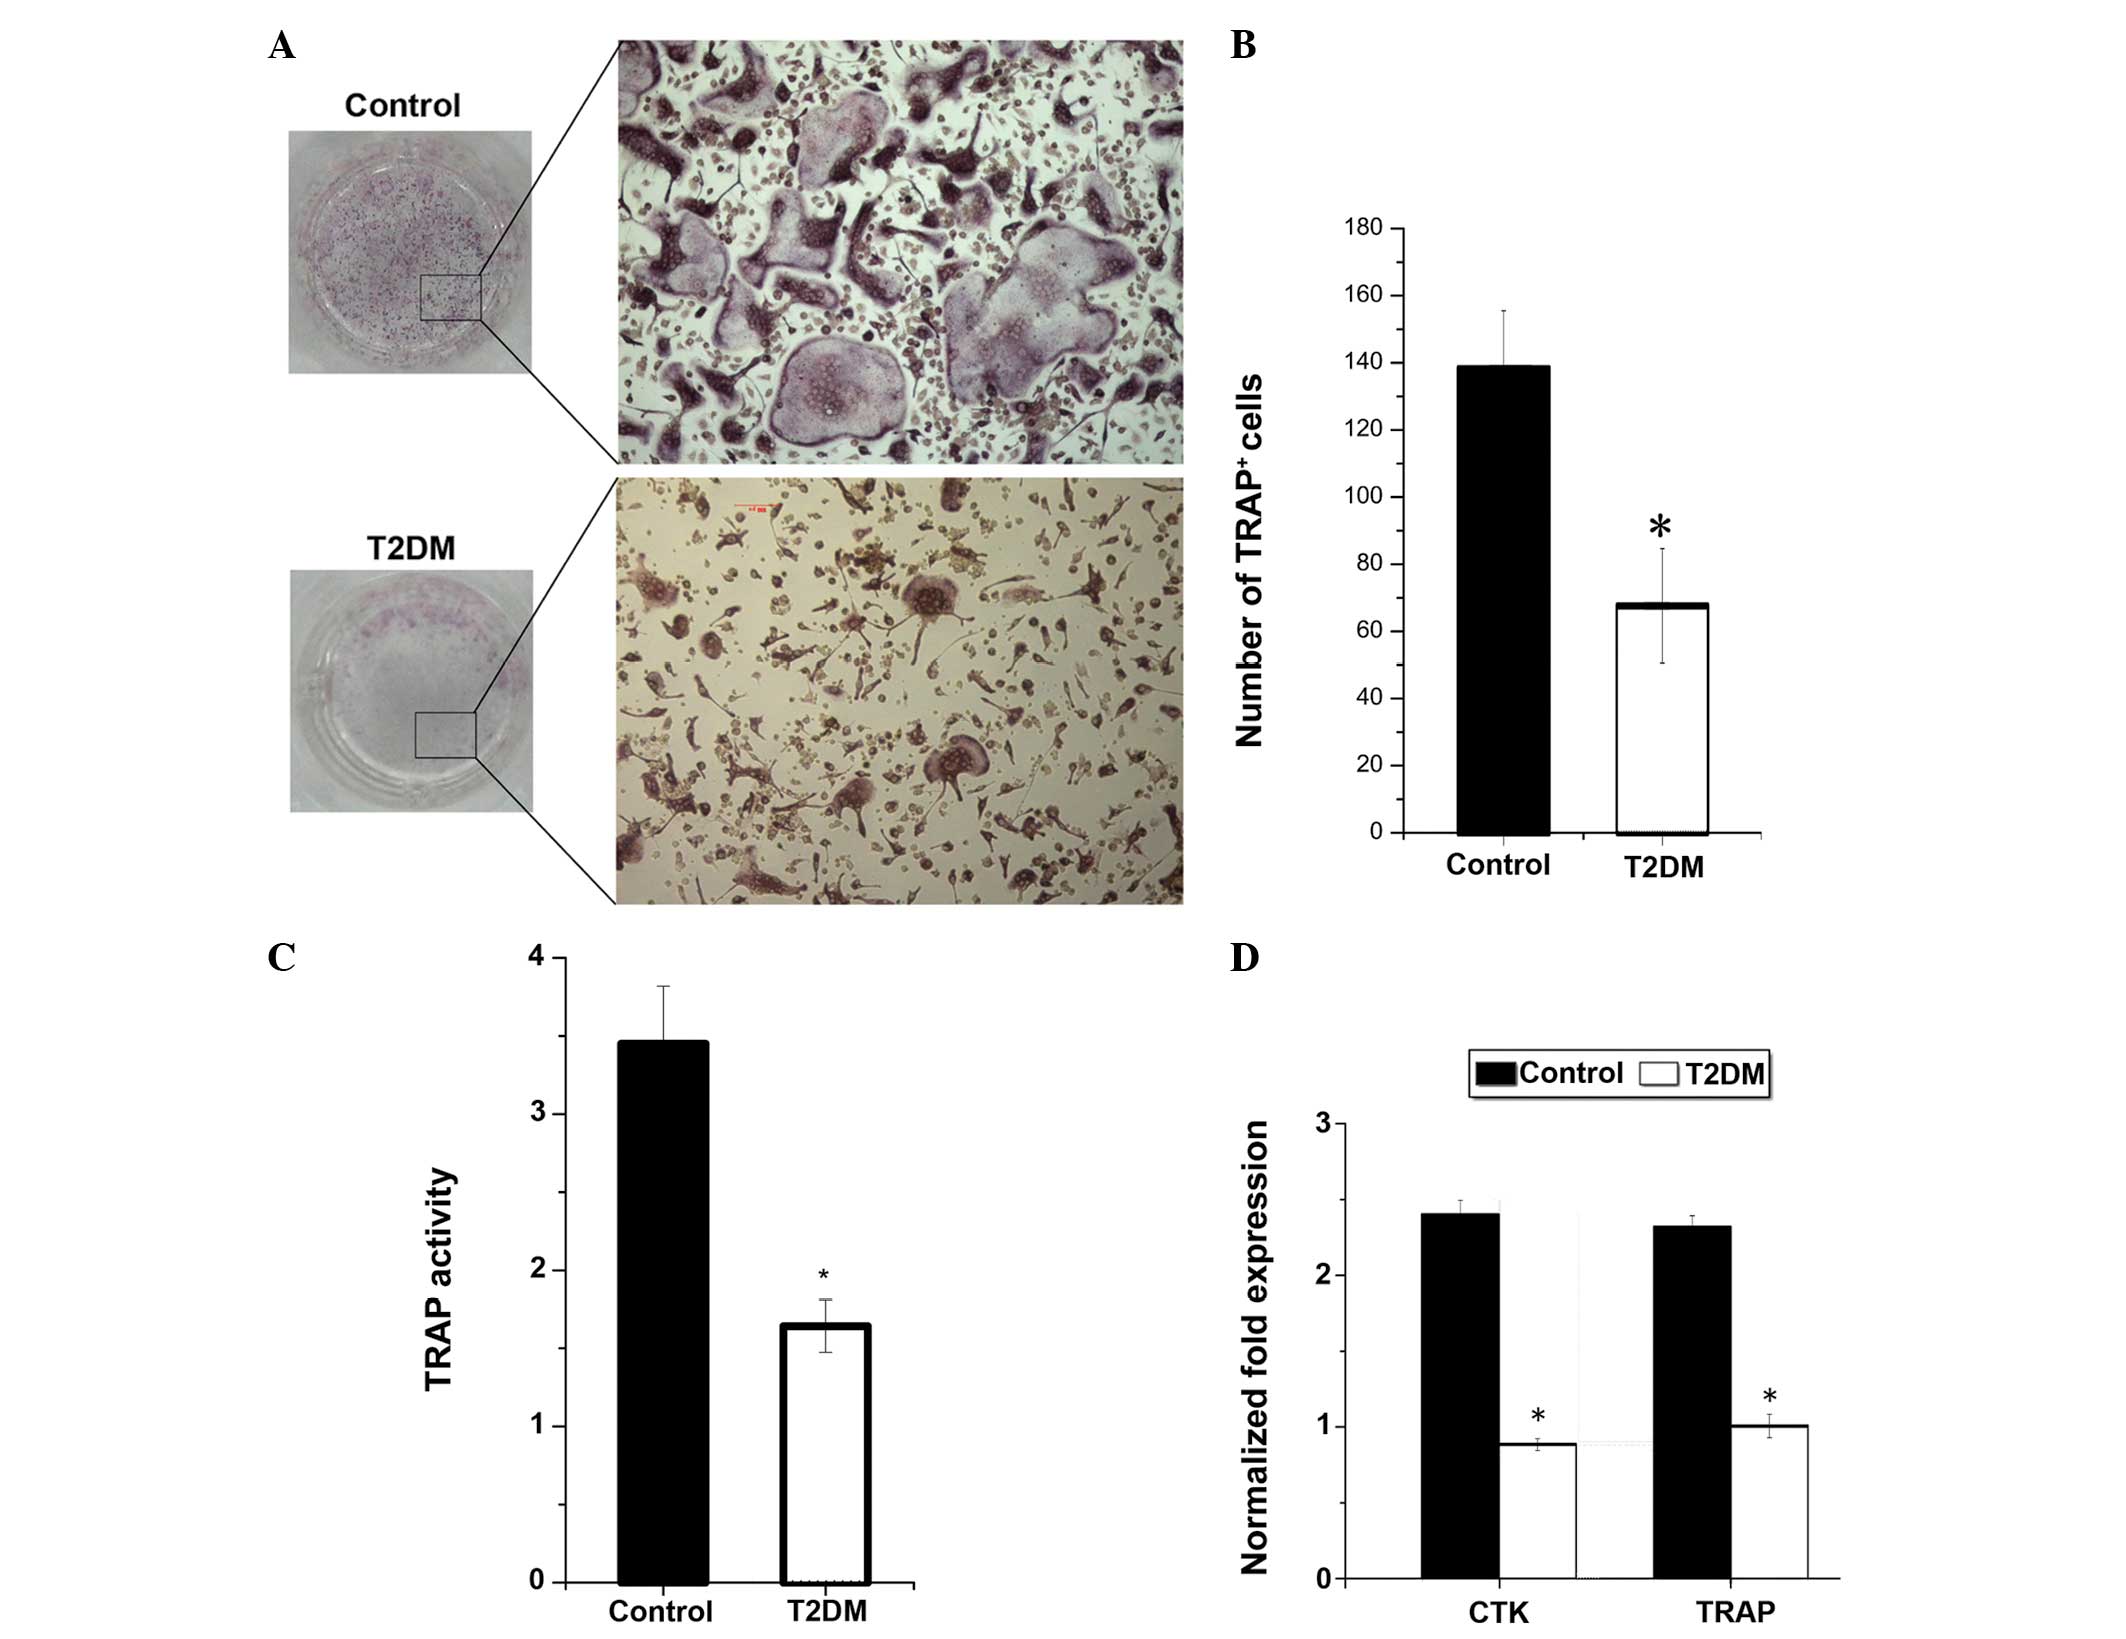
4C). Osteoclast function was impaired in T2DM mice; the number
of TRAP+ and multinucleated osteoclasts and the TRAP
activity of osteoclasts were reduced in T2DM mice (Fig. 5). In addition, the mRNA expressed
by osteoclasts, including TRAP and cathepsin K (CTK), were reduced
(Fig. 5).
Ultimate load of tibia is lower in T2DM
mice
Biomechanical analysis demonstrated that the
ultimate load of the tibia in the T2DM mice was lower than that in
control mice (Fig. 1B).
Discussion
T2DM is know to affect bone remodeling, including
decreased bone formation and impaired bone resorption. Therefore,
in the present study, bone homeostasis was investigated in a
hyperinsulinemic, hyperglycemic and obese T2DM mouse model. It was
shown in the mouse model that T2DM leads to decreased bone
turnover.
The data from the present study show that cortical
and trabecular BMD were decreased in the T2DM model. Similarly,
Hamann et al (9) previously
observed reduced BMD at different skeletal sites in Zucker Diabetic
Fatty rats. In addition to the bone analysis, the results from the
mechanical testing demonstrated that there was decreased bone
strength in mice with T2DM; T2DM mice exhibited reduced ultimate
load in the tibia compared with control mice. This suggests that
T2DM causes decreased BMD and bone strength, resulting in an
increased susceptibility to fracture. As a result of T2DM, the
impaired bone turnover may be responsible for the high risk of
fracture documented in clinical studies (10,11).
The results of the serum analysis in the present
study confirm the previously reported impaired bone turnover in
T2DM mice (12,13). The present study also showed that
the levels of bone turnover and formation, indicated by serum OCN
and ALP levels, were lower in T2DM mice than those in normal mice.
However, levels of bone resorption, indicated by serum TRAP levels,
were not significantly different between the two groups. By
contrast, a previous study found that circulating levels of TRAP in
patients with diabetes were significantly higher than those in
controls (14), while a study
investigating the serum bone turnover parameters in patients with
T2DM showed reduced bone formation (15) and unchanged bone resorption,
assessed by the levels of TRAP. However, evaluating the level of
bone metabolism using indicators in serum is not accurate;
therefore, in the present study, osteoblastogenesis and
osteoclastogenesis were assessed in the two groups of mice.
A previous in vivo study suggested that
osteoblast function is impaired in T2DM. Fujii et al
(16) reported a lower bone
formation rate and decreased gene expression of ALP and OCN in
spontaneously diabetic Troii rats, a model of non-obese T2DM
(16). The data from the present
study provide a cellular explanation for this result: Significant
impairment of osteoblastogenesis.
While T2MD is a common disease, there are
conflicting studies regarding the influence of T2DM on bone
resorption. In vivo, Kawashima et al (17) found evidence supporting increased
osteoclastogenesis in the diabetic bone microenvironment (17). In vitro, Huang et al
(18) reported that an elevated
insulin environment negatively regulated osteoclast differentiation
and the expression of RANK and c-fos (18), and these results were corroborated
by a study by Dienelt and zur Nieden (19). The data from the present study
suggest that bone resorption was impaired in the T2DM model due to
impaired osteoclast function. In addition, using monocytes derived
from normal animals, osteoclastogenesis was assessed under
high-glucose and insulin environments. The expression of osteoclast
gene markers, including CTK, TRAP and RANK, was found to be
decreased (data not shown). Along with the results from the TRAP
staining, these findings indicate that osteoclastogenesis in mice
with T2DM was decreased.
During the early stages of T2DM, the majority of
patients are overweight. Fat tissue is targeted by insulin and has
a key role in insulin resistance. Adipocytes also secrete factors
that inhibit the differentiation of osteoblasts (20), and a high-insulin environment is a
negative factor for bone formation (18). Therefore, for these reasons,
obesity is a promoting factor for osteoporosis in T2DM.
The present study had certain limitations. Firstly,
the extent of impaired of bone resorption and formation could not
be evaluated. In addition, young mice were used for these
experiments, and the study only lasted for 4 weeks. The results may
not be consistent in older mice, and most patients with T2DM in the
clinic are aged ≥30 years. Finally, the effect of the
microenvironment of the surrounding bone on the cells was not
investigated. Future studies may therefore explore
osteoclastogenesis and osteoblastogenesis in co-culture systems.
However, the results offer a novel insight into the cellular
mechanisms underlying T2DM pathology. The results suggest that a
T2DM mouse model exhibits bone loss predominantly due to suppressed
bone formation, rather than increased resorption. The hyperglycemia
and hyperinsulinemia in KK-Ay mice models the human pathology,
enhancing the current understanding of impaired bone metabolism in
T2DM.
Acknowledgements
This study was supported by a grant from the
National Natural Science Foundation of China (no. 81070691).
References
|
1
|
Yamaguchi T and Sugimoto T: Bone
metabolism and fracture risk in type 2 diabetes mellitus. Endocr J.
58:613–624. 2011. View Article : Google Scholar : PubMed/NCBI
|
|
2
|
Forsén L, Meyer HE, Midthjell K and Edna
TH: Diabetes mellitus and the incidence of hip fracture: results
from the Nord-Trøndelag Health Survey. Diabetologia. 42:920–925.
1999.PubMed/NCBI
|
|
3
|
Retzepi M and Donos N: The effect of
diabetes mellitus on osseous healing. Clin Oral Implants Res.
21:673–681. 2010. View Article : Google Scholar : PubMed/NCBI
|
|
4
|
Lecka-Czernik B: Bone loss in diabetes:
use of antidiabetic thiazolidinediones and secondary osteoporosis.
Curr Osteoporos Rep. 8:178–184. 2010. View Article : Google Scholar : PubMed/NCBI
|
|
5
|
Horcajada-Molteni MN, Chanteranne B,
Lebecque P, Davicco MJ, Coxam V, Young A and Barlet JP: Amylin and
bone metabolism in streptozotocin-induced diabetic rats. J Bone
Miner Res. 16:958–965. 2001. View Article : Google Scholar : PubMed/NCBI
|
|
6
|
Suzuki K, Sugimoto C, Takizawa M, Ishizuka
S, Kikuyama M, Togawa H, Taguchi Y, Nosaka K, Seino Y and Ishida H:
Correlations between bone mineral density and circulating bone
metabolic markers in diabetic patients. Diabetes Res Clin Pract.
48:185–191. 2000. View Article : Google Scholar : PubMed/NCBI
|
|
7
|
Wakasugi M, Wakao R, Tawata M, Gan N,
Koizumi K and Onaya T: Bone mineral density measured by dual energy
x-ray absorptiometry in patients with non-insulin-dependent
diabetes mellitus. Bone. 14:29–33. 1993. View Article : Google Scholar : PubMed/NCBI
|
|
8
|
Barrett-Connor E and Holbrook TL: Sex
differences in osteoporosis in older adults with
non-insulin-dependent diabetes mellitus. JAMA. 268:3333–3337. 1992.
View Article : Google Scholar : PubMed/NCBI
|
|
9
|
Hamann C, Goettsch C, Mettelsiefen J,
Henkenjohann V, Rauner M, Hempel U, Bernhardt R, Fratzl-Zelman N,
Roschger P, Rammelt S, Günther KP and Hofbauer LC: Delayed bone
regeneration and low bone mass in a rat model of insulin-resistant
type 2 diabetes mellitus is due to impaired osteoblast function. Am
J Physiol Endocrinol Metab. 301:E1220–E1228. 2011. View Article : Google Scholar : PubMed/NCBI
|
|
10
|
Strotmeyer ES, Cauley JA, Schwartz AV,
Nevitt MC, Resnick HE, Bauer DC, Tylavsky FA, et al: Nontraumatic
fracture risk with diabetes mellitus and impaired fasting glucose
in older white and black adults: the health, aging, and body
composition study. Arch Intern Med. 165:1612–1617. 2005. View Article : Google Scholar : PubMed/NCBI
|
|
11
|
Bonds DE, Larson JC, Schwartz AV,
Strotmeyer ES, Robbins J, Rodriguez BL, Johnson KC and Margolis KL:
Risk of fracture in women with type 2 diabetes: the Women’s Health
Initiative Observational Study. J Clin Endocrinol Metab.
91:3404–3410. 2006.
|
|
12
|
Zhou Y, Li Y, Zhang D, Wang J and Yang H:
Prevalence and predictors of osteopenia and osteoporosis in
postmenopausal Chinese women with type 2 diabetes. Diabetes Res
Clin Pract. 90:261–269. 2010. View Article : Google Scholar : PubMed/NCBI
|
|
13
|
Kanazawa I, Yamaguchi T, Yamamoto M,
Yamauchi M, Yano S and Sugimoto T: Serum osteocalcin/bone-specific
alkaline phosphatase ratio is a predictor for the presence of
vertebral fractures in men with type 2 diabetes. Calcif Tissue Int.
85:228–234. 2009. View Article : Google Scholar
|
|
14
|
Takizawa M, Suzuki K, Matsubayashi T,
Kikuyama M, Suzuki H, Takahashi K, Katsuta H, Mitsuhashi J, Nishida
S, Yamaguchi S, Yoshimoto K, Itagaki E and Ishida H: Increased bone
resorption may play a crucial role in the occurrence of osteopenia
in patients with type 2 diabetes: Possible involvement of
accelerated polyol pathway in its pathogenesis. Diabetes Res Clin
Pract. 82:119–126. 2008. View Article : Google Scholar : PubMed/NCBI
|
|
15
|
Okazaki R, Miura M, Toriumi M, Taguchi M,
Hirota Y, Fukumoto S, Fujita T, Tanaka K and Takeuchi A: Short-term
treatment with troglitazone decreases bone turnover in patients
with type 2 diabetes mellitus. Endocr J. 46:795–801. 1999.
View Article : Google Scholar : PubMed/NCBI
|
|
16
|
Fujii H, Hamada Y and Fukagawa M: Bone
formation in spontaneously diabetic Torii-newly established model
of non-obese type 2 diabetes rats. Bone. 42:372–379. 2008.
View Article : Google Scholar : PubMed/NCBI
|
|
17
|
Kawashima Y, Chen J, Sun H, Lann D, Hajjar
RJ, Yakar S and Leroith D: Apolipoprotein E deficiency abrogates
insulin resistance in a mouse model of type 2 diabetes mellitus.
Diabetologia. 52:1434–1441. 2009. View Article : Google Scholar : PubMed/NCBI
|
|
18
|
Huang S, Kaw M, Harris MT, Ebraheim N,
McInerney MF, Najjar SM and Lecka-Czernik B: Decreased
osteoclastogenesis and high bone mass in mice with impaired insulin
clearance due to liver-specific inactivation to CEACAM1. Bone.
46:1138–1145. 2010. View Article : Google Scholar : PubMed/NCBI
|
|
19
|
Dienelt A and zur Nieden NI: Hyperglycemia
impairs skeletogenesis from embryonic stem cells by affecting
osteoblast and osteoclast differentiation. Stem Cells Dev.
20:465–474. 2011. View Article : Google Scholar : PubMed/NCBI
|
|
20
|
Elbaz A, Wu X, Rivas D, Gimble JM and
Duque G: Inhibition of fatty acid biosynthesis prevents adipocyte
lipotoxicity on human osteoblasts in vitro. J Cell Mol Med.
14:982–991. 2010. View Article : Google Scholar : PubMed/NCBI
|