Introduction
Polycystic ovary syndrome (PCOS) is estimated to
affect 5–7% of premenopausal females and is associated with a
significant risk of developing type two diabetes (T2D),
independently of obesity (1). PCOS
is characterized by a hyperandrogenic state, and exposure to
exogenous testosterone in vivo has been associated with
low-grade chronic inflammation in rats and human females. Low-grade
chronic inflammation has an important function in the development
of insulin resistance, as it triggers the metabolic syndrome
(2,3). The risk of developing the metabolic
syndrome in adolescent females with PCOS is correlated with
increasing concentrations of bioavailable testosterone, an effect
which is independent of obesity (4). However, the mechanism by which
hyperandrogenism results in the development of low-grade chronic
inflammation remains undefined.
Studies have shown that in patients with PCOS, a
number of proinflammatory factors, such as interleukin-6 (IL-6),
macrophage chemotactic protein-1 (MCP-1) and tumor necrosis
factor-α (TNF-α), are positively correlated with serum testosterone
concentration. An association between low-grade chronic
inflammation and testosterone levels has been demonstrated by
intervention studies using simvas-tatin (5) and flutamide (6) in PCOS. When mononuclear cells from
the peripheral blood of PCOS patients were exposed to high-sugar
conditions in vitro, the concentration of TNF-α in the
supernatant was positively correlated with the serum testosterone
level. We hypothesised that excess androgen in PCOS may be a key
factor in the development of low-grade chronic inflammation
(7).
Adipocytes have a crucial function in low-grade
chronic inflammation as these cells are sources of cytokines (IL-6,
and MCP-1) that are secreted during the activation of certain
signalling cascades, which are involved in insulin resistance
(8). Current research also
suggests that low-grade chronic inflammation is initiated and
controlled by adipose tissue as weight loss is able to
significantly alleviate low-grade chronic inflammation (9,10).
Adipocytes are an important component of adipose tissue and are
classic insulin target cells. These cells have a function in the
storage and maintenance of energy, and in the balance of glucose
and lipid metabolism. In addition, fat cells, in a similar manner
to immune cells, activate complement components, such as C3 and
produce proinflammatory mediators and chemokines, such as IL-6 and
MCP-1, thus triggering inflammation signaling pathways, including
p38 mitogen-activated protein kinase (p38-MAPK), extracellular
signal-regulated kinase (ERK), inhibitor of nuclear factor-κB
(IKK-β/NF-κB) and protein kinase θ/δ (PKCθ/δ), and promoting
macrophage infiltration. In addition, adipocytes are target cells
for androgen.
IL-6 is a multipotent cytokine, which is an
important molecule in inflammatory reactions. Furthermore, 30% of
IL-6 is produced by adipocytes (11). IL-6 promotes insulin resistance
(IR) by inducing the expression of cytokine signalling suppressor
factor (SOCS), thus inhibiting the phosphorylation of the insulin
receptor substrate 1 (IRS-1) tyrosine residue, which blocks insulin
signal transduction. IL-6 is also able to inhibit glucose
transporter-4 (GLUT4) expression (12), resulting in IR. The production of
IL-6 is closely correlated to the activation of NF-κB (13).
Chemoattractant proteins, or chemokines, are small
proteins that activate (chemoattract) leukocytes during low-grade
chronic inflammation. MCP-1, secreted as a chemokine by adipocytes,
increases the flux of monocytes into adipose tissue. Measures of
chemokine levels are closely associated with insulin resistance,
which is in accordance with other studies (14, 15). MCP-1 is able to induce insulin
resistance through a number of pathways. It is known to promote the
production of free fatty acids (FFAs) (16). In addition, MCP-1 promotes
monocyte/macrophage activation and aggregation (17,18),
resulting in the development of adipose tissue inflammation.
NF-κB has been implicated in low-grade chronic
inflammation and in acute inflammation. NF-κB is a family of
homodimeric or heterodimeric transcription factors, which includes
p50, p52, p65, relb and c-rel. Free NF-κB translocates to the
nucleus and binds to a common DNA sequence motif, which includes
the b site, in a broad spectrum of genes, including inflammatory
cytokines and chemokines. The ERK1/2 pathways are also known to
activate NF-κB (19). Thus, the
production of proinflammatory mediators, including inflammatory
cytokines and chemokines, is controlled by the activity of
transcription factors, such as NF-κB and ERK1/2. A number of
studies have implicated chronic activation of the proinflammatory
transcription factor, NF-κB, as the primary pathway, of all the
signaling pathways, that link inflammation with obesity and T2D
(20,21). Studies have reported that in
different types of cells, androgen selectively activates p38MAPK
(22), NF-κB (23) and ERK1/2 (24).
Therefore, in the present study, the impact of
testosterone on the expression of IL-6 and MCP-1, as well as on the
NF-κB and ERK1/2 signalling pathways, was investigated in 3T3-L1
adipocytes.
Materials and methods
Cell culture
3T3-L1 preadipocytes (American Type Culture
Collection, Manassas, VA, USA) were maintained in Dulbecco’s
modified Eagle’s medium (DMEM; Nacalai Tesque, Kyoto, Japan),
containing 10% fetal bovine serum (FBS; Sanko Junyaku, Eidia Cp.
Tokyo, Japan) and antibiotics. The preadipocytes were then
incubated at 37°C for 48 h in a humidified atmosphere of 10%
CO2/95% air. The differentiation of 3T3-L1 preadipocytes
from mature adipocytes was induced using insulin, dexamethasone and
3-isobutyl-1-methlyxanthine, as described previously (25), which were all purchased from
Sigma-Aldrich (St. Louis, MO, USA). The mature 3T3-L1 adipocytes
were used at day 8, following the induction of differentiation.
Hypertrophied 3T3-L1 cells with larger lipid droplets cultured up
to day 10 were used. The medium was removed and changed for
non-serum DMEM for 24 h. The supernatant was collected for
subsequent measurements.
Grouping
Matured 3T3-L1 adipocytes were grouped and treated
as follows: 1, testosterone-only group, 3T3-L1 adipocytes were
treated with testosterone (Sigma-Aldrich) at concentrations from 1
nmol/l to 10 μmol/l for 10 min, 30 min, 12 h, 24 h or 48 h,
and matured 3T3-L1 adipocytes without acted as a blank control
group; 2, lipopolysaccharide (LPS) and testosterone group, LPS
(Sigma-Aldrich) was dissolved in sterile, pyrogen-free
phosphate-buffered saline (Double Helix, Shanghai, China), and the
3T3-L1 adipocytes were pre-treated with testosterone at
concentrations ranging from 1 nmol/l to 10 μmol/l for 10
min, 30 min 12, 24 and 48 h, following which LPS (1 μg/ml)
was added (26) for 6 h, with
3T3-L1 adipocytes treated only with LPS as the control group, and a
group without any treatment acted as a blank control. 3, PD98059
(ERK1/2 inhibitor; Sigma-Aldrich), LPS and testosterone group.
PD98059 (50 μmol/l) pre-treatment for 2 h, followed by 10
μmol/l testosterone treatment for 12 h, then 1 μg/ml
LPS treatment for 6 h. 3T3-L1 adipocytes treated without PDT8059,
LPS or testosterone as control groups, and a group without any
treatment acting as a blank control. 4, PDTC (NF-κB inhibitor;
Sigma-Aldrich), LPS and testosterone group. PDTC (100
μmol/l) pre-treatment for 2 h, followed by 10 μmol/l
testosterone treatment for 12 h, then 1 μg/ml LPS treatment
for 6 h. 3T3-L1 adipocytes treated without PDTC, LPS or
testosterone as control groups, and a group without any treatment
acted as a blank control.
Detecting IL-6 and MCP-1
concentrations
The supernatant of the cells treated as described
above, was collected into a 1.5 ml centrifuge tube, was centrifuged
at 2,000 × g for 10 min and IL-6 and MCP-1 concentrations were
determined using a commercial mouse IL-6 and MCP-1 quantikine
enzyme-linked immunosorbent assay kit, according to the
manufacturer’s instructions (R&D Systems, Shanghai, China).
Absorbance at 450 nm was measured and corrected using the 540 nm
reading on a Benchmark microplate reader, Model 680 (Bio-Rad
Laboratories, Hercules, CA, USA). Data were analysed using
Microplate Manager III software (Bio-Rad Laboratories).
Detection of NF-κB (p65) transcription
factor DNA binding activity
Cellular nuclear extracts were prepared using the
NF-κB (p65) Transcription Factor Assay kit according to the
manufacturer’s instrucations (Abnova, Walnut, CA, USA). The
protocol was as follows: Complete transcription factor binding
assay buffer (CTFB) was prepared. CTFB (90 μl) per sample
well (or 80 μl if adding competitor dsDNA or 100 μl
for the blank control) was added to the blank and non-specific
binding wells. Competitor dsDNA (10 μl) was then added to
the appropriate wells. A positive control (10 μl) was also
added to the appropriate wells. Cellular nuclear extracts
containing NF-κB (10 μl) were also added to appropriate
wells. The sample was incubated overnight at 4°C without agitation.
Subsequently, each well was washed five times using 200 μl
of 1X wash buffer. Diluted rabbit polyclonal NF-κB (p65) antibody
(100 μl; 06–418; 1:1000, EMD Millipore, Billerica, MA, USA)
was added to each well, with the exception of blank wells. The
treatments were incubated for 1 h at room temperature without
agitation. Each well was washed five times using 200 μl of
1X wash buffer. Diluted goat anti-rabbit secondary antibody (100
μl) was added to the wells, with the exception of the blank
wells. Wells were incubated for 1 h at room temperature without
agitation. Each well was washed five times using 200 μl of
1X wash buffer. Developing solution (100 μl) was added to
each well. Wells were incubated for 15–45 min with gentle
agitation. Stop solution (100 μl) was added to each well and
absorbance was measured at 450 nm using a Benchmark microplate
reader, Model 680 (Bio-Rad Laboratories).
Electrophoretic mobility shift assay
(EMSA)
Cellular nuclear extracts were prepared using the
Chemiluminescent EMSA kit according to the manufacturer’s
instructions (Viagene Biotech, Tampa, FL, USA). Briefly, 6%
polyacrylamide gel in 0.5% Tris/Borate/EDTA (TBE) (Double Helix)
was prepared. The gel was placed in the electrophoresis unit
(Double Helix), and the wells were flushed, such that the gel
underwent pre-electrophoresis for 30–60 min at 100 V. The bind
reaction [containing: 12 μl double-distilled water, 10X 4
μg binding buffer, 1 μl poly L-lysine, 1 μl
Poly (deoxyinosinic-deoxycytidylic) acid, 4 μg cellular
nuclear extracts and 2 μl Detect Biotin-labeled DNA; all
from Chemiluminescent EMSA kit] was incubated at room temperature
for 20 min. Six X loading buffer (4 μl) was added, the wells
were flushed and 10 μl of each sampler was loaded onto the
4–6% polyacrylamide gel. The current was switched to 100 V, and the
samples underwent electrophoresis until the bromophenol blue dye
had migrated approximately 2/3 down the length of the gel.
Electrophoretic transfer of the binding reaction to Nylon membrane
(Shanghai-seok Optoelectronics Technology Co., Ltd., Shanghai,
China) was conducted. Transfer was performed at 100 V for 45 min.
The membrane was placed on a dry paper towel with the bromophenol
blue side up following the completion of the transfer. Cross-link
transfer of DNA to the membrane was performed using a UV-light
cross-linking instrument (Scientz 03-II; Ningbo Scientz
Biotechnology Co., Ltd, Ningbo, China) equipped with 254 nm bulbs
for 15 min. Finally the biotin-labelled DNA was detected by the
Chemiluminescent EMSA kit; membranes were placed in a film cassette
(Shanghai Fuji Medical Equipment Co., Ltd., Shanghai, China) and
exposed to X-ray film (Premier Lab Supply, Port St. Lucie, FL, USA)
for 2–5 min, then developed.
Western blot analysis
Whole cell lysates were prepared by lysing cells
using a radioimmunoprecipitation assay lysis buffer with proteinase
inhibitor phenylmethylsulfonyl fluoride (1 mM) and phosphatase
inhibitor NaF (1 mM), which were obtained from Sigma-Aldrich. Equal
amounts of protein fractions of the lysates with antibodies were
resolved over sodium dodecyl sulphate-polyacrylamide gel
electrophoresis and transferred to the polyvinylidene difluoride
membrane (Immobilon-P; Millipore, Billerica, MA, USA). Proteins
were detected using primary antibodies followed by horseradish
peroxidase-conjugated secondary antibodies. Comparable loading of
proteins on the gel was verified by re-probing the blots with an
antibody specific for the reference gene, β-actin. Primary
antibodies specific for phospholated Ser536p65-NF-κB
(3036; 1:1,500; mouse monoclonal), total NF-κB (3034; 1:2,000;
polyclonal), phospholation ERK1/2 (9101; 1:2,000; polyclonal),
total ERK1/2 (9102; 1:2,000; polyclonal), phospholated p38MAPK
(5104; 1:2,000; monoclonal), total p38MAPK (9212; 1:3,000;
polyclonal) and β-actin (3700; 1:3,000; monoclonal) were obtained
from Cell Signaling Technology Inc. (Boston, MA, USA), and
conjugated secondary antibodies were obtained from Santa Cruz
Biotechnology, Inc. (Santa Cruz, CA, USA). Image J 1.38 image
analysis software was used to analyze and quantify the relative
expression of blots.
Reverse transcription-polymerase chain
reaction (RT-PCR)
Total RNA was extracted from 5×10⁵ cells
using a commercial kit (TRIzol Reagent, Invitrogen Life
Technologies, Carlsbad, CA, USA) according to the manufacturer’s
instructions, and was spectrophotometrically quantified (Biomate 3,
Thermo Electron Corp. Madison, WI, USA). Total RNA (1 μg)
was reverse transcribed using a high-capacity cDNA Archive kit
(Applied Biosystems Life Technologies, Beijing, China) and random
primers according to the manufacturer’s instructions. In addition,
0.5 μg total cDNA was used to quantify the levels of MCP-1
and IL-6 cDNA through RT-PCR. β-actin cDNA was used as an
endogenous control for final normalization.
RT-PCR was conducted using the following primers
(Takara Bio, Inc., Dalian, China): Forward:
5′-CCACTTCACAAGTCGGAGGCTTA-3′ and reverse:
5′-GCAAGTGCATCATCGTTGTTCATAC-3′ for IL-6, forward:
5′-GCATCCACGTGTTGGCTCA-3′ and reverse:
5′-CTCCAGCCTACTCATTGGGATCA-3′ for MCP-1 and forward:
5′-CATCCGTAAAGACCTCTATGCCAAC-3′ and reverse:
5′-ATGGAGCCACCGATCCACA-3′ for β-actin.
Statistical analysis
All data are expressed as the mean ± standard
deviation. mRNA data were log-transformed prior to analysis.
Statistical analysis software SPSS 15.0 (SPSS, Inc., Chicago, IL,
USA) was used to perform two-way analysis of variance (ANOVA) on
repeated measures in order to evaluate the effect of exercise
(time). Differences between specific time points were determined
using the Student-Newman-Keuls test. Student’s t-test was used to
determine any difference between the control and the carbohydrate
trials at the end of the exercise. P<0.05 was considered to
indicate a statistically significant difference.
Results
Effects of testosterone on IL-6 and MCP-1
expression with or without LPS
Two-way ANOVA for supernatant IL-6 and MCP-1
concentrations in different treatment groups, suggested that
testosterone increases the concentrations of IL-6 and MCP-1 in the
supernatant, compared with that in blank controls. The
concentration with the most marked promoting activity was 10
μmol/l testosterone for a period of 24 h, and the
differences were statistically significant (P<0.05; Fig. 1A and B). The results also showed
that with 10 μmol/l testosterone pre-treatment for 24 h and
subsequent LPS-treatment for 6 h, the expression of IL-6 and MCP-1
in 3T3-L1 adipocytes was greater than that in the LPS-only group or
the testosterone-only group (Fig. 1C
and D). Testosterone, used as pre-treatment in 3T3-L1
adipocytes, dramatically augmented the LPS-stimulated production of
IL-6 and MCP-1 in the supernatants (P<0.05). Testosterone
induced IL-6 and MCP-1 expression, and also enhanced LPS-induced
IL-6 and MCP-1 expression in 3T3-L1 adipocytes, although not in a
time- or dose-dependent manner.
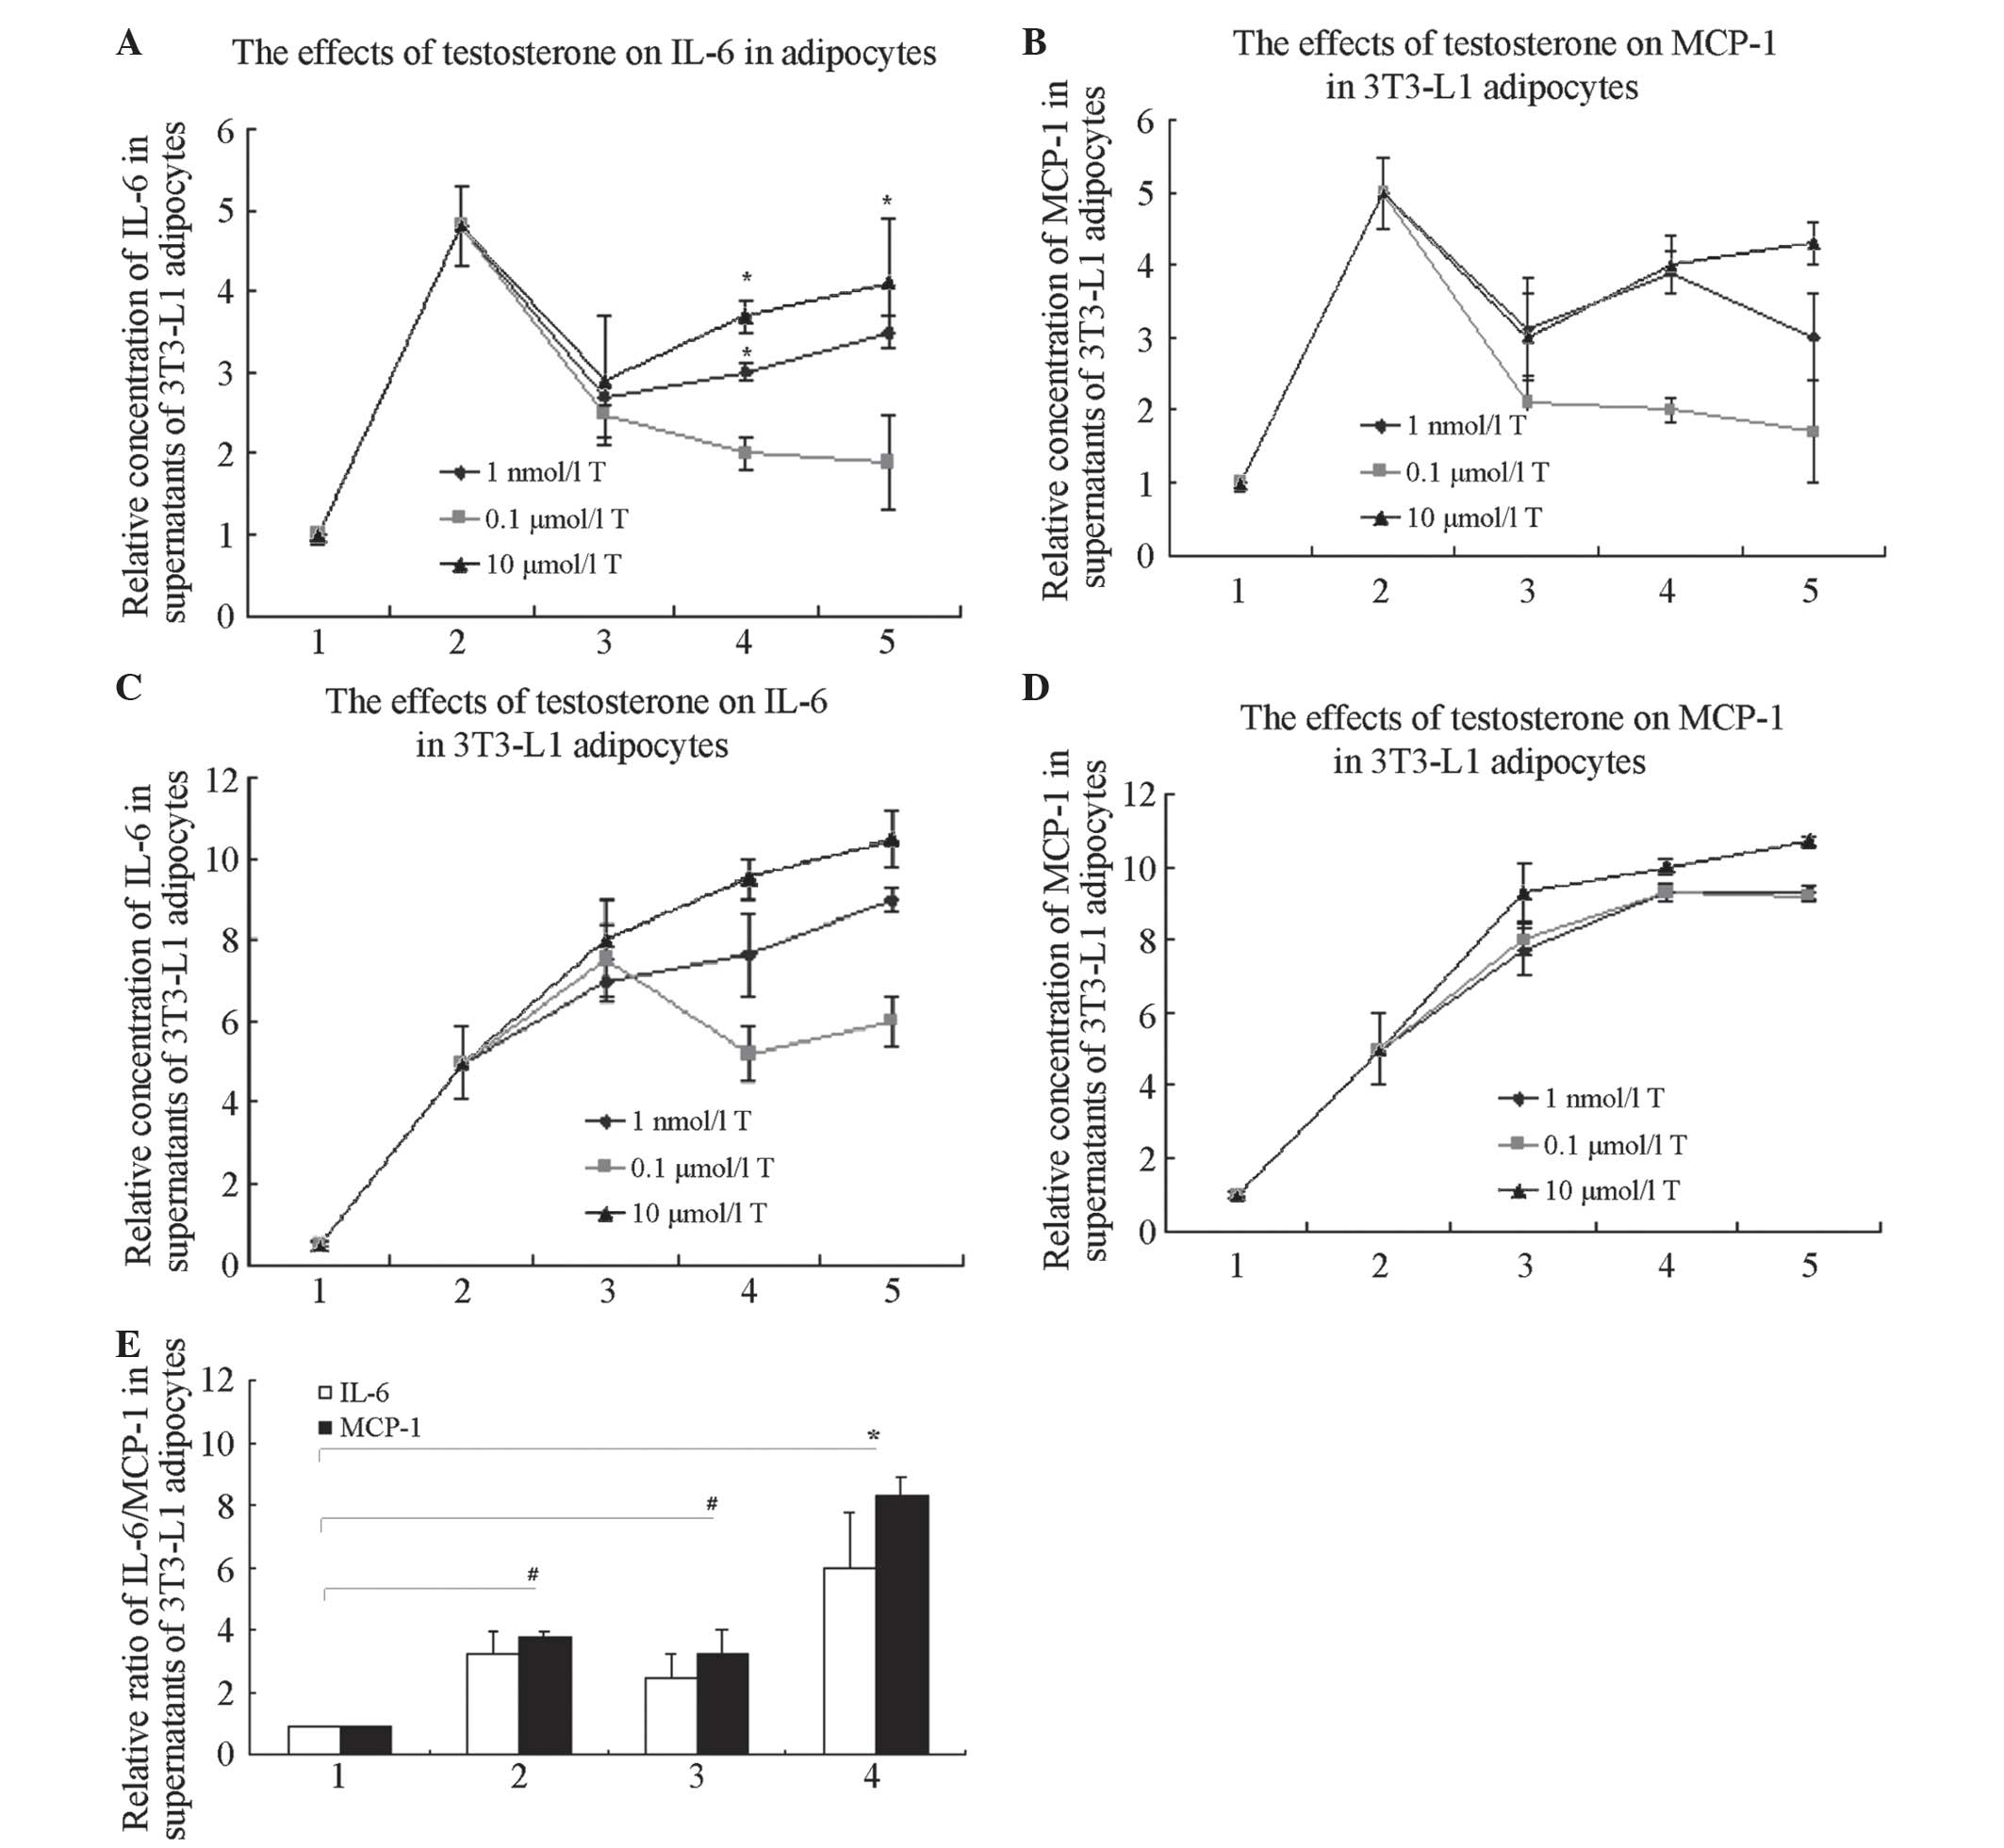 | Figure 1T increases the expression of
LPS-induced inflammatory factors, IL-6 and MCP-1, in 3T3-L1
adipocytes, but not in a time- or dose-dependent manner. (A)
Effects of T on the concentration of IL-6 in supernatants of 3T3-L1
adipocytes. *P<0.05 compared with controls. In groups
with 10 μmol/l T treatment for 24 h, the concentration of
IL-6 in the supernatants was higher than that in any other
T-only-treated group (P<0.05). 1, controls; 2, 1 μg/ml
LPS treatment for 6 h; 3, T treatment for 12 h; 4, T treatment for
24 h; and 5, T treatment for 48 h. (B) Effects of T on the
concentration of MCP-1 in supernatants of 3T3-L1 adipocytes. In
groups with 10 μmol/l T treatment for 24 h, the
concentration of MCP-1 in the supernatants was higher than that in
the other T-only-treated groups (P<0.05). 1, controls; 2, 1
μg/ml LPS treatment for 6 h; 3, T treatment for 12 h; 4, T
treatment for 24 h; and 5, T treatment for 48 h. (C) Effects of T
on the concentration of IL-6 in supernatants in 3T3-L1 adipocytes
with LPS. In the groups with 10 μmol/l T pre-treated for 24
h with LPS added, the concentration of IL-6 in the supernatants was
greater than that of the other T-pre-treated groups (P<0.05). 1,
controls; 2, 1 μg/ml LPS treated 6 h; 3, T pre-treated 12 h,
then added 1 μg/ml LPS treated 6 h; 4, T pre-treated 24 h,
then added 1 μg/ml LPS treated 6 h; 5, T pre-treated 48 h,
then added 1 μg/ml LPS treated 6 h. (D) Effects of T on the
concentration of MCP-1 in supernatants in 3T3-L1 adipocytes with
LPS. In groups with 10 μmol/l T pre-treatment for 24 h with
subsequent LPS, the concentration of MCP-1 in the supernatants was
higher than that in the other T-pre-treated groups (P<0.05). 1,
controls; 2, 1 μg/ml LPS treatment for 6 h; 3, T
pre-treatment for 12 h, with subsequent 1 μg/ml LPS
treatment for 6 h; 4, T pre-treatment for 24 h, with subsequent 1
μg/ml LPS treatment for 6 h; and 5, T pre-treatment for 48
h, with subsequent 1 μg/ml LPS treatment for 6 h. (E)
Effects of T on the concentration of MCP-1 and IL-6 in supernatants
of 3T3-L1 adipocytes with or without LPS (*P<0.01 and
#P<0.05). 1, controls; 2, 1 μg/ml LPS
treatment for 6 h; 3, 10 μmol/l T treatment for 12 h; and 4,
10 μmol/l T pre-treatment for 12 h, with subsequent 1
μg/ml LPS treatment for 6 h. T, Testosterone; LPS,
lipopolysaccharide; IL-6, interleukin-6. |
Based on these results, 10 μmol/l
testosterone treatment for 24 h was subsequently used to analyse
the effects of testosterone on the protein expression of IL-6 and
MCP-1 in supernatants of 3T3-L1 adipocytes, with or without LPS
treatment.
Testosterone increases LPS-induced
expression of inflammatory factors (IL-6, MCP-1) mRNA expression in
3T3-L1 adipocytes
The 3T3-L1 adipocytes treated with 10 μmol/l
testosterone for 12 h exhibited significantly higher IL-6 and MCP-1
mRNA than other groups treated with testosterone only for different
time periods, at different doses (P<0.05; Fig. 2A). The 3T3-L1 adipocytes
pre-treated with 10 μmol/l testosterone for 12 h, with the
addition of LPS for 6 h, exhibited significantly higher
concentrations of IL-6 and MCP-1 mRNA compared with any other group
(P<0.05; Fig. 2B). In
subsequent experiments, 10 μmol/l testosterone for 12 h was
used to detect the mRNA expression of IL-6 and MCP-1 (Fig. 2C).
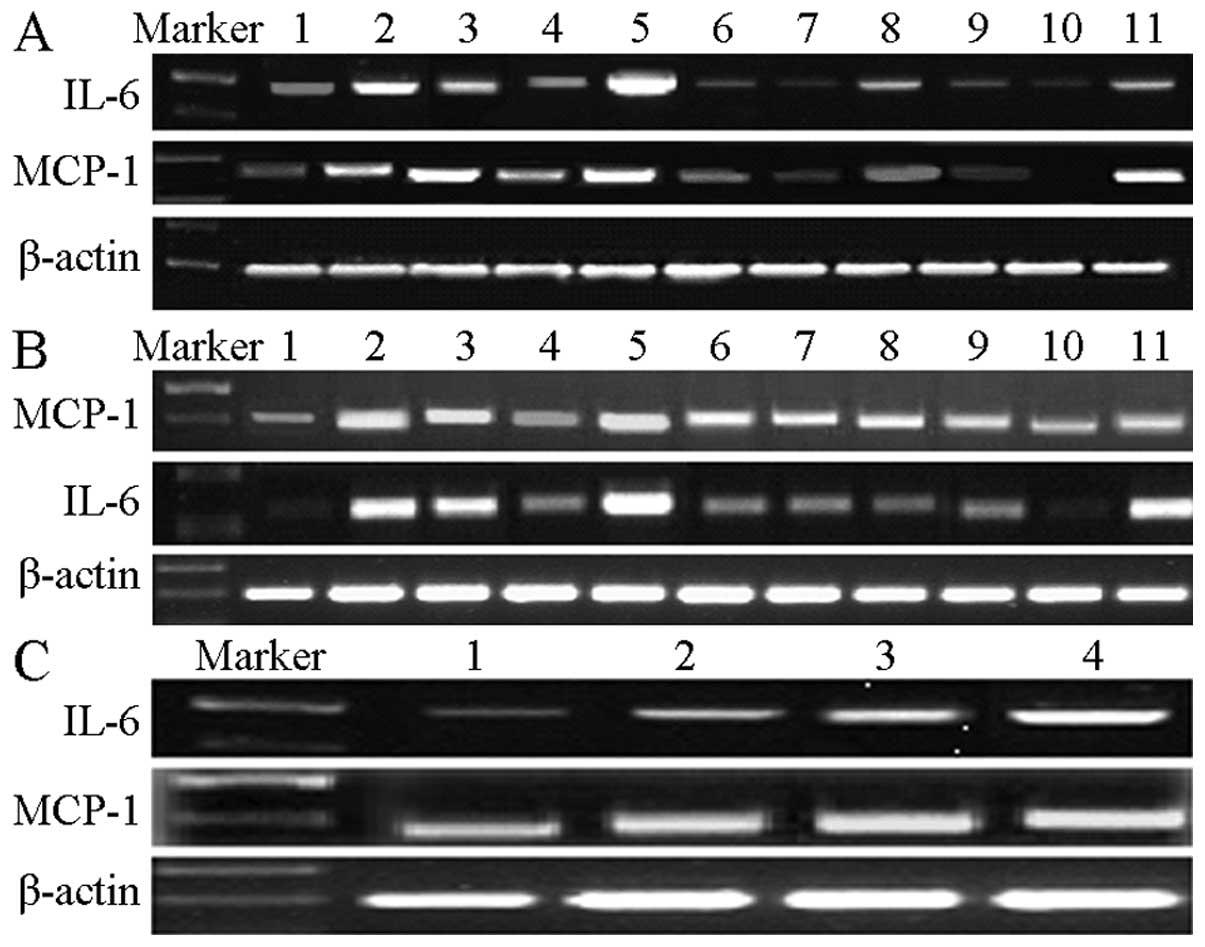 | Figure 2T increased the mRNA expression of
LPS-induced inflammatory factors, IL-6 and MCP-1, in 3T3-L1
adipocytes. Total RNA was isolated, and IL-6 and MCP-1 expression
was measured through reverse transcription polymerase chain
reaction. Images shown are representative images from ≥3
independent experiments. (A) T induced the mRNA expression of IL-6
and MCP-1 in 3T3-L1 adipocytes compared with blank controls, in
particular in the group with 10 μmol/l T treatment for 12 h.
Lane 1, blank controls; lane 2, LPS treatment for 6 h; lane 3, 1
nmol/l T treatment for 12 h; lane 4, 0.1 μmol/l T treatment
for 12 h; lane 5, 10 μmol/l T treatment for 12 h; lane 6, 1
nmol/l T treatment for 24 h; lane 7, 0.1 μmol/l T treatment
for 24 h; lane 8, 10 μmol/l T treatment for 24 h; lane 9, 1
nmol/l T treatment for 48 h; lane 10, 0.1 μmol/l T treatment
for 48 h; and lane 11, 10 μmol/l T treatment for 48 h. (B) T
promoted LPS-induced IL-6 and MCP-1 mRNA expression in 3T3-L1
adipocytes compared with blank controls and the LPS-treated group,
in particular in the group with 10 μmol/l T pre-treatment
for 12 h. Lane 1, blank controls; lane 2, LPS treatment for 6 h.
Lanes 3-11 T pre-treatments were followed with LPS treatment for 6
h. Lane 3, 1 nmol/l T pre-treatment for 12 h; lane 4, 0.1
μmol/l T pre-treatment for 12 h; lane 5, 10 μmol/l T
pre-treatment for 12 h; lane 6, 1 nmol/l T pre-treatment for 24 h;
lane 7, 0.1 μmol/l T pre-treatment for 24 h; lane 8, 10
μmol/l T pre-treatment for 24 h; lane 9, 1 nmol/l T
treatment for 48 h; lane 10, 0.1 μmol/l T pre-treatment for
48 h; and lane 11, 10 μmol/l T pre-treatment for 48 h. (C)
Effects of T on the concentration of MCP-1 and IL-6 in supernatants
of 3T3-L1 adipocytes with or without LPS. Lane 1, controls; lane 2,
1 μg/ml LPS treated for 6 h; lane 3, 10 μmol/l T
treated for 12 h; and lane 4, 10 μmol/l T pre-treated 12 h
with subsequent 1 μg/ml LPS treatment for 6 h. T,
Testosterone; LPS, lipopolysaccharide; MCP-1, macrophage
chemotactic protein-1; IL-6, interleukin-6. |
Testosterone activates the ERK1/2 and
NF-κB signalling pathways in 3T3-L1 adipocytes with or without LPS
treatment
Testosterone promoted the phosphorylation of NF-κB
Ser536-p65. Specifically, testosterone activated NF-κB, at a
concentration of 10 μmol/l testosterone for 12 h, as
determined in preliminary experiments (data not shown). Therefore,
10 μmol/l testosterone for 12 h was used in subsequent
experiments. Testosterone promoted and enhanced LPS-induced
phosphorylation of NF-κB p65 (Fig.
3A) and also promoted and enhanced LPS-induced phosphorylation
of ERK1/2 (Fig. 3B). However,
testosterone did not promote the phosphorylation of p38MAPK
(Fig. 3C).
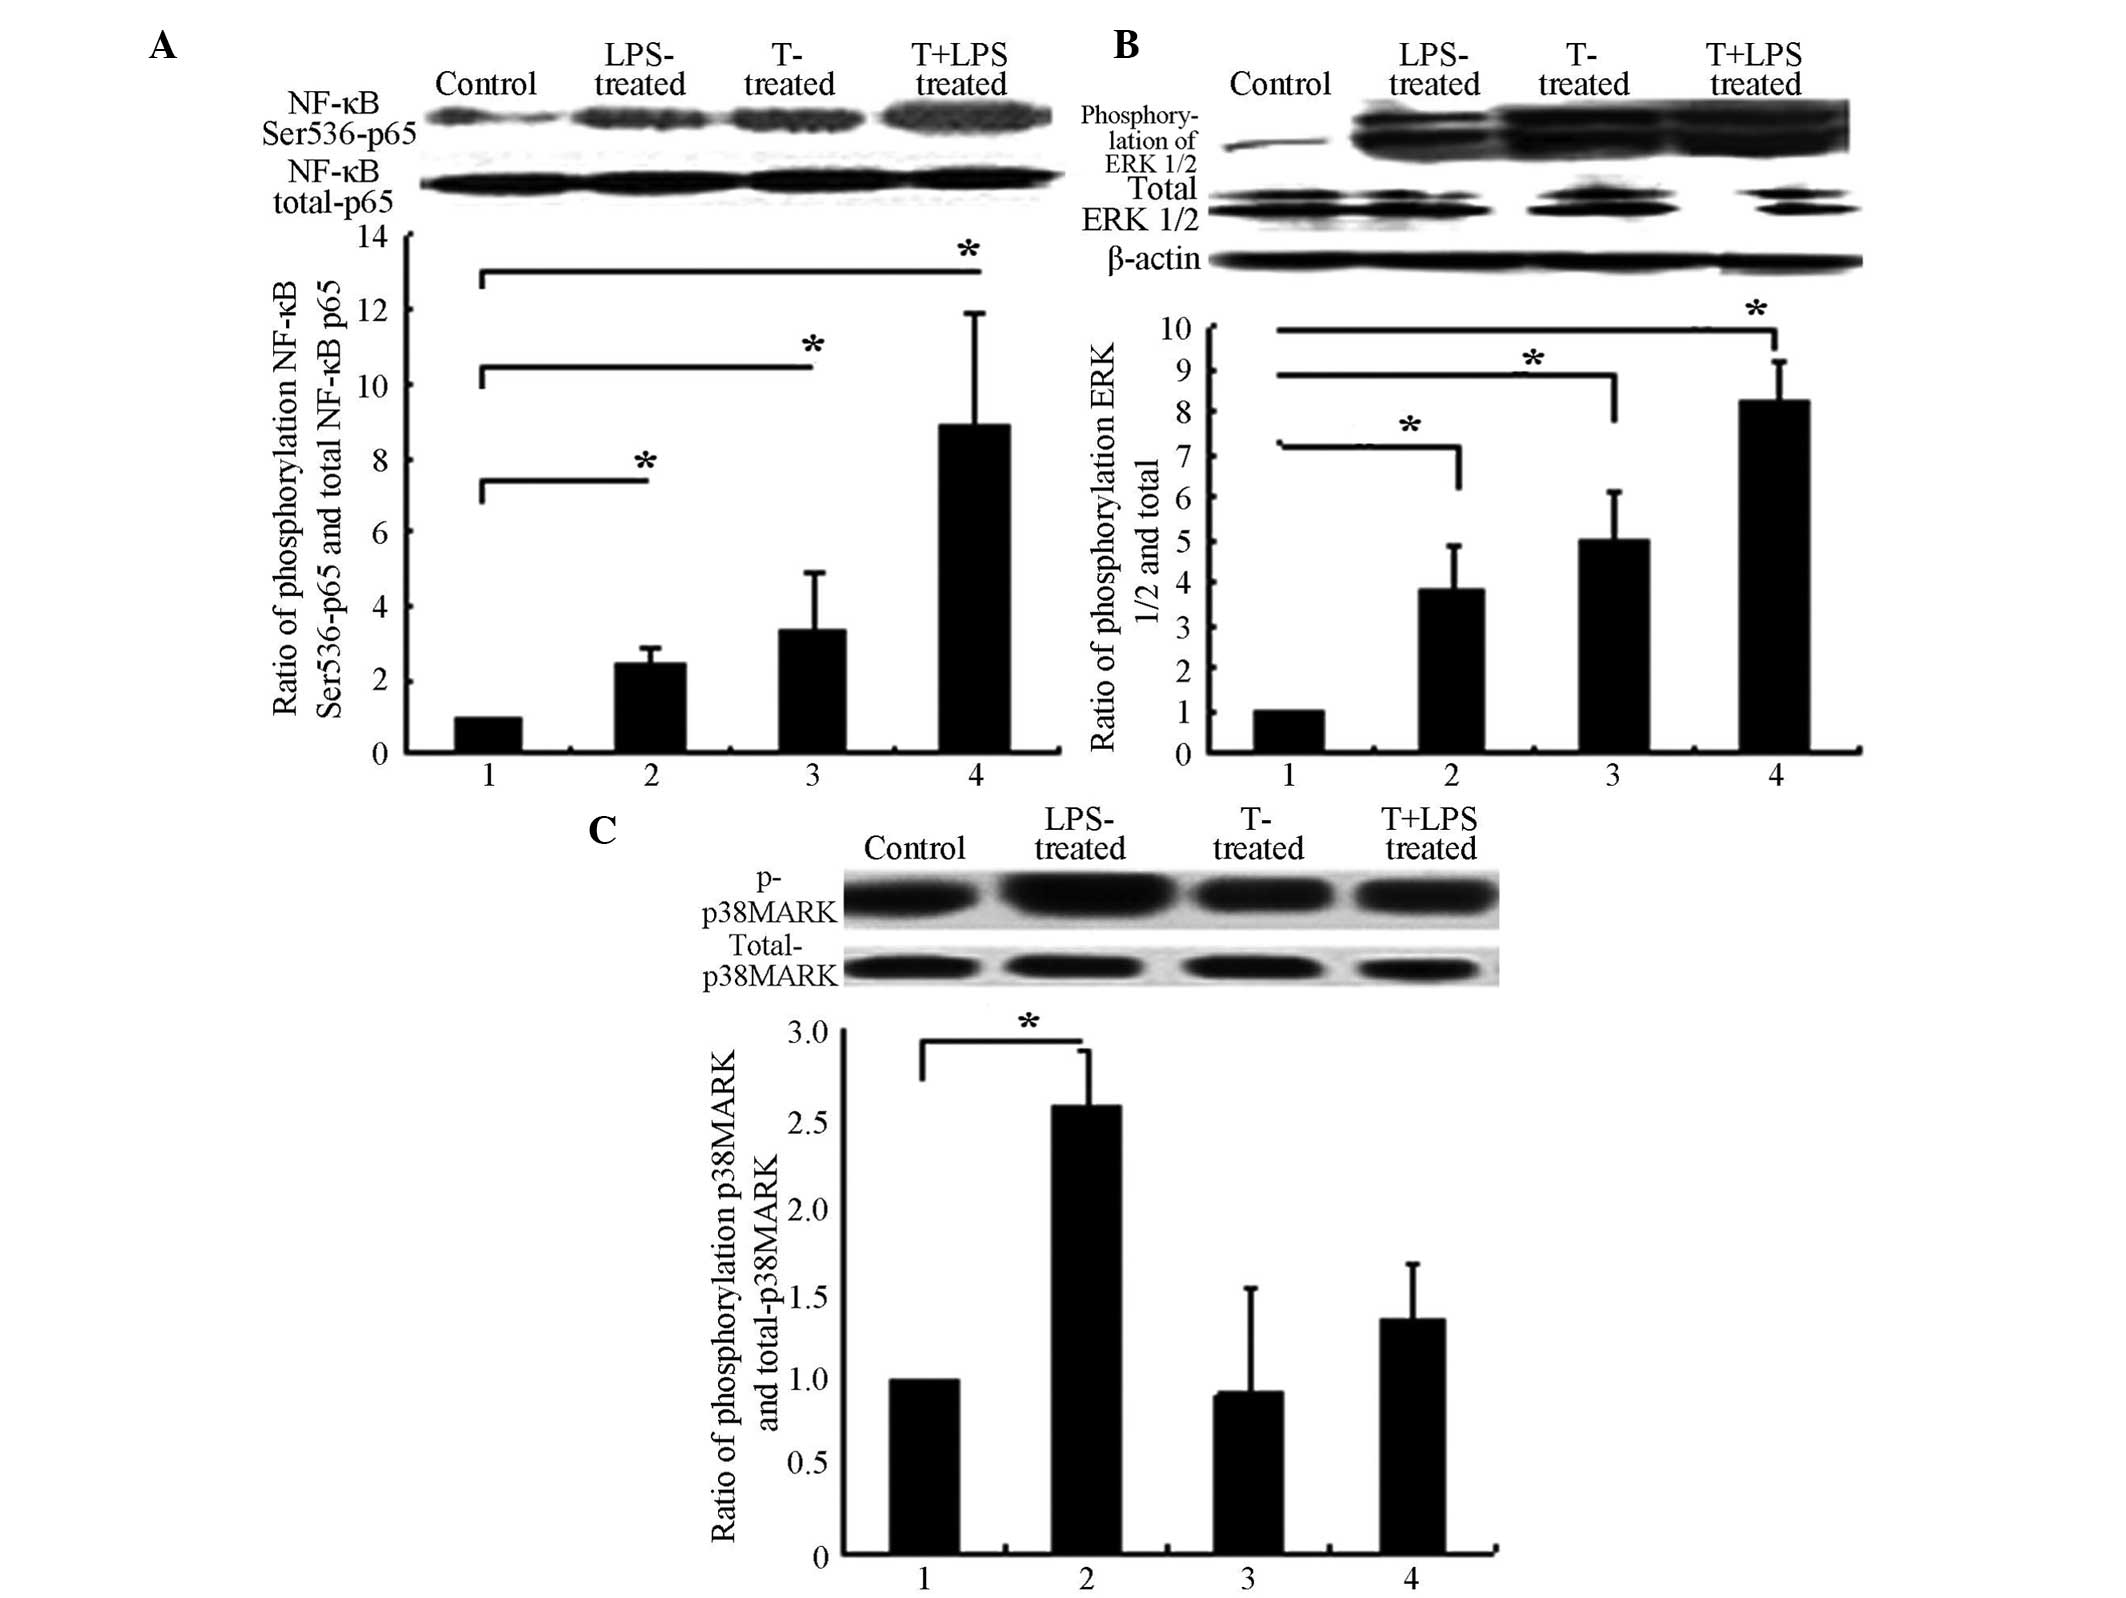 | Figure 3T promoted the phosphorylation of
NF-κB subunit p65 and ERK1/2. 3T3-L1 adipocytes were treated with T
alone or in combination with LPS (1 μg/ml), or control for
12 h. Cell lysates were then prepared and subjected to sodium
dodecyl sulphate polyacrylamide gel and western blot analysis. The
protein phosphorylation was detected using a specific antibody.
Images shown are representative immunoblots from ≥3 independent
experiments. (A) T promoted and enhanced LPS-induced
phosphorylations of NF-κB submit p65. (B) T promoted and enhanced
LPS-induced phosphorylations of ERK1/2. (C) T did not promote the
phosphorylations of p38MAPK. (A), (B) and (C) Group 1, controls;
group 2, 1 μg/ml LPS treatment for 6 h; group 3, 10
μmol/l T treatment for 12 h only; and group 4, 10
μmol/l T pre-treatment for 12 h, with subsequent 1
μg/ml LPS treatment for 6 h. *P>0.05. T,
Testosterone; LPS, lipopolysaccharide; NF-κB, nuclear factor-κB;
p38-MAPK, p38 mitogen-activated protein kinase; ERK 1/2,
extracellular signal-regulated kinase 1/2. |
Testosterone promotes and enhances
LPS-induced inflammatory factors, IL-6 and MCP-1, via sequentially
activating the ERK1/2/NF-κB pathways
Adding the ERK1/2 inhibitor, PD98059, partially
inhibited the activation by testosterone of NF-κB (Ser536) p65
(Fig. 4A). Adding the NF-κB
inhibitor, pyrrolidine dithiocarbamate (PDTC), however, did not
alter the activation by testosterone of ERK1/2 (Fig. 4B). PDTC and PD98059 partially
blocked the testosterone-mediated downregulation of IL-6 and MCP-1
expression in 3T3-L1 adipocytes (Fig.
4C and D).
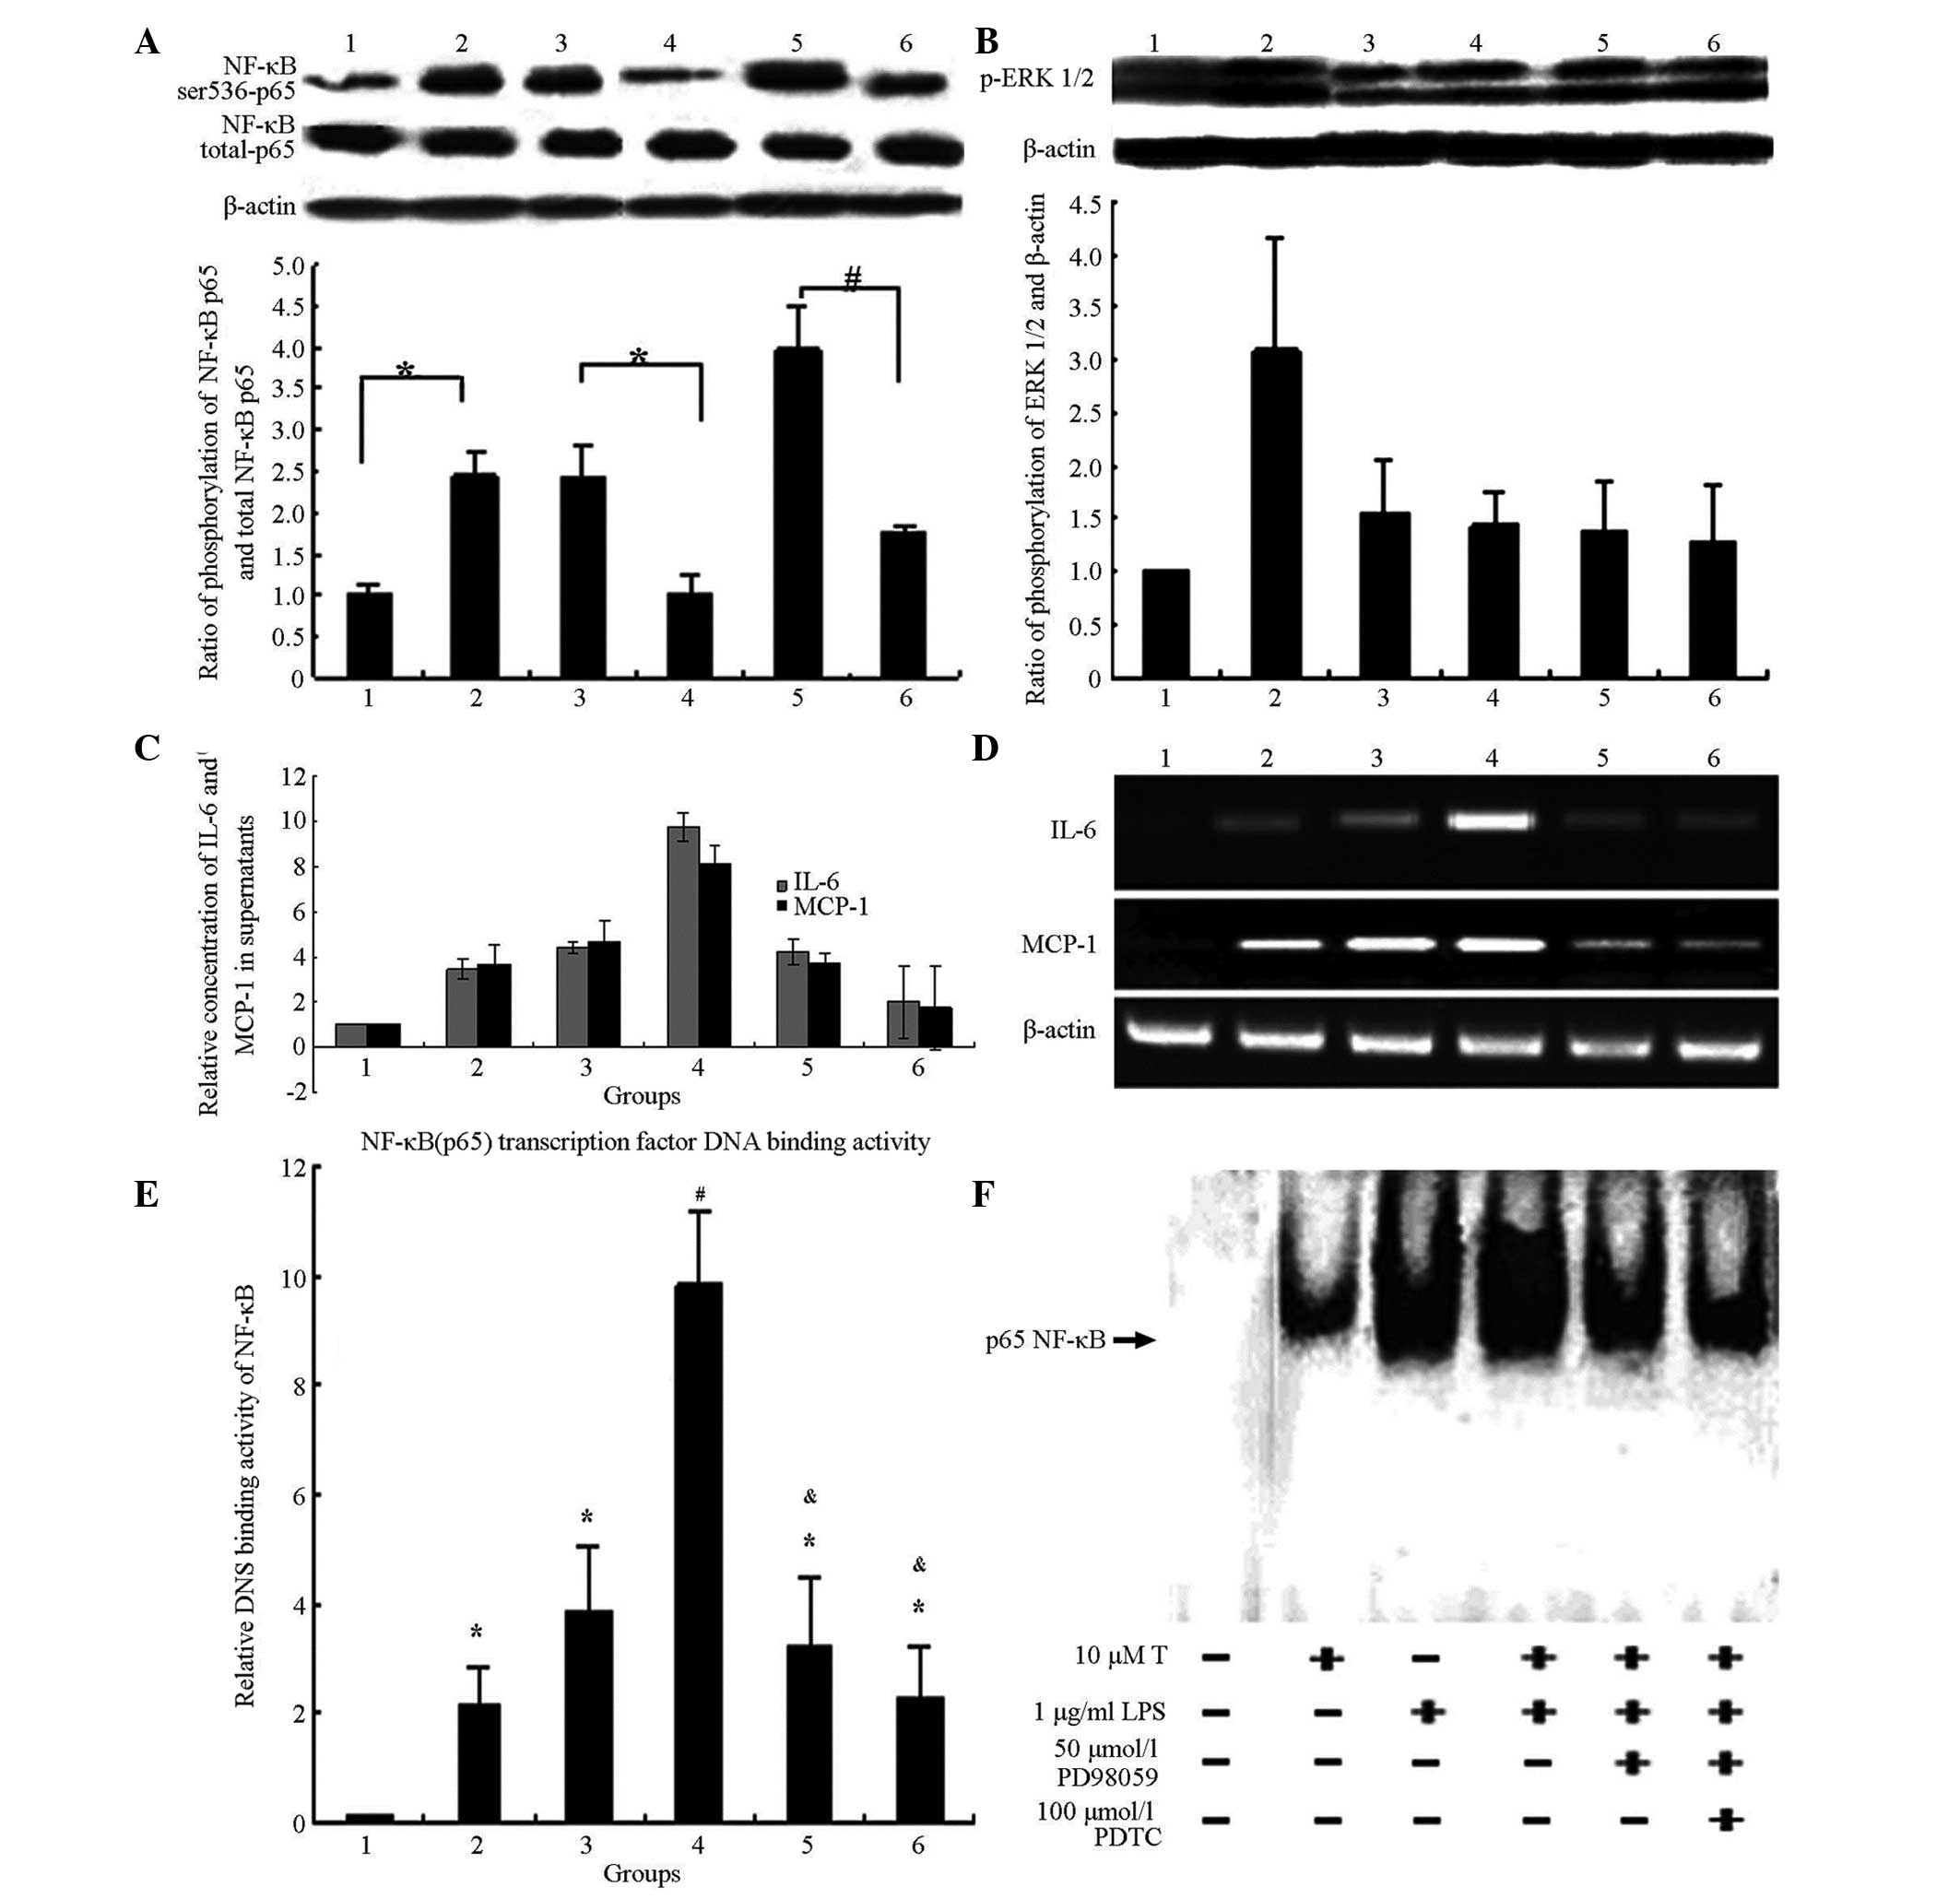 | Figure 4T promoted and enhanced the
production of LPS-induced inflammatory factors, IL-6 and MCP-1, via
sequentially activating the ERK1/2/NF-κB pathways. (A) Addition of
the ERK1/2 inhibitor, PD98059, partially inhibited the activation
of T on NF-κB (Ser536) p65. *P<0.05 and
#P<0.01. Group 1, controls; group 2: 1 μg/ml
LPS treatment for 6 h; group 3, 10 μmol/l T treatment for 12
h only; group 4, 50 μmol/l PD98059 pre-treatment for 2 h,
then 10 μmol/l T treatment for 12 h; group 5, 10
μmol/l T pre-treatment for 12 h, then 1 μg/ml LPS
treatment for 6 h; and group 6, 50 μmol/l PD98059
pre-treatment for 2 h, 10 μmol/l T treatment for 12 h, then
1 μg/ml LPS treatment for 6 h. (B) Addition of NF-κB
inhibitor PDTC did not inhibit the activation by T of ERK1/2. No
significant difference was detected between groups 3, 4, 5 and 6
(P>0.05). Group 1, controls; group 2, 1 μg/ml LPS
treatment for 6 h; group 3, 10 μmol/l T treatment for 12 h
only; group 4, 100 μmol/l PDTC pre-treatment for 2 h, then
10 μmol/l T treatment for 12 h; group 5, 10 μmol/l T
pre-treatment for 12 h, then 1 μg/ml LPS treatment for 6 h;
and group 6, 100 μmol/l PDTC pre-treatment for 2 h,
10μmol/l T treatment for 12 h, then 1 μg/ml LPS
treatment for 6 h. (C) Addition of PDTC (NF-κB inhibitor) or
PD98059 (ERK1/2 inhibitor) partially decreased the concentrations
of IL-6 and MCP-1 in supernatants. There was a signficant
difference between group 4 and group 5, as well as between groups 4
and 6, groups 1 and 5, and groups 1 and 6 (P<0.05). Group 1,
controls; group 2, 10 μmol/l testosterone treatment for 12 h
only; group 3, 1 μg/ml LPS treatment for 6 h; group 4, 10
μmol/l T pre-treatment for 12 h, then 1 mg/ml LPS treatment
for 6 h; group 5, 100 μmol/l PDTC pre-treatment for 2 h, 10
μmol/l T treatment for 12 h, then 1 μg/ml LPS
treatment for 6 h; and group 6, 50 μmol/l PD98059
pre-treatment for 2 h, 10 μmol/l T pre-treatment for 12 h,
then 1 μg/ml LPS treatment for 6 h. (D) Addition of PDTC
(NF-kB inhibitor) or PD98059 (ERK1/2 inhibitor) partially decreased
the mRNA expression of IL-6 and MCP-1. Group 1, controls; group 2,
10 μmol/l T treatment for 12 h only; group 3, 1 μg/ml
LPS treatment for 6 h; group 4, 10 μmol/l T pre-treatment
for 12 h, then 1 μg/ml LPS treatment for 6 h; group 5, 100
μmol/l PDTC pre-treatment for 2 h, 10μmol/l T
treatment for 12 h, then 1 μg/ml LPS treatment for 6 h; and
group 6, 50 μmol/l PD98059 pre-treatment for 2 h,10
μmol/l T pre-treatment for 12 h, then 1 μg/ml LPS
treatment for 6 h. (E-F) Two methods were used to test whether or
not T promotes LPS-induced NF-κB (p65) transcription factor
DNA-binding activity in 3T3-L1 adipocytes. Group 1, controls; group
2, 10 μmol/l T treatment for 12 h only; group 3, 1
μg/ml LPS treatment for 6 h; group 4, 10 μmol/l T
pre-treatment for 12 h, then 1 μg/ml LPS treatment for 6 h;
group 5, 50 μmol/l PD98059 pre-treatment for 2 h, 10
μmol/l T pre-treatment for 12 h, then 1 μg/ml LPS
treatment for 6 h; and group 6, 100 μmol/l PDTC
pre-treatment for 2 h, 10 μmol/l T treatment for 12 h, then
1 μg/ml LPS treatment for 6 h. (E) Enzyme-linked
immunosorbent assay for detecting NF-κB (p65) transcription factor
DNA binding activity. (F) Electrophoretic mobility shift assay for
detecting NF-κB (p65) transcription factor DNA binding activity.
*P<0.05 compared with controls, #P<0.01
compared with controls and &P<0.05 compared with
group 4. T, Testosterone; LPS, lipopolysaccharide; ERK 1/2;
extracellular signal-regulated kinase 1/2; NF-κB, nuclear
factor-κ-B; PDTC, pyrrolidine dithiocarbamate. |
Without LPS treatment, levels of IL-6 and MCP-1 in
the supernatant were the highest following 10 μmol/l
testosterone treatment for 24 h. In the LPS-stimulated state, IL-6
and MCP-1 in the supernatant were the highest following 10
μmol/l pre-treatment for 24 h with subsequent LPS treatment
for 6 h. Furthermore, PDTC or PD98059 were also added in order, to
observe IL-6 and MCP-1 in the supernatant.
PDTC and PD98059 partially blocked the
testosterone-mediated activation of NF-κB transcription factor
DNA-binding activity in 3T3-L1 adipocytes by 74 and 53%,
respectively (Fig. 4E and F).
Discussion
Recent studies have demonstrated that patients with
PCOS exhibit metabolic inflammation in the form of increases in
peripheral white blood cell and neutrophil counts, and elevation in
a number of inflammatory factors in the serum, such as C-reactive
protein, TNF-α, IL-6, IL-18 and MCP-1. The levels of inflammatory
factors in patients with PCOS patients are higher than those in
control groups, following adjustment for factors, such as age and
body mass index (27). Thus,
metabolic inflammation may be a fundamental characteristic of PCOS,
although the mechanism underlying this effect remains unclear. A
number of studies have suggested that an increase in the levels of
inflammatory cytokines, such as IL-6 and MCP-1, inhibits the
activity of insulin receptor tyrosine kinase, which may result in
the development of metabolic diseases, including PCOS (9,28).
White adipocytes were recently shown to be associated with
inflammation (29). During
pathogenic stimulation, an inflammation signal transduction cascade
was activated in adipocytes, and the levels of inflammatory
cytokines, such as TNF, MCP-1 and IL-6, increased. As immune cells,
adipocytes activate complement, resulting in increases in the
levels of inflammatory factors and chemokines. Adipocytes are
target cells of androgens and are also classical endocrine cells.
Thus, mature 3T3-L1 adipocytes were used in the present study in
order to investigate the mechanisms underlying metabolic
inflammation, and to clarify the association between the
hyperandrogenitic environment and metabolic disease.
In the present study, in contrast to the controls,
testosterone promoted the production of IL-6 and MCP-1. In the
LPS-stimulated state, testosterone-pre-treatment increased
LPS-stimulated IL-6 and MCP-1 expression. Thus, it was inferred
that testosterone directly promotes IL-6 and MCP-1 expression, as
well as the response of adipocytes to external stimuli, thereby
producing higher levels of the inflammatory cytokines, IL-6, MCP-1.
These effects were not simply additive, testosterone significantly
enhanced the effects of LPS-induced inflammation factors, as
determined by further statistical analysis.
Signalling pathway activation may be involved in the
pathogenesis of metabolic inflammation in PCOS. The generation of
inflammatory factors depends primarily on the activation of the
inflammatory signalling pathway (30).
Clinical studies have confirmed that ERK1/2 and
NF-κB activation is higher in patients with PCOS than in healthy
subjects (31,32). p38-MAPK, NF-κB and ERK1/2 are
important factors, associated with the proliferation of numerous
types of cells, including prostatic cells and fibroblasts, which
are mediated by androgens and are also closely associated with the
inflammatory signalling pathway (33–35).
Testosterone activates inflammatory signalling pathways in
adipocytes, while promoting the generation of inflammatory
cytokines (Fig. 5). To the best of
our knowledge, there have been no reports relevant to these
findings. The present study demonstrated that with or without LPS
treatment, testosterone activates NF-κB and ERK1/2. Furthermore, it
was shown that testosterone activates ERK1/2 and NF-κB, thus
producing higher concentrations of inflammatory cytokines in
adipocytes. However, PD98059, an ERK1/2 antagonist, partially (53%)
blocks the NF-κB DNA-binding activity of testosterone (IL-6 and
MCP-1 were partially reduced, 70 and 44%, respecitively). Thus, the
results suggest that testosterone may also activate other
intracellular signal transduction pathways, thereby preventing
complete PD98059-induced blocking of the effects of testosterone.
PDTC partially blocked the NF-κB DNA-binding activity of
testosterone (74%), and this capability was greater than that of
PD98059 (53%; IL-6 and MCP-1 were partially reduced, 68 and 41%,
respectively). Thus, NF-κB may be the primary regulator of IL-6 and
MCP-1, and may be a downstream signalling molecules in the ERK1/2
pathway, which requires further investigation.
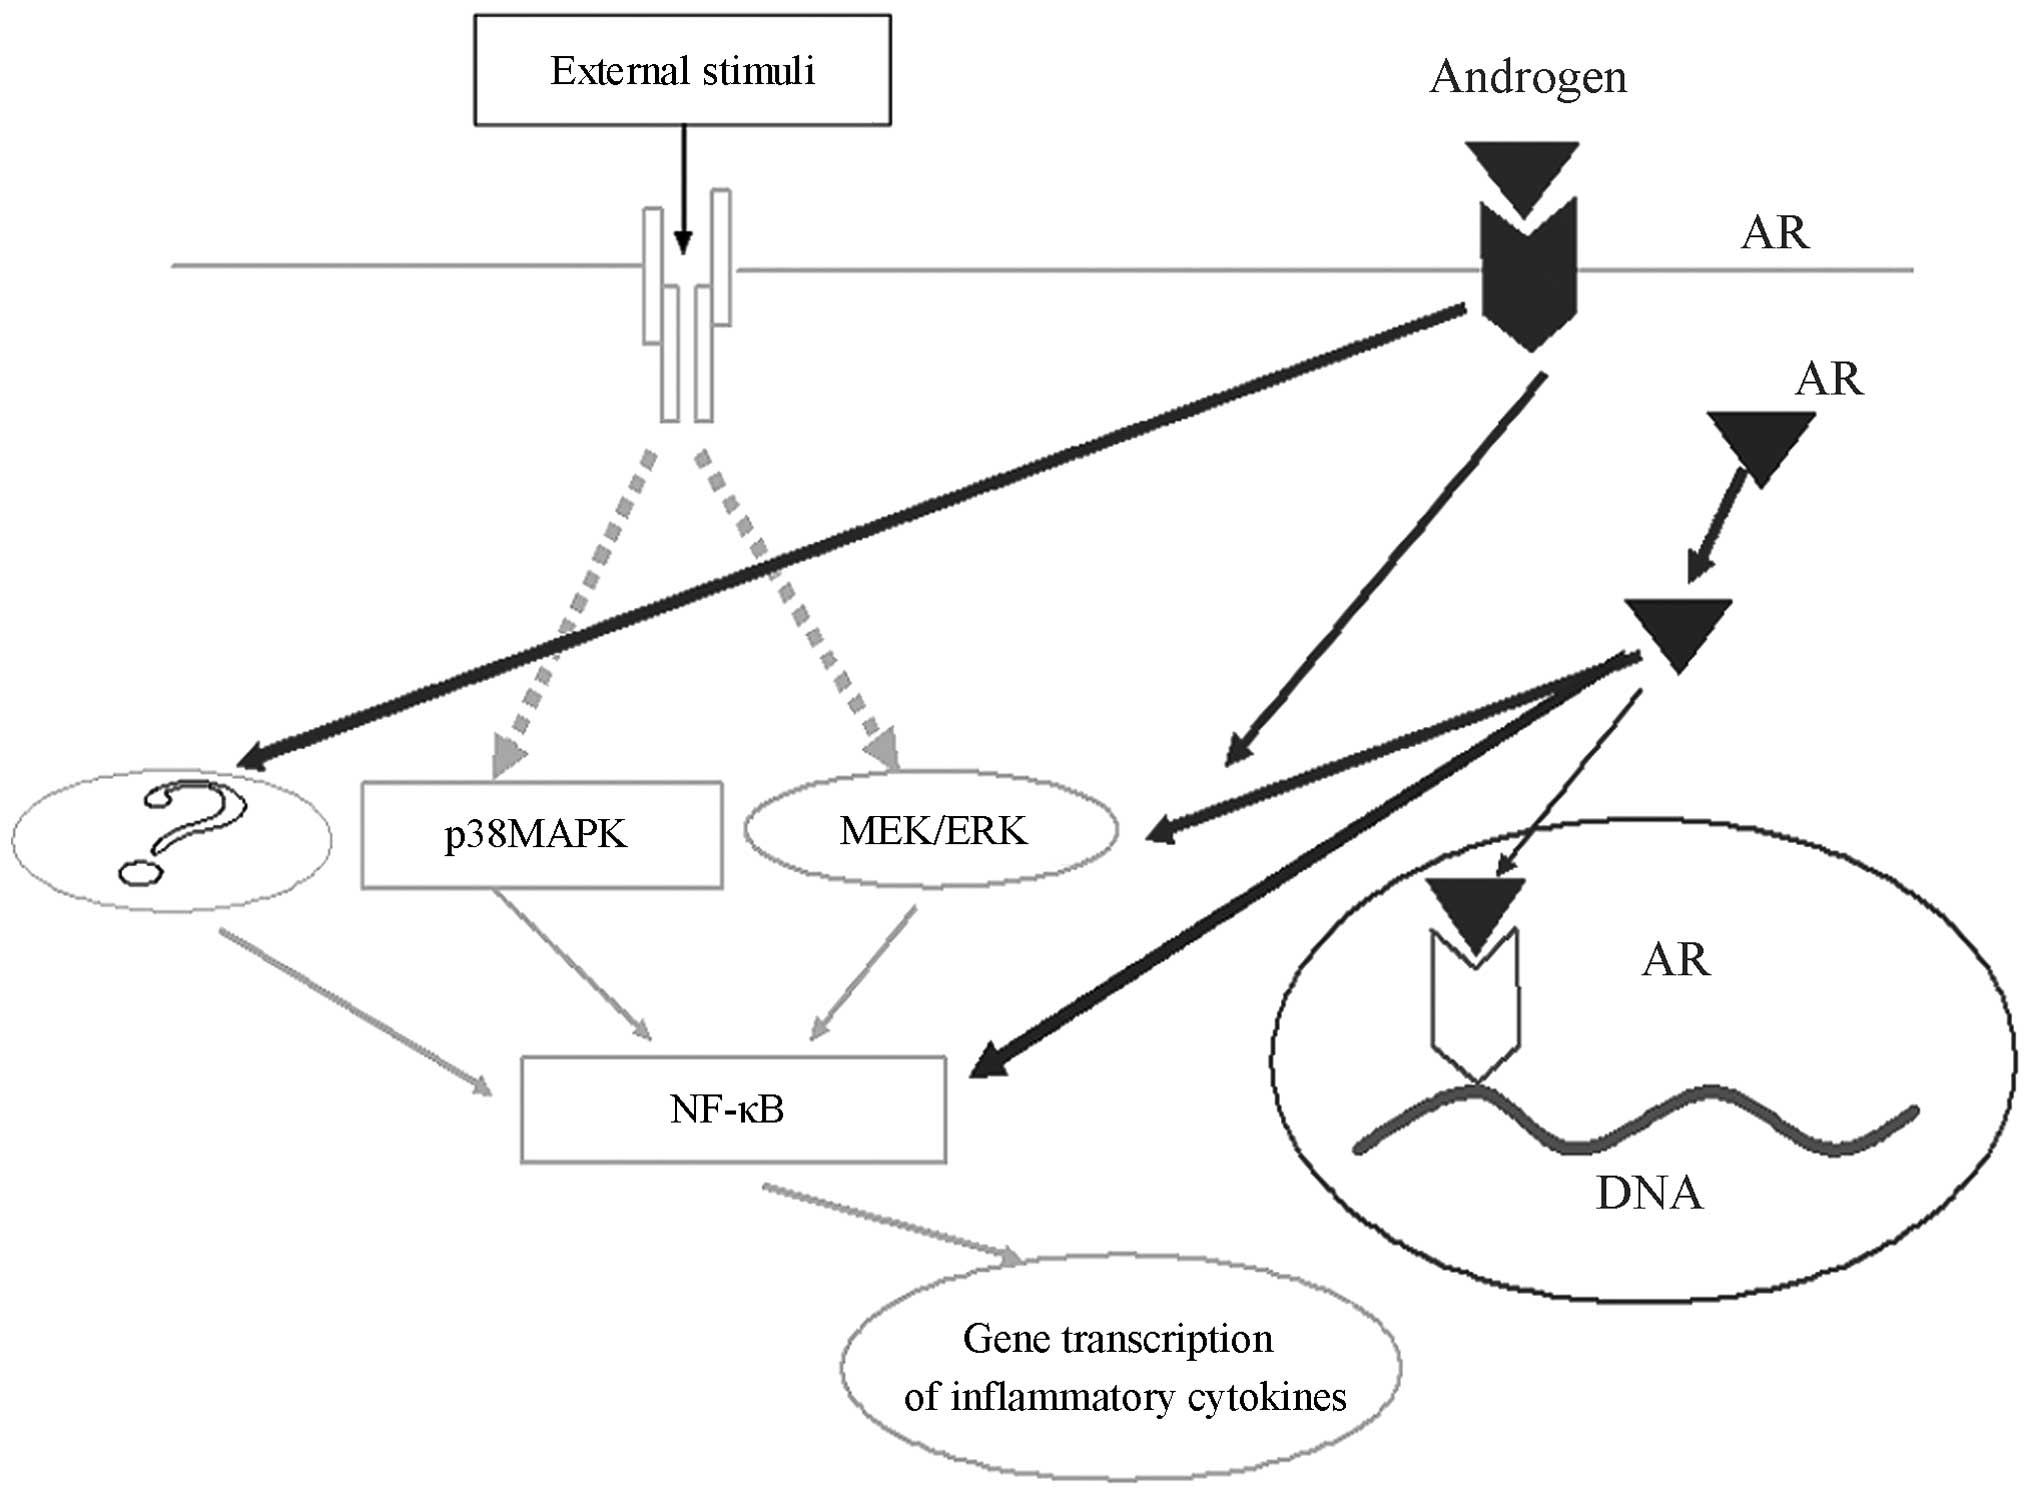 | Figure 5Testosterone promotion of IL-6 and
MCP-1 is partially dependent on the ERK1/2/NF-κB pathway, however,
testosterone may act on other signalling pathways promote
inflammatory factors, which also facilitates the generation of
inflammatory factors. IL-6, Interleukin-6; MCP-1, macrophage
chemotactic protein-1; ERK 1/2, extracellular signal-regulated
kinase 1/2; NF-κB, nuclear factor-κ-B; p38-MAPK, p38
mitogen-activated protein kinase; AR, androgen receptor; ?,
molecules which remain unknown. |
A number of clinical studies have demonstrated that
PCOS patients are in a state of chronic metabolic inflammation. The
present study hypothesised that PCOS patients are highly sensitive
to external stimuli compared with normal subjects, probably because
of hyperandrogemia, which results in the increased production of
inflammatory factors by other external stimuli.
The present study has certain limitations. IL-6 and
MCP-1 were investigated. However, other inflammatory factors
require further exploration. In addition, the present study was
conducted in vitro due to the complexities of pathways in
vivo. Thus, further in vivo studies are required.
In conclusion, testosterone promotes IL-6 and MCP-1,
and this effect is partially dependent on the ERK1/2/NF-κB pathway.
Testosterone, however, when promoting inflammatory factors, may be
dependent on other signalling pathways that also facilitate the
generation of inflammatory factors (Fig. 5).
Acknowledgments
This study was supported by the National Natural
Science Foundation of China (grant no. 30973186) and the Youth
Natural Science Foundation of Shanghai, (grant no.
12ZR1441400).
References
|
1
|
Legro RS, Kunselman AR, Dodson WC and
Dunaif A: Prevalence and predictors of risk for type 2 diabetes
mellitus and impaired glucose tolerance in polycystic ovary
syndrome: a prospective, controlled study in 254 affected women. J
Clin Endocrinol Metab. 84:165–169. 1999.PubMed/NCBI
|
|
2
|
Hu G, Qiao Q, Tuomilehto J, Balkau B,
Borch-Johnsen K and Pyorala K; DECODE Study Group: Prevelence of
the metabolic syndrome and its relation to all-cause and
cardiovascular mortality in nondiabetic European men and women.
Arch Intern Med. 164:1066–1076. 2004. View Article : Google Scholar : PubMed/NCBI
|
|
3
|
Boura-Halfon S and Zick Y: Phosphorylation
of IRS proteins, insulin action, and insulin resistance. Am J
Physiol Endocrinol Metab. 296:E581–E591. 2009. View Article : Google Scholar
|
|
4
|
Coviello AD, Legro RS and Dunaif A:
Adolescent girls with polycystic ovary syndrome have an increased
risk of the metabolic syndrome associated with increasing androgen
levels independent of obesity and insulin resistance. J Clin
Endocrinol Metab. 91:492–497. 2006. View Article : Google Scholar
|
|
5
|
Banaszewska B, Pawelczyk L, Spaczynski RZ,
Dziura J and Duleba AJ: Effects of simvastatin and oral
contraceptive agent on polycystic ovary syndrome: prospective,
randomized, crossover trial. J Clin Endocrinol Metab. 92:456–461.
2007. View Article : Google Scholar
|
|
6
|
Ibáñez L, Jaramillo AM, Ferrer A and de
Zegher F: High neutrophil count in girls and women with
hyperinsulinaemic hyperandrogenism: normalization with metformin
and flutamide overcomes the aggravation by oral contraception. Hum
Reprod. 20:2457–2462. 2005. View Article : Google Scholar : PubMed/NCBI
|
|
7
|
González F, Rote NS, Minium J and Kirwan
JP: In vitro evidence that hyperglycemia stimulates tumor necrosis
factor-alpha release in obese women with polycystic ovary syndrome.
J Endocrinol. 188:521–529. 2006. View Article : Google Scholar : PubMed/NCBI
|
|
8
|
Tataranni PA and Ortega E: A burning
question: does an adipokine-induced activation of the immune system
mediate the effect of overnutrition on type 2 diabetes? Diabetes.
54:917–927. 2005. View Article : Google Scholar : PubMed/NCBI
|
|
9
|
Lumeng CN and Saltiel AR: Inflammatory
links between obesity and metabolic disease. J Clin Invest.
121:2111–2117. 2011. View
Article : Google Scholar : PubMed/NCBI
|
|
10
|
Nicklas BJ, Ambrosius W, Messier SP, et
al: Diet-induced weight loss, exercise, and chronic inflammation in
older, obese adults: a randomized controlled clinical trial. Am J
Clin Nutr. 79:544–551. 2004.PubMed/NCBI
|
|
11
|
Mohamed-Ali V, Goodrick S, Rawesh A, et
al: Subcutaneous adipose tissue releases interleukin-6, but not
tumour necrosis factor-alpha, in vivo. J Clin Endocrinol Metab.
82:4196–4200. 1997.PubMed/NCBI
|
|
12
|
Lagathu C, Bastard JP, Auclair M, Maachi
M, Capeau J and Caron M: Chronic interleukin (IL-6) treatment
increased IL-6 secretion and induced insulin resistance in
adipocyte: prevetion by rosigilitazone. Biochem Biophys Res Commun.
311:372–379. 2003. View Article : Google Scholar : PubMed/NCBI
|
|
13
|
Homaidan FR, Chakroun I and El-Sabban ME:
Regulation of nuclear factor-kappaB in intestinal epithelial cells
in a cell model inflammation. Mediators Inflamm. 12:277–283. 2003.
View Article : Google Scholar
|
|
14
|
Shoelson SE, Lee J and Goldfine AB:
Inflammation and insulin resistance. Clin Invest. 116:1793–1801.
2006. View
Article : Google Scholar
|
|
15
|
Ognjanovic S, Jacobs DR, Steinberger J,
Moran A and Sinako AR: Relation of chemokines to BMI and insulin
resistance at ages 18–21. Int J Obes (Lond). 37:420–423. 2013.
View Article : Google Scholar
|
|
16
|
Gerhardt CC, Romero IA, Cancello R, Camoin
L and Strosberg AD: Chemokines control fat accumulation and leptin
secretion by cultured human adipocytes. Mol Cell Endocrinol.
175:81–92. 2001. View Article : Google Scholar : PubMed/NCBI
|
|
17
|
Takahashi K, Mizuarai S, Araki H, et al:
Adipocity elevates plasma MCP-1 levels leading to the increased
CD11b-positive monocytes in mice. J Biol Chem. 278:46654–46660.
2003. View Article : Google Scholar : PubMed/NCBI
|
|
18
|
Kershaw EE and Flier JS: Adipose tissue as
an endocrine organ. J Clin Endocrinol Metab. 89:2548–2556. 2004.
View Article : Google Scholar : PubMed/NCBI
|
|
19
|
Hsiung SC, Tamir H, Franke TF and Liu KP:
Roles of extracellular signal-regulated kinase and Akt signaling in
coordinating nuclear transcription factor-kappaB-dependent cell
survival after serotonin 1A receptor activation. J Neurochem.
95:1653–1666. 2005. View Article : Google Scholar : PubMed/NCBI
|
|
20
|
Kaidashev IP: Activation of NF-κB under
metabolic syndrome. Internationl J Physiol Pathophysiol. 3:287–297.
2012. View Article : Google Scholar
|
|
21
|
Suganami T, Tanimoto-Koyama K, Nishida J,
et al: Role of the toll-like receptor 4/NF-kappaB pathway in
saturated fatty acid-induced inflammatory changes in the
interaction between adipocytes and macrophages. Arterioscler Thromb
Vasc Biol. 27:84–91. 2007. View Article : Google Scholar
|
|
22
|
Kovacheva EL, Hikim AP, Shen R, Sinha I
and Sinha-Hikim I: Testosterone supplementation reverses sarcopenia
in aging through regulation of myostatin, c-Jun NH2-terminal
kinase, notch, and Akt signaling pathways. Endocrinology.
151:628–638. 2010. View Article : Google Scholar :
|
|
23
|
Sun HZ, Yang TW, Zang WJ and Wu SF:
Dehydroepiandrosterone-induced proliferation of prostatic
epithelial cell is mediated by NFKB via PI3K/AKT signaling pathway.
J Endocrinol. 204:311–318. 2010. View Article : Google Scholar
|
|
24
|
Wu Y, Bauman WA, Blitzer RD and Cardozo C:
Testosterone- induced hypertrophy of L6 myoblasts is dependent upon
Erk and mTOR. Biochem Biophys Res Commun. 400:679–683. 2010.
View Article : Google Scholar : PubMed/NCBI
|
|
25
|
Yamamoto Y, Yoshimasa Y, Koh M, et al:
Constitutively active mitogen-activated protein kinase kinase
increases GLUT1 expression and recruits both GLUT1 and GLUT4 at the
cell surface in 3T3-L1 adipocytes. Diabetes. 49:332–339. 2000.
View Article : Google Scholar : PubMed/NCBI
|
|
26
|
Yin J, Zuberi A, Gao Z, Liu D, Liu Z and
Ye J: Shilianhua extract inhibits GSK-3beta and promotes glucose
metabolism. Am J Physiol Endocrinol Metab. 296:E1275–E1280. 2009.
View Article : Google Scholar : PubMed/NCBI
|
|
27
|
Benson S, Janssen OE, Hahn S, et al:
Obesity, depression, and chronic low-grade inflammation in women
with polycystic ovary syndrome. Brain Behav Immun. 22:177–184.
2008. View Article : Google Scholar
|
|
28
|
Marino JS, Iler J, Dowling AR, et al:
Adipocyte dysfunction in a mouse model of polycystic ovary syndrome
(PCOS): evidence of adipocyte hypertrophy and tissue-specific
inflammation. PLoS One. 7:e486432012. View Article : Google Scholar : PubMed/NCBI
|
|
29
|
Greenberg AS and Obin MS: Obesity and the
role of adipose tissue in inflammation and metabolism. Am J Clin
Nutr. 83:461S–465S. 2006.PubMed/NCBI
|
|
30
|
Lei Y, Zhang Y, Cao Y, et al:
Up-regulation of bradykinin receptors in rat bronchi via I kappa B
kinase-mediated inflammatory signaling pathway. Eur J Pharmacol.
634:149–161. 2010. View Article : Google Scholar : PubMed/NCBI
|
|
31
|
Corbould A, Zhao H, Mirzoeva S, Aird F and
Dunaif A: Enhanced mitogenic signaling in skeletal muscle of women
with polycystic ovary syndrome. Diabetes. 55:751–759. 2006.
View Article : Google Scholar : PubMed/NCBI
|
|
32
|
González F, Rote NS, Minium J and Kirwan
JP: Increased activation of nuclear factor kappaB triggers
inflammation and insulin resistance in polycystic ovary syndrome. J
Clin Endocrinol Metab. 91:1508–1512. 2006. View Article : Google Scholar : PubMed/NCBI
|
|
33
|
Yeung YT, Bryce NS, Adams S, et al: p38
MAPK inhibitors attenuate pro-inflammatory cytokine production and
the inva-siveness of human U251 glioblastoma cells. J Neurooncol.
109:35–44. 2012. View Article : Google Scholar : PubMed/NCBI
|
|
34
|
Tan BK, Adya R, Chen J, et al: Metformin
decreases angiogenesis via NF-kappaB and Erk1/2/Erk5 pathways by
increasing the antiangiogenic thrombospondin-1. Cardiovasc Res.
83:566–574. 2009. View Article : Google Scholar : PubMed/NCBI
|
|
35
|
González F, Nair KS, Daniels JK, Basal E
and Schimke JM: Hyperandrogenism sensitizes mononuclear cells to
promote glucose-induced inflammation in lean reproductive-age
women. Am J Physiol Endocrinol Metab. 302:E297–E306. 2012.
View Article : Google Scholar :
|


