Introduction
Synovial sarcoma (SS) is one of four common soft
tissue sarcomas and accounts for 5–10% of the total incidence of
soft tissue sarcomas. Diagnosis and classification of this
malignant tumor type is difficult (1); ~40% of cases exhibit metastasis
within 2 years (2) and the
five-year survival rate of high-level SS is ~50–60% (3). Thus, there is a critical demand to
establish effective therapeutic strategies for SS.
Doxorubicin is an anthracycline antibiotic widely
used in clinical treatment of various types of cancer, including
SS. It has been suggested that it functions primarily via insertion
into DNA topoisomerase II, in order to cleave the DNA and destroy
its structure (4). Doxorubicin is
known to affect cells in all phases, but cells in the S phase are
considered to be the most sensitive to doxorubicin (5). Doxorubicin is a recommended drug in
the National Comprehensive Cancer Network Guidelines for Soft
tissue Sarcoma (6), however it
presents various side-effects, including nausea, vomiting,
alopecia, high fever and bone marrow suppression. In particular,
the cardiotoxic effects of doxorubicin limit its clinical
application (7). Thus, the current
study presents a novel combination therapy, which may be an
improved treatment strategy.
Gossypol is an anticancer drug (8) that is able to significantly inhibit
cancer cell proliferation and induce apoptosis in vitro
(9–12). L-gossypol is the principal active
component of gossypol, and certain cell types are 5-fold more
sensitive to L-gossypol than gossypol (13). L-gossypol has various advantages
over gossypol, including that it is more widely available, safer
and has fewer reported side-effects (14). It has also been demonstrated to
inhibit growth and promote apoptosis in squamous cell carcinoma
(15). The aim of the present
study was to investigate the effects of L-gossypol and
low-concentration doxorubicin (LCD) combination therapy on growth
inhibition and apoptotic induction in SW982 human SS cells (HSSCs).
In the current study, the mechanisms of apoptosis induced by
L-gossypol/LCD combination therapy were investigated in the SW982
cell line.
Materials and methods
Cell culture and experimental groups
SW982 cells were obtained from the American Type
Culture Collection (Manassas, VA, USA) cultured in L-15 medium
(Gibco Life Technologies, Grand Island, N Y, USA) containing 10%
FBS (Gibco Life Technologies), 100 U/ml penicillin and 100 U/ml
streptomycin (Shandong Lukang Record Pharmaceutical Co., Ltd.,
Jining, China), and were incubated at 37°C with 5% CO2.
L-gossypol was provided by Professor Tang Hui, University of
Shihezi (Shihezi, China). Doxorubicin (Bio Basic, Inc., Amherst, N
Y, USA).
The experimental groups were divided as follows: i)
Control group, cells cultured in the medium described; ii)
L-gossypol group, 2.5 μmol/l L-gossypol; iii) doxorubicin
group, 0.2 μmol/l doxorubicin; iv) combination group, 2.5
μmol/l L-gossypol and 0.2 μmol/l doxorubicin. The
culture medium was replenished every 3–4 days and the cells were
trypsinized (Gibco Life Technologies) and replated at 85%
confluence.
MTT assay
MTT [3-(4,5-dimethylthiazol-2-yl)-2,5-diphenyl
tetrazolium bromide; MP Biomedicals, LLC, Santa Ana, CA, USA]
assays were performed in accordance with the manufacturer's
instructions. The effect of five different concentrations of
doxorubicin (0.01, 0.02, 0.05, 0.1 and 0.2 μmol/l) and
L-gossypol (0.0, 0.5, 1.0, 1.5, 2.0 and 2.5 μmol/l) were
investigated. The drug combinations were designed in accordance
with the factorial design and are listed in Table I.
 | Table IDrug and dose combinations by
factorial design. |
Table I
Drug and dose combinations by
factorial design.
| Combination | D0 | D1 | D2 | D3 | D4 | D5 |
|---|
| G0 | G0D0 | G0D1 | G0D2 | G0D3 | G0D4 | G0D5 |
| G1 | G1D0 | G1D1 | G1D2 | G1D3 | G1D4 | G1D5 |
| G2 | G2D0 | G2D1 | G2D2 | G2D3 | G2D4 | G2D5 |
| G3 | G3D0 | G3D1 | G3D2 | G3D3 | G3D4 | G3D5 |
| G4 | G4D0 | G4D1 | G4D2 | G4D3 | G4D4 | G4D5 |
| G5 | G4D0 | G4D1 | G4D2 | G4D3 | G4D4 | G4D5 |
The cells were seeded during the logarithmic growth
phase onto 96-well plates at a density of 5×10⁴ cells/ml
(100 μl/well) with five parallel wells. The experimental
drugs were added, resulting in a final volume of 200
μl/well. Subsequently, 20 μl MTT/well was incubated
for 4 h at 37°C, then the supernatant was removed, 150 μl
dimethyl sulfoxide was added, and the plates were incubated for a
further 10 min. The absorbance was then measured using an xMark
Microplate Absorbance Spectrophotometer (Bio-Rad Laboratories,
Inc., Hercules, CA, USA) at a wavelength of 490 nm. The absorbance
values at 24, 48, 72 and 96 h were measured in order to calculate
the IC50 (the concentration resulting in 50% inhibition)
and inhibitory rates using the following formula: Inhibitory rate =
(1 - absorbance of the experimental group/absorbance of the control
group) × 100%.
Cellular morphology
Wright-Giemsa staining (Nanjing Jiangcheng
Bioengineering Institute, Nanjing, China) was conducted according
to the manufacturer's instructions on 1×10⁵ cells/ml
seeded in 6-well plates, cultured for 24 h with the experimental
drug. Cellular morphology was observed under an IX71 inverted
optical microscope (Olympus Corporation, Tokyo, Japan). Hoechst
33258 (Sigma-Aldrich, St. Louis, MO, USA) staining was conducted on
1×10⁶ cells per experimental group under the microscope.
Ultrathin sections (70–90 nm) were cut from samples of the control
and 24 h treatment groups using a Reichert Ultracut-E
ultramicrotome (Reichert-Jung, Vienna, Austria). Cells from the
prepared sections were visualized using transmission electron
microscopy (TEM) on a JEOL 1230 Transmission Electron Microscope
(JEOL, Ltd., Tokyo, Japan).
Flow cytometry
A total of 1×10⁶ cells from each of the
experimental and drug-treated (24 and 48 h) groups were collected
and resuspended in 1 ml 10X annexin V binding buffer from a FITC
Annexin V Apoptosis Detection Kit I (BD Biosciences, San Jose, CA,
USA). A total of 100 l f of the solution was transferred into a
cell culture tube; 5 μl fluorescein isothiocyanate
(FITC)-annexin V and 5 μl propidium iodide (PI) from the kit
were added. Simultaneously, FITC and PI were added to the blank
well. Subsequent to mixing, the solution was cultured at room
temperature in the dark for 15 min, 400 μl combined buffer
was added into the cell culture tube, and flow cytometry was
conducted using an Epics Altra Flow Cytometer (Beckman Coulter,
Inc., Miami, FL, USA).
Detection of alterations in the cell
cycle
A total of 1×10⁶ cells from each of the
experimental and drug-treated (24 and 48 h) groups were collected
for flow cytometry. The cells were centrifuged at 300 × g for 5
min, washed twice with phosphate-buffered saline (PBS), fixed with
1 ml ice cold 70% ethanol and mixed, then maintained at 4°C for 24
h. Prior to testing, the mixture was centrifuged at 1,500 rpm for 5
min and washed twice with PBS prior to the addition of 400
μl RNA enzyme (30 μg/ml; Sigma-Aldrich). The cells
were then incubated at 37°C for 30 min, mixed with 100 μl PI
(200 μg/ml) and incubated in the dark at 4°C for 30 min
prior to flow cytometry. The cell distribution percentages for the
G1, S and G2 phases were then calculated
using EXPO 32 MultiComp software, version 1.2 (Beckman Coulter,
Inc.).
Western blotting
A total of 100 μg protein was collected from
the experimental and 24 h drug-treated groups. Protein samples
underwent polyacrylamide gel electrophoresis with 8% gel at 80 V
(Wuhan Boster Biological Technology, Ltd., Wuhan, China) and were
subsequently transferred onto polyvinylidene difluoride membranes.
The samples were then blocked with nonfat milk and incubated
overnight with polyclonal rabbit anti-human Bcl-2 (sc-782) or Bax
(sc-493) primary antibodies (Santa Cruz Biotechnology, Inc.,
Dallas, TX, USA) overnight at 4°C. Blots were incubated with the
horseradish peroxidase-conjugated secondary antibody (1:5,000;
anti-IgG; Santa Cruz Biotechnology, Inc.). The secondary antibody
was added and incubated at 37°C for 2 h and visualized using
staining with 3,3′-diaminobenzidine (Beijing Solarbio Science &
Technology Co., Ltd., Beijing, China). Quantity One 1-D analysis
software, version 4.6.2 (Bio-Rad Laboratories, Inc.) was used for
analysis of the grayscale values. The relative expression level of
the target protein was calculated as follows: Target protein band
gray value/internal reference (β-actin) gray value.
Caspase-3 and -9 activity analysis
A total of 1×10⁶ cells were collected
from each of the experimental and the drug-treated groups at 0, 6,
12, 18 and 24 h. These were analyzed using the Caspase-3 and
Caspase-9 Colorimetric Assay kits (R&D Systems, Inc.,
Minneapolis, MN, USA), at a wavelength of 405 nm. The activity
levels of caspase-3 and -9 in the control group were set as 1,
while the optical density (OD) value/the control group OD was used
to represent the activity of caspase-3 and -9 in the other groups.
The formula used was as follows: Caspase-9 and -3 activity =
(OD405 of sample - OD405 of
blank)/(OD405 of control - OD405 of
blank).
Statistical analysis
The current study used factorial design and the
experiment was repeated three times with the results presented as
the mean ± standard deviation. All data obtained were analyzed
using SPSS software, version 18.0 (SPSS, Inc., Chicago, IL, USA).
The data met the criteria for independence, normality and
homogeneity of variance, therefore a t-test was selected for
analysis. In addition, the χ2 test was used when
appropriate, with the test level set as α=0.05. P<0.05 was
considered to indicate a statistically significant difference.
Results
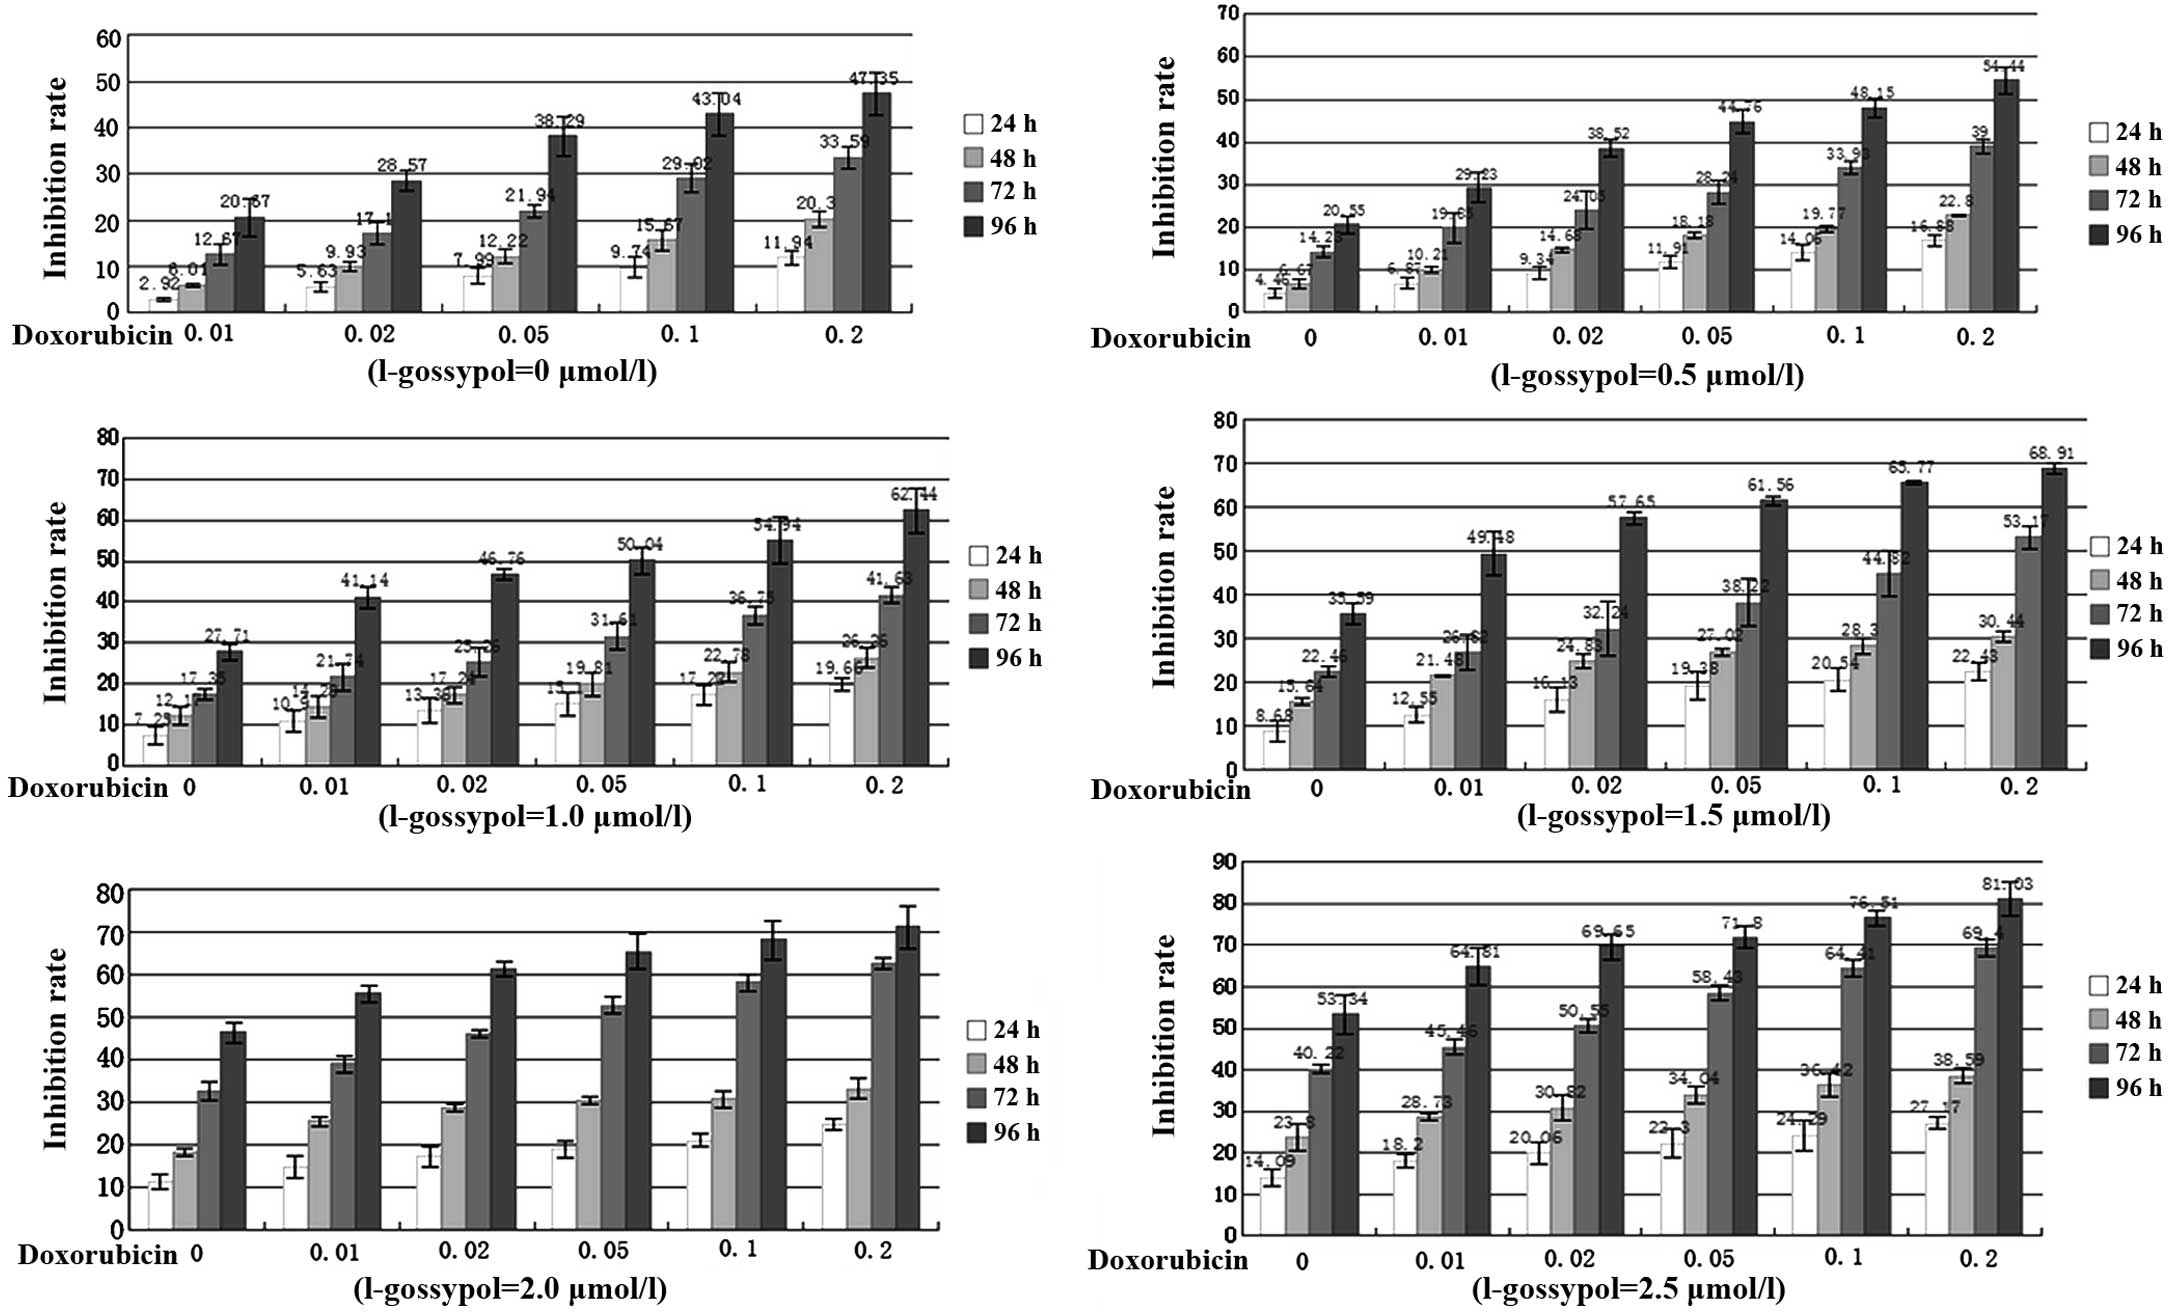
Cell proliferation
L-gossypol and LCD exhibited different degrees of
time-dependent inhibition on the proliferation of SW982 cells
(Fig. 1). The IC50s of
L-gossypol were 16.2, 4.7, 3.9 and 2.5 μmol/l at 24, 48, 72
and 96 h, respectively, whereas those of LCD were 5.12, 1.06, 0.32
and 0.20 μmol/l at 24, 48, 72 and 96 h, respectively. In
addition, the combined inhibitory effect of L-gossypol and LCD
exhibited a clear increase in a concentration- and time-dependent
manner (P<0.001), indicating a strong synergy between the two
drugs (Fig. 1, Table II).
| Table IIAnalysis of variance. |
Table II
Analysis of variance.
| Doxorubicin | L-gossypol | T | D,T | G,T | G,D | D,G,T |
|---|
| F-ratio | 1175.682 | 750.205 | 4223.069 | 39.296 | 61.691 | 2.459 | 1.565 |
| P-value | <0.001 | <0.001 | <0.001 | <0.001 | <0.001 | <0.001 | =0.005 |
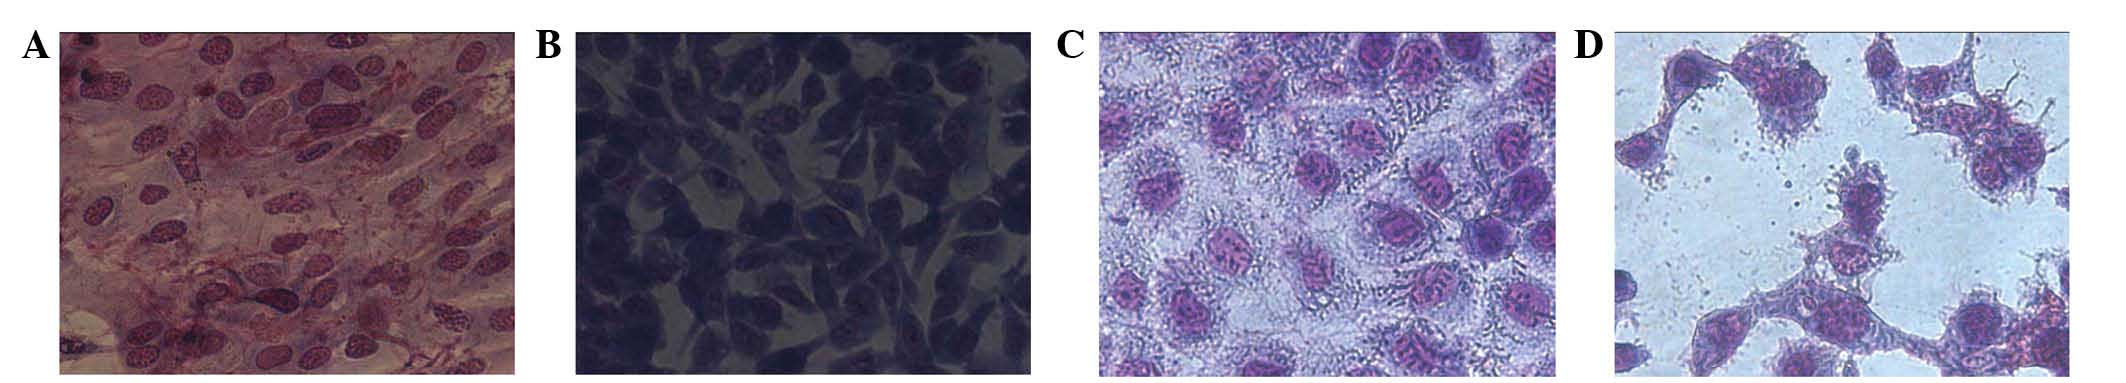
Inverted phase contrast microscopy
Wright-Giemsa staining was conducted on SW982 HSSCs
cocultured in 2.5 μmol/l L-gossypol and/or 0.2 μmol/l
doxorubicin for 48 h, which revealed distinct morphological
differences between the groups (Fig.
2). Control cells were tightly packed, large and predominantly
appeared as clostridial forms with few cells exhibiting the
polygonal form. The nuclei were large and centrally located, and a
small number of cells deviated from the standard form. The majority
of cells in the control group were observed to have two nuclei and
the cytoplasm was abundant. However, in the experimental groups,
the number and size of the cells was significantly reduced. In
addition, a larger number of cells appeared to be irregular in
shape and a small number were circular. The nuclei were observed to
shrink in certain cells, while in others the nuclei fragmented, the
fragments of which were observed moving towards the outer part of
cells, forming film-coated apoptotic bodies (Fig. 2).
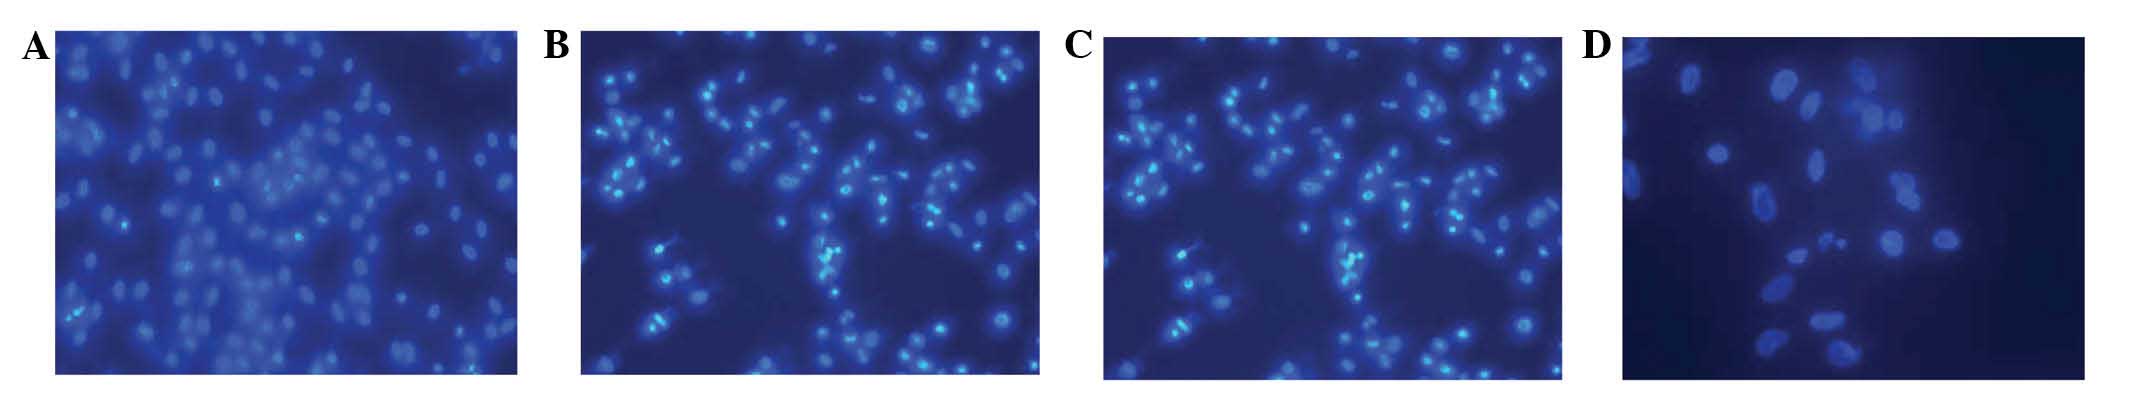
Fluorescence microscopy
Control HSSCs were observed to be condensed,
granular and exhibit clear fluorescence in either the nuclei or the
cytoplasm following 48 h of treatment (Fig. 3). In addition, apoptosis was
clearly evident. The cells shrank, the chromatin became condensed
and marginated and clear fragments were observed inside the
cytoplasm. The cell membrane was observed to form bubble-like
protrusions and apoptotic bodies were formed.
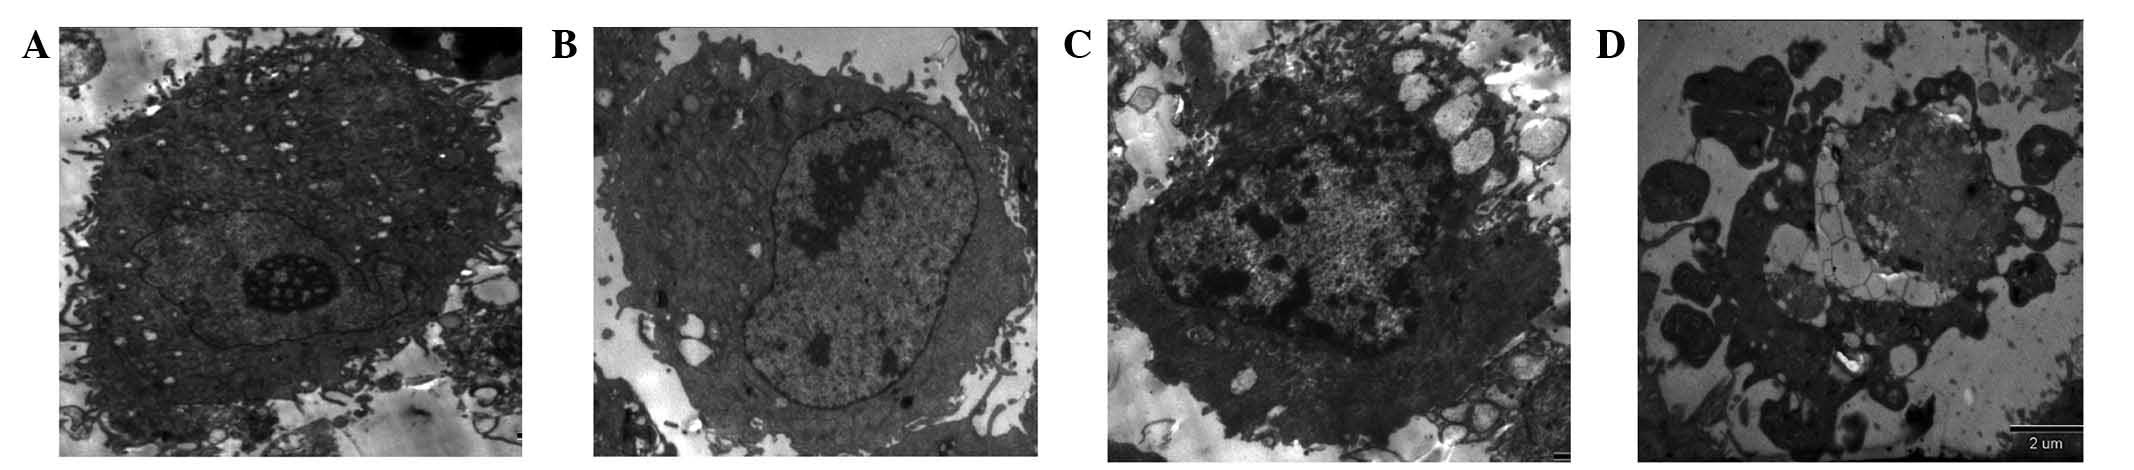
TEM
The results from the TEM demonstrated that the
control HSSCs were oval, with a large number of microvilli on the
cell surface. The nuclei were clearly visible, the distribution of
intranuclear chromatin was uneven and intracytoplasmic mitochondria
were common (Fig. 4). Following
drug coculture, the cells appeared to morphologically transition to
exhibit apoptotic characteristics. These predominantly manifested
as disappearance and condensation of the microvilli on the
apoptotic cell surface, and the appearance of marginated
intranuclear chromatin. Additionally, in the early cellular stages,
HSSCs were crescent-shaped, whilst during the late stage the cells
swelled and ruptured, the nuclei shrank and fragmented, a large
number of vacuoles appeared in the cytoplasm and apoptotic bodies
appeared (Fig. 4).
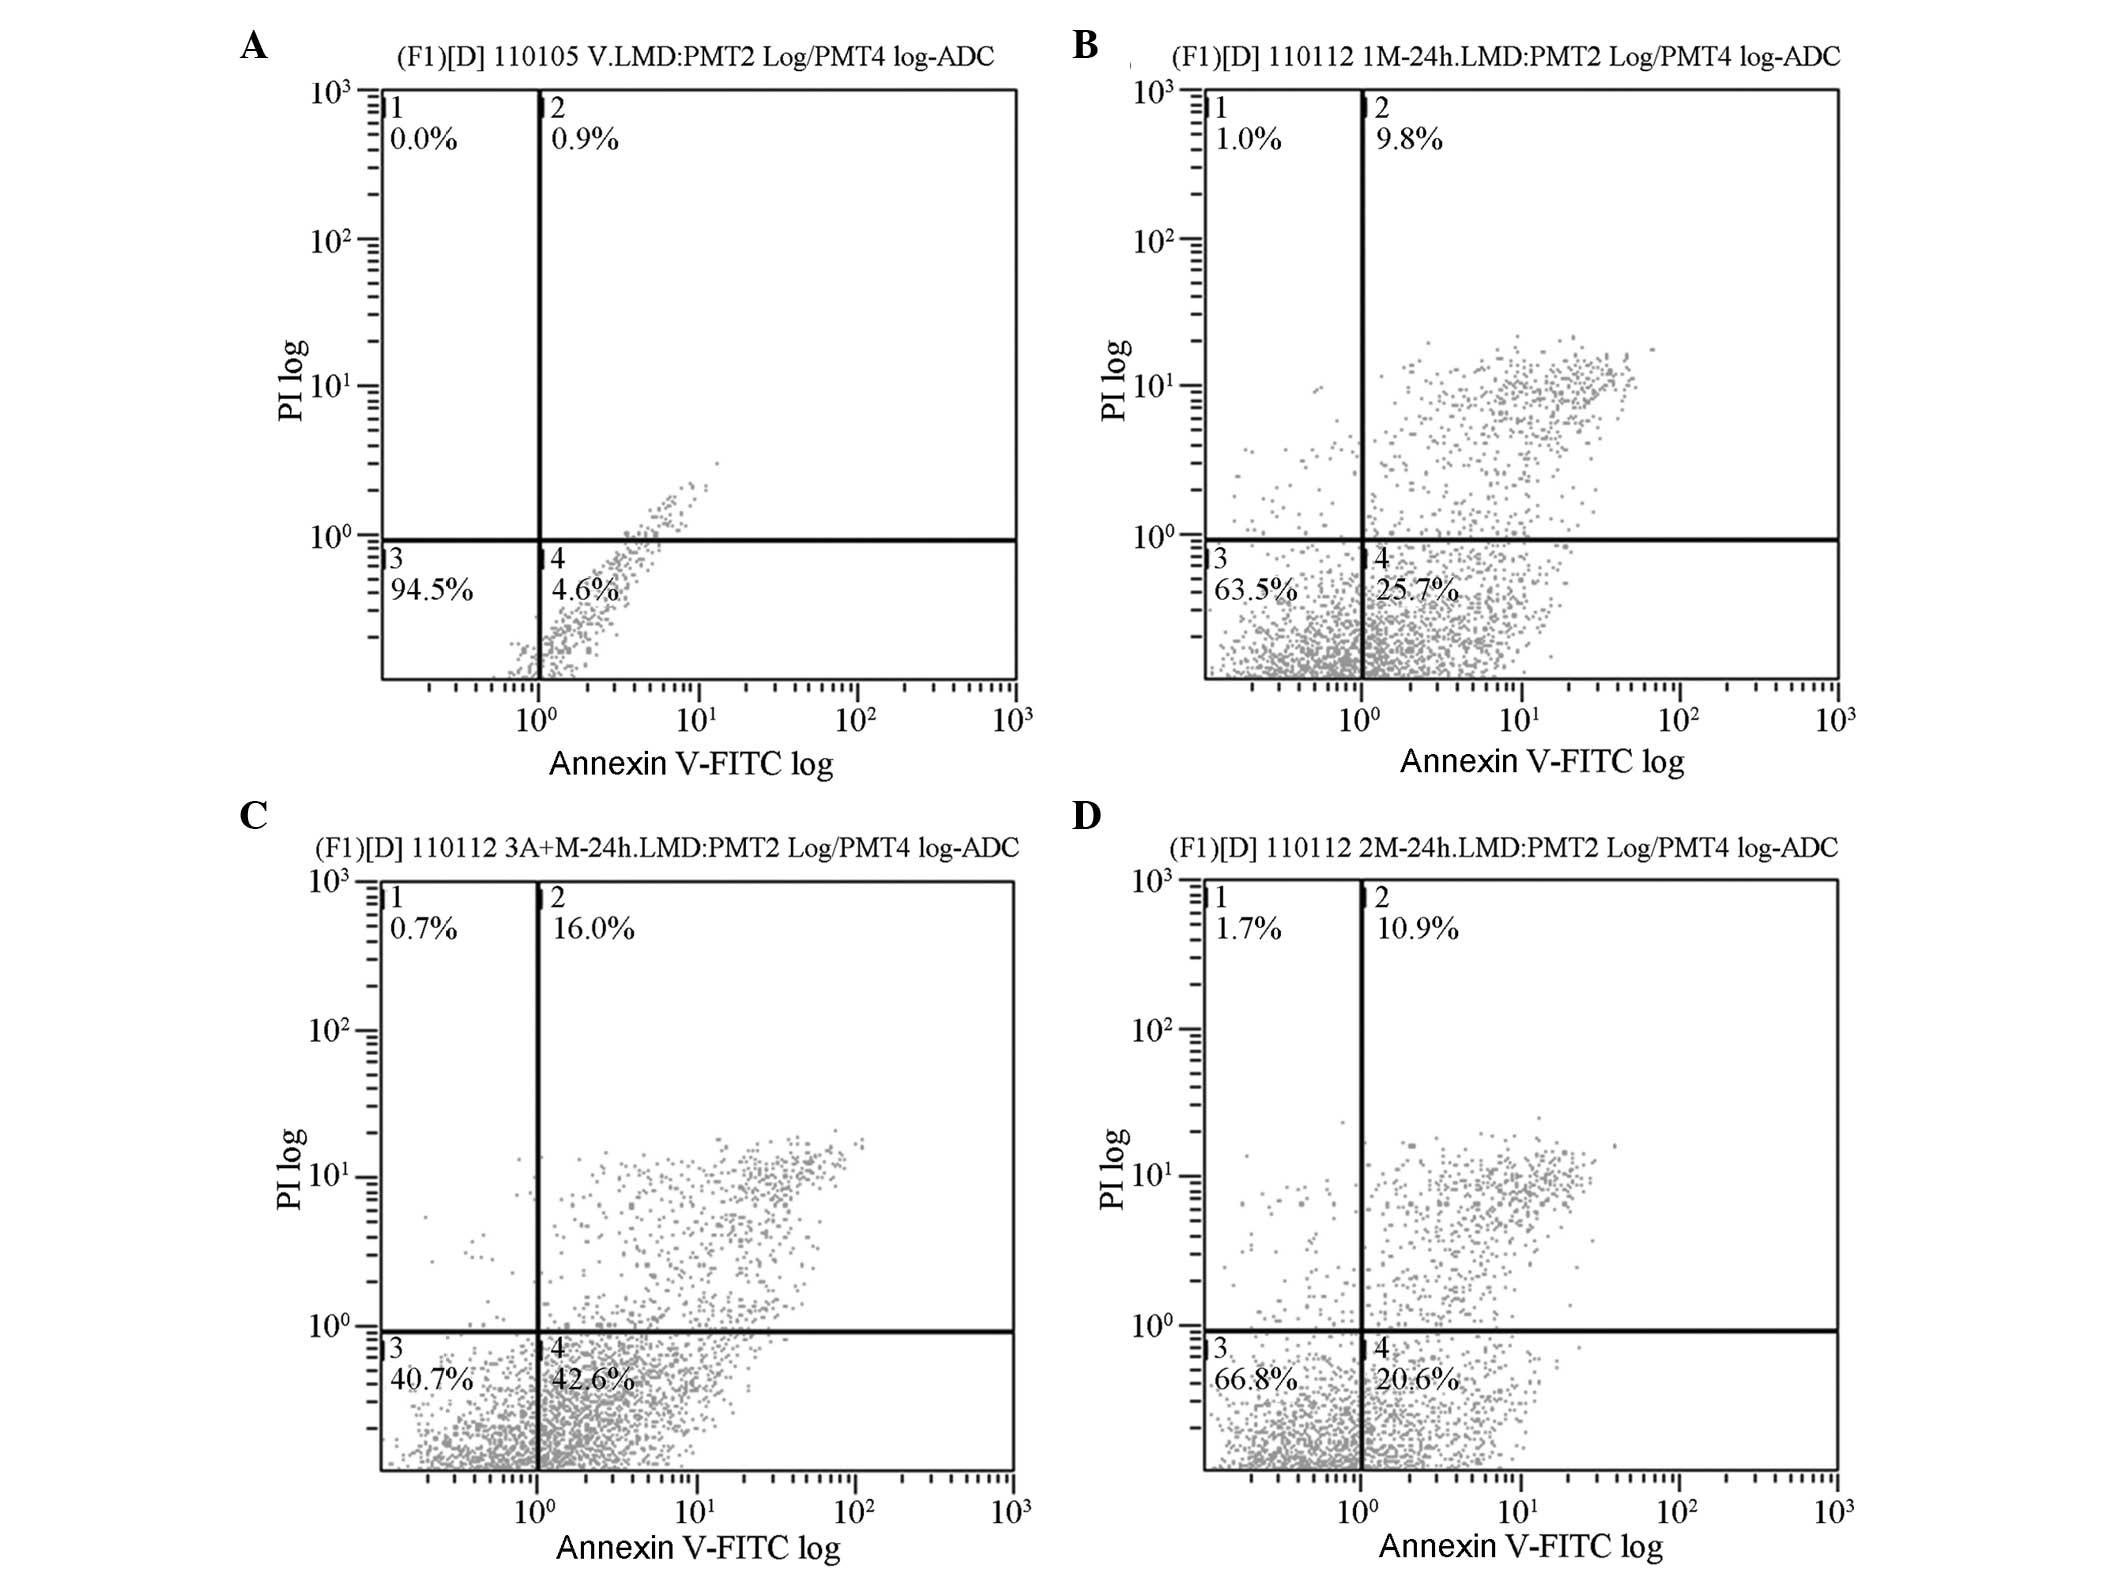
Analysis of apoptosis
Following coculture for 48 h, the early apoptotic
rates of L-gossypol and doxorubicin in the experimental groups were
18.40±2.20 and 23.20±2.45%, respectively, which were significantly
higher than the control group (4.30±0.26%; P<0.001) (Table III, Fig. 5). The early apoptotic rate of
L-gossypol/doxorubicin combination therapy was (38.70±3.40%). No
significant interaction between the two drugs was observed
(P=0.623), however, a single-factor analysis of variance revealed
that the apoptotic rate in the combination group was significantly
increased compared with the other groups (P<0.001).
| Table IIIImpact analysis of cell
apoptosis. |
Table III
Impact analysis of cell
apoptosis.
| Group | Apoptotic rate | ANOVA of factorial
design
| ANOVA of single
factor
|
|---|
| F-ratio | P-value | F-ratio | P-value |
|---|
| Control | 4.30±0.26 | | | 107.562 | <0.001 |
| Doxorubicin | 23.20±2.45ac | 205.342 | <0.001 | | |
| L-gossypol | 18.40±2.20ab | 117.082 | <0.001 | | |
| Combination | 38.70±3.40abc | 0.262 | 0.623 | | |
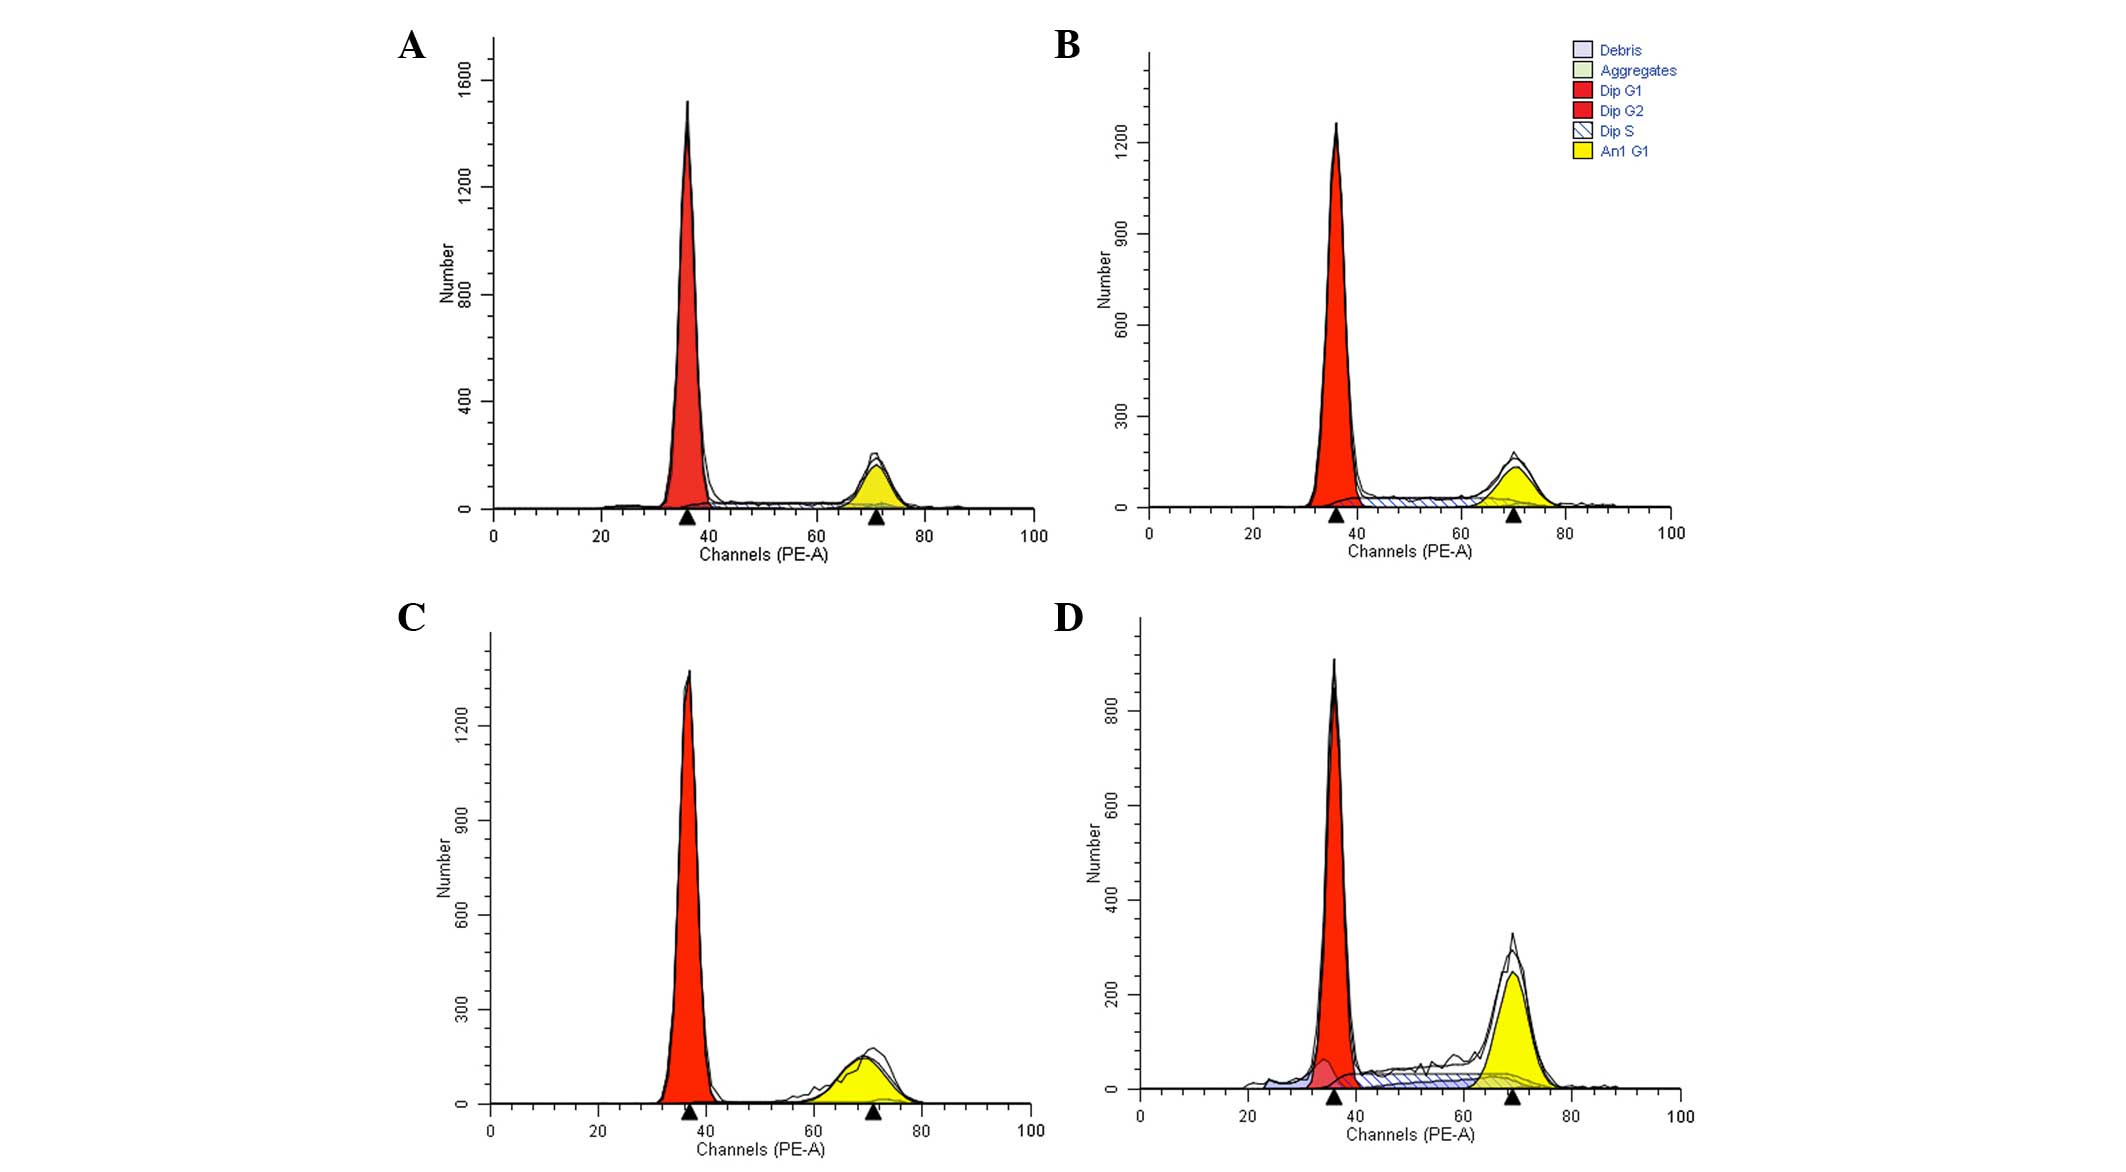
Analysis of cell cycle
The proportion of cells in the G1 phase
in the experimental groups increased significantly following 24-h
drug treatment (P=0.05 and P<0.001 in the doxorubicin and
L-gossypol groups, respectively; Table IV). As presented in Table V, following 48-h coculture, the
proportion of L-gossypol group cells in the G1 phase
increased to 88.31±1.26%, compared with 80.95±1.61% in the control
group (P=0.048). The numbers of cells in the S phase in the
doxorubicin group (15.03±1.29%) and the combination group
(26.29±1.16%) were also significantly different compared with the
control group (9.48±0.65%; P<0.001) and a significant
interaction was observed (P<0.001). These results indicate that
L-gossypol predominantly arrests the cells in the G1
phase, while doxorubicin and the combination therapy predominantly
arrest cells in the S phase (Table
IV and V, Fig. 6).
| Table IVAlterations in the cell cycle
following drug treatment of SW982 cells for 24 h. |
Table IV
Alterations in the cell cycle
following drug treatment of SW982 cells for 24 h.
| Group | G1 | ANOVA of factorial
design
| G2 | S | ANOVA of factorial
design
|
|---|
| F-ratio | P-value | F-ratio | P-value |
|---|
| Control | 78.56±2.51 | | | 7.18±0.93 | 13.31±2.45 | | |
| Doxorubicin | 83.75±1.48a | 5.32 | 0.05 | 9.16±1.42 | 5.53±1.45a | 13.77 | 0.01 |
| L-gossypol | 86.32±3.15ab | 18.93 | <0.001 | 8.52±2.42 | 3.90±1.95a | 27.39 | <0.001 |
| Combination | 86.96±0.84a | 3.26 | 0.11 | 8.32±2.05 | 3.80±1.56a | 13.03 | 0.01 |
| F-ratio | 9.169 | | | 0.670 | 18.063 | | |
| P-value | 0.006 | | | 0.594 | 0.001 | | |
| Table VAlterations in the cell cycle
following drug treatment of SW982 cells for 48 h. |
Table V
Alterations in the cell cycle
following drug treatment of SW982 cells for 48 h.
| Group | G1 | ANOVA of factorial
design
| G2 | S | ANOVA of factorial
design
|
|---|
| F-ratio | P-value | F-ratio | P-value |
|---|
| Control | 80.95±1.61 | | | 8.41±0.83 | 9.48±0.65 | | |
| Doxorubicin | 76.71±1.26a | 253.066 | <0.001 | 7.18±0.93 | 15.03±1.29a | 705.678 | <0.001 |
| L-gossypol | 88.31±1.26ab | 5.421 | 0.048 | 8.17±1.82 | 2.79±0.32ab | 17.443 | 0.003 |
| Combination | 65.38±1.73abc | 119.75 | <0.001 | 7.13±0.74 | 26.29±1.16abc | 269.791 | <0.001 |
| F-ratio | 126.079 | | | 0.978 | 330.97 | | |
| P-value | <0.001 | | | 0.450 | <0.001 | | |
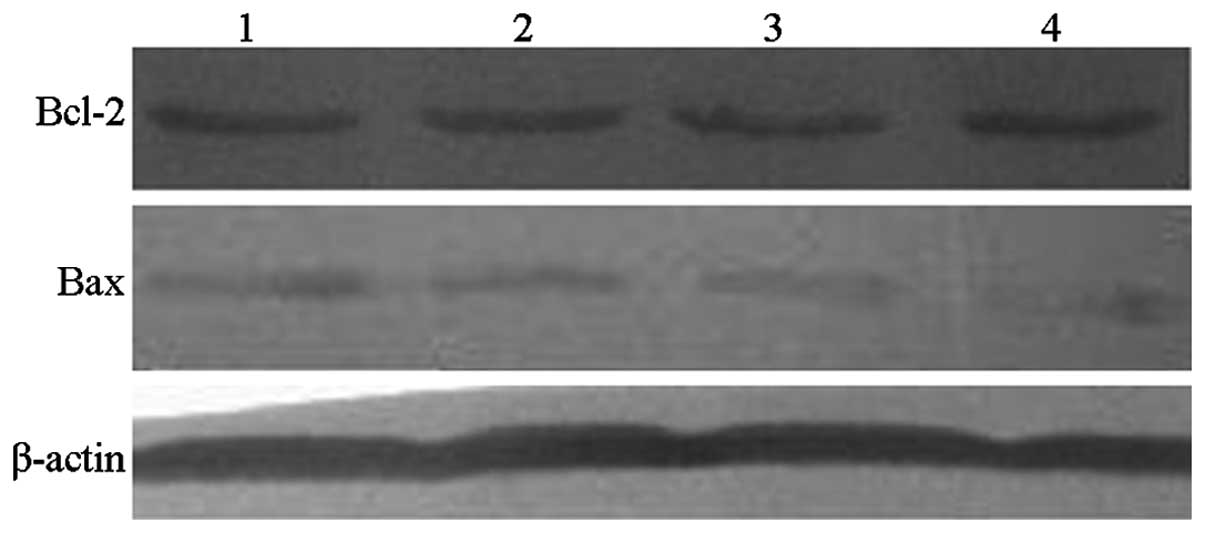
Bcl-2 and Bax protein expression
levels
Bcl-2 protein levels following L-gossypol and
doxorubicin coculture (18.30±1.32% and 19.73±2.01%, respectively)
were significantly reduced compared with the control group
(32.66±1.58%; P<0.001) (Table
VI and Fig. 7). In addition,
during combination therapy, the levels of Bcl-2 were further
reduced (6.43±0.97%) while the interaction of the two drugs was not
significant. Furthermore, L-gossypol and doxorubicin produced
significant increases in Bax protein levels (18.08±1.46% and
12.36±1.80%) when compared with the control group (4.36±0.60%;
P<0.001). Following combination therapy, Bax levels were further
increased (25.31±1.41%), however, no significant interaction
between the two drugs was observed (P=0.644).
| Table VIAlterations in Bcl-2 and Bax protein
expression levels following drug treatment of SW982 cells for 24
h. |
Table VI
Alterations in Bcl-2 and Bax protein
expression levels following drug treatment of SW982 cells for 24
h.
| Group | Bcl-2/β-actin
(%) | ANOVA of factorial
design
| Bax/β-actin
(%) | ANOVA of factorial
design
|
|---|
| F-ratio | P-value | F-ratio | P-value |
|---|
| Control | 32.66±1.58 | | | 4.36±0.60 | | |
| Doxorubicin | 19.73±2.01a | 248.663 | <0.001 | 12.36±1.80a | 90.289 | <0.001 |
| L-gossypol | 18.30±1.32a | 199.791 | <0.001 | 18.08±1.46ab | 276.769 | <0.001 |
| Combination | 6.43±0.97abc | 0.365 | 0.562 | 25.31±1.41abc | 0.2317 | 0.644 |
| F-ratio | 149.607 | | | 122.43 | | |
| P-value | <0.001 | | | <0.001 | | |
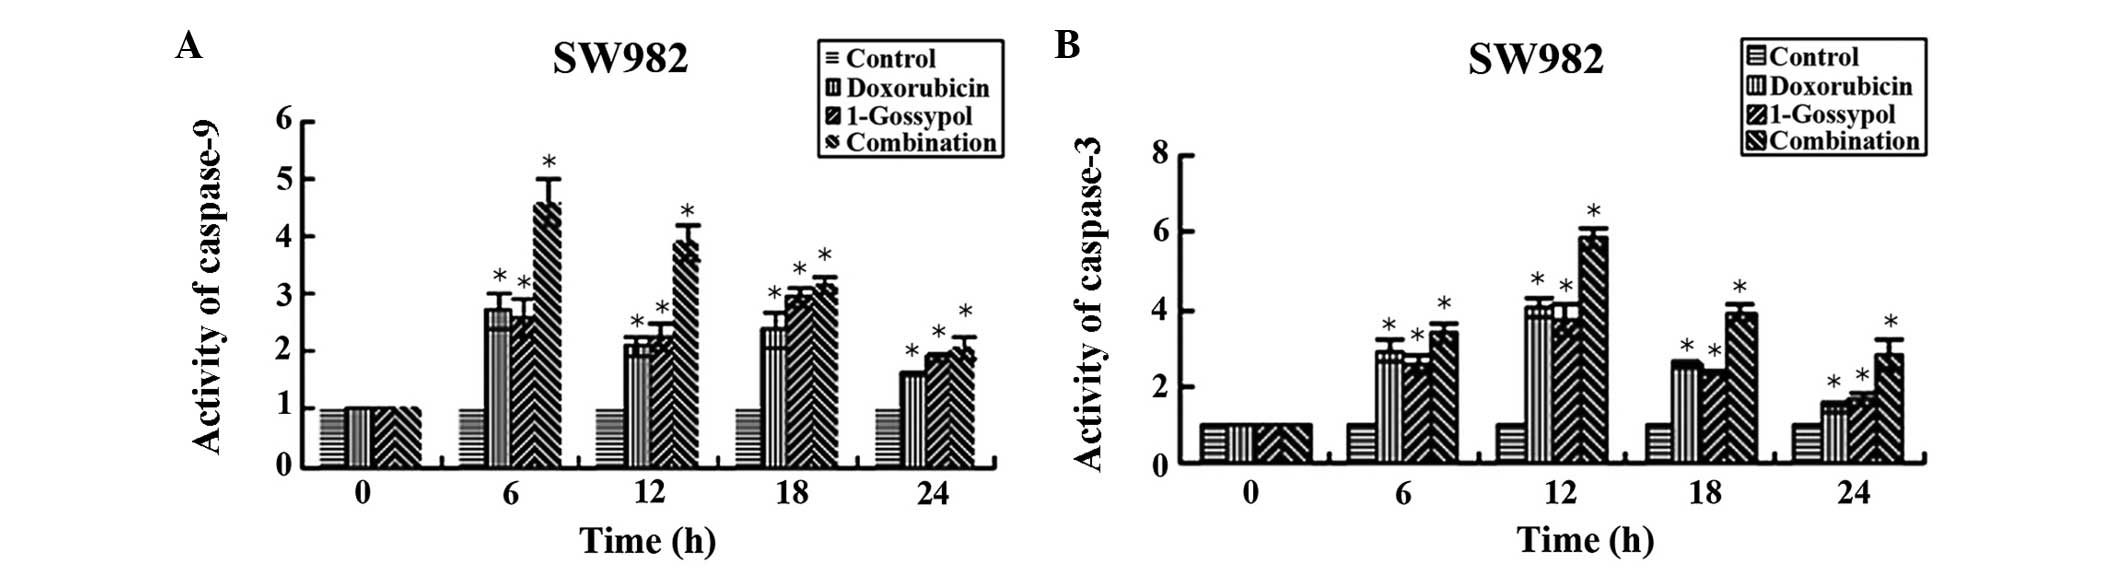
Caspase-3 and -9 activity
Significant activation of caspase-9 and -3 in SW982
cells was observed in every treatment group at at least one time
point, compared with time point 0 h (P<0.05). Caspase-9 activity
reached its maximum value at 6 h subsequent to drug administration.
Following 12 h, caspase-9 activity began to decline towards the
control level. By contrast, no caspase-3 activity was observed
prior to 12 h, and began to reduce at 18 h. The single-factor
analysis of variance indicated that the combination group led to a
significantly greater increase in caspase activity compared with
the L-gossypol group, the doxorubicin group and the control group
(P<0.05, Fig. 8). The data also
demonstrate that the concentration required to achieve the same
inhibitory effect was lower in the combination therapy group (data
not shown).
Discussion
Apoptosis is controlled by various genes and is a
process of programmed death that results in alterations in cellular
morphology. These alterations include chromatin condensation and
peripheralization, cytoplasm reduction and densification, nuclear
fragmentation, interruption of surrounding cell contacts and fusion
of endoplasmic reticulum and the cell membrane (16). The result of these morphological
alterations is the formation of apoptotic bodies from cell
fragmentation. The mitochondrial pathway is vital in apoptosis, and
a variety of pro-apoptotic factors act on the mitochondria, leading
to the opening of the mitochondrial permeability transition pore.
Damage to the outer membrane in turn results in an increased
permeability of the mitochondrial membrane, thus resulting in a
release of apoptosis-associated molecules, which in turn activate
apoptotic factors such as caspase-9 and its downstream factor,
caspase-3 (17). This ultimately
results in apoptosis. The results of the current study suggest that
L-gossypol and/or LCD-induced apoptosis is results from the
activation of caspase-9, in addition to downstream caspase-3
activation.
The results of the current study also demonstrated
that L-gossypol and LCD therapy resulted in a clear reduction in
Bcl-2 and an increase in Bax protein content. In addition, when
these two drugs were used in combination therapy, the alterations
in Bcl-2 and Bax protein expression levels were observed to be more
pronounced. The members of the Bcl-2 family are important in
apoptosis and are widely distributed in the outer mitochondrial
membrane, nuclear membrane and endoplasmic reticulum. They possess
the ability to either inhibit (via Bcl-2), or activate (via Bax)
the process of apoptosis. In addition, Bcl-2 has been reported to
inhibit the activation of Bax protein (18), isolate or inactivate Bax protein
(19,20), form a heterodimer with Bax and
inhibit the formation of the Bax/Bax homodimer (21). When the Bax/Bcl-2 heterodimer is
formed, Bax loses its ability to alter the permeability of the
mitochondrial membrane, and thus cannot induce cellular apoptosis
(22–24). Bcl-2 and Bax are part of a dynamic
system in which the ratio of Bcl-2/Bax determines whether apoptosis
occurs or not (25,26), and this is mediated via caspase-3
(27,28). Therefore, it was hypothesized that
L-gossypol and LCD therapies act by altering the ratio of Bcl-2 and
Bax protein via a mitochondria-dependent mechanism, which results
in the activation of caspase-9. This theory is supported by the
observation that combination therapy had a synergistic effect,
indicating that these drugs act through the mitochondrial pathway,
thus the apoptotic effects are more pronounced when the two drugs
are combined.
Cell cycle analysis suggested that L-gossypol blocks
cells in the G1 phase, while LCD blocks those in the S
phase; and the combination of the two drugs significantly increased
the number of cells in the S phase. The regulation of the cell
cycle is a complex process, but a previous study indicated the G1/S
checkpoint to be an important point during the cell cycle, at which
numerous factors can affect the cycle (29). It has been observed that 10
μmol/l gossypol arrested MCF-7 cells at the G1/S checkpoint
and inhibited DNA synthesis (30).
In addition, gossypol has been identified to reduce the activity of
DNA polymerase α and β, inhibit DNA synthesis and block the cell
cycle in the S phase, thus indicating gossypol as a specific
inhibitor of DNA synthesis (31).
Certain studies have reported that gossypol does not appear to
alter the cell cycle (32,33), however, these discrepancies are
speculated to be due to the impact of gossypol on the cell cycle
being cell type-specific, or due to differences among gossypol and
its derivatives.
In summary, the current study demonstrated for the
first time that L-gossypol and LCD produce significant effects on
the inhibition of proliferation and the activation of apoptosis in
SW982 HSSCs, and that the combination of the two drugs
significantly potentiates these effects. It is hypothesized that
the mechanism of action of the two drugs is via downregulation of
Bcl-2 protein and upregulation of Bax protein levels, in addition
to the impacts of these drugs on the cell cycle of the HSSCs. The
results of the current study support the use of L-gossypol in
combination with other chemotherapeutic drugs in clinical study. In
addition, they provide a preliminary theoretical foundation for the
clinical use of LCD, which is hypothesized to reduce the dose
required and the resultant side-effects. Further investigation is
required to fully elucidate the cellular and molecular mechanisms
of L-gossypol therapy and the clinical significance of this.
References
|
1
|
van de Rijn M and Fletcher JA: Genetics of
soft tissue tumors. Annu Rev Pathol. 1:435–466. 2006. View Article : Google Scholar
|
|
2
|
Maki RG: Gemcitabine and docetaxel in
metastatic sarcoma: past, present, and future. Oncologist.
12:999–1006. 2007. View Article : Google Scholar : PubMed/NCBI
|
|
3
|
Tschoep K, Kohlmann A, Schlemmer M,
Haferlach T and Issels RD: Gene expression profiling in sarcomas.
Crit Rev Oncol Hematol. 63:111–124. 2007. View Article : Google Scholar : PubMed/NCBI
|
|
4
|
Werner M, Atil B, Sieczkowski E, Chiba P
and Hohenegger M: Simvastatin-induced compartmentalisation of
doxorubicin sharpens up nuclear topoisomerase II inhibition in
human rhabdomyosarcoma cells. Naunyn Schmiedebergs Arch Pharmacol.
386:605–617. 2013. View Article : Google Scholar : PubMed/NCBI
|
|
5
|
Yu YH, Kuo HP, Hsieh HH, et al: Ganoderma
tsugae induces S phase arrest and apoptosis in
doxorubicin-resistant lung adenocarcinoma H23/0.3 cells via
modulation of the PI3K/Akt signaling pathway. Evid Based Complement
Alternat Med. 2012:3712862012. View Article : Google Scholar : PubMed/NCBI
|
|
6
|
NCCN: Soft Tissue Sarcoma. NCCN
Guidelines. Version 1. 2012
|
|
7
|
Longhi A, Ferrari S, Tamburini A, et al:
Late effects of chemotherapy and radiotherapy in osteosarcoma and
Ewing sarcoma patients: the Italian Sarcoma Group Experience
(1983–2006). Cancer. 118:5050–5059. 2012. View Article : Google Scholar : PubMed/NCBI
|
|
8
|
Huang YW, Wang LS, Chang HL, et al:
Effects of serum on (-)-gossypol-suppressed growth in human
prostate cancer cells. Anticancer Res. 26:3613–3620.
2006.PubMed/NCBI
|
|
9
|
Lian J, Ni Z, Dai X, et al: Sorafenib
sensitizes (-)-gossypol-induced growth suppression in
androgen-independent prostate cancer cells via Mcl-1 inhibition and
Bak activation. Mol Cancer Ther. 11:416–426. 2012. View Article : Google Scholar
|
|
10
|
Pang X, Wu Y, Wu Y, et al: (-)-Gossypol
suppresses the growth of human prostate cancer xenografts via
modulating VEGF signaling-mediated angiogenesis. Mol Cancer Ther.
10:795–805. 2011. View Article : Google Scholar : PubMed/NCBI
|
|
11
|
Enyedy IJ, Ling Y, Nacro Y, et al:
Discovery of small-molecule inhibitors of Bcl-2 through
structure-based computer screening. J Med Chem. 44:4313–4324. 2001.
View Article : Google Scholar : PubMed/NCBI
|
|
12
|
Oliver CL, Miranda MB, Shangary S, et al:
(-)-Gossypol acts directly on the mitochondria to overcome Bcl-2-
and Bcl-X(L)-mediated apoptosis resistance. Mol Cancer Ther.
4:23–31. 2005. View Article : Google Scholar : PubMed/NCBI
|
|
13
|
Blackstaffe L, Shelley MD and Fish RG:
Cytotoxicity of gossypol enantiomers and its quinone metabolite
gossypolone in melanoma cell lines. Melanoma Res. 7:364–372. 1997.
View Article : Google Scholar
|
|
14
|
Qui J, Levin LR, Buck J and Reidenberg MM:
Different pathways of cell killing by gossypol enantiomers. Exp
Biol Med (Maywood). 227:398–401. 2002.
|
|
15
|
Wolter KG, Wang SJ, Henson BS, et al:
(-)-gossypol inhibits growth and promotes apoptosis of human head
and neck squamous cell carcinoma in vivo. Neoplasia. 8:163–172.
2006. View Article : Google Scholar : PubMed/NCBI
|
|
16
|
Reed JC: Bcl-2 and the regulation of
programmed cell death. J Cell Biol. 124:1–6. 1994. View Article : Google Scholar : PubMed/NCBI
|
|
17
|
Porter AG and Jänicke RU: Emerging roles
of caspase-3 in apoptosis. Cell Death Differ. 6:99–104. 1999.
View Article : Google Scholar : PubMed/NCBI
|
|
18
|
Mego M: Telomerase inhibitors in
anticancer therapy: gossypol as a potential telomerase inhibitor.
Bratisl Lek Listy. 103:378–381. 2002.
|
|
19
|
Balci A, Sahin FI and Ekmekci A: Gossypol
induced apoptosis in the human promyelocytic leukemia cell line HL
60. Tohoku J Exp Med. 189:51–57. 1999. View Article : Google Scholar
|
|
20
|
Tamir S, Zuris JA, Agranat L, et al:
Nutrient-deprivation autophagy factor-1 (NAF-1): biochemical
properties of a novel cellular target for anti-diabetic drugs. PLoS
One. 8:e612022013. View Article : Google Scholar : PubMed/NCBI
|
|
21
|
Zhang M, Liu H, Guo R, et al: Molecular
mechanism of gossypol-induced cell growth inhibition and cell death
of HT-29 human colon carcinoma cells. Biochem Pharmacol. 66:93–103.
2003. View Article : Google Scholar : PubMed/NCBI
|
|
22
|
Ergun MA, Konac E, Erbas D and Ekmekci A:
Apoptosis and nitric oxide release induced by thalidomide, gossypol
and dexamethasone in cultured human chronic myelogenous leukemic
K-562 cells. Cell Biol Int. 28:237–242. 2004. View Article : Google Scholar : PubMed/NCBI
|
|
23
|
Kvansakul M and Hinds MG: Structural
biology of the Bcl-2 family and its mimicry by viral proteins. Cell
Death Dis. 4:e9092013. View Article : Google Scholar : PubMed/NCBI
|
|
24
|
Czabotar PE, Westphal D, Dewson G, et al:
Bax crystal structures reveal how BH3 domains activate Bax and
nucleate its oligomerization to induce apoptosis. Cell.
152:519–531. 2013. View Article : Google Scholar : PubMed/NCBI
|
|
25
|
Chang JS, Hsu YL, Kuo PL, Chiang LC and
Lin CC: Upregulation of Fas/Fas ligand-mediated apoptosis by
gossypol in an immortalized human alveolar lung cancer cell line.
Clin Exp Pharmacol Physiol. 31:716–722. 2004. View Article : Google Scholar : PubMed/NCBI
|
|
26
|
Yoon O and Roh J: Downregulation of KLF4
and the Bcl-2/Bax ratio in advanced epithelial ovarian cancer.
Oncol Lett. 4:1033–1036. 2012.PubMed/NCBI
|
|
27
|
Mohammad RM, Wang S, Aboukameel A, Chen B,
Wu X, Chen J and Al-Katib A: Preclinical studies of a nonpeptidic
small-molecule inhibitor of Bcl-2 and Bcl-X(L) [(-)-gossypol]
against diffuse large cell lymphoma. Mol Cancer Ther. 4:13–21.
2005. View Article : Google Scholar : PubMed/NCBI
|
|
28
|
Maurya SK, Tewari M, Sharma B and Shukla
HS: Expression of procaspase 3 and activated caspase 3 and its
relevance in hormone-responsive gallbladder carcinoma chemotherapy.
Korean J Intern Med. 28:573–578. 2013. View Article : Google Scholar : PubMed/NCBI
|
|
29
|
Kasten-Pisula U, Windhorst S, Dahm-Daphi
J, Mayr G and Dikomey E: Radiosensitization of tumour cell lines by
the polyphenol Gossypol results from depressed double-strand break
repair and not from enhanced apoptosis. Radiother Oncol.
83:296–303. 2007. View Article : Google Scholar : PubMed/NCBI
|
|
30
|
Bushunow P, Reidenberg MM, Wasenko J, et
al: Gossypol treatment of recurrent adult malignant gliomas. J
Neurooncol. 43:79–86. 1999. View Article : Google Scholar : PubMed/NCBI
|
|
31
|
Nielsen OS, Judson I, van Hoesel Q, et al:
Effect of high-dose ifosfamide in advanced soft tissue sarcomas. A
multicentre phase II study of the EORTC Soft Tissue and Bone
Sarcoma Group. Eur J Cancer. 36:61–67. 2000. View Article : Google Scholar : PubMed/NCBI
|
|
32
|
Garcia-Carbonero R, Supko JG, Manola J, et
al: Phase II and pharmacokinetic study of ecteinascidin 743 in
patients with progressive sarcomas of soft tissues refractory to
chemotherapy. J Clin Oncol. 22:1480–1490. 2004. View Article : Google Scholar : PubMed/NCBI
|
|
33
|
Kapoor S: Attenuating effect of gossypol
on tumor growth in systemic malignancies. Cell Biochem Biophys.
67:1551–1552. 2013. View Article : Google Scholar : PubMed/NCBI
|