Introduction
Diabetic nephropathy (DN) is a chronic microvascular
complication of type 1 and type 2 diabetes mellitus and is the
leading cause of progressive chronic kidney disease and end-stage
renal disease, which puts a serious burden on the patient's family
and on society (1).
The exact pathogenic mechanisms and the molecular
events of DN remain unclear. Evidence suggests that environmental
and genetic factors are involved in the development of DN (2). A number of factors are known to be
critical in the development of DN, such as insulin-like growth
factor 1 (IGF1), transforming growth factor beta, platelet-derived
growth factor (PDGF), fibroblast growth factor (FGF), interleukins
(ILs), tumor necrosis factor-α (TNF-α), vascular endothelial growth
factor (VEGF) and endothelin (3).
These factors effect processes including glucose metabolism, renal
hemodynamics, cell matrix metabolism, cell proliferation, cell
hypertrophy, cell apoptosis, abnormal angiogenesis and
cytokine-mediated inflammatory response, which are involved in DN
pathogenesis. Searching for agents that regulate the expression of
these cytokines to intervene and prevent the development of DN an
area of research.
Ginsenoside Rg3 is an active ingredients in Ginseng,
which can inhibit the growth and metastasis of tumors through the
downregulation of VEGF, bFGF gene expression and inhibiting the
formation of abnormal new blood vessels. Besides, ginsenoside Rg3
has a number of pharmacological effects, including the inducing the
apoptosis of tumor cells, promoting T lymphocyte mitosis and NK
cell activity, stimulating the phagocytic function of the
reticuloendothelial system, promoting the secretion of B lymphocyte
antibodies, promoting antiplatelet aggregation to prevent
thrombosis, dilating the blood vessels and increasing blood supply
(4,5).
Therefore, it was hypothesized that ginsenoside Rg3
could prevent the occurrence and development of DN by effecting the
gene expression and regulation of various cytokines to delay the
progression of DN to end-stage renal failure. To the best of our
knowledge, this study was the first to observe the effect of
ginsenoside Rg3 on the changes of the gene expression profile in DN
rats, which may aid in the identification of novel targets for the
treatment of DN.
Materials and methods
Animal group
Six male Sprague-Dawley (SD) rats were provided by
Shanghai Laboratory Animal Center (Shanghai, China) (average
weight, 300 g). The rats were divided randomly into three groups:
Control group (sample ID: 1 and 3), DN control group (sample ID: 8
and 9) and ginsenoside-Rg3 treatment group (sample ID: 15 and 16),
with two rats in each group.
Modeling and Rg3 drugs
The normal control group was given normal feed. The
DN control and ginsenoside-Rg3 treatment groups were administered a
high lipid diet for two months, then were treated with
intraperitoneal injection of streptozotocin (STZ; 45 mg/kg) induced
diabetic nephropathy. After the models were established, the
ginsenoside-Rg3 treatment group were administered Rg3 (0.5 mg/kg)
once a day for 30 days.
RNA extraction
Samples from renal cortex were collected and stored
in liquid nitrogen at −80°C until RNA extraction was performed.
Total RNA was extracted from the samples of renal cortex using
TRIzol reagent (Thermo Fisher Scientific, Inc., Waltham, MA, USA)
according to the manufacturer's instructions. RNA quantity and
quality were measured using the NanoDrop ND-1000 spectrophotometer
and Agilent Bioanalyzer 2100 (Agilent technologies, Santa Clara,
CA, USA).
RNA-seq data generation
RNA-seq libraries were prepared in accordance with
Illumina's sample preparation protocol. The libraries were
sequenced onto an Illumina HiSeq2000 instrument (Illumina Inc., San
Diego, CA, USA) and subjected to 100 cycles of paired end (2×100
bp) sequencing. The processing of fluorescent images into
sequences, base-calling and quality value calculations were
performed using the Illumina data processing pipeline (version
1.8). Prior to assembly, high-quality clean reads were generated
using FASTX toolkit pipeline (version 0.0.13), then the resulting
high-quality reads were mapped onto the UCSC (mm10) using Tophat
(version: 2.0.6) (6). Cufflink
(version: 2.0.2) (7) was used to
process the Tophat alignments. Additionally, transcript expression
levels were estimated using Fragments Per Kilobases per Million
reads (FPKM) values. Finally, the program Cuffdiff was used to
define differentially expressed genes as a gene set for further
analysis. The selection criteria of differentially expressed genes
was based upon the fold-changes of the expression levels
(P<0.05). If the gene expression status was consistent in two
comparison groups (DN control group vs. the normal control group
including sample ID1 vs. ID8 and sample ID3 vs. ID9;
ginsenoside-Rg3 treatment group vs. DN control group including
sample ID8 vs. ID15 and sample ID9 vs. ID16), they were defined as
differentially expressed genes. All analyses were performed at
Shanghai Biotechnology Corporation (Shanghai, China).
Gene Ontology (GO) and Kyoto Encyclopedia
of Genes and Genomes (KEGG) enrichment analyses
In order to examine the biological significance of
the differentially expressed genes, the GO and KEGG (http://www.genome.jp/kegg/) pathway analysis produced
by Kanehisa Laboratories (Kyoto, Japan) were performed to
investigate their functional and pathway annotation (8,9). GO
and pathway analyses were conducted using TargetMine (available at
http://targetmine.nibio.go.jp/) based on
a hypergeometric test (10).
Results
Differentially expressed genes generated
by RNA-Seq Normal control group and DN control group
Totally, 78 differentially expressed genes in the DN
control group were identified compared with the normal control
group. Of these, 52 genes were upregulated while 26 genes were
downregulated. The top ten enriched differentially expressed genes
based on fold-change are listed in Table I.
 | Table ITop ten enriched differentially
expressed genes in the DN control group compared with the normal
control group. |
Table I
Top ten enriched differentially
expressed genes in the DN control group compared with the normal
control group.
| Gene | Description |
|---|
| Upregulated |
| Angptl4 | Angiopoietin-like
4 |
| Hmgcs2 |
3-Hydroxy-3-methylglutaryl-CoA synthase 2
(mitochondrial) |
| Havcr1 | Hepatitis A virus
cellular receptor 1 |
| Gpx2 | Glutathione
peroxidase 2 |
| Slc25a25 | Solute carrier family
25 (mitochondrial carrier, phosphate carrier), member 25 |
| Rarres2 | Retinoic acid
receptor responder (tazarotene induced) 2 |
| Spp1 | Secreted
phosphoprotein 1 |
| Serhl2 | Serine hydrolase-like
2 |
| Eci1 | Enoyl-CoA Δ isomerase
1 |
| Apoc2 | Apolipoprotein
C-II |
| Downregulated |
| LOC361914 | Similar to solute
carrier family 7 (cationic amino acid transporter, y+system),
member 12 |
| Cacng5 | Calcium channel,
voltage-dependent, γ subunit 5 |
| Slc7a12 | Solute carrier family
7 (cationic amino acid transporter, y+system), member 12 |
| LOC686288 | Similar to olfactory
receptor Olr1668 |
| Prima1 | Proline rich membrane
anchor 1 |
| Slco1a6 | Solute carrier
organic anion transporter family, member 1a6 |
| RT1-CE1 | RT1 class I,
locus1 |
| Hnmt | histamine
N-methyltransferase |
| Cyp2c11 | Cytochrome P450,
subfamily 2, polypeptide 11 |
| Cyp2c24 | Cytochrome P450,
family 2, subfamily c, polypeptide 24 |
DN control group and ginsenoside-Rg3
treatment group
In total, 43 differentially expressed genes in the
ginsenoside-Rg3 treatment group were identified compared with the
DN control group. Of these, 10 genes were upregulated while 33
genes were downregulated. The top ten enriched differentially
expressed genes based on fold-change are listed in Table II.
| Table IITop ten enriched differentially
expressed genes in the ginsenoside-Rg3 treatment group compared
with the DN control group. |
Table II
Top ten enriched differentially
expressed genes in the ginsenoside-Rg3 treatment group compared
with the DN control group.
| Gene | Description |
|---|
| Upregulated |
| Cyp2c24 | Cytochrome P450,
family 2, subfamily c, polypeptide 24 |
| Gtpbp4 | GTP binding protein
4 |
| Prima1 | Proline rich membrane
anchor 1 |
| Slco1a6 | Solute carrier
organic anion transporter family, meber 1a6 |
| Prlr | Prolactin
receptor |
| Tmem72 | Transmembrane protein
72 |
| Acadsb | Acyl-CoA
dehydrogenase, short/branched chain |
| Ppm1k | Protein
phosphatase, Mg2+/Mn2+ dependent, 1K |
| LOC100365744 | Hypothetical
protein LOC100365744 |
| Slc30a1 | Solute carrier
family 30 (zinc transporter, membrane 1 |
| Downregulated |
| Havcr1 | Hepatitis A virus
cellular receptor 1 |
| Ril | Reversion induced
LIM gene |
| Hmgcs2 |
3-Hydroxy-3-methylglutaryl-CoA synthase 2
(mitochondrial) |
| Slc25a25 | Solute carrier
family 25 (mitochondrial carrier, phosphate carrier), member
25 |
| Cxcl11 | Chemokine (C-X-C
motif) ligand 11 |
| Acaa1b | Acetyl-Coenzyme A
acyltransferase 1B |
| Resp18 | Regulated
endocrine-specific protein 18 |
| Rarres2 | Retinoic acid
receptor responder (tazarotene induced) 2 |
| Rbp1 | Retinol binding
protein 1, cellular |
| Gdf15 | Growth
differentiation factor 15 |
Bioinformatics analysis
In total, 21 genes that were downregulated in the DN
control group compared with the normal control group, were found to
be upregulated in the ginsenoside-Rg3 treatment group compared with
the DN control group. In addition, upregulation of 7 genes in the
DN control group compared with the normal control group were
downregulated in the ginsenoside-Rg3 treatment group compared with
the DN control group. These 28 differentially expressed genes are
shown in Table III.
| Table IIITwenty-eight differentially expressed
genes. |
Table III
Twenty-eight differentially expressed
genes.
| Gene name | Description |
|---|
| LOC100365744 | Hypothetical
protein LOC100365744 |
| Ppm1k | Protein
phosphatase, Mg2+/Mn2+ dependent, 1K |
| Acadsb | Acyl-CoA
dehydrogenase, short/branched chain |
| Slco1a6 | Solute carrier
organic anion transporter family, member 1a6 |
| Prlr | Prolactin
receptor |
| Cyp2c24 | Cytochrome P450,
family 2, subfamily c, polypeptide 24 |
| Prima1 | Proline rich
membrane anchor 1 |
| Hmgcs2 |
3-hydroxy-3-methylglutaryl-CoA synthase 2
(mitochondrial) |
| Eci1 | Enoyl-CoA Δ
isomerase 1 |
| Gdf15 | Growth
differentiation factor 15 |
| Plin2 | Perilipin 2 |
| Slc25a25 | Solute carrier
family 25 (mitochondrial carrier, phosphate carrier), member
25 |
| Havcr1 | Hepatitis A virus
cellular receptor 1 |
| Acaa1a | Acetyl-Coenzyme A
acyltransferase 1A |
| Ephx1 | Epoxide hydrolase
1, microsomal |
| Pck1 | Phosphoenolpyruvate
carboxykinase 1 (soluble) |
| Car15 | Carbonic anhydrase
15 |
| Apoc3 | Apolipoprotein
C-III |
| Ddit4l |
DNA-damage-inducible transcript
4-like |
| Ril | Reversion induced
LIM gene |
| Cyp4a1 | Cytochrome P450,
family 4, subfamily a, polypeptide 1 |
| Rbp1 | Retinol binding
protein 1, cellular |
| Mt1a | Metallothionein
1a |
| Car4 | Carbonic anhydrase
4 |
| Gpx1 | Glutathione
peroxidase 1 |
| Bhmt |
Betaine-homocysteine
S-methyltransferase |
| Rarres2 | Retinoic acid
receptor responder (tazarotene induced) 2 |
| Resp18 | Regulated
endocrine-specific protein 18 |
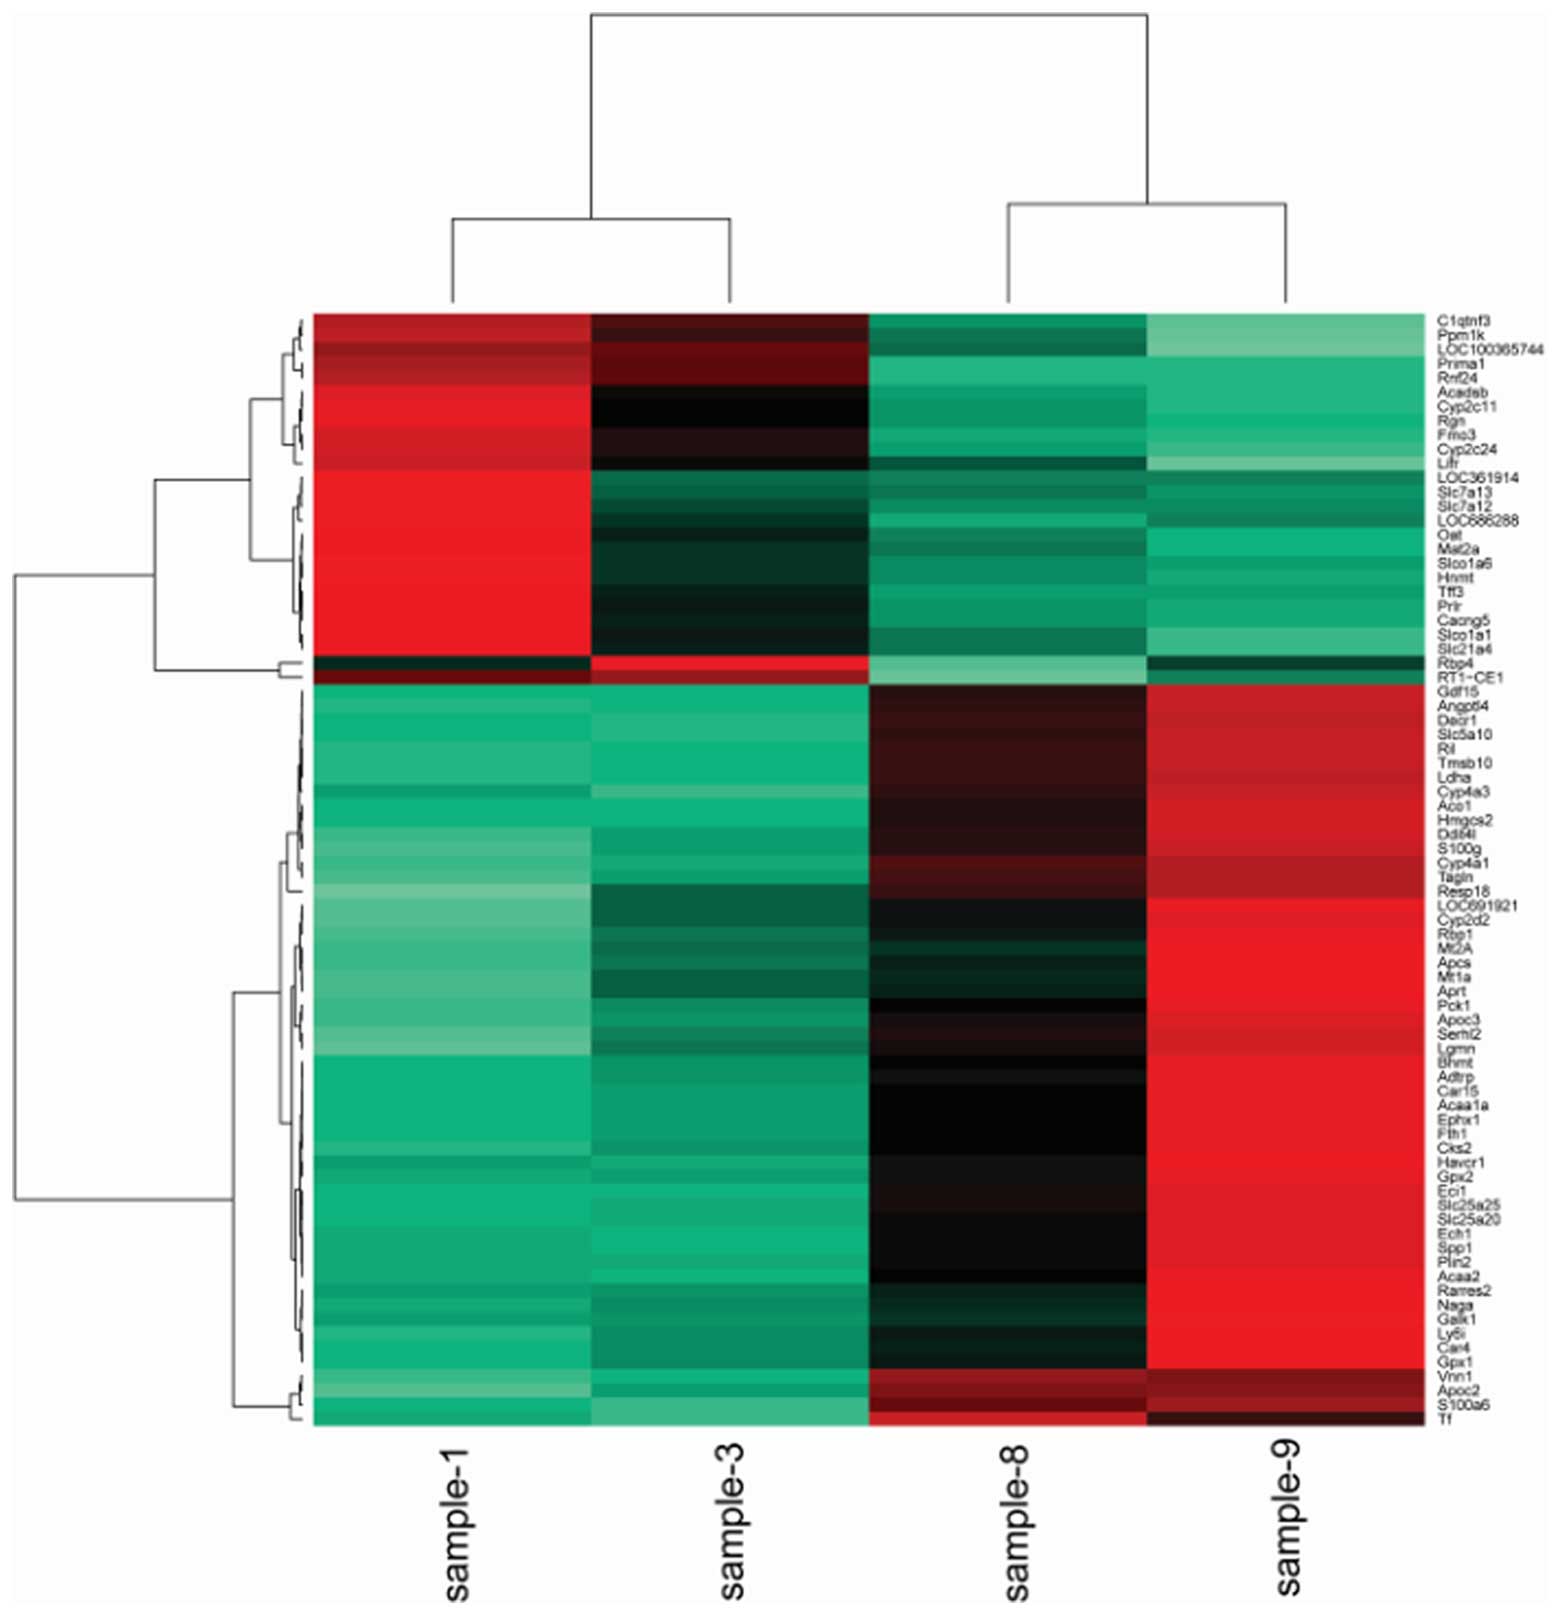
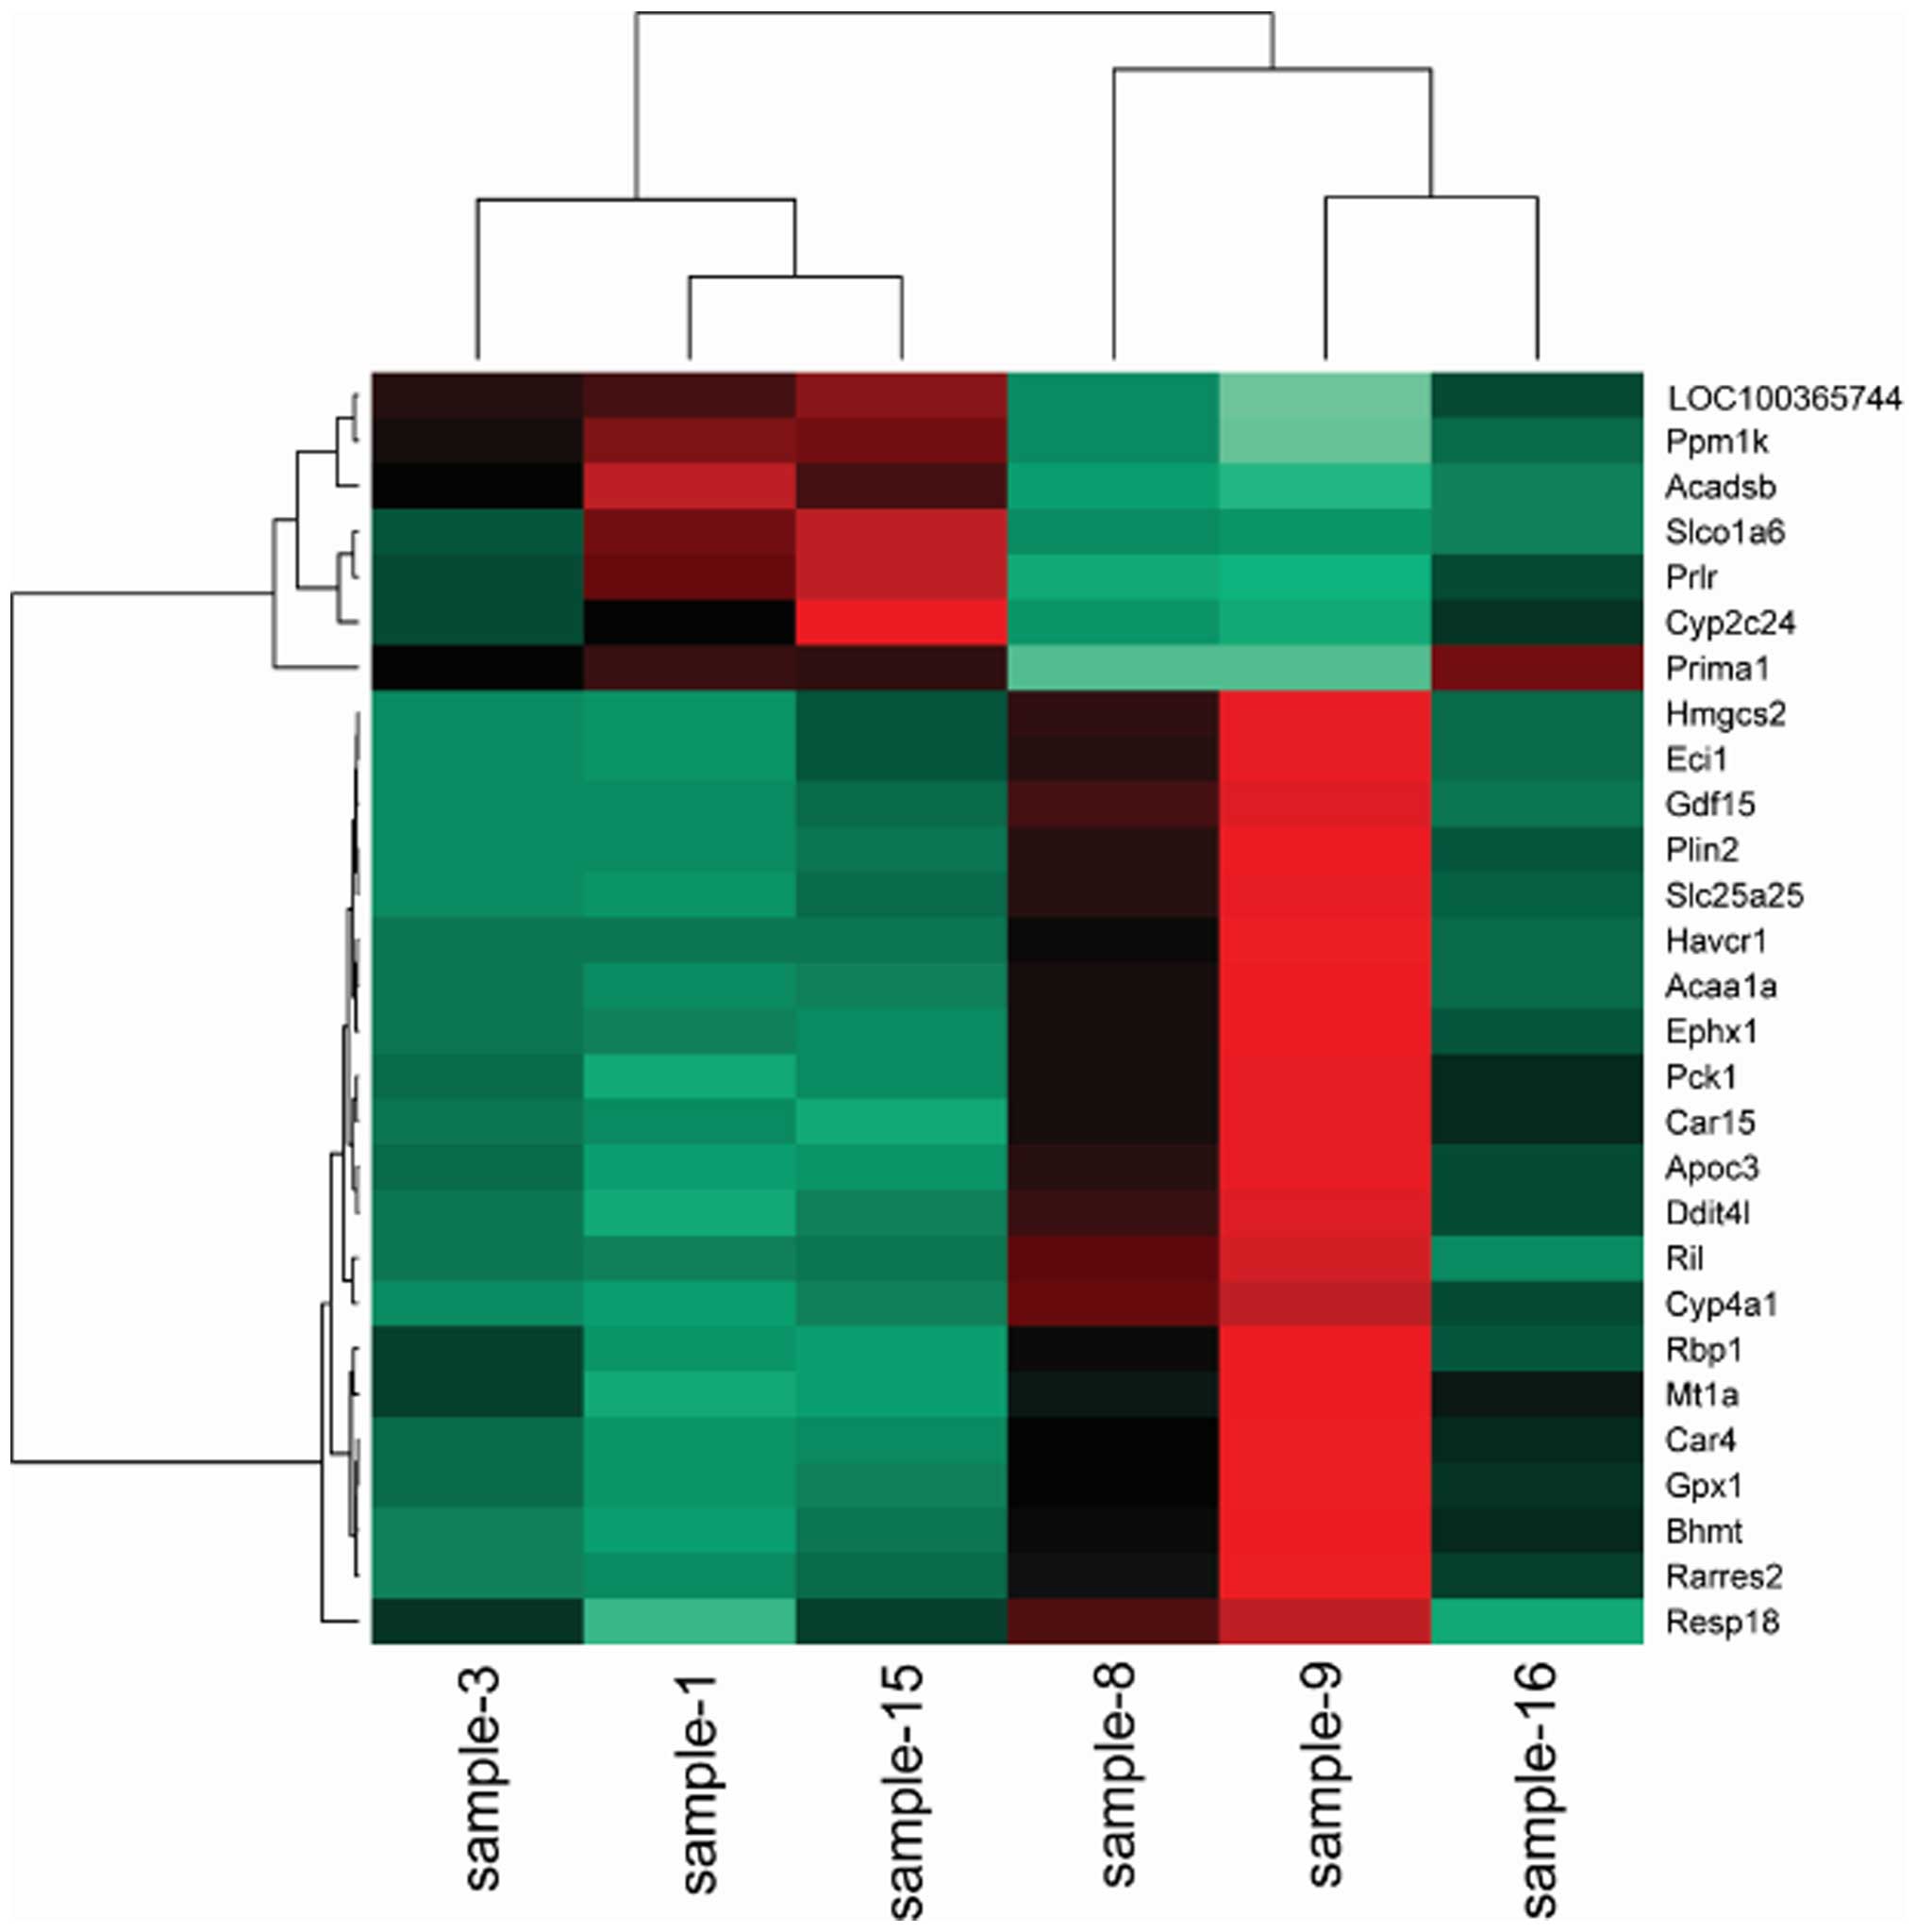
Cluster analysis
To obtain a global view of the differentially
expressed genes, the hierarchical cluster was performed among the
samples. The heat maps indicated that the transcriptomes are
different (Figs. 1Figure 2–3).
GO and KEGG analysis
KEGG analysis was performed on the differentially
expressed genes in the DN control group compared with the normal
control group and in the ginsenoside-Rg3 treatment group compared
with the DN control group, respectively. Significantly affected
pathways were identified in the upregulated gene sets in the normal
control compared with the DN control group, and also in the
downregulated gene sets in the DN control compared with the
ginsenoside-Rg3 treatment group (Table IV).
| Table IVKEGG enrichment analysis of
differential expressed genes. |
Table IV
KEGG enrichment analysis of
differential expressed genes.
| Group | ID | Pathway | P-value | Count | Genes |
|---|
| Normal control vs.
DN control group | rno03320 | PPAR signaling
pathway |
4.09253×10⁻⁵ | 7 | Acaa1a, Angptl4,
Apoc3, Cyp4a1, Cyp4a3, Hmgcs2, Pck1 |
| rno04978 | Mineral
absorption | 0.00179 | 5 | Fth1, Mt1a, Mt2A,
S100g, Tf |
| rno00071 | Fatty acid
degradation | 0.00199 | 5 | Acaa1a, Acaa2,
Cyp4a1, Cyp4a3, Eci1 |
| DN control vs.
ginsenoside-Rg3 treatment group | rno03320 | PPAR signaling
pathway |
5.51233×10⁻⁵ | 6 | Acaa1a, Acaa1b,
Apoc3, Cyp4a1, Hmgcs2, Pck1 |
| rno00071 | Fatty acid
degradation | 0.00908 | 4 | Acaa1a, Acaa1b,
Cyp4a1, Eci1 |
The pathways, including peroxisome PPAR signaling
pathway, mineral absorption and fatty acid degradation, may be
critical in ginsenoside-Rg3 treatment of DN, implicating certain
key genes enriched by these pathways (such as Acaala and Acaalb) as
potential therapeutic targets.
To gain a greater understanding of the biological
implications, GO enrichment analysis on differentially expressed
genes was performed. GO is a standardized gene functional
classification system, which provides a strictly defined concept
and controlled vocabulary to describe properties of genes and their
products. GO-annotated differentially expressed genes predominantly
belong to the three functional clusters (biological process,
cellular component and molecular function). Enrichment analysis
focused on the 28 differentially expressed genes (21 upregulated
genes and 7 downregulated genes) following administration of
ginsenoside-Rg3. It was demonstrated that the 28 differentially
expressed genes in the cluster of biological process was
predominantly associated with lipid metabolism process (Table V). In addition, KEGG enrichment
analysis was also performed on the 28 genes. Five pathways,
including the PPAR signaling pathway, fatty acid degradation,
nitrogen metabolism, proximal tubule bicarbonate reclamation and
valine, leucine and isoleucine degradation were shown to be
enriched (Table VI).
| Table VGO analysis on 28 differentially
expressed genes. |
Table V
GO analysis on 28 differentially
expressed genes.
| Ontology | GO ID | Term | P-value | Genes |
|---|
| GO_BP | GO:0006641 | Triglyceride
metabolic process | 0.00194 | GPX1, APOC3,
PCK1 |
| GO_BP | GO:0006639 | Acylglycerol
metabolic process | 0.00242 | GPX1, APOC3,
PCK1 |
| GO_BP | GO:0006638 | Neutral lipid
metabolic process | 0.00260 | GPX1, APOC3,
PCK1 |
| GO_BP | GO:0006720 | Isoprenoid
metabolic process | 0.00260 | RARRES2, HMGCS2,
RBP1 |
| GO_BP | GO:0006662 | Glycerol ether
metabolic process | 0.00269 | GPX1, APOC3,
PCK1 |
| GO_BP | GO:0018904 | Organic ether
metabolic process | 0.00287 | GPX1, APOC3,
PCK1 |
| GO_BP | GO:0009636 | Response to
toxin | 0.00335 | GPX1, MT1A,
EPHX1 |
| GO_BP | GO:0009725 | Response to hormone
stimulus | 0.00380 | GPX1, HMGCS2,
APOC3, CAR4, PCK1 |
| GO_BP | GO:0010033 | Response to organic
substance | 0.00563 | GPX1, HMGCS2,
APOC3, EPHX1, CAR4, PCK1 |
| GO_BP | GO:0009719 | Response to
endogenous stimulus | 0.00576 | GPX1, HMGCS2,
APOC3, CAR4, PCK1 |
| GO_BP | GO:0046486 | Glycerolipid
metabolic process | 0.01784 | GPX1, APOC3,
PCK1 |
| GO_MF | GO:0046914 | Transition metal
ion binding | 0.02858 | RIL, CYP4A1, MT1A,
BHMT, CYP2C24, CAR4, PCK1 |
| GO_BP | GO:0007584 | Response to
nutrient | 0.02963 | GPX1, HMGCS2,
APOC3 |
| GO_BP | GO:0043434 | Response to peptide
hormone stimulus | 0.03400 | HMGCS2, APOC3,
PCK1 |
| GO_MF | GO:0009055 | Electron carrier
activity | 0.03467 | ACADSB, CYP4A1,
CYP2C24 |
| GO_BP | GO:0009410 | Response to
xenobiotic stimulus | 0.03516 | GPX1, EPHX1 |
| GO_BP | GO:0016101 | Diterpenoid
metabolic process | 0.03899 | RARRES2, RBP1 |
| GO_BP | GO:0001523 | Retinoid metabolic
process | 0.03899 | RARRES2, RBP1 |
| GO_BP | GO:0006721 | Terpenoid metabolic
process | 0.04281 | RARRES2, RBP1 |
| GO_BP | GO:0055114 | Oxidation
reduction | 0.04416 | GPX1, ACADSB,
CYP4A1, CYP2C24 |
| Table VIKEGG enrichment analysis on 28
differentially expressed genes. |
Table VI
KEGG enrichment analysis on 28
differentially expressed genes.
| Pathway | Term | P-value | Count | Genes |
|---|
| rno03320 | PPAR signaling
pathway |
7.88382×10⁻⁸ | 5 | Acaa1a,Apoc3,
Cyp4a1, Hmgcs2, Pck1 |
| rno00071 | Fatty acid
degradation |
4.42130×10⁻⁵ | 3 | Acaa1a, Cyp4a1,
Eci1 |
| rno00910 | Nitrogen
metabolism | 0.00029 | 2 | Car15, Car4 |
| rno04964 | Proximal tubule
bicarbonate reclamation | 0.00049 | 2 | Car4, Pck1 |
| rno00280 | Valine, leucine and
isoleucine degradation | 0.00286 | 2 | Acaa1a, Hmgcs2 |
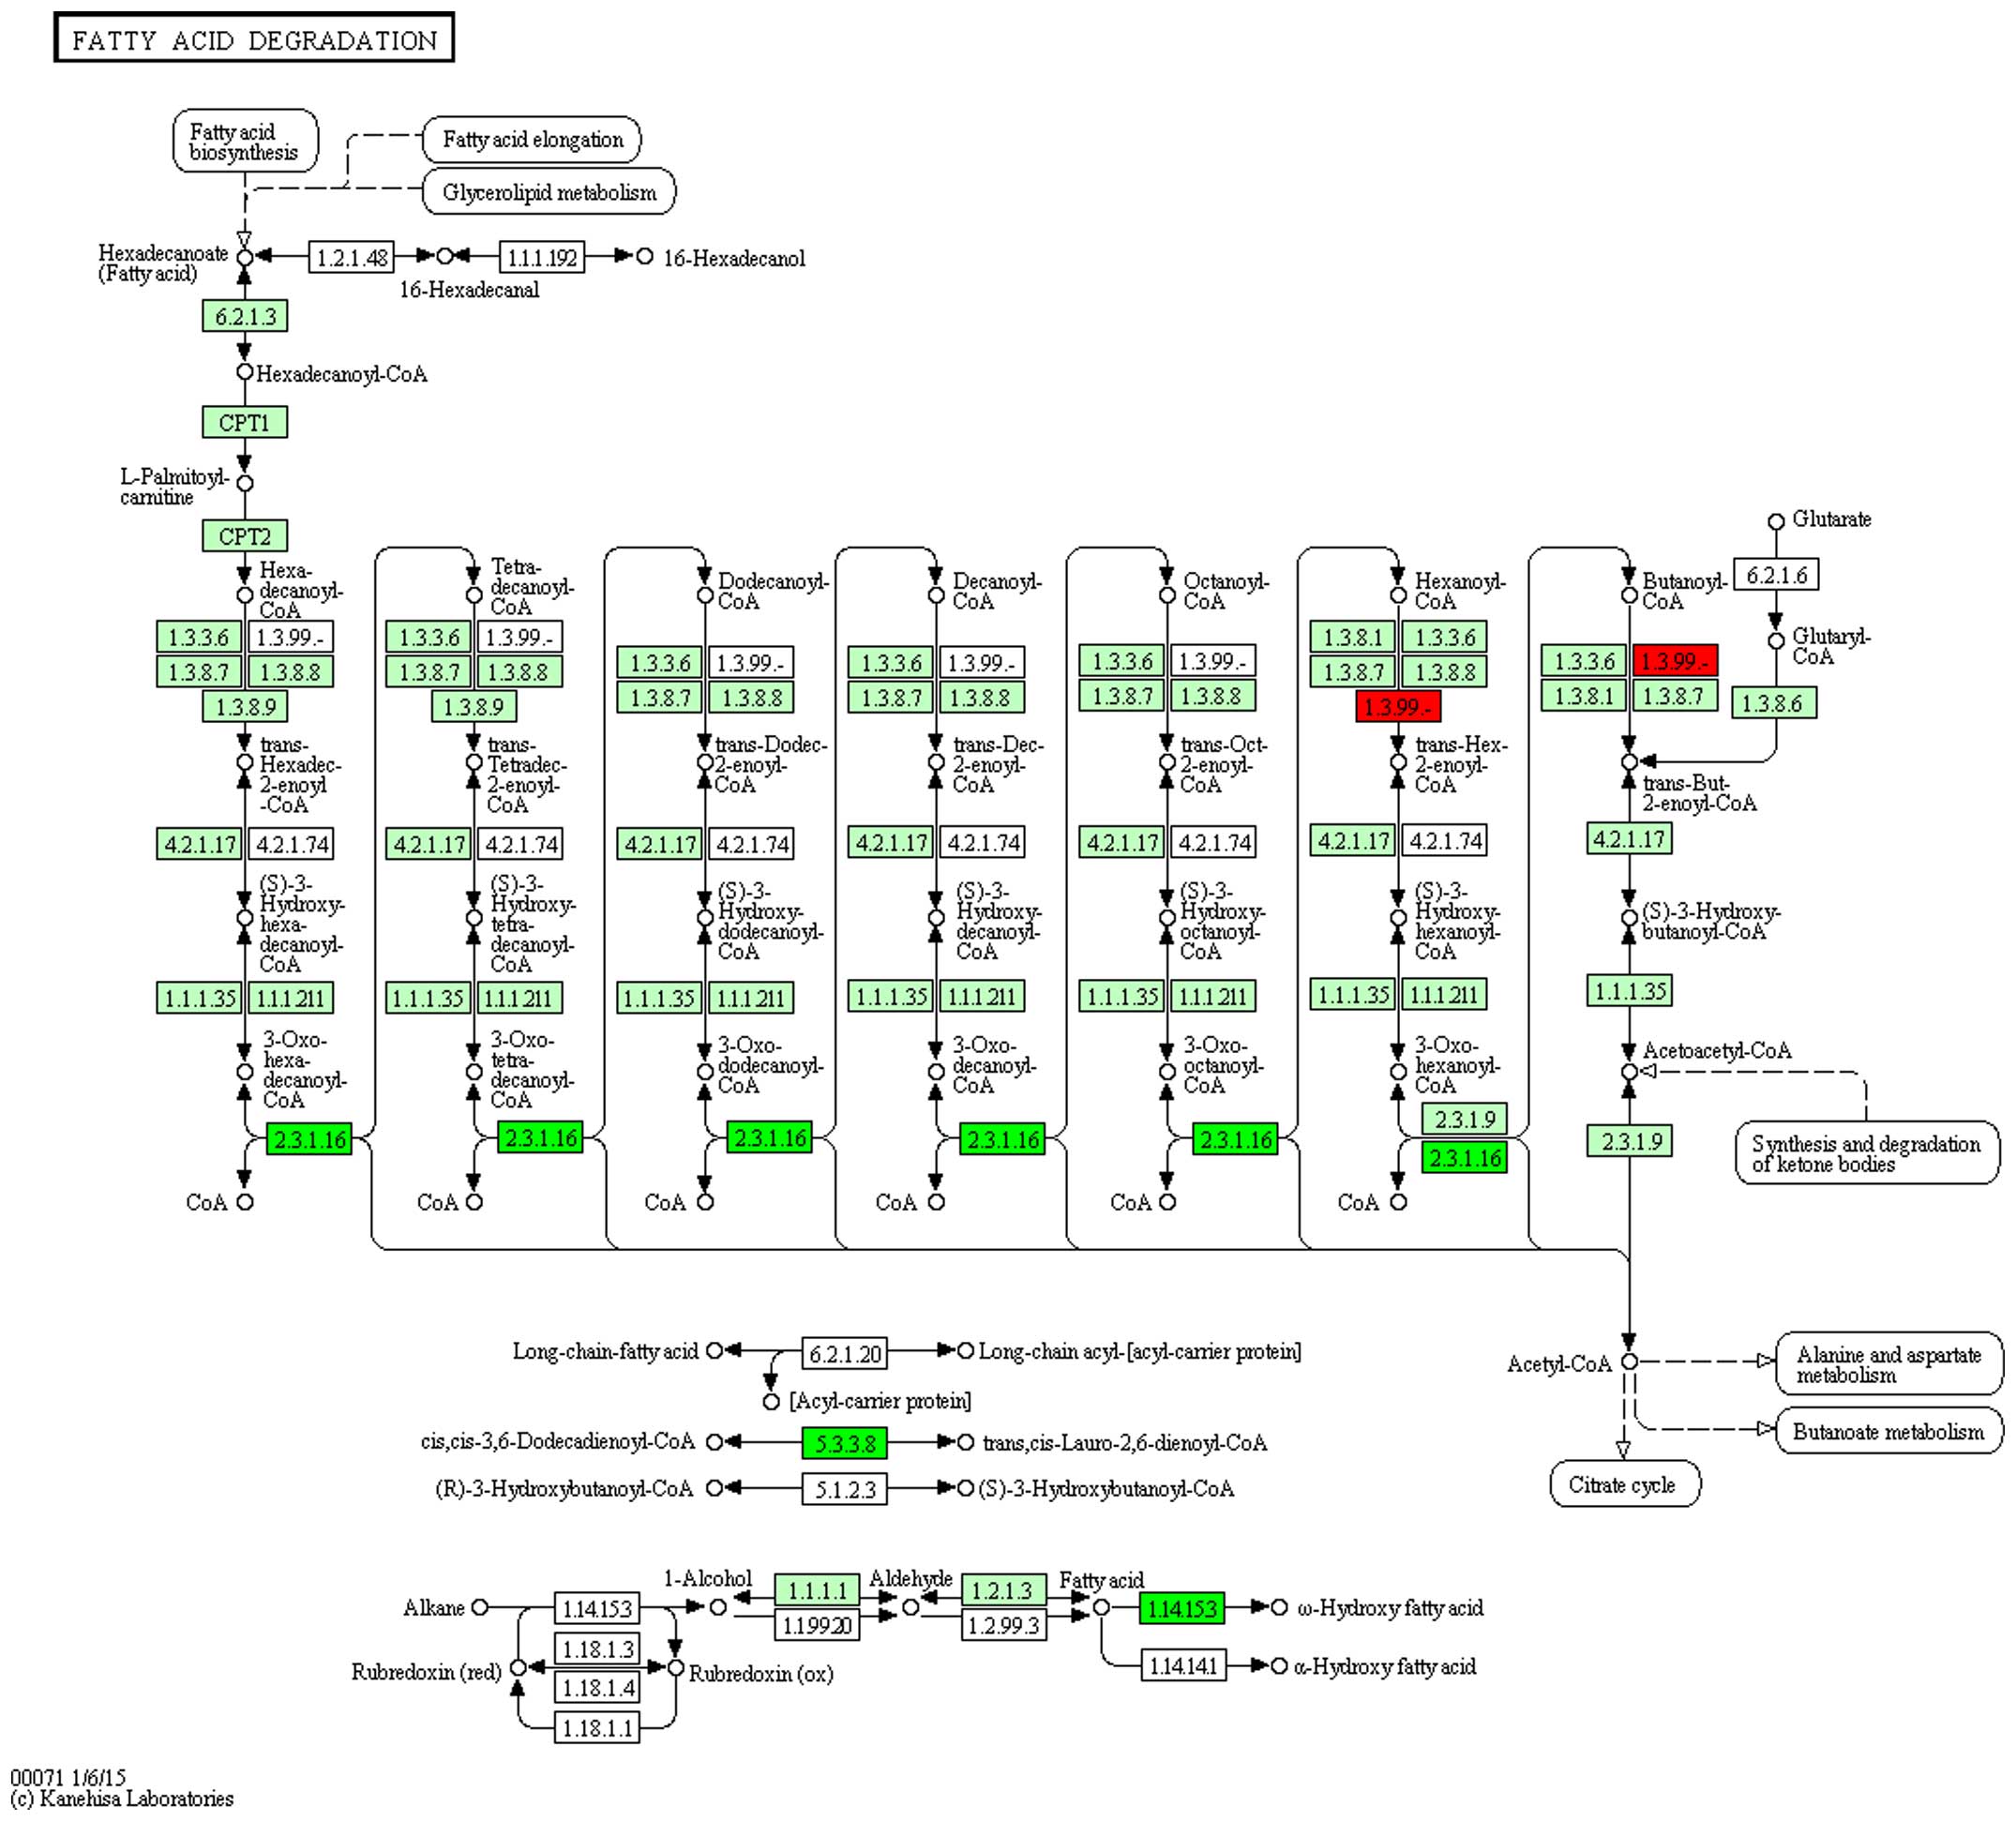
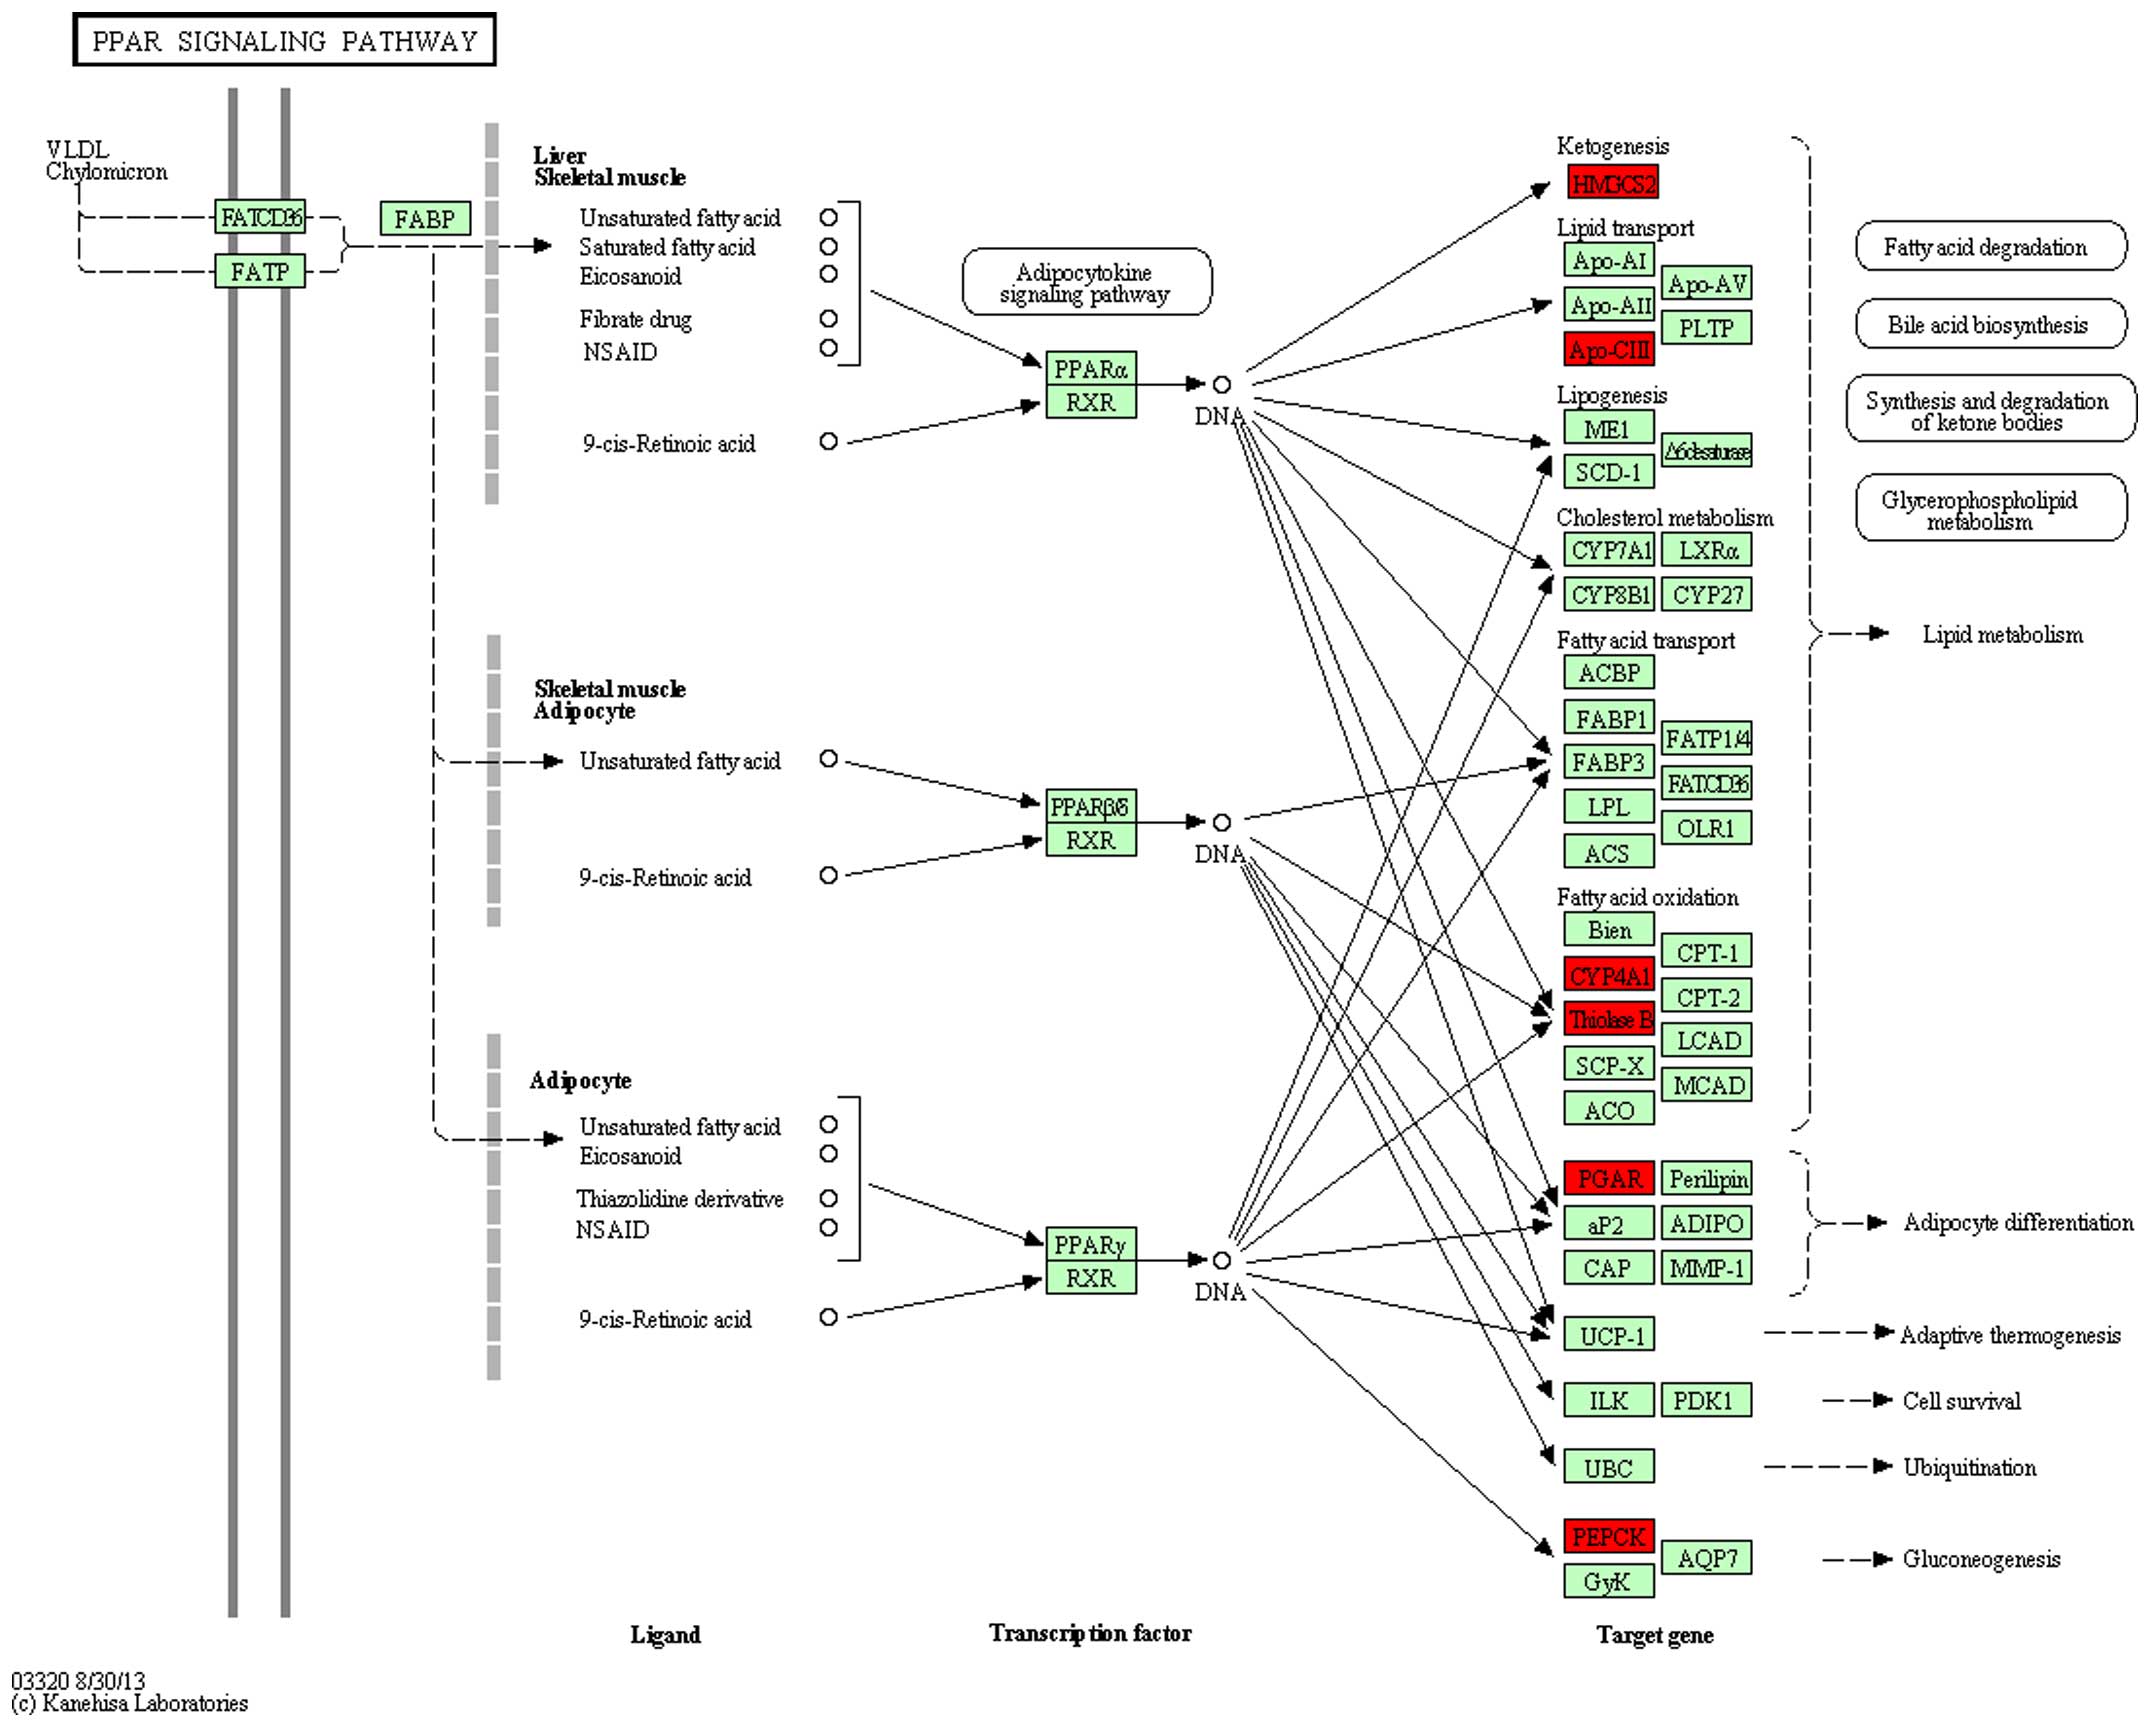
Pathway analysis
Differentially expressed genes were mapped to
rno00071 and rno03320 pathways of KEGG to observe the gene
distribution and effects. In the rno00071 pathway, it was
demonstrated that ginsenoside-Rg3 treatment reversed the expression
of the acyl-CoA dehydrogenase, short/branched chain gene,
acetyl-CoA acyltransferase, enoyl-CoA hydratase/3-hydroxyacyl CoA
dehydrogenase and cytochrome P450 family 4 subfamily a polypeptide
2, suggesting a critical role of fatty acid metabolism pathway
through affecting the four key genes in the process of DN with
ginsenoside-Rg3 treatment (Figs. 4
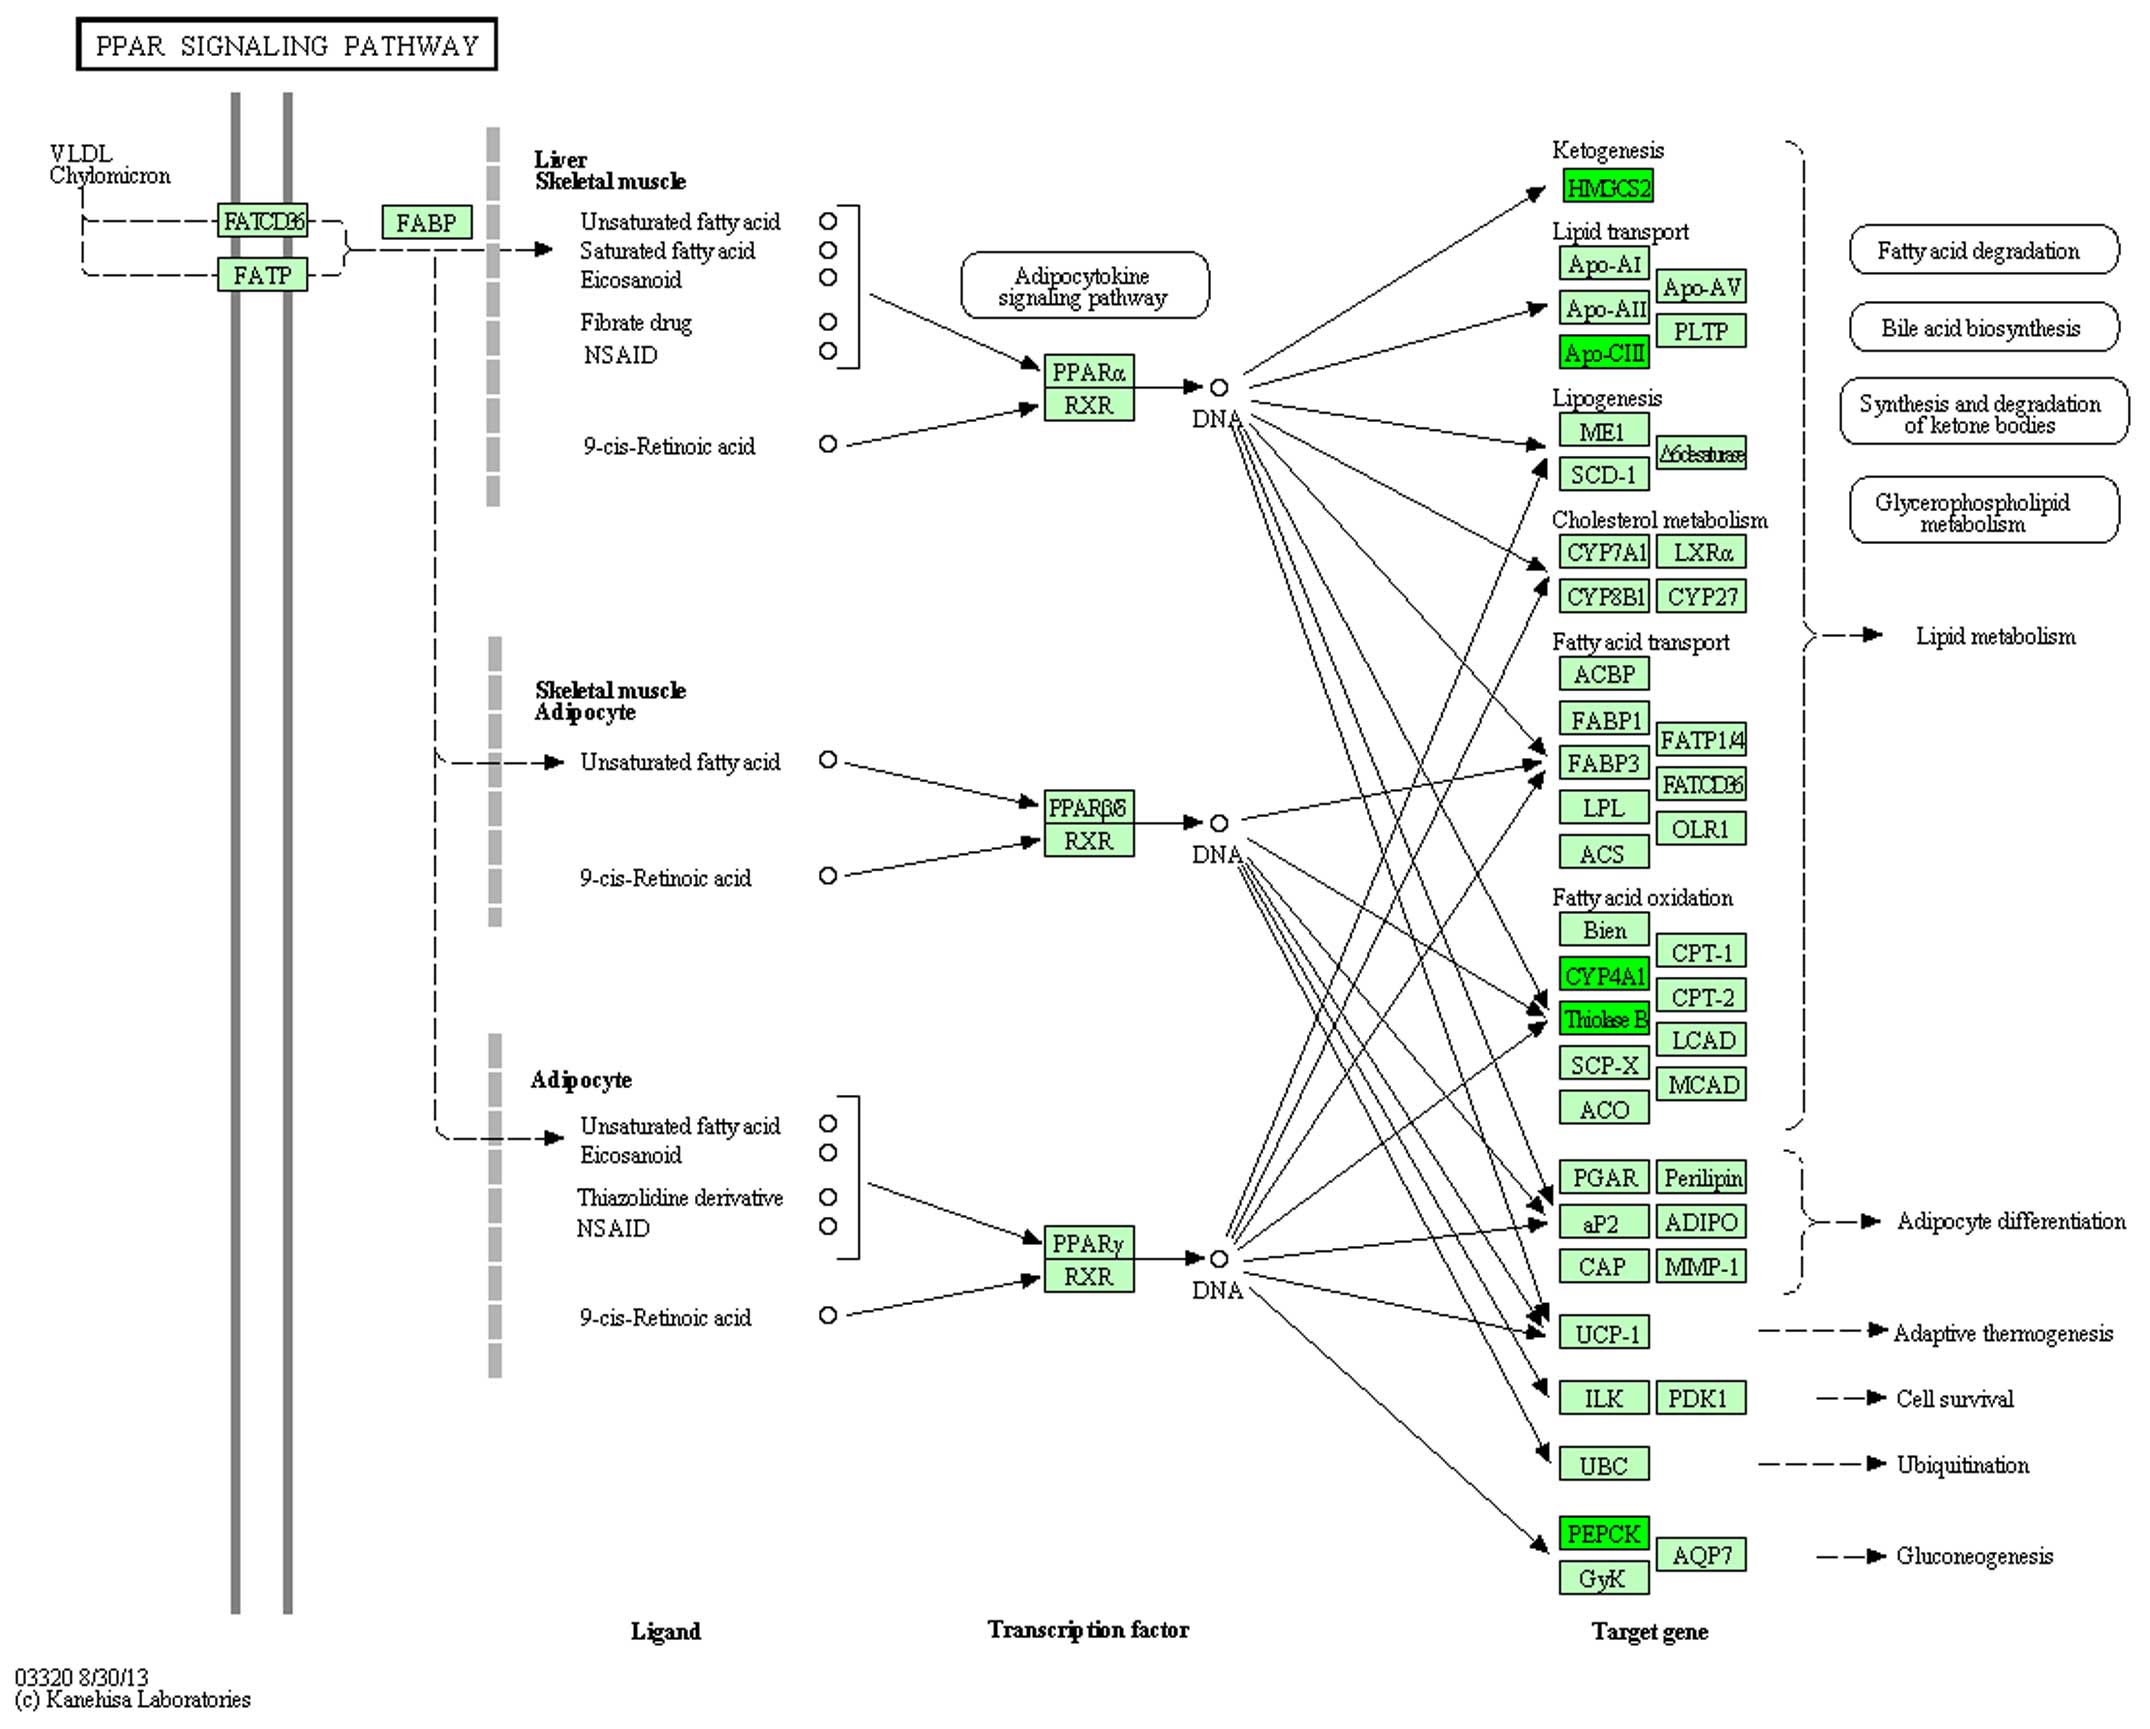
and 5). In the rno03320 pathway,
change in the expression of five genes: HMGCS2, APoCii, CYP4A1,
ThinoleseB, PEPCK in DN was reversed by treatment with
ginsenoside-Rg3 (Figs. 6 and
7).
Discussion
Recently, the revolution of next generation
sequencing (NGS) has had a great impact on genome research. RNA
sequencing (RNA-Seq) is an innovative NGS tool for the
comprehensive transcriptome profiling on a genome-wide scale using
deep-sequencing technologies (11,12).
Studies using this tool have already altered perception on the
extent and complexity of eukaryotic transcriptomes. RNA-Seq also
provides a far more precise measurement of levels of transcripts
and their isoforms (11). In
contrast to the technologies of microarray and qPCR analysis,
RNA-seq allows for the identification of novel transcripts,
examination of all RNA species, and identification of alternative
splicing and mutations (13).
The present study collected renal cortex samples of
six rats (n=2/group), which were classified into the normal control
group, DN control group and ginsenoside-Rg3 treatment group. Gene
expression profiling analysis was performed using an NGS strategy
with the aim of identifying biomarker genes relevant to the
molecular pathogenesis of DN. In total, there were 78
differentially expressed genes in the DN control group when
compared with the normal control group, of which 52 genes were
upregulated and 26 genes were downregulated. Expression of 43 genes
was differentially regulated in the ginsenoside-Rg3 treatment group
when compared with the DN control group, consisting of 10
upregulated and 33 genes downregulated. Notably, 21 downregulated
genes in the DN control group were upregulated in the
ginsenoside-Rg3 treatment group, and 7 upregulated genes in the DN
control group were downregulated in the ginsenoside-Rg3 treatment
group. GO annotation analysis showed that the differentially
expressed genes were predominantly associated with the lipid
metabolism process. KEGG pathway enrichment analysis showed that
fatty acid degradation and PPAR signaling pathways were associated
with the differentially expressed genes.
Recently, lipid metabolism disorder has become a
focus of research in the pathogenesis of DN. Disordered lipid
metabolism and renal lipid accumulation are not only associated
with obesity-related renal disease and DN, but they may also
contribute to the disease process (14). Sustained hyperglycemia in diabetes
promotes fatty acid (FA) synthesis and triacylglycerol (TG)
accumulation. Elevated serum TG, free FAs (FFAs), and modified
cholesterol cause ectopic lipid accumulation in nonadipose tissues,
leading to lipotoxicity (15),
which may be involved in the pathogenesis of DN (16). Herman-Edelstein et al
(17) investigated the association
of altered renal TG and cholesterol metabolism with lipid
accumulation in patients with DN. The results showed a highly
significant correlation between glomerular filtration rate,
inflammation and lipid metabolism associated genes, suggesting a
potential role of abnormal lipid metabolism in the pathogenesis of
DN (17).
PPAR is a member of the nuclear hormone receptor
superfamily and is critical in lipid metabolism (18). PPAR is highly expressed in various
organs, such as the liver, renal cortex and heart. Knocking out
PPARα appeared to aggravate the severity of DN through an increase
in extracellular matrix formation, inflammation, and circulating
FFA and TG concentrations (19).
PPAR-γ is the most extensively studied PPAR subtype and is involved
in adipocyte differentiation, and glucose and lipid metabolism. The
mechanisms of PPAR-γ in DN remain to be fully elucidated. A study
suggested PPAR-γ has an important role in regulating insulin
sensitivity (20). Gene
polymorphisms of PPAR-γ gene polymorphism Ala12 carriers exhibited
an improvement in insulin sensitivity (21), and may be responsible for the
development of DN.
Current therapeutic strategies for DN remain
suboptimal and are directed at delaying disease progression, for
example, intensive glucose and blood pressure control, dyslipidemia
and lipid-lowering drugs. Ginsenoside Rg3, an active component of
Panax ginseng, has been identified to have a protective
effect against hyperglycemia, obesity and diabetes in vivo
(22). Animal experiments
demonstrated the effect of ginsenoside Rg3 on diabetic renal damage
(23). However, the precise
mechanisms of these actions remain to be fully elucidated. Hwang
et al (24) investigated
the molecular basis of ginsenoside Rg3. Their results found that
the effect of ginsenoside Rg3 in inhibiting adipocyte
differentiation, and also PPAR-γ signaling was involved in the
inhibition of adipocyte differentiation by ginsenoside Rg3
(24). Ginsenoside has been shown
to exhibit anti-obesity and anti-hyperglycemia effects that involve
the PPAR mediated pathway (25).
Sun et al (26)
investigated the effect of ginsenoside Rg3 on the expression of
VEGF and TNF-α in the retina of diabetic rats, and demonstrated
that ginsenoside Rg3 could downregulate the expression of VEGF and
TNF-α, which may disrupt the development of diabetic retinopathy.
Kang et al (22) analyzed
the effect of ginsenoside Rg3 on the progression of renal disease
in type II diabetic rat models, and provided evidence that Rg3 can
prevent the progression of renal damage and dysfunction of diabetic
rats. Lee et al (27)
evaluated the effects of ginsenoside Rg3 on glucose uptake and the
glucose transport system in mature 3T3-L1 cells, and demonstrated
that ginsenoside Rg3 may stimulate the expression of insulin
receptor substrate expression and phosphatidylinositol
3-kinase-110a protein, which may therefore be a valuable
antidiabetic and antihyperglycemic agent. Bu et al (15) also demonstrated similar effects of
ginsenoside Rg3 in reducing the fasting blood glucose level,
reducing food and water intake, improving oral glucose tolerance,
and repairing injured pancreas tissues of alloxan-induced diabetic
mice. These studies suggest that ginsenoside Rg3 has potential for
clinical use in preventing and treating diabetes and its
complications. The present study also suggested that ginsenoside
Rg3 may be used as a novel and useful adjunctive drug for the
treatment of DN.
High throughput RNA-Seq technology allows
comprehensive transcriptome profiling. A set genes were identified
to be differentially expressed following ginsenoside Rg3 treatment.
Gene set enrichment analyses identified the specific biological
processes, predominantly lipid/fatty acid metabolism and the PPAR
signaling pathway, were associated with these genes. The
identification of these genes and pathway analyses have provided
novel insights into the molecular mechanisms underlying the effect
of ginsenoside-Rg3 on DN. As the sample sizes in the present study
are small, these findings require further validation.
Acknowledgments
This study was supported by the Enterprise
postdoctoral fund in Liaoning province (grant no. 106561).
References
|
1
|
Vinik AI, Nevoret ML, Casellini C and
Parson H: Diabetic neuropathy. Endocrinol Metab Clin North Am.
42:747–787. 2013. View Article : Google Scholar : PubMed/NCBI
|
|
2
|
Waanders F, Visser FW and Gans RO: Current
concepts in the management of diabetic nephropathy. Neth J Med.
71:448–458. 2013.PubMed/NCBI
|
|
3
|
Zeng CC, Liu X, Chen GR, Wu QJ, Liu WW,
Luo HY and Cheng JG: The molecular mechanism of rhein in diabetic
nephropathy. Evid Based Complement Alternat Med. 2014:4870972014.
View Article : Google Scholar : PubMed/NCBI
|
|
4
|
Yin J, Zhang H and Ye J: Traditional
chinese medicine in treatment of metabolic syndrome. Endocr Metab
Immune Disord Drug Targets. 8:99–111. 2008. View Article : Google Scholar : PubMed/NCBI
|
|
5
|
Lee JH, Choi SH, Kwon OS, Shin TJ, Lee JH,
Lee BH, Yoon IS, Pyo MK, Rhim H, Lim YH, et al: Effects of
ginsenosides, active ingredients of panax ginseng, on development,
growth and life span of caenorhabditis elegans. Biol Pharm Bull.
30:2126–2134. 2007. View Article : Google Scholar : PubMed/NCBI
|
|
6
|
Trapnell C, Pachter L and Salzberg SL:
TopHat: Discovering splice junctions with RNA-Seq. Bioinformatics.
25:1105–1111. 2009. View Article : Google Scholar : PubMed/NCBI
|
|
7
|
Trapnell C, Williams BA, Pertea G,
Mortazavi A, Kwan G, van Baren MJ, Salzberg SL, Wold BJ and Pachter
L: Transcript assembly and quantification by RNA-Seq reveals
unannotated transcripts and isoform switching during cell
differentiation. Nat Biotechnol. 28:511–515. 2010. View Article : Google Scholar : PubMed/NCBI
|
|
8
|
Kanehisa M, Araki M, Goto S, Hattori M,
Hirakawa M, Itoh M, Katayama T, Kawashima S, Okuda S, Tokimatsu T
and Yamanishi Y: KEGG for linking genomes to life and the
environment. Nucleic Acids Res. 36:D480–D484. 2008. View Article : Google Scholar :
|
|
9
|
Kanehisa M, Goto S, Sato Y, Furumichi M
and Tanabe M: KEGG for integration and interpretation of
large-scale molecular data sets. Nucleic Acids Res. 40:D109–D114.
2012. View Article : Google Scholar :
|
|
10
|
Chen YA, Tripathi LP and Mizuguchi K:
TargetMine, an integrated data warehouse for candidate gene
prioritisation and target discovery. PLoS One. 6:e178442011.
View Article : Google Scholar : PubMed/NCBI
|
|
11
|
Wang Z, Gerstein M and Snyder M: RNA-Seq:
A revolutionary tool for transcriptomics. Nat Rev Genet. 10:57–63.
2009. View
Article : Google Scholar
|
|
12
|
Sutherland GT, Janitz M and Kril JJ:
Understanding the pathogenesis of Alzheimer's disease: Will RNA-Seq
realize the promise of transcriptomics? J Neurochem. 116:937–946.
2011. View Article : Google Scholar
|
|
13
|
Satoh J, Yamamoto Y, Asahina N, Kitano S
and Kino Y: RNA-Seq data mining: Downregulation of NeuroD6 serves
as a possible biomarker for Alzheimer's disease brains. Dis
Markers. 2014:1231652014. View Article : Google Scholar : PubMed/NCBI
|
|
14
|
de Vries AP, Ruggenenti P, Ruan XZ, Praga
M, Cruzado JM, Bajema IM, D'Agati VD, Lamb HJ, Pongrac Barlovic D,
Hojs R, et al: Fatty kidney: Emerging role of ectopic lipid in
obesity-related renal disease. Lancet Diabetes Endocrinol.
2:417–426. 2014. View Article : Google Scholar : PubMed/NCBI
|
|
15
|
Bu QT, Zhang WY, Chen QC, Zhang CZ, Gong
XJ, Liu WC, Li W and Zheng YN: Anti-diabetic effect of ginsenoside
Rb(3) in alloxan-induced diabetic mice. Med Chem. 8:934–941. 2012.
View Article : Google Scholar : PubMed/NCBI
|
|
16
|
Jiang T, Wang XX, Scherzer P, Wilson P,
Tallman J, Takahashi H, Li J, Iwahashi M, Sutherland E, Arend L and
Levi M: Farnesoid X receptor modulates renal lipid metabolism,
fibrosis and diabetic nephropathy. Diabetes. 56:2485–2493. 2007.
View Article : Google Scholar : PubMed/NCBI
|
|
17
|
Herman-Edelstein M, Scherzer P, Tobar A,
Levi M and Gafter U: Altered renal lipid metabolism and renal lipid
accumulation in human diabetic nephropathy. J Lipid Res.
55:561–572. 2014. View Article : Google Scholar :
|
|
18
|
Isselmann I and Green S: Activation of a
member of the steroid hormone receptor superfamily by peroxisome
proliferators. Nature. 347:645–650. 1990. View Article : Google Scholar
|
|
19
|
Park CW, Kim HW, Ko SH, Chung HW, Lim SW,
Yang CW, Chang YS, Sugawara A, Guan Y and Breyer MD: Accelerated
diabetic nephropathy in mice lacking the peroxisome
prolif-erator-activated receptor alpha. Diabetes. 55:885–893. 2006.
View Article : Google Scholar : PubMed/NCBI
|
|
20
|
Duan SZ, Ivashchenko CY, Whitesall SE,
D'Alecy LG, Duquaine DC, Brosius FC III, Gonzalez FJ, Vinson C,
Pierre MA, Milstone DS and Mortensen RM: Hypotension, lipodystrophy
and insulin resistance in generalized PPARgamma-deficient mice
rescued from embryonic lethality. J Clin Invest. 117:812–822. 2007.
View Article : Google Scholar : PubMed/NCBI
|
|
21
|
Deeb SS, Fajas L, Nemoto M, Pihlajamäki J,
Mykkänen L, Kuusisto J, Laakso M, Fujimoto W and Auwerx J: A
Pro12Ala substitution in PPARgamma2 associated with decreased
receptor activity, lower body mass index and improved insulin
sensitivity. Nat Genet. 20:284–287. 1998. View Article : Google Scholar : PubMed/NCBI
|
|
22
|
Kang KS, Yamabe N, Kim HY, Park JH and
Yokozawa T: Therapeutic potential of 20(S)-ginsenoside Rg(3)
against streptozotocin-induced diabetic renal damage in rats. Eur J
Pharmacol. 591:266–272. 2008. View Article : Google Scholar : PubMed/NCBI
|
|
23
|
Kim M, Ahn BY, Lee JS, Chung SS, Lim S,
Park SG, Jung HS, Lee HK and Park KS: The ginsenoside Rg3 has a
stimulatory effect on insulin signaling in L6 myotubes. Biochem
Biophys Res Commun. 389:70–73. 2009. View Article : Google Scholar : PubMed/NCBI
|
|
24
|
Hwang JT, Lee MS, Kim HJ, Sung MJ, Kim HY,
Kim MS and Kwon DY: Antiobesity effect of ginsenoside Rg3 involves
the AMPK and PPAR-gamma signal pathways. Phytother Res. 23:262–266.
2009. View
Article : Google Scholar
|
|
25
|
Ni HX, Yu NJ and Yang XH: The study of
ginsenoside on PPARgamma expression of mononuclear macrophage in
type 2 diabetes. Mol Biol Rep. 37:2975–2979. 2010. View Article : Google Scholar
|
|
26
|
Sun HQ and Zhou ZY: Effect of
ginsenoside-Rg3 on the expression of VEGF and TNF-α in retina with
diabetic rats. Int J Ophthalmol. 3:220–223. 2010.
|
|
27
|
Lee OH, Lee HH, Kim JH and Lee BY: Effect
of ginsenosides Rg3 and Re on glucose transport in mature 3T3-L1
adipocytes. Phytother Res. 25:768–773. 2011. View Article : Google Scholar : PubMed/NCBI
|