Introduction
The Ras-related C3 botulinum toxin substrate 1
(Rac1) protein, encoded by the RAC1 gene, is a 21 kDa member
of the Rho family of small guanosine triphosphatases (GTPases), and
can cycle between an inactive guanosine diphosphate-bound state and
an active GTP-bound (Rac1-GTP) state under the regulation of
guanine nucleotide exchange factors (1). In its active GTP-bound state, Rac1
binds specifically to the p21-binding domain of p21-activated
protein kinase to control downstream signaling cascades (2,3).
Rac1, as with other small GTPases, depends on the active GTP-bound
state and is important in regulating several cellular processes,
including cell-cell adhesion and epithelial-mesenchymal transition
(4), meiosis and mitosis (5), cell Ras-mediated transformation
(6), spreading and membrane
ruffling (7), B-cell development
and signaling (8), cross-talk with
oncogenes (9) and reactive oxygen
species (ROS) production (10,11).
In addition, Rac1 is known as a key regulator of a broad spectrum
of transcription factors, including nuclear factor-κB, activating
transcription factor 2, c-Jun and small mothers against
decapentaplegic proteins (12–14).
The human RAC1 gene is located on chromosome
7p22 and its structure has been described in full by Matos et
al (15). Single nucleotide
polymorphisms (SNPs) are the most common form of genetic
polymorphism and account for >90% of genetic variations
(16). It is known that certain
genetic variations can alter gene transcription and mRNA
expression, which may transform the activity of proteins. The
majority of these proteins are enzymes involved in several pathways
and can alter susceptibility to diseases and drugs (6,17–19).
There are 2,061 SNPs in the human RAC1 gene, which have been
found and named in the National Center for Biotechnology
Information database (http://www.ncbi.nlm.nih.gov/snp). It has been reported
that the RAC1 gene SNP, rs10951982 (G/A), is significantly
associated with ulcerative colitis (17), and a previous study revealed that
rs836478 (C/T) and rs10951982 (G/A) SNPs in the RAC1 gene
are associated with higher levels of biomarkers, including
interleukin 6, metalloproteinase-9 and plasminogen activator
inhibitor-1, which may be connected with the development and
progression of hypertension (18).
It has also been suggested that polymorphisms of the RAC1
gene represent a possible additional mechanism contributing to
inter-individual differences in the therapeutic effect of
thiopurine drugs (19), which are
widely used in the treatment of inflammatory bowel diseases (IBDs)
(20), or as immunosuppressive
agents in organ transplantation (21). RAC1 genetic polymorphisms
have been reported to be involved in the development of IBDs,
including ulcerative colitis and Crohn's disease (17,22).
Epidemiological studies have consistently shown that
several diseases in the kidney, liver and heart are associated with
levels of Rac1 (23–27). In the kidney, it has been reported
that Rac1 activation is associated with podocyte foot process
effacement, leading to an increase in glomerular permeability and
proteinuria (23,24). The increased expression of Rac1-GTP
has been shown in the glomeruli of rats with podocyte-specific
overexpression of angiotensin II type I receptor, a model of
effaced foot processes, podocyte depletion and focal segmental
glomerular sclerosis (FSGS) (28,29).
In the liver, it has been found that a reduction in Rac1 activation
reduced diethylnitrosamine (DEN)-induced formation of liver tumors,
and that Rac1 can affect the basal and DEN-induced expression of
metabolic liver enzymes (27). In
the heart, it has been reported that Rac1 may be associated with
the development of cardiovascular damage and salt-sensitive
hypertension, which may be due to a crosstalk effect between Rac1
and mineralocorticoid receptor activation independent of
aldosterone (18–31). Therefore, patients with kidney,
liver or heart transplantats were included in the present study as
case groups. It is reasonable to suggest that polymorphisms of the
RAC1 gene may be implicated in organ transplantation treated
with thiopurine drugs, including azathioprine, 6-thioguanine and
6-mercaptopurine. However, the associations of RAC1 gene
polymorphisms with the mRNA expression of RAC1, and the
protein expression levels of total Rac1 and Rac1-GTP have not been
investigated. In addition, no investigations have been performed to
compare patients treated with kidney, liver or heart
transplantation and healthy populations to examine differences in
RAC1 genotyping and the expression levels of RAC1
mRNA and the Rac1 protein it encodese in the population groups.
In our previously reported studies (32,33),
eight SNPs in the human RAC1 gene were examined, and no
significant differences in genotype or allele frequencies were
found between healthy controls and renal transplant patients.
Furthermore, four tag-SNPs (rs702482, rs10951982, rs702483, and
rs6954996) were identified in the previous studies. In the present
study, healthy control subjects and patients with kidney, liver or
heart transplantation were recruited, and the genotyping and
identification of four tag-SNPs (rs702482, rs10951982, rs702483,
and rs6954996) in the RAC1 gene were performed. In addition,
the expression levels of mRNA, and the protein levels of the total
Rac1 and Rac1-GTP encoded by the RAC1 gene, were
investigated in all the recruited subjects.
The aim of the present study was to investigate
whether differences exist in the mRNA expression levels of
RAC1, and in the expression of proteins encoded by the
RAC1 gene in the different population subgroups. Particular
emphasis was focussed on the associations between the RAC1
genotypes and the expression levels of the mRNA and proteins of
Rac1.
Materials and methods
Subjects
A total of 304 solid organ transplant recipients
(SOTRs), consisting of 164 kidney transplantations, 85 liver
transplantations and 55 heart transplantations, who were receiving
azathioprine and cyclosporine immunosuppressant treatment, were
recruited between March and May 2014 from the Department of Organ
Transplantation Center of Union Hospital and Tongji Hospital,
Tongji Medical College, Huazhong University of Science and
Technology (Wuhan, China). All donor organs (kidney, liver and
heart) were retrieved from the Accident and Emergency Department
and intensive care units of the Union Hospital (Wuhan, China) and
Tongji Hospital (Wuhan, China). Donor eligibility screening and
assessment did not reveal any contraindications to transplantation,
and the patient's family agreed to organ donation. In addition, a
total of 332 ethnically and geographically matched healthy Chinese
Han subjects were enrolled at Union Hospital (Wuhan, China) during
the same period of time. All subjects enrolled in the present study
met the following criteria: i) Body mass index between 18.5 and
24.9 kg/m2; ii) age range between 20 and 60 years; iii)
subjects in good health, as determined by complete physical
examination, 12-lead electrocardiograms, chest X-ray, routine
laboratory assessments, including routine hematology, blood
chemistry and urine analyses, and negative pregnancy test results.
In the SOTRs, the clinical data regarding the dose and duration of
immunosuppressant administration, adverse drug reactions and
laboratory data were assessed by screening of the patients' medical
records. The study protocol was approved by the independent ethics
committee of Tongji Medical College, Huazhong University of Science
and Technology [Wuhan, China; approval no. (2012)S019]. All
associated procedures were performed in accordance with the
principles of the Declaration of Helsinki. All subjects were
informed of the investigational nature of the study and signed
informed consent prior to any screening procedure.
RNA and DNA extraction
Blood samples (~2 ml) were collected from the
forearm vein into EDTA-treated Vacutainer tubes. Then 250 µl
EDTA-treated blood was transferred into a clean tube and mixed with
750 µl TRIzol for the RNA extraction. The remaining blood
sample was centrifuged at 1,000 × g for 10 min at 4°C to separate
plasma and white blood cells for the measurement of Rac1 and
Rac1-GTP levels and DNA extraction, respectively. Total RNA
extraction and isolation from the TRIzol-treated whole blood
samples were performed, according to standard procedures. The
genomic DNA was extracted according to the manufacturer's protocol.
Total RNA and DNA were quantified using a Nanodrop 1000
spectrophotometer (Thermo Fisher Scientific, Inc., Wilmington, DE,
USA). The extracted total RNA and genomic DNA samples were stored
at −80°C until processing for further analysis.
Genotyping and sequencing
Genotyping was performed using a total volume of 10
µl, containing 5 µl TaqMan® Genotyping
Master Mix (Life Technologies Grand Island, NY, USA), 1 µl
TaqMan® SNP Genotyping Assay (Life Technologies), 2
µl extracted genomic DNA and 2 µl deionized water.
The sequences of the primers for the four tag-SNPs are presented in
Table I.
 | Table IPrimer sequences for genotyping
Ras-related C3 botulinum toxin substrate 1 SNPs. |
Table I
Primer sequences for genotyping
Ras-related C3 botulinum toxin substrate 1 SNPs.
| dbSNP ID | Mutation | Area | Location | Primer |
|---|
| rs702482 | T>A | Intron 1 | Chr7.6420199 | F:
5′-AAAAGTTTGGAGTTGGGCTAAGT-3′ |
| | | | R:
5′-AGACATGATAAAGCAAATACAGCAA-3′ |
| rs10951982 | G>A | Intron 1 | Chr7.6422556 | F:
5′-ATGGCAAAACCCTGTCTCTACTG-3′ |
| | | | R:
5-GAAACGAACATGAGTCGGCTG-3′ |
| rs702483 | G>A | Intron 2 | Chr7.6426941 | F:
5′-TCCTGGAGAATATATCCCTACTGTG-3′ |
| | | |
R:5′-GCCTCAGTCTCCCAAAGTGC-3′ |
| rs6954996 | G>A | Intron 4 | Chr7.6441258 | F:
5′-CAGTGGAGATAATAGCGGCAGAC-3′ |
| | | |
R:5′-TCCTTCACCTAAATCACACCCAG-3′ |
The polymerase chain reaction (PCR) cycling
conditions were as follows: Initial denaturation at 95°C for 4 min,
followed by 40 cycles of denaturation at 94°C for 30 sec, annealing
at 60°C for 1 min, extension at 72°C for 30 sec and a final
extension step at 72°C for 10 min. The amplifications were
performed using a 7900HT Fast Real-Time PCR system (Applied
Biosystems; Thermo Fisher Scientific, Inc.). Data acquisition and
analyses were performed using SDS v2.3 Allelic Discrimination
software (Applied Biosystems; Thermo Fisher Scientific, Inc.).
Direct sequencing was performed to confirm the genotyping accuracy.
In total, five cases of each genotype were detected using a BigDye
Terminator v3.1 cycle sequencing kit and an ABI 3130 genetic
analyzer (Applied Biosystems; Thermo Fisher Scientific, Inc.).
Reverse transcription-quantitative PCR
(RT-qPCR) and cDNA sequencing
Total RNA was transcribed into cDNA using a
PrimeScript™ RT reagent kit with gDNA Eraser (Takara Bio, Inc.,
Tokyo, Japan), according to the manufacturer's protocol. RT-qPCR
analyses were performed in triplicate, using β-actin for
normalization. SYBR® Premix Ex Taq™ II (Tli RNaseH Plus;
Takara Bio, Inc.) was for the amplification of cDNA. The sequences
of the primers used for RT-qPCR were designed and synthesized by
Takara Bio., Inc., as follows: β-actin, forward
5′-TGGCACCCAGCACAATGAA-3′ and reverse
5′-CTAAGTCATAGTCCGCCTAGAAGCA-3′; RAC1, forward
5′-GCGTTGCCATTGAACTCACC-3′ and reverse
5′-GAGCTGCTACGCTCACTCCATTAC-3′. qPCR for RNA expression was
performed on a 7900HT Fast Real-Time PCR system (Applied
Biosystems; Thermo Fisher Scientific, Inc.) using a total volume of
10 µl, containing 5 µl SYBRR Premix Ex
Taq™ (2X; Takara Bio, Inc.), 0.2 µl ROX reference dye (50X;
Takara Bio., Inc.), 3.4 µl sterile water (Takara Bio.,
Inc.), 0.2 µl forward primer, 0.2 µl reverse primer
and 1 µl cDNA. The RT-qPCR conditions comprised a holding
stage (95°C for 30 sec), cycling stage (95°C for 5 sec and 40
cycles at 60°C for 30 sec) and melt curve stage (95°C for 15 sec,
60°C for 1 min and 95°C for 15 sec). The amplifications were
performed using the 7900HT Fast Real-Time PCR system (Applied
Biosystems; Thermo Fisher Scientific, Inc.).
Enzyme-linked immunosorbent assay
(ELISA)
The protein levels of total Rac1 and Rac1-GTP were
evaluated in the serum samples from all participants using the
Rac1/Rac1-GTP ELISA kit (Elabscience Biotechnology Co., Ltd.,
Wuhan, China), according to the manufacturer's protocol. According
to the results of the preliminary experiment, 10X dilutions of the
serum samples were used for the assaying of Rac1, and 5X dilutions
of the serum samples were used for the assaying of Rac1-GTP. The
assays of the protein levels of Rac1 and Rac1-GTP were performed in
triplicate, and a separate standard curve was established for each
assessment on different days or using ELISA kits with different
batch numbers.
Statistical analysis
Statistical analyses were performed using SPSS 17.0
software (SPSS, Inc., Chicago, IL, USA), and P<0.05 was
considered to indicate a statistically significant difference for
all analyses. The allele and genotype frequencies were calculated
by direct counting and were assessed tested for significant
deviation from Hardy-Weinberg equilibrium using a goodness-of-fit
χ2 test. Linkage disequilibrium analysis between the
different pairs of SNPs was performed using the Haploview version
4.2 software package (Broad Institute of Massachusetts Institute of
Technology and Harvard University, Cambridge, MA, USA). Skewed data
are presented as the mean ± standard deviation of log-transformed
values in text and box-and-whisker plots in figures. The
distributions of characteristics between cases and controls were
evaluated using a χ2 test for categorical variables or
using one-way analysis of variance (ANOVA) followed by Tukey's
post-hoc test for continuous variables. To analyze the effects of
the four specific tag-SNPs on the formation and development of
kidney, liver or heart failure, risk analysis modelling was used to
calculate the odds ratios (ORs) and 95% confidence intervals
(CIs).
Results
Demographic characteristics and
laboratory results
The demographic characteristics of the subjects
involved in the present study are summarized in Table II. The characteristics of the
patients were based on data collected retrospectively from medical
records. No significant differences in age stratification or gender
ratio were found in either group (P>0.05).
| Table IIDemographic characteristics and
laboratory findings. |
Table II
Demographic characteristics and
laboratory findings.
| Characteristic | Cases
| Healthy
control
(n=332) | P-value |
|---|
Renal
transplantation
(n=164) | Liver
transplantation
(n=85) | Heart
transplantation
(n=55) |
|---|
| Age (years, mean ±
SD) | 43.1±11.2 | 45.0±12.0 | 43.0±12.0 | 45.0±12.3 | 0.782a |
| Gender | | | | | 0.898b |
| Male; n (%) | 104 (63.41) | 55 (64.71) | 34 (61.82) | 211 (63.55) | |
| Female; n (%) | 60 (36.59) | 30 (35.29) | 21 (38.18) | 121 (36.45) | |
| rs702482; n
(%) | | | | | 0.181c |
| A | 143 (43.60) | 71 (41.76) | 36 (32.73) | 290 (43.67) | |
| T | 185 (56.40) | 99 (58.24) | 74 (67.27) | 374 (56.33) | |
| AA | 40 (24.39) | 16 (18.82) | 3 (5.45) | 77 (23.19) | 0.082d |
| AT | 63 (38.41) | 39 (45.88) | 30 (54.55) | 136 (40.96) | |
| TT | 61 (37.20) | 30 (35.29) | 22 (40.00) | 119 (35.84) | |
| rs10951982; n
(%) | | | | | 0.079c |
| A | 80 (24.39) | 54 (31.76) | 20 (18.18) | 168 (25.30) | |
| G | 248 (75.61) | 116 (68.24) | 90 (81.82) | 496 (74.70) | |
| AA | 17 (10.37) | 17 (20.00) | 3 (5.45) | 44 (13.25) | 0.218d |
| AG | 46 (28.05) | 20 (23.53) | 14 (25.45) | 80 (24.10) | |
| GG | 101 (61.58) | 48 (56.47) | 38 (69.09) | 208 (62.65) | |
| rs702483; n
(%) | | | | | 0.250c |
| A | 279 (85.06) | 151 (88.82) | 89 (80.91) | 554 (83.43) | |
| G | 49 (14.94) | 19 (11.18) | 21 (19.09) | 110 (16.57) | |
| GG | 4 (2.44) | 2 (2.35) | 2 (3.64) | 17 (5.12) | 0.374d |
| AG | 41 (25.00) | 15 (17.65) | 17 (30.91) | 76 (22.89) | |
| AA | 119 (72.56) | 68 (80.00) | 36 (65.45) | 239 (71.99) | |
| rs6954996; n
(%) | | | | | 0.772c |
| A | 49 (14.94) | 24 (14.12) | 20 (18.18) | 108 (16.27) | |
| G | 279 (85.06) | 146 (85.88) | 90 (81.82) | 556 (83.73) | |
| AA | 5 (3.05) | 4 (4.71) | 3 (5.45) | 17 (5.12) | 0.894d |
| AG | 39 (23.78) | 16 (18.82) | 14 (25.45) | 74 (22.29) | |
| GG | 120 (73.17) | 65 (76.47) | 38 (69.09) | 241 (72.59) | |
Genotyping and identification of RAC1
gene polymorphisms
The four tag-SNPs in RAC1 gene were
successfully genotyped using TaqMan technology. No pairwise linkage
disequilibrium was found in the four tag-SNPs
(r2<0.3). The allele and genotype frequencies
were calculated by direct counting and goodness-of-fit
χ2 tests, the results of which showed that there were no
significant differences in any of the SNPs among the transplant and
control groups (P>0.05; Table
II).
For the analysis of individual SNPs, dominant model
(heterozygotes plus minor allele homozygotes vs. major allele
homozygotes), recessive model (minor allele homo-zygotes vs. major
allele homozygotes plus heterozygotes) and over-dominant model
(minor allele homozygotes plus major allele homozygotes vs.
heterozygotes) were used in the present study (Table III). No significant differences
in the genotype or allele frequencies of rs10951982, rs702483 and
rs6954996 were observed between the transplant cases and healthy
control (P>0.05). However, TT+AT in rs702482 was distributed
differentially (OR=5.234; 95%CI=1.590–17.228; P=0.003), compared
with AA in rs702482 between the heart transplantation cases and the
healthy control.
| Table IIIGenotype distribution of the
Ras-related C3 botulinum toxin substrate 1 gene in transplantation
cases and healthy controls. |
Table III
Genotype distribution of the
Ras-related C3 botulinum toxin substrate 1 gene in transplantation
cases and healthy controls.
| SNP | Renal
transplantation, vs. healthy control
| Liver
transplantation, vs. healthy control
| Heart
transplantation, vs. healthy control
|
|---|
| P-value | OR (95% CI) | P-value | OR (95% CI) | P-value | OR (95% CI) |
|---|
| rs702482 |
| TT+AT, vs. AA | 0.768 | 0.936 (0.604,
1.451) | 0.388 | 1.302 (0.714,
2.374) | 0.003 | 5.234 (1.590,
17.228) |
| TT, vs. AA+AT | 0.768 | 1.060 (0.719,
1.563) | 0.925 | 0.976 (0.593,
1.607) | 0.553 | 1.193 (0.665,
2.140) |
| AA+TT, vs. AT | 0.586 | 1.112 (0.758,
1.632) | 0.412 | 0.818 (0.507,
1.322) | 0.059 | 0.578 (0.326,
1.027) |
| rs10951982 |
| AA+AG, vs. GG | 0.818 | 1.046 (0.712,
1.538) | 0.296 | 1.293 (0.798,
2.096) | 0.358 | 0.750 (0.406,
1.386) |
| AA, vs. GG+AG | 0.357 | 0.757 (0.418,
1.371) | 0.116 | 1.636 (0.881,
3.039) | 0.101 | 0.378 (0.113,
1.262) |
| AA+GG, vs. AG | 0.341 | 0.814 (0.533,
1.244) | 0.913 | 1.032 (0.589,
1.808) | 0.828 | 0.930 (0.482,
1.793) |
| rs702483 |
| GG+AG, vs. AA | 0.893 | 0.972 (0.640,
1.477) | 0.135 | 0.642 (0.359,
1.151) | 0.322 | 1.356 (0.741,
2.484) |
| GG, vs. AA+AG | 0.163 | 0.463 (0.153,
1.400) | 0.275 | 0.446 (0.101,
1.971) | 0.637 | 0.699 (0.157,
3.114) |
| GG+AA, vs. AG | 0.603 | 0.891 (0.576,
1.378) | 0.296 | 1.385 (0.750,
2.559) | 0.197 | 0.664 (0.355,
1.242) |
| rs6954996 |
| AA+AG, vs. GG | 0.891 | 0.971 (0.637,
1.480) | 0.470 | 0.815 (0.467,
1.421) | 0.592 | 1.185 (0.637,
2.204) |
| AA, vs. GG+AG | 0.292 | 0.583 (0.211,
1.608) | 0.876 | 0.915 (0.300,
2.794) | 0.914 | 1.072 (0.304,
3.788) |
| AA+GG, vs. AG | 0.709 | 0.919 (0.590,
1.431) | 0.488 | 1.237 (0.677,
2.259) | 0.604 | 0.840 (0.434,
1.624) |
Relative quantification of mRNA
levels
In order to investigate differences in the mRNA
expression levels of RAC1 between the transplantation cases
and healthy controls, the present study performed RT-qPCR analyses
to measure the mRNA expression levels in all the recruited
subjects. The RAC1 gene and the reference gene, β-actin,
were all amplified fully and successfully under the final RT-qPCR
reaction systems and conditions. The relative mRNA levels of
RAC1 among groups were compared by one-way ANOVA following
log-transformation, followed by Tukey's post-hoc test, however, no
significant differences were found (P>0.05; Fig. 1A).
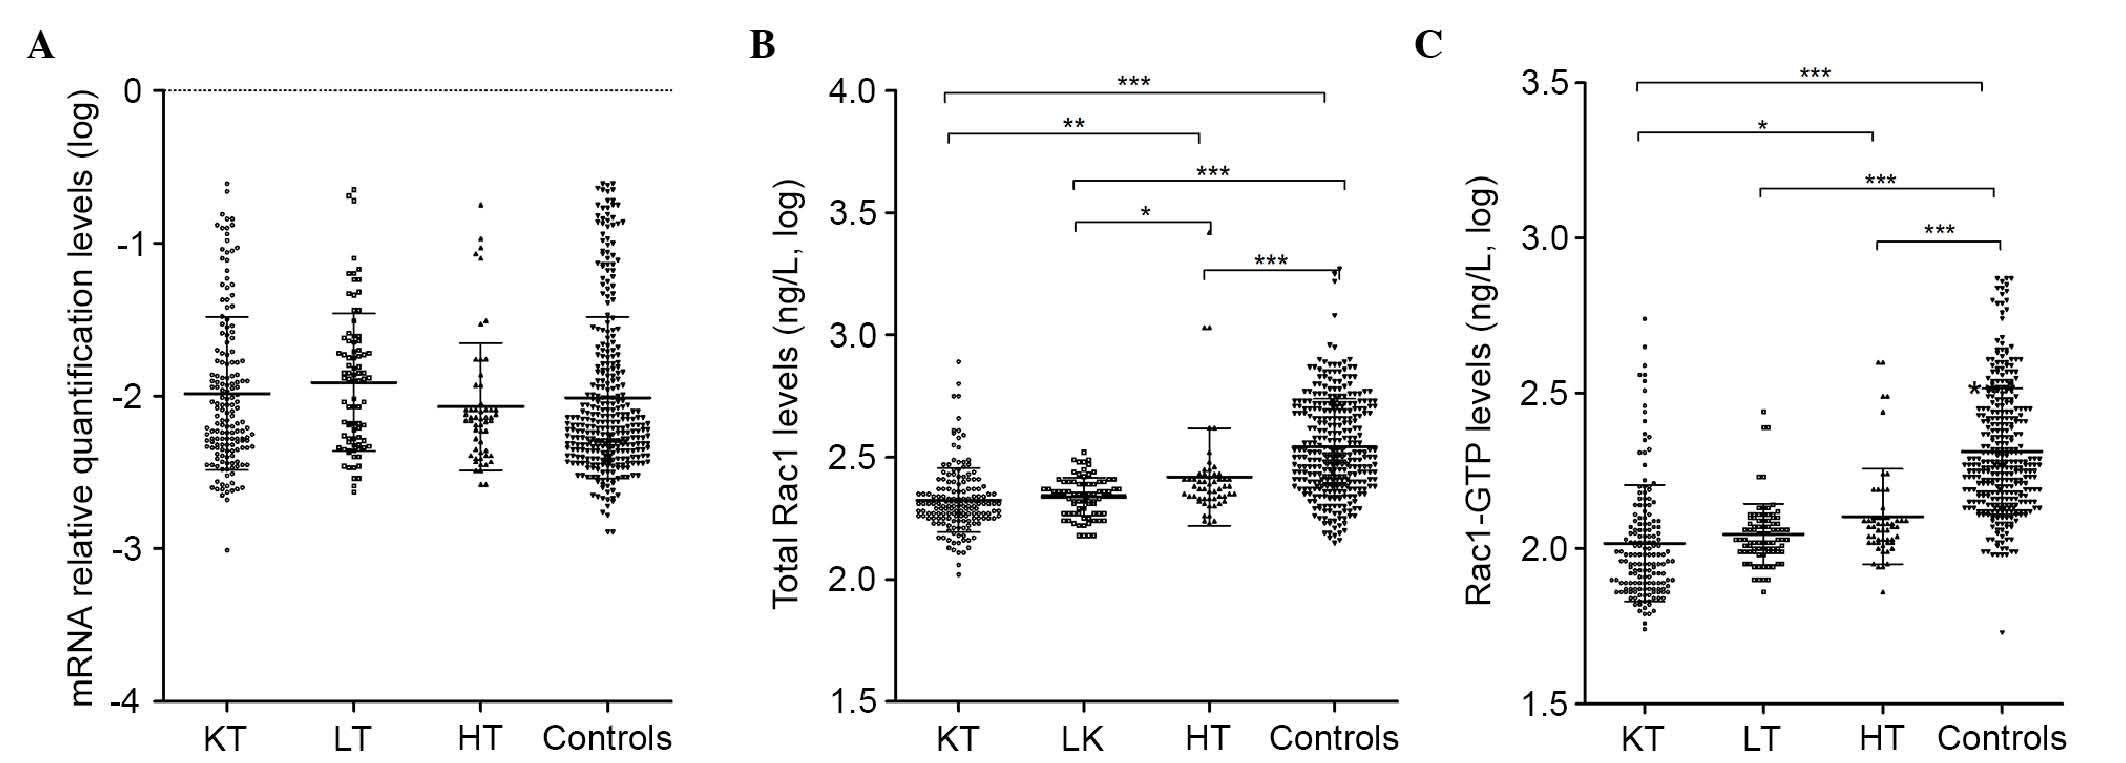 | Figure 1Expression levels of RAC1
mRNA, total Rac1 and Rac1-GTP in transplant cases and healthy
controls. (A) Relative mRNA levels of RAC1. (B) Levels of
total Rac1. (C) Levels of Rac1-GTP. For multiple comparisons,
one-way analysis of variance following log-transformation, followed
by Tukey's post-hoc test, was performed for each group.
*P<0.05, **P<0.01 and
***P<0.001. Rac1, Ras-related C3 botulinum toxin
substrate 1; Rac1-GTP, Rac1-guanosine triphosphatase; KT, kidney
transplantation; LT, liver transplantation; HT, heart
transplantation. |
Expression levels of total Rac1 and
Rac1-GTP
The protein levels of total Rac1 and Rac1-GTP among
the groups were compared using one-way ANOVA following
log-transformation, followed by Tukey's post-hoc test. As shown in
Fig. 1B and C, the highest levels
of total Rac1 and Rac1-GTP were found in the healthy control group
(2.54±0.20 and 2.31±0.20 ng/l, respectively), compared with those
in the kidney transplant group (2.32±0.13 and 2.02±0.19 ng/l,
respectively), liver transplant group (2.34±0.08 and 2.05±0.10
ng/l, respectively) and heart transplant group (−2.42±0.20 and
2.10±0.15 ng/l, respectively; P<0.001 for all comparisons).
However, no significant differences (P>0.05) were found when the
levels of total Rac1 and Rac1-GTP were compared among the three
transplant groups.
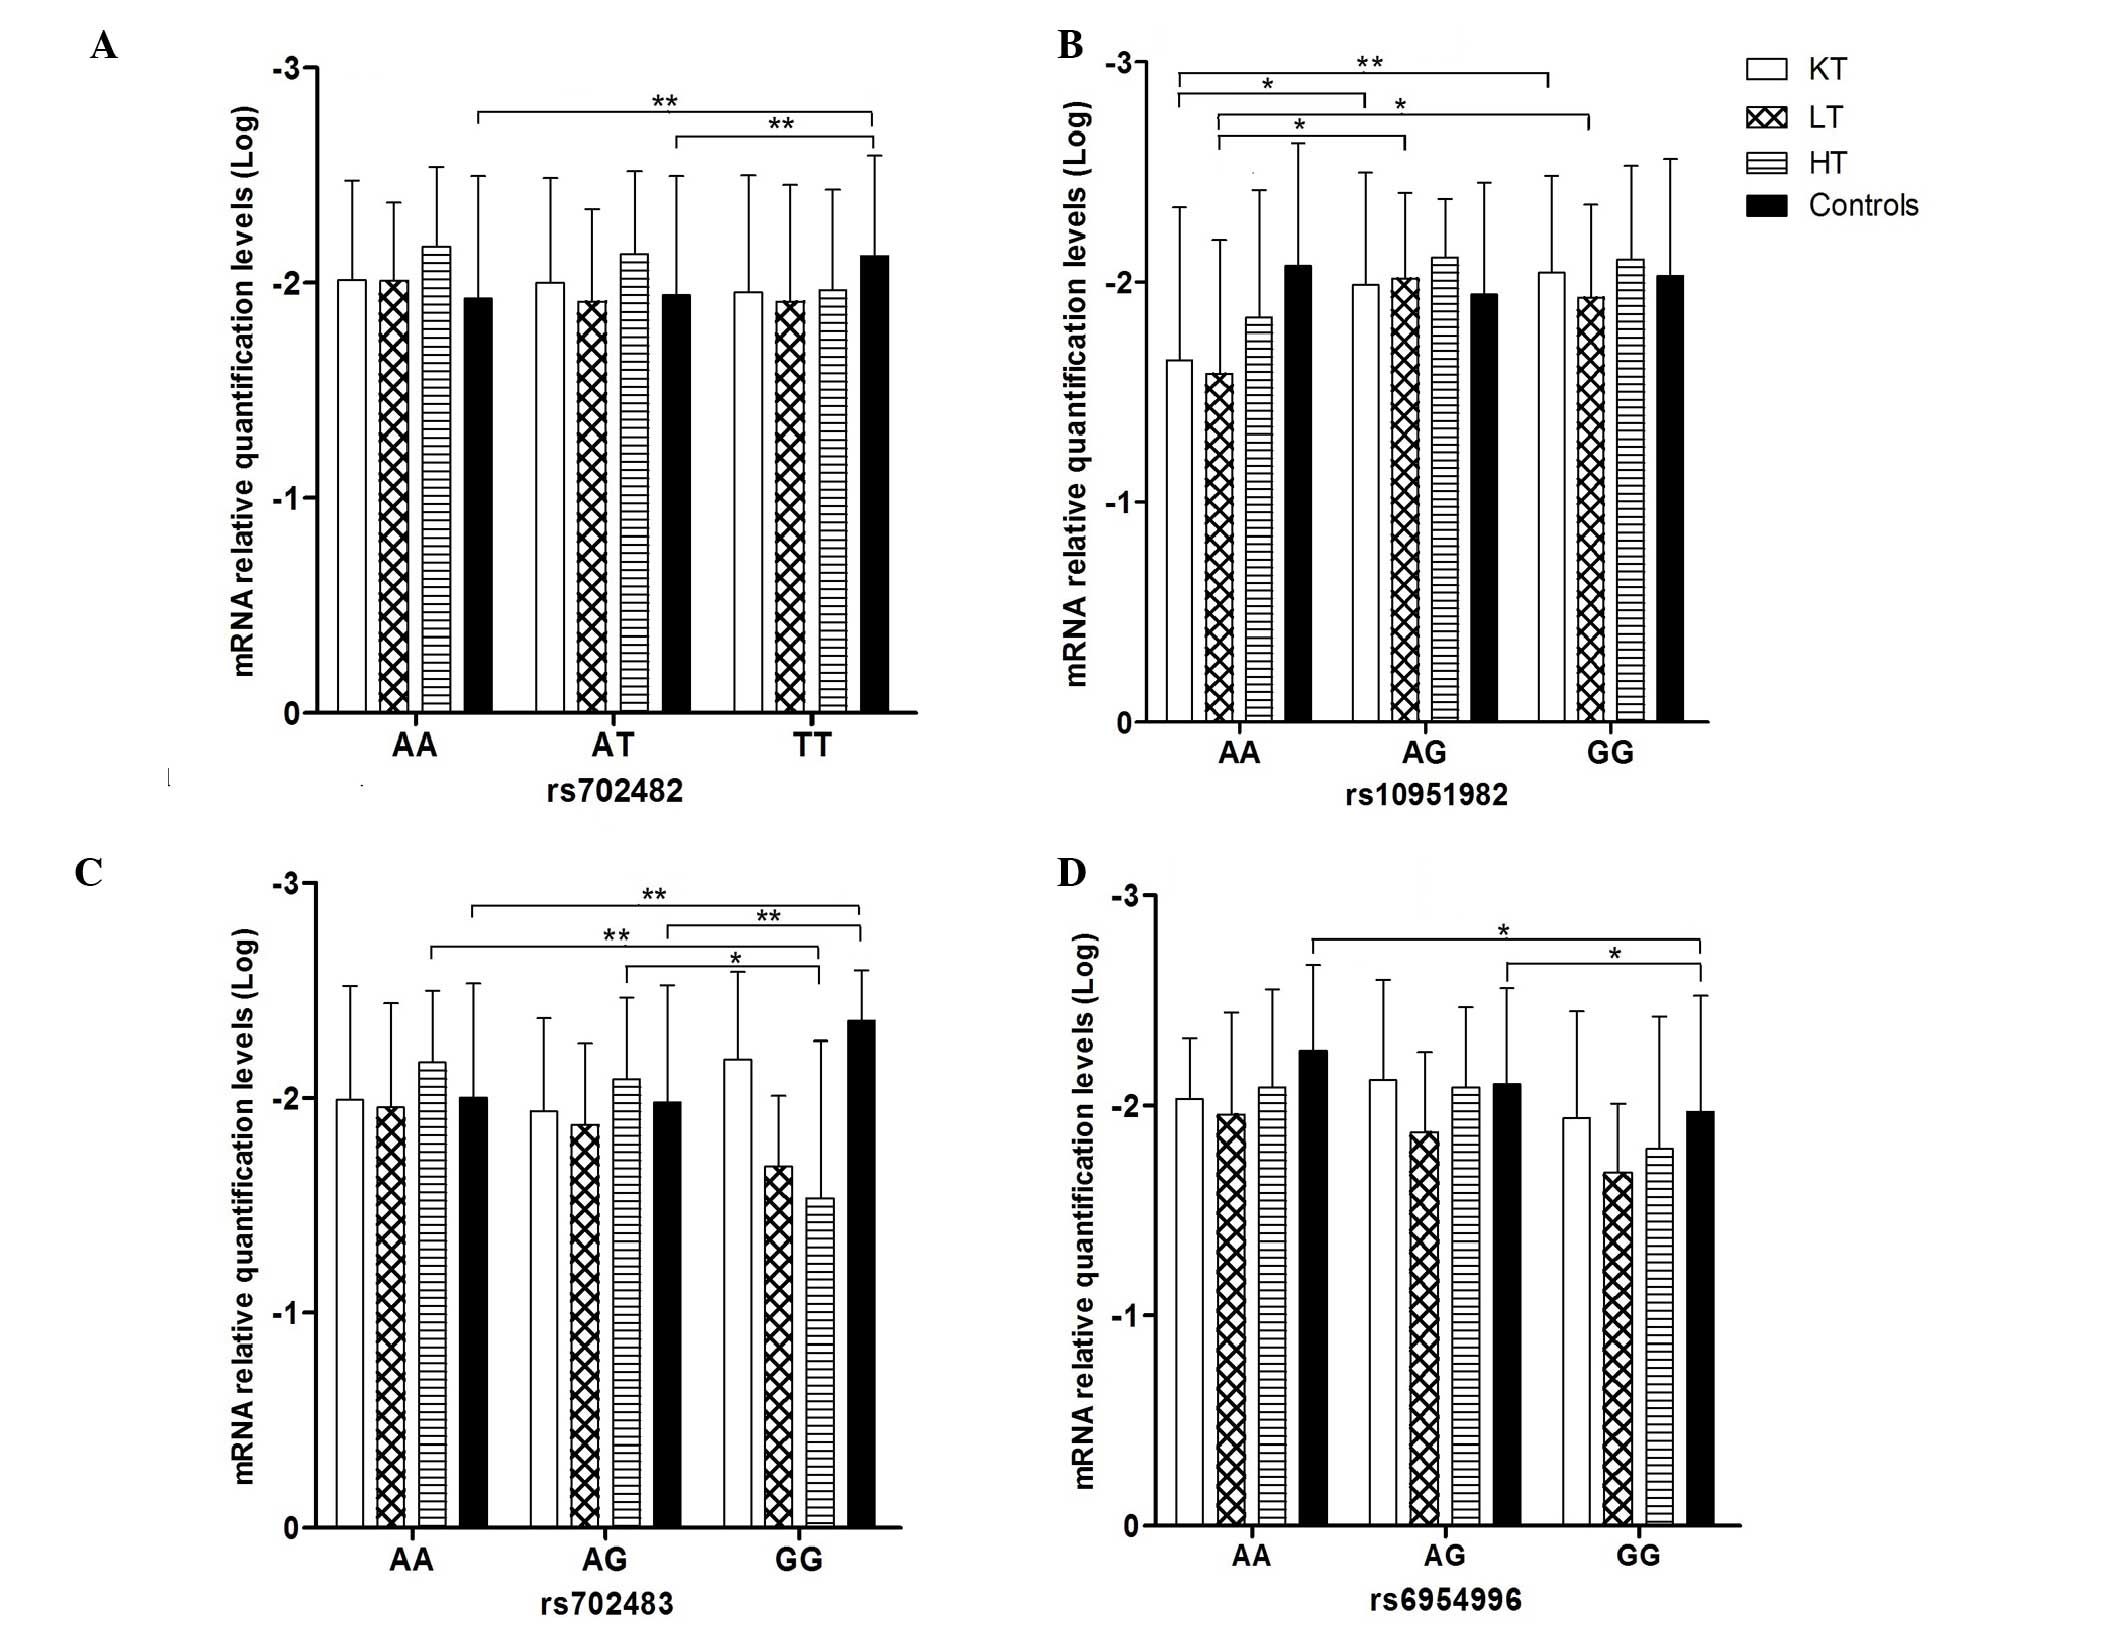
Association between RAC1 genotypes and
mRNA levels
The present study also investigated the association
between the RAC1 genotype and relative mRNA levels in the
examined populations, and significant differences were noted, as
shown in Fig. 2. Significant
associations (P<0.05) were observed between the rs702482,
rs702483 and rs6954996 genotypes and the relative quantification
levels of mRNA in the healthy control group. For rs702482, the
relative mRNA levels were lowest in the TT genotype (−2.12±0.47;
mean ± standard deviation), compared with the AA genotype
(−1.93±0.57) and AT genotype (−1.94±0.55), respectively
(P<0.01). For rs702483, the relative mRNA levels were lowest in
the GG genotype (−2.35±0.24), compared with the AA genotype
(−2.00±0.53) and AG genotype (−1.98±0.55), respectively
(P<0.01). For rs6954996, the relative mRNA levels were highest
in the GG genotype (−1.97±0.55), compared with the AG genotype
(−2.10±0.46) and AA genotype (−2.26±0.41), respectively
(P<0.05). In the kidney transplant group the mRNA level was
highest in the AA genotype (−1.65±0.69), compared with the AG
genotype (−1.99±0.51; P<0.05) and GG genotype (−2.04±0.44,
P<0.01) of rs10951982, respectively. In the liver transplant
group, the mRNA level was highest in the AA genotype (−1.58±0.61),
compared with the AG genotype (−2.02±0.39) and GG genotype
(−1.93±0.42) of rs10951982 (P<0.05), respectively. Additionally,
in the heart transplant group, the mRNA level was highest in GG
genotype (−1.53±0.73), compared with the AG genotype (−2.09±0.38;
P<0.05) and AA genotype (−2.16±0.33; P<0.01) of rs702483,
respectively.
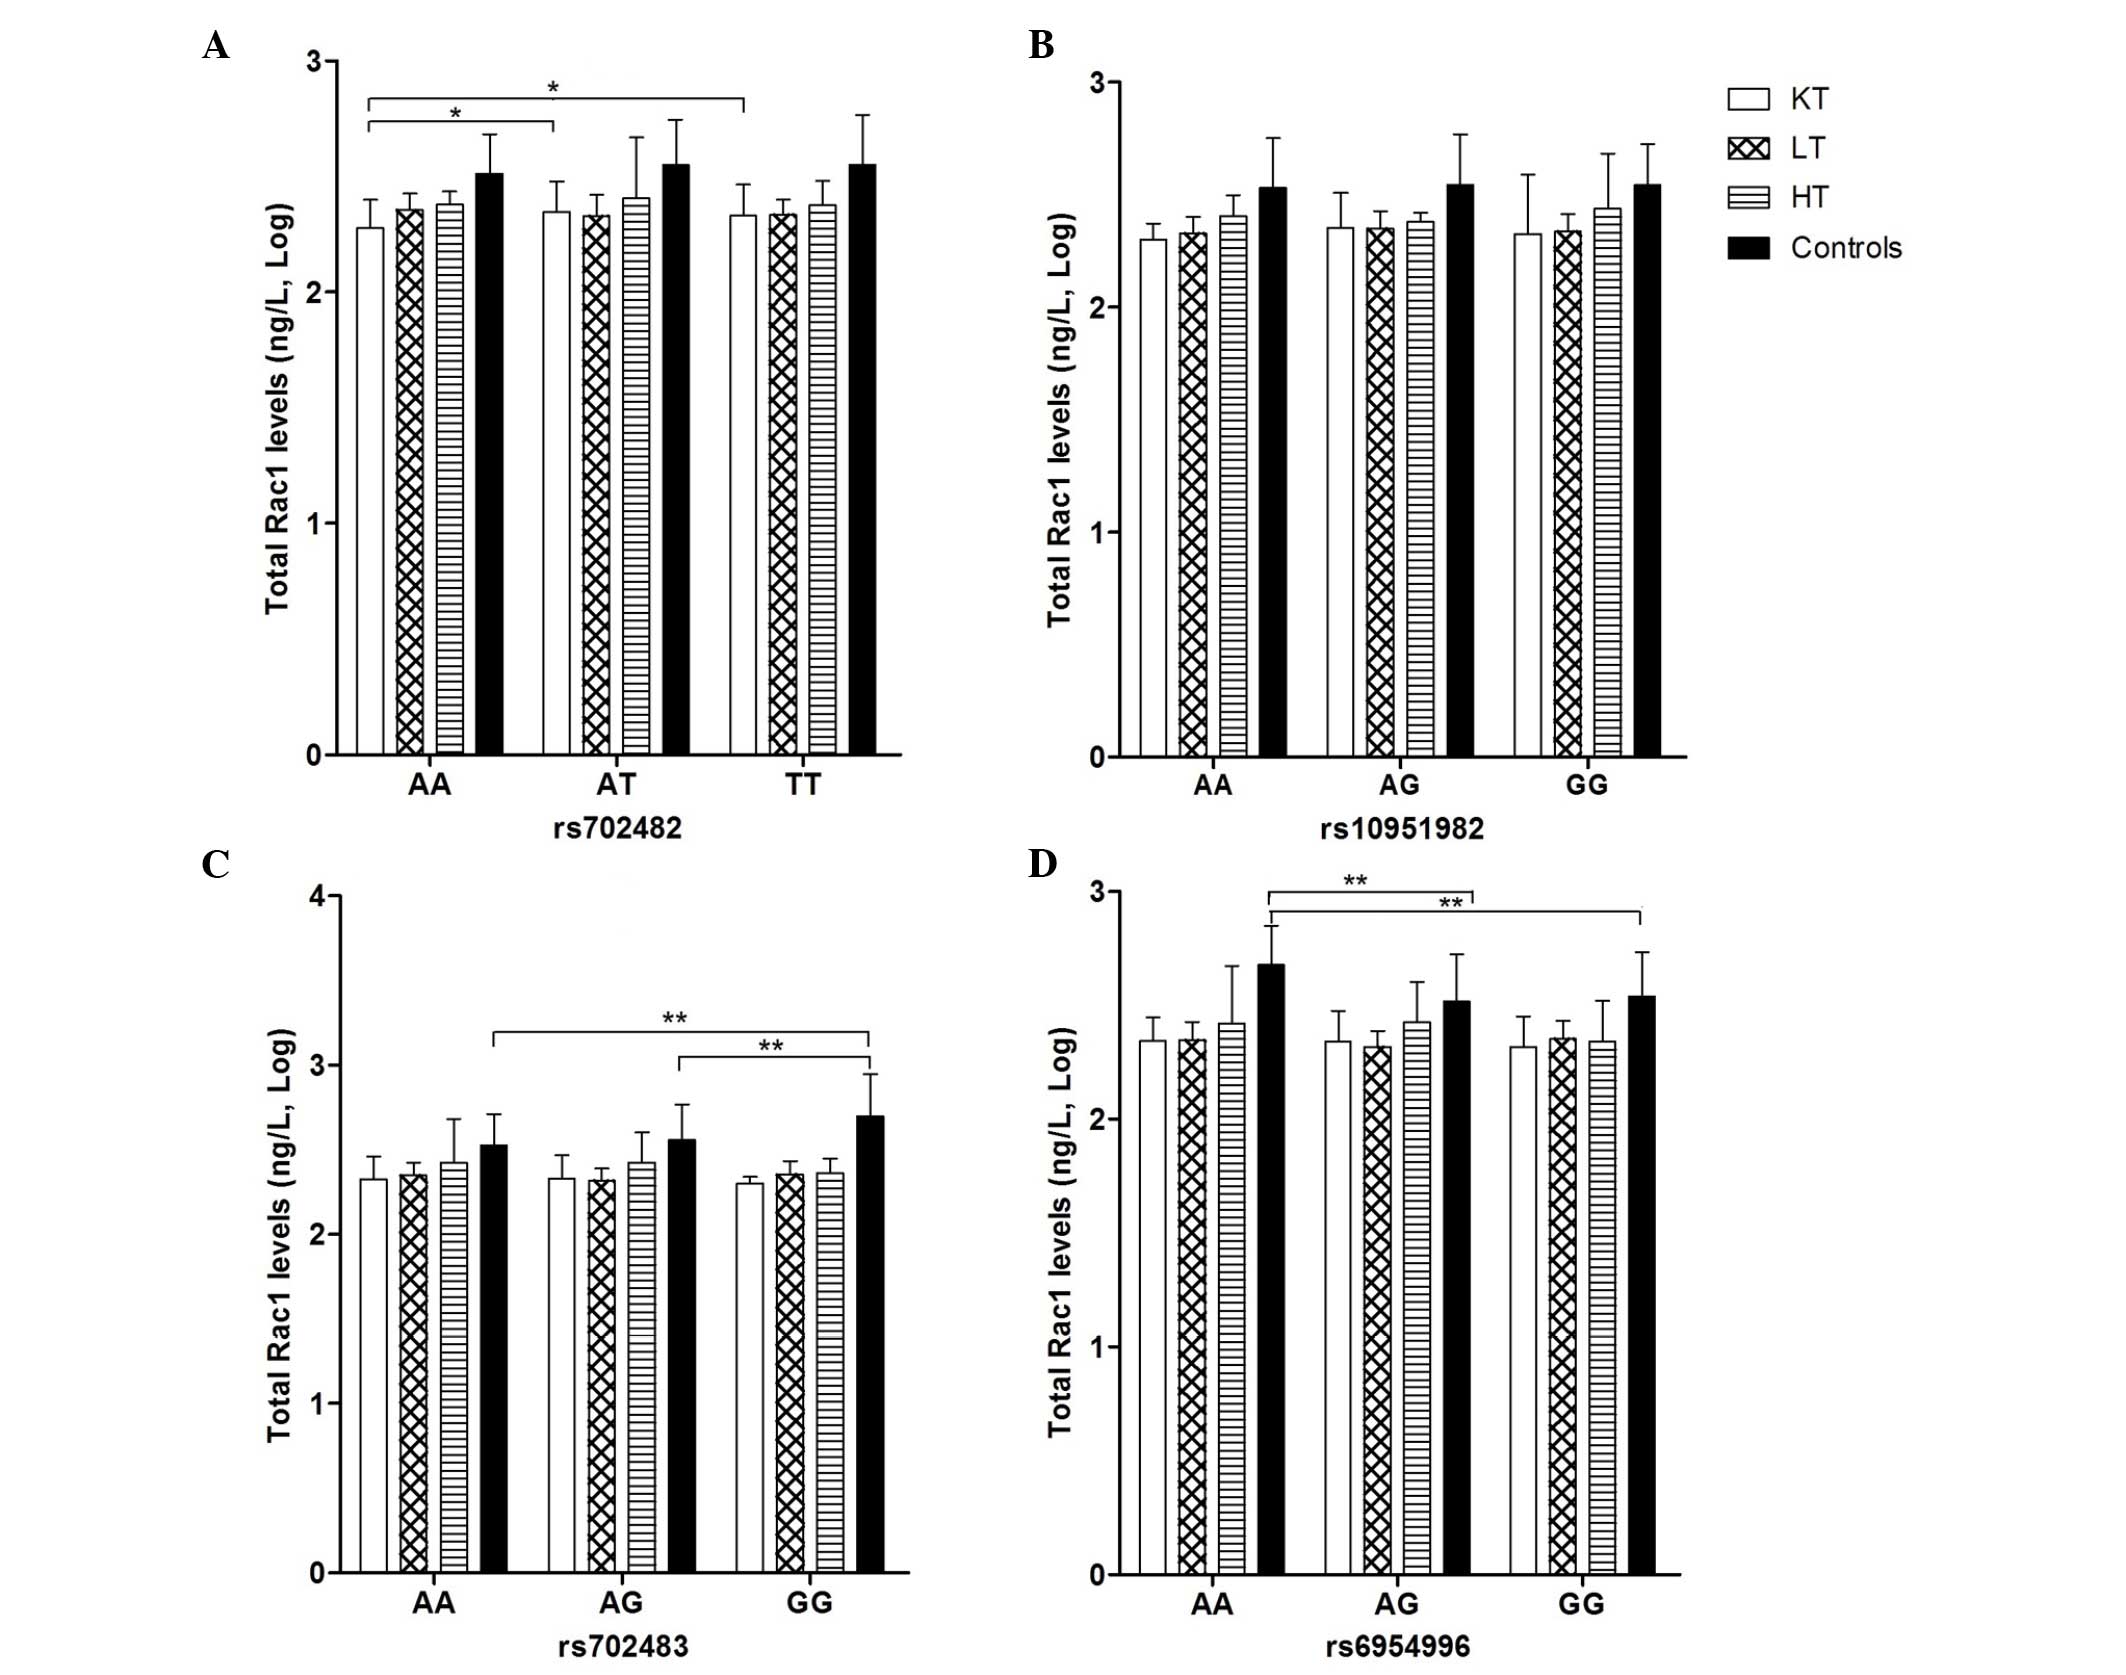
Association between the RAC1 genotype and
the levels of total Rac1 and Rac1-GTP
The present study examined the association between
the RAC1 genotype and the levels of total Rac1 in the study
populations, which are listed in Fig.
3. Significant associations were found in rs702483 in the
healthy control group, in which the level of total Rac1 was highest
in the GG genotype (2.70±0.25 ng/l), compared with the AG genotype
(2.56±0.21 ng/l) and AA genotype (2.53±0.19 ng/l), respectively
(P<0.01). In rs6954996, the level of total Rac1 was highest in
the AA genotype (2.68±0.17 ng/l), compared with the AG (2.52±0.21
ng/l) and GG genotype (2.54±0.19 ng/l), respectively (P<0.01).
In the kidney transplant group, a significant difference was also
apparent in rs702482, in which the level of total Rac1 was lowest
in the AA genotype (2.28±0.12 ng/l), compared with the AT genotype
(2.35±0.13 ng/l) and TT genotype (2.33±0.13 ng/l), respectively
(P<0.05).
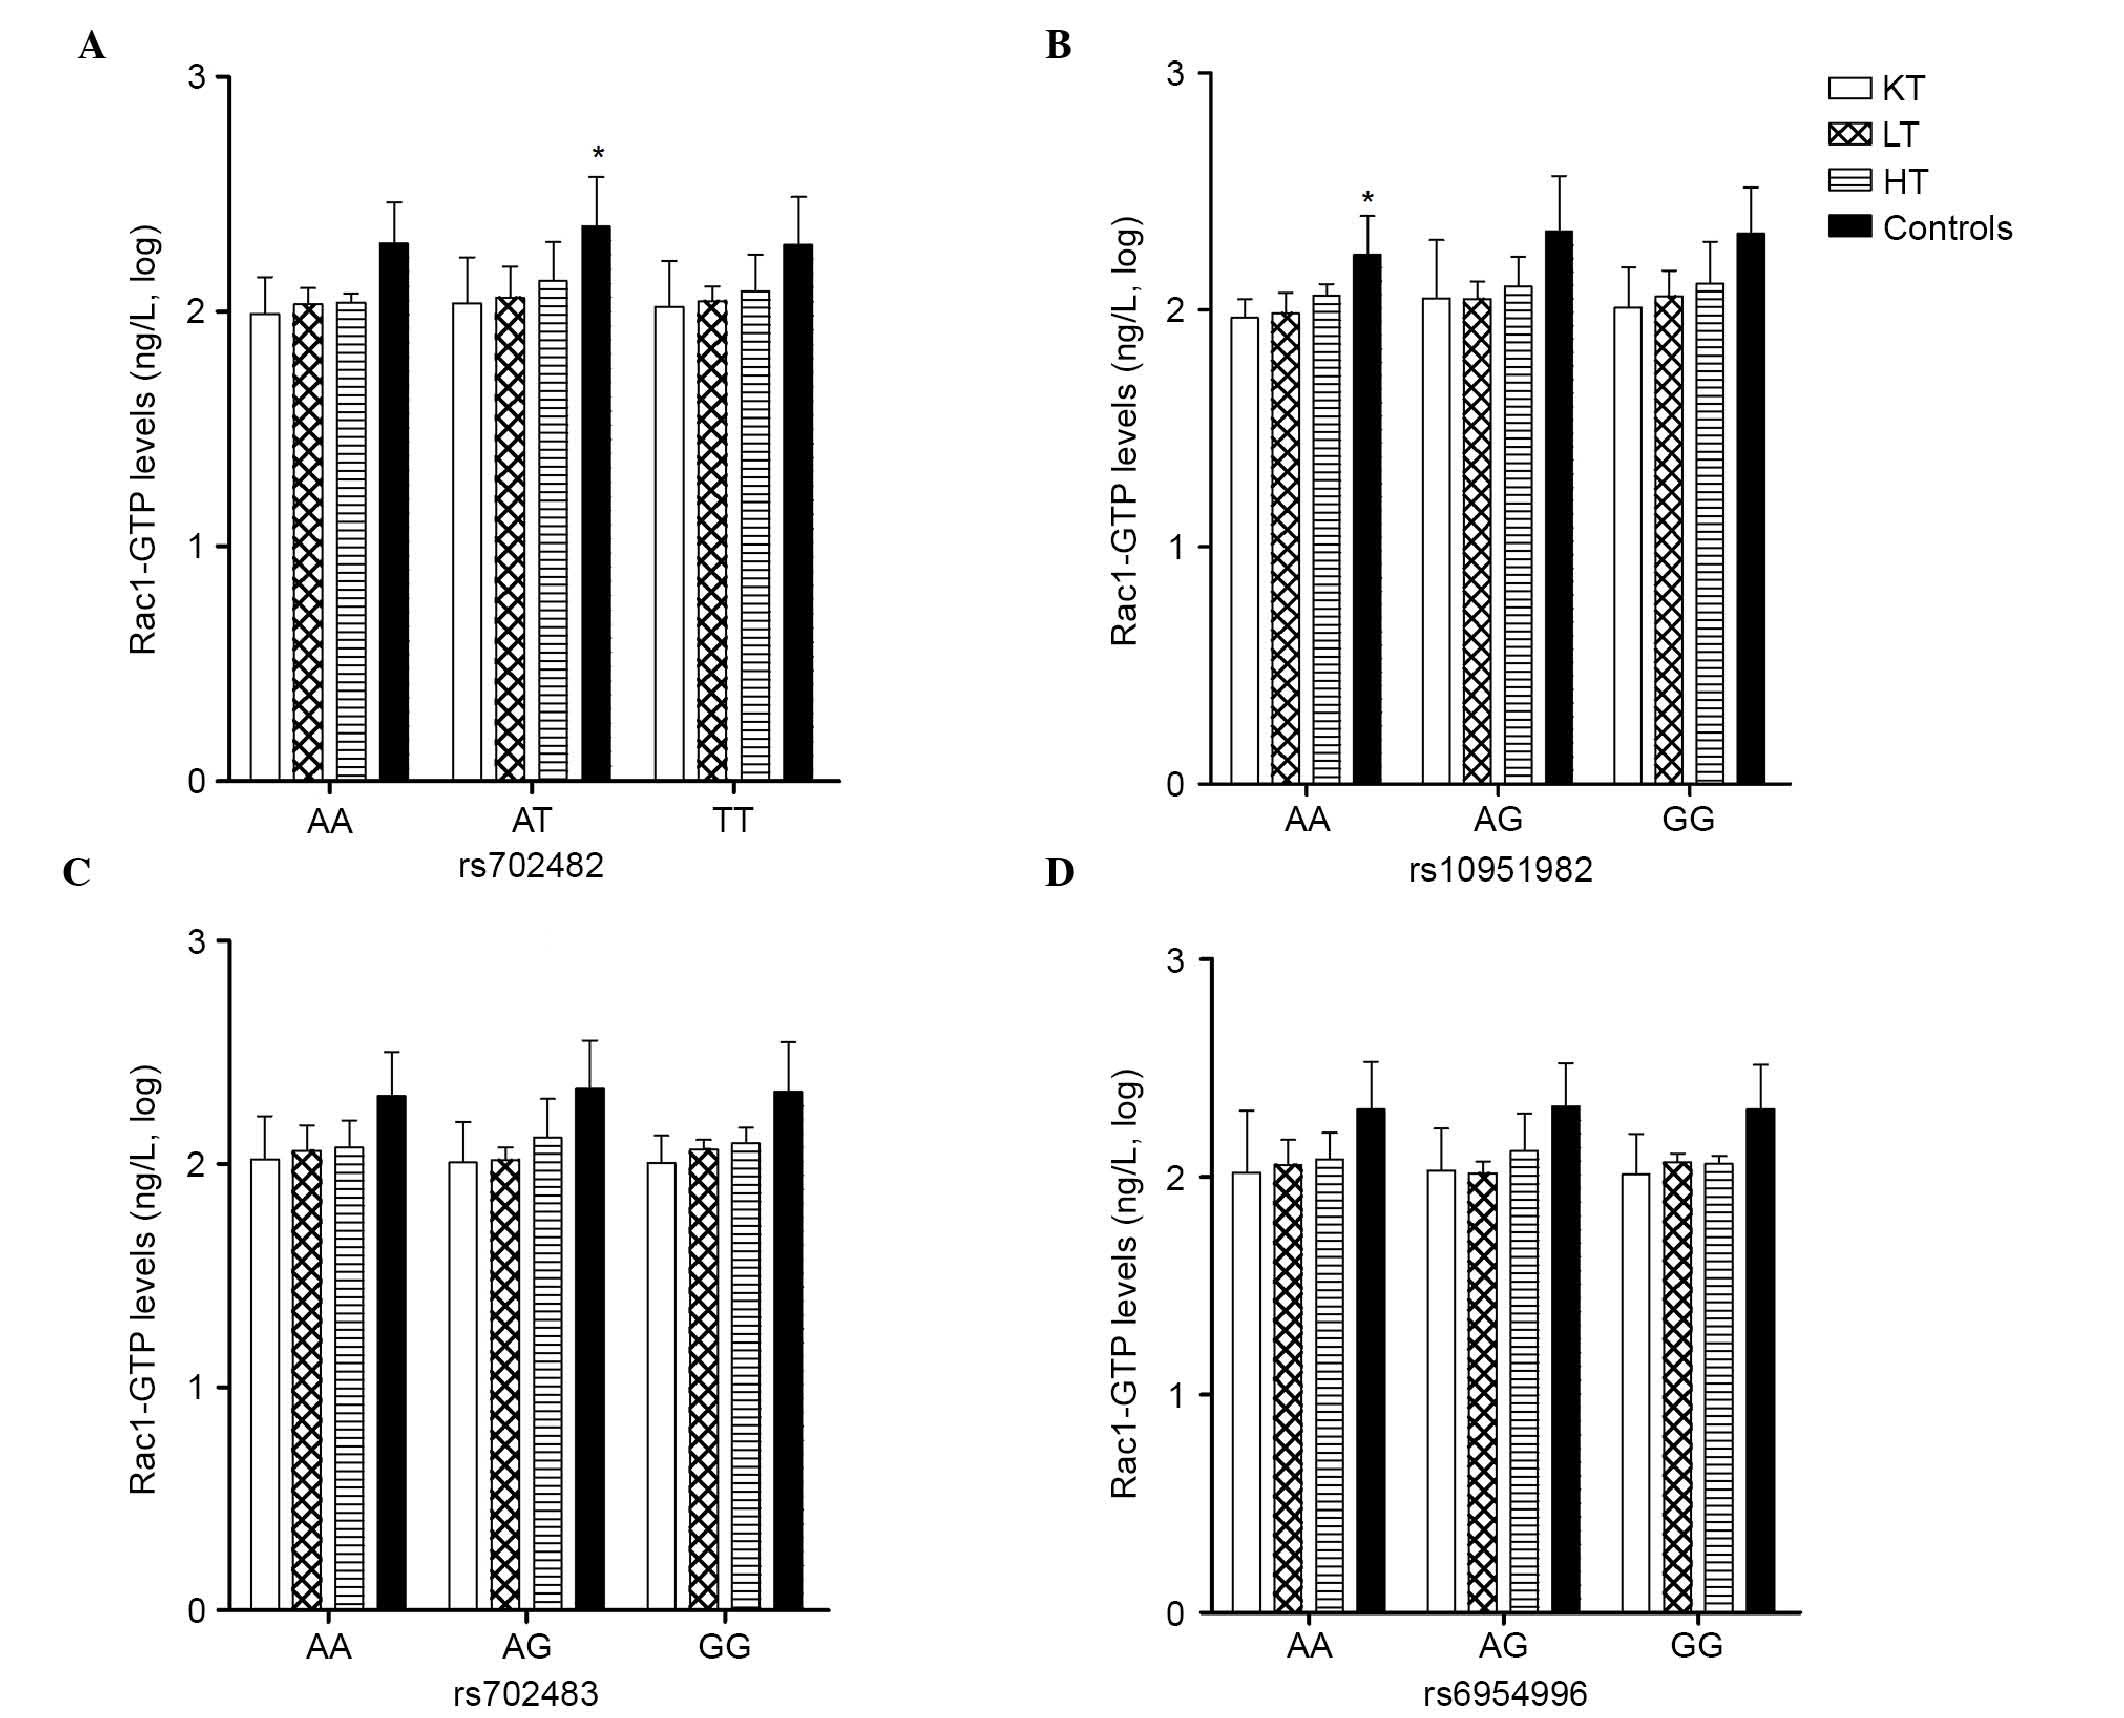
The association between the RAC1 genotype and
the levels of Rac1-GTP in the study populations are listed in
Fig. 4. As with the levels of
total Rac1, significant associations were found in the healthy
control group in rs702482, in which the level of Rac1-GTP was
highest in the AT genotype (2.36±0.22 ng/l), compared with the AA
genotype (2.29±0.18 ng/l) and TT genotype (2.28±0.20 ng/l),
respectively (P<0.05). In rs10951982, the level of Rac1-GTP was
lowest in the AA genotype (2.23±0.16 ng/l), compared with the AG
genotype (2.33±0.23 ng/l) and GG genotype (2.32±0.20 ng/l),
respectively (P<0.05).
Discussion
The present study was the first, to the best of our
knowledge, to investigate and compare the mRNA expression levels of
RAC1, and the protein levels of total Rac1 and Rac1-GTP in
SOTRs and Chinese healthy subjects, and to determine the
associations between RAC1 gene polymorphisms and the
expression levels of RAC1, Rac1 and Rac1-GTP.
The results of the present study, which consisted of
304 SOTRs comprising 164 kidney transplantations, 85 liver
transplantations and 55 heart transplantations, and 332 healthy
Hubei Chinese control subjects, demonstrated that the healthy
population had higher levels of total Rac1 and Rac1-GTP, compared
with the kidney, liver and heart transplant cases (P<0.001). It
has been suggested that alterations of the RAC1 gene,
through impairment of its activity, may affect susceptibility to
diseases, including renal failure, cardiac failure and hypertension
(34). It is known that activated
Rac1 can increase cell proliferation and differentiation, and
inhibiting cell apoptosis at the same time (4–11).
It has been reported that ~20% of tumors grow in Rac1-proficient
mice, exhibiting overexpression of Rac1 in tumor tissue, compared
with the surrounding normal tissue (27), which is in accordance with reports
showing overexpression of Rac1 protein in different types of human
tumor (35,36). As Rac1-GTP protein is the active
form of Rac1, increased expression of Rac1-GTP has been shown in
the glomeruli of rats with podocyte-specific overexpression of the
AT1 receptor, a model of effaced foot processes, podocyte depletion
and FSGS (28,29). Decreased expression of Rac1-GTP
reduces the DEN-induced formation of liver tumors and affects the
basal and DEN-induced expression of metabolic liver enzymes
(27).
Extensive investigations have been performed to
examine changes in the immune response gene expression profile in
allograft recipients. It has been reported that these genes,
involved in variant recognition, antigen-presenting synthesis,
signal transduction, and the regulation of protein transcription
and translation are downregulated following transplantation,
including protein tyrosine phosphatase type IVA 1 (PTP4A1)
(37) and potassium voltage-gated
channel subfamily Q member 3 (KCNQ3) (38). As with other downregulated genes,
the RAC1 gene is also involved in anti-apoptosis, signal
transduction, and the regulation of cell cycle and proliferation.
The present study demonstrated that the RAC1 gene was
downregulated following organ transplantation, as observed for the
PTP4A1 and KCNQ3 genes. The changes in the immune
response gene expression profile in allograft recipients are not
only due to regulations of autoimmunity, but also occur in the use
of exogenous immune inhibitors. Studies have shown that
azathioprine exerts its immunosuppressive activity via the
inhibition of Vav-mediated Rac1 activation, and consecutively
suppresses the functions of Rac1 on T cell survival and
T-cell-antigen-presenting cell conjugation (39,40).
The present study further analyzed the expression
levels of RAC1 mRNA and its protein in different genotypes.
For rs702482 in the healthy control group, the mRNA expression
levels were lowest in the TT genotype (−2.12±0.47), compared with
AA (−1.93±0.57) and AT (−1.94±0.55), respectively (P<0.01),
whereas the level of Rac1−GTP was highest in the AT genotype
(2.36±0.22 ng/l), compared with the AA (2.29±0.18 ng/l) and TT
genotypes (2.28±0.20 ng/l) respectively (P<0.05). For rs702483
in the healthy control group, the relative level of mRNA was lowest
in the GG genotype (−2.35±0.24), compared with the AA (−2.00±0.53)
and AG genotypes (−1.98±0.55), respectively (P<0.01), whereas
the level of total Rac1 was highest in the GG genotype (2.70±0.25
ng/l), compared with the AG (2.56±0.21 ng/l) and AA genotypes
(2.53±0.19 ng/l), respectively (P<0.01). For rs6954996 in the
healthy control group, the relative level of mRNA was highest in
the GG genotype (−1.97±0.55), compared with the AG (−2.10±0.46) and
AA genotype (−2.26±0.41), respectively (P<0.05), whereas the
level of total Rac1 was highest in the AA genotype (2.68±0.17
ng/l), compared with the AG (2.52±0.21 ng/l) and GG genotypes
(2.54±0.19 ng/l), respectively, (P<0.01). The differences in the
relative mRNA levels of RAC1 in the genotypes were different
from those of the proteins. It was difficult to determine the
association between the mRNA levels of RAC1 and its protein.
This may due to the complex regulatory mechanism of protein
expression. In addition to mRNA, several factors can affect protein
expression and activity, including ROS (41), shear stress (42), mechanical stretch (43), integrins (44), inflammatory cytokines (45), growth factors (46), homocysteine (47), high glucose concentrations
(48,49), NaCl or osmotic stress (50–53),
aldosterone (10,54) and angiotensin II (55–57).
In conclusion, the present study constitutes the
first, to the best of our knowledge, to report that the expression
levels of total Rac1 and Rac1-GTP were downregulated in SOTRs, and
that the RAC1 genetic polymorphisms potentially affects the
expression levels of RAC1 mRNA, and Rac1 and Rac1-GTP
proteins. However, it is difficult to conclude the exact
contribution of RAC1 polymorphisms to the protein levels of
Rac1 and Rac1-GTP due to the selection of SNPs and the limited
number of subjects. Further gene functional investigations are
urgently required to confirm and clarify these preliminary data.
The present analyses provide a foundation for further functional
investigations to reveal the biological and molecular functions of
the RAC1 gene in solid organ transplantation.
Abbreviations:
|
SOTRs
|
solid organ transplant recipients
|
|
Rac1
|
Ras-related C3 botulinum toxin
substrate 1
|
|
Rac1-GTP
|
active guanosine triphosphatase-bound
Ras-related C3 botulinum toxin substrate 1
|
|
GTPases
|
guanosine triphosphatases
|
|
ROS
|
reactive oxygen species
|
|
SNP
|
single nucleotide polymorphism
|
|
IBD
|
inflammatory bowel disease
|
|
DEN
|
diethylnitrosamine
|
|
OR
|
odds ratio
|
|
CI
|
confidence interval
|
Acknowledgments
This study was supported by National Natural Science
Foundation of China (grant no. 81273591) and the Fundamental
Research Funds for the Central Universities (China; grant no.
2014YGYL003). The funding bodies had no involvement in study
design, data collection and analysis, decision to publish or
preparation of the manuscript.
References
|
1
|
Rossman KL, Der CJ and Sondek J: GEF means
go: Turning on RHO GTPases with guanine nucleotide-exchange
factors. Nat Rev Mol Cell Biol. 6:167–180. 2005. View Article : Google Scholar : PubMed/NCBI
|
|
2
|
Park EJ, Ji KA, Jeon SB, Choi WH, Han IO,
You HJ, Kim JH, Jou I and Joe EH: Rac1 contributes to maximal
activation of STAT1 and STAT3 in IFN-gamma-stimulated rat
astrocytes. JImmunol. 173:5697–5703. 2004. View Article : Google Scholar
|
|
3
|
Hoppe AD and Swanson JA: Cdc42, Rac1 and
Rac2 display distinct patterns of activation during phagocytosis.
Mol Biol Cell. 15:3509–3519. 2004. View Article : Google Scholar : PubMed/NCBI
|
|
4
|
Schmitz AA, Govek EE, Böttner B and Van
Aelst L: Rho GTPases: Signaling, migration, and invasion. Exp Cell
Res. 261:1–12. 2000. View Article : Google Scholar : PubMed/NCBI
|
|
5
|
Maroto B, Ye MB, von Lohneysen K,
Schnelzer A and Knaus UG: P21-activated kinase is required for
mitotic progression and regulates Plk1. Oncogene. 27:4900–4908.
2008. View Article : Google Scholar : PubMed/NCBI
|
|
6
|
Khosravi-Far R, Solski PA, Clark GJ, Kinch
MS and Der CJ: Activation of Rac1, RhoA, and mitogen-activated
protein kinases is required for Ras transformation. Mol Cell Biol.
15:6443–6453. 1995. View Article : Google Scholar : PubMed/NCBI
|
|
7
|
Wells CM, Walmsley M, Ooi S, Tybulewicz V
and Ridley AJ: Rac1-deficient macrophages exhibit defects in cell
spreading and membrane ruffling but not migration. J Cell Sci.
117:1259–1268. 2004. View Article : Google Scholar : PubMed/NCBI
|
|
8
|
Walmsley MJ, Ooi SK, Reynolds LF, Smith
SH, Ruf S, Mathiot A, Vanes L, Williams DA, Cancro MP and
Tybulewicz VL: Critical roles for Rac1 and Rac2 GTPases in B cell
development and signaling. Science. 302:459–462. 2003. View Article : Google Scholar : PubMed/NCBI
|
|
9
|
Mizukawa B, Wei J, Shrestha M, Wunderlich
M, Chou FS, Griesinger A, Harris CE, Kumar AR, Zheng Y, Williams DA
and Mulloy JC: Inhibition of Rac GTPase signaling and downstream
prosurvival Bcl-2 proteins as combination targeted therapy in
MLL-AF9 leukemia. Blood. 118:5235–5245. 2011. View Article : Google Scholar : PubMed/NCBI
|
|
10
|
Iwashima F, Yoshimoto T, Minami I,
Sakurada M, Hirono Y and Hirata Y: Aldosterone induces superoxide
generation via Rac1 activation in endothelial cells. Endocrinology.
149:1009–1014. 2008. View Article : Google Scholar
|
|
11
|
Ma Q, Cavallin LE, Yan B, Zhu S, Duran EM,
Wang H, Hale LP, Dong C, Cesarman E, Mesri EA and
Goldschmidt-Clermont PJ: Antitumorigenesis of antioxidants in a
transgenic Rac1 model of Kaposi's sarcoma. Proc Natl Acad Sci USA.
106:8683–8688. 2009. View Article : Google Scholar : PubMed/NCBI
|
|
12
|
Canman CE and Kastan MB: Signal
transduction. Three paths to stress relief. Nature. 384:213–214.
1996. View
Article : Google Scholar : PubMed/NCBI
|
|
13
|
Jefferies CA and O'Neill LA: Rac1
regulates interleukin 1-induced nuclear factor kappaB activation in
an inhibitory protein kappaBalpha-independent manner by enhancing
the ability of the p65 subunit to transactivate gene expression. J
Biol Chem. 275:3114–3120. 2000. View Article : Google Scholar : PubMed/NCBI
|
|
14
|
Ungefroren H, Groth S, Sebens S, Lehnert
H, Gieseler F and Fändrich F: Differential roles of Smad2 and Smad3
in the regulation of TGF-β1-mediated growth inhibition and cell
migration in pancreatic ductal adenocarcinoma cells: Control by
Rac1. Mol Cancer. 10:672011. View Article : Google Scholar
|
|
15
|
Matos P, Skaug J, Marques B, Beck S,
Veríssimo F, Gespach C, Boavida MG, Scherer SW and Jordan P: Small
GTPase Rac1: Structure, localization, and expression of the human
gene. Biochem Biophys Res Commun. 277:741–751. 2000. View Article : Google Scholar : PubMed/NCBI
|
|
16
|
Risch N and Merikangas KR: Linkage studies
of psychiatric disorders. Eur Arch Psychiatry Clin Neurosci.
243:143–149. 1993. View Article : Google Scholar : PubMed/NCBI
|
|
17
|
Muise AM, Walters T, Xu W, Shen-Tu G, Guo
CH, Fattouh R, Lam GY, Wolters VM, Bennitz J, van Limbergen J, et
al: Single nucleotide polymorphisms that increase expression of the
guanosine triphosphatase RAC1 are associated with ulcerative
colitis. Gastroenterology. 141:633–641. 2011. View Article : Google Scholar : PubMed/NCBI
|
|
18
|
Tapia-Castillo A, Carvajal CA, Campino C,
Vecchiola A, Allende F, Solari S, García L, Lavanderos S, Valdivia
C, Fuentes C, et al: Polymorphisms in the RAC1 gene are associated
with hypertension risk factors in a Chilean pediatric population.
Am J Hypertens. 27:299–307. 2014. View Article : Google Scholar : PubMed/NCBI
|
|
19
|
Bourgine J, Garat A, Allorge D,
Crunelle-Thibaut A, Lo-Guidice JM, Colombel JF, Broly F and
Billaut-Laden I: Evidence for a functional genetic polymorphism of
the Rho-GTPase Rac1. Implication in azathioprine response?
Pharmacogene Genomics. 21:313–324. 2011. View Article : Google Scholar
|
|
20
|
Derijks LJ and Wong DR: Pharmacogenetics
of thiopurines in inflammatory bowel disease. Curr Pharm Des.
16:145–154. 2010. View Article : Google Scholar : PubMed/NCBI
|
|
21
|
Sahasranaman S, Howard D and Roy S:
Clinical pharmacology and pharmacogenetics of thiopurines. Eur J
Clin Pharmacol. 64:753–767. 2008. View Article : Google Scholar : PubMed/NCBI
|
|
22
|
Taher M, Ebrahimi Daryani N, Hedayat M,
Eslamian M, Farhadi E, Mahmoudi M, Shirzad S, Nouri Taromlou MK,
Chaharmahali M, Nicknam MH, et al: RAC1 single nucleotide
polymorphisms in Crohn's disease. Clin Res Hepatol Gastroenterol.
38:e75–e77. 2014. View Article : Google Scholar : PubMed/NCBI
|
|
23
|
Mundel P and Reiser J: Proteinuria: An
enzymatic disease of the podocyte? Kidney Int. 77:571–580. 2010.
View Article : Google Scholar
|
|
24
|
Welsh GI and Saleem MA: The podocyte
cytoskeleton-key to a functioning glomerulus in health and disease.
Nat Rev Nephrol. 8:14–21. 2011. View Article : Google Scholar : PubMed/NCBI
|
|
25
|
Brown JH, Del Re DP and Sussman MA: The
Rac and Rho hall of fame: A decade of hypertrophic signaling hits.
Circ Res. 98:730–742. 2006. View Article : Google Scholar : PubMed/NCBI
|
|
26
|
Lezoualc'h F, Métrich M, Hmitou I,
Duquesnes N and Morel E: Small GTP-binding proteins and their
regulators in cardiac hypertrophy. J Mol Cell Cardiol. 44:623–632.
2008. View Article : Google Scholar : PubMed/NCBI
|
|
27
|
Bopp A, Wartlick F, Henninger C, Schwarz
M, Kaina B and Fritz G: Rac1 promotes diethylnitrosamine
(DEN)-induced formation of liver tumors. Carcinogenesis.
36:378–389. 2015. View Article : Google Scholar : PubMed/NCBI
|
|
28
|
Hoffmann S, Podlich D, Hähnel B, Kriz W
and Gretz N: Angiotensin II type 1 receptor overexpression in
podocytes induces glomerulosclerosis in transgenic rats. J Am Soc
Nephrol. 15:1475–1487. 2004. View Article : Google Scholar : PubMed/NCBI
|
|
29
|
Hsu HH, Hoffmann S, Endlich N, Velic A,
Schwab A, Weide T, Schlatter E and Pavenstädt H: Mechanisms of
angiotensin II signaling on cytoskeleton of podocytes. J Mol Med
(Berl). 86:1379–1394. 2008. View Article : Google Scholar
|
|
30
|
Nagase M: Role of Rac1 GTPase in
salt-sensitive hypertension. Curr Opin Nephrol Hypertens.
22:148–155. 2013. View Article : Google Scholar : PubMed/NCBI
|
|
31
|
Shibata S, Mu S, Kawarazaki H, Muraoka K,
Ishizawa K, Yoshida S, Kawarazaki W, Takeuchi M, Ayuzawa N, Miyoshi
J, et al: Rac1 GTPase in rodent kidneys is essential for
salt-sensitive hypertension via a mineralocorticoid
receptor-dependent pathway. J Clin Invest. 121:3233–3243. 2011.
View Article : Google Scholar : PubMed/NCBI
|
|
32
|
Liu YN, Zhou JL, Yang CX, Sheng RF, Luo
XM, Zhang Yu and Shi SJ: Distribution of Rac1 gene polymorphism in
Hubei Hans renal transplant patients of China. Chin Pharm J.
49:1923–1927. 2014.
|
|
33
|
Zhou JL, Liu YN, Sheng RF, Yang CX, Luo
XM, Zhang Yu and Shi SJ: Analysis of RAC1 gene polymorphism in
Hubei Chinese healthy population. Chin J Immunol. 30:1297–1301.
2014.
|
|
34
|
Nagase M and Fujita T: Role of
Rac1-mineralocorticoid-receptor signalling in renal and cardiac
disease. Nat Rev Nephrol. 9:86–98. 2013. View Article : Google Scholar : PubMed/NCBI
|
|
35
|
Schnelzer A, Prechtel D, Knaus U, Dehne K,
Gerhard M, Graeff H, Harbeck N, Schmitt M and Lengyel E: Rac1 in
human breast cancer: Overexpression, mutation analysis, and
characterization of a new isoform, Rac1b. Oncogene. 19:3013–3020.
2000. View Article : Google Scholar : PubMed/NCBI
|
|
36
|
Fritz G, Just I and Kaina B: Rho GTPases
are overexpressed in human tumors. Int J Cancer. 81:682–687. 1999.
View Article : Google Scholar : PubMed/NCBI
|
|
37
|
Stegall MD, Park WD, Kim DY, Covarrubias
M, Khair A and Kremers WK: Changes in intragraft gene expression
secondary to ischemia reperfusion after cardiac transplantation.
Transplantation. 74:924–930. 2002. View Article : Google Scholar : PubMed/NCBI
|
|
38
|
Shah K, Tom Blake J, Huang C, Fischer P
and Koo GC: Immunosuppressive effects of a Kv1.3 inhibitor. Cell
Immunol. 221:100–106. 2003. View Article : Google Scholar : PubMed/NCBI
|
|
39
|
Tiede I, Fritz G, Strand S, Poppe D,
Dvorsky R, Strand D, Lehr HA, Wirtz S, Becker C, Atreya R, et al:
CD28-dependent Rac1 activation is the molecular target of
azathioprine in primary human CD4+ T lymphocytes. J Clin Invest.
111:1133–1145. 2003. View Article : Google Scholar : PubMed/NCBI
|
|
40
|
Poppe D, Tiede I, Fritz G, Becker C,
Bartsch B, Wirtz S, Strand D, Tanaka S, Galle PR, Bustelo XR and
Neurath MF: Azathioprine suppresses ezrin-radixin-moesin-dependent
T cell-APC conjugation through inhibition of Vav guanosine exchange
activity on Rac proteins. J Immunol. 176:640–651. 2006. View Article : Google Scholar
|
|
41
|
Nagase M, Ayuzawa N, Kawarazaki W,
Ishizawa K, Ueda K, Yoshida S and Fujita T: Oxidative stress causes
mineralocorticoid receptor activation in rat cardiomyocytes: Role
of small GTPase Rac1. Hypertension. 59:500–506. 2012. View Article : Google Scholar : PubMed/NCBI
|
|
42
|
Tzima E, Del Pozo MA, Kiosses WB, Mohamed
SA, Li S, Chien S and Schwartz MA: Activation of Rac1 by shear
stress in endothelial cells mediates both cytoskeletal
reorganization and effects on gene expression. EMBO J.
21:6791–6800. 2002. View Article : Google Scholar : PubMed/NCBI
|
|
43
|
Aikawa R, Nagai T, Tanaka M, Zou Y,
Ishihara T, Takano H, Hasegawa H, Akazawa H, Mizukami M, Nagai R
and Komuro I: Reactive oxygen species in mechanical stress-induced
cardiac hypertrophy. Biochem Biophys Res Commun. 289:901–907. 2001.
View Article : Google Scholar : PubMed/NCBI
|
|
44
|
Price LS, Leng J, Schwartz MA and Bokoch
GM: Activation of Rac and Cdc42 by integrins mediates cell
spreading. Mol Biol Cell. 9:1863–1871. 1998. View Article : Google Scholar : PubMed/NCBI
|
|
45
|
Papaharalambus C, Sajjad W, Syed A, Zhang
C, Bergo MO, Alexander RW and Ahmad M: Tumor necrosis factor alpha
stimulation of Rac1 activity. Role of isoprenylcysteine
carboxylmethyltransferase. J Biol Chem. 280:18790–18796. 2005.
View Article : Google Scholar : PubMed/NCBI
|
|
46
|
Kurokawa K, Itoh RE, Yoshizaki H, Nakamura
YO and Matsuda M: Coactivation of Rac1 and Cdc42 at lamellipodia
and membrane ruffles induced by epidermal growth factor. Mol Biol
Cell. 15:1003–1010. 2004. View Article : Google Scholar :
|
|
47
|
Yi F, Zhang AY, Janscha JL, Li PL and Zou
AP: Homocysteine activates NADH/NADPH oxidase through
ceramide-stimulated Rac GTPase activity in rat mesangial cells.
Kidney Int. 66:1977–1987. 2004. View Article : Google Scholar : PubMed/NCBI
|
|
48
|
Lin CL, Wang JY, Ko JY, Surendran K, Huang
YT, Kuo YH and Wang FS: Superoxide destabilization of beta-catenin
augments apoptosis of high-glucose-stressed mesangial cells.
Endocrinology. 149:2934–2942. 2008. View Article : Google Scholar : PubMed/NCBI
|
|
49
|
Shen E, Li Y, Li Y, Shan L, Zhu H, Feng Q,
Arnold JM and Peng T: Rac1 is required for cardiomyocyte apoptosis
during hyperglycemia. Diabetes. 58:2386–2395. 2009. View Article : Google Scholar : PubMed/NCBI
|
|
50
|
Uhlik MT, Abell AN, Johnson NL, Sun W,
Cuevas BD, Lobel-Rice KE, Horne EA, Dell'Acqua ML and Johnson GL:
Rac-MEKK3-MKK3 scaffolding for p38 MAPK activation during
hyperosmotic shock. Nat Cell Biol. 5:1104–1110. 2003. View Article : Google Scholar : PubMed/NCBI
|
|
51
|
Friis MB, Friborg CR, Schneider L, Nielsen
MB, Lambert IH, Christensen ST and Hoffmann EK: Cell shrinkage as a
signal to apoptosis in NIH 3T3 fibroblasts. J Physiol. 567:427–443.
2005. View Article : Google Scholar : PubMed/NCBI
|
|
52
|
Silva GB and Garvin JL: Rac1 mediates
NaCl-induced superoxide generation in the thick ascending limb. Am
J Physiol Renal Physiol. 298:F421–F425. 2010. View Article : Google Scholar :
|
|
53
|
Liu R and Juncos LA: GTPase-Rac enhances
depolarization-induced superoxide production by the macula densa
during tubuloglomerular feedback. Am J Physiol Regul Integr Comp
Physiol. 298:R453–R458. 2010. View Article : Google Scholar :
|
|
54
|
Shibata S, Nagase M, Yoshida S, Kawachi H
and Fujita T: Podocyte as the target for aldosterone: Roles of
oxidative stress and Sgk1. Hypertension. 49:355–364. 2007.
View Article : Google Scholar : PubMed/NCBI
|
|
55
|
Schmitz U, Thömmes K, Beier I, Wagner W,
Sachinidis A, Düsing R and Vetter H: Angiotensin II-induced
stimulation of p21-activated kinase and c-Jun NH2-terminal kinase
is mediated by Rac1 and Nck. J Biol Chem. 276:22003–22010. 2001.
View Article : Google Scholar : PubMed/NCBI
|
|
56
|
Takemoto M, Node K, Nakagami H, Liao Y,
Grimm M, Takemoto Y, Kitakaze M and Liao JK: Statins as antioxidant
therapy for preventing cardiac myocyte hypertrophy. J Clin Invest.
108:1429–1437. 2001. View Article : Google Scholar : PubMed/NCBI
|
|
57
|
Nishida M, Tanabe S, Maruyama Y, Mangmool
S, Urayama K, Nagamatsu Y, Takagahara S, Turner JH, Kozasa T,
Kobayashi H, et al: G alpha 12/13- and reactive oxygen
species-dependent activation of c-Jun NH2-terminal kinase and p38
mitogen-activated protein kinase by angiotensin receptor
stimulation in rat neonatal cardiomyocytes. J Biol Chem.
280:18434–18441. 2005. View Article : Google Scholar : PubMed/NCBI
|