Introduction
Non-alcoholic fatty liver disease (NAFLD) is a
rapidly growing epidemic, which is closely associated with insulin
resistance and type 2 diabetes (1–3).
Developing novel therapeutic interventions requires a comprehensive
understanding of the mechanisms by which excess hepatic lipid
develops and causes hepatic insulin resistance. Hepatic steatosis
is the basic pathophysiological change existing throughout the
development of NAFLD and increased de novo lipogenesis has
been shown to be a mechanism by which fatty liver develops
(4,5). In addition, it has been increasingly
recognized that endoplasmic reticulum stress (ERS) is important in
the regulation of lipid metabolism in hepatocytes (6–8).
Recent studies using genetic or dietary models of fatty liver have
indicated a key association between hepatic steatosis and ER
stress, as well as the physiological role of the unfolded protein
response (UPR) sensors in lipid homeostasis (5,6,9,10).
UPR is a response to the accumulation of unfolded
proteins in the ER, characterized by the activation of three
distinct signal transduction pathways mediated by
inositol-requiring enzyme 1 (IRE1), PKR-like ER kinase (PERK) and
activating transcription factor (ATF) 6α. ERS occurs in hepatocytes
during liver steatosis (6,11). Intervention with ERS inhibitors,
including 4-phenylbutyric acid (4-PBA) and tauroursodeoxycholic
(TUDCA), demonstrated that resolved ERS can improve hepatosteatosis
in ob/ob mice and 4-PBA can reduce hepatic lipid accumulation in
ob/ob mice by inhibiting ERS (6).
In addition, in a fatty liver model, the inhibition of ERS by 4-PBA
can attenuate the lipogenic pathway in high-fructose-fed mice
(12). However, the direct effect
of ERS inhibition and induction on lipogenesis has not been
investigated in hepatocytes in vitro.
Furthermore, it has been indicated that two UPR
pathways, PERK-eukaryotic initiation factor 2α (eIF2α)-ATF4 and
IRE-1-X-box binding protein 1 (XBP1) pathways, are involved in the
stimulation of de novo lipogenesis in the liver (13). The PERK-eIF-2α-ATF4 pathway, which
activates transcription factor-4 (ATF4), is reported to be involved
in the regulation of lipogenesis (14). ATF4 is the downstream transcription
factor along this UPR arm. ATF4 is found to be involved in a number
of different physiological events, such as long-term memory
(15), osteoblast differentiation
(10) glucose and glycogen
bisosynthesis (16), and redox
homoeostasis (17). Recently, ATF4
has been shown to be important in the regulation of lipid
metabolism. ATF4-null mice do not develop NAFLD when induced by a
high-fat diet (16). ATF4
deficiency protects mice from high-carbohydrate diet-induced liver
steatosis (18). Furthermore, ATF4
deficiency prevents the development of steatosis and
hypertriglyceridemia in response to high fructose intake in mice
(19). Nevertheless, the direct
effect of ATF4 on the lipogenic pathway and hepatic insulin
transduction in liver cells requires further investigation.
Therefore, for further understanding of the
association between ATF4 and hepatic lipogeneis, the direct effect
of ERS on hepatic lipogenesis was investigated in HepG2 cells in
the present study. Subsequently, the impact of ATF4 deficiency or
overexpression on the hepatic lipogeneic pathway and insulin
signaling transduction in HepG2 cells was observed.
Materials and methods
Cell line and groups
Briefly, HepG2 cells were cultured in minimal
essential medium (HyClone, Thermo Fisher Scientific, Inc., Waltham,
MA, USA), supplemented with 10% (v/v) fetal bovine serum (FBS,
Sijiqing Tianhang Biotechnology Co. Hangzhou China), 1% (v/v)
nonessential amino acids, 100 U/ml penicillin and 100 µg/ml
streptomycin (Shijiazhuang, China), in a 5%
CO2-humidified atmosphere. Subsequently, HepG2 cells
were stimulated with 20 mmol/l fructose, fructose plus inhibitor
4-PBA (10 or 20 mmol/l; Sigma-Aldrich, St. Louis, MO, USA) or
inducer tunicamycin (0.1, 0.5, 2 and 5 µg/ml; Abcam,
Cambridge, MA, USA).
Transient plasmid transfection
HepG2 cells that had reached 80% confluence were
transfected with ATF4 vector (EX-F0119-M13-5; GeneCopoeia, Inc.,
Rockville, MD, USA) or AFT4 small interfering (si)RNA (Santa Cruz
Biotechnology Inc., Santa Cruz, CA, USA) for upregulation and
downregulation of ATF4, respectively, using Lipofectamine 2000 in 2
ml serum-free Minimum Essential Media (MEM; GE Healthcare Life
Sciences, Logan, UT, USA). The vacant EX-EGFP-M13 vector
(GeneCopoeia, Inc.) and non-transfected cells were used as
controls. At 8 h after transfection the medium was replaced by
normal MEM with 10% FBS for 24 h. Finally, the cells were cultured
for 48 h prior to analysis.
Quantitative detection of triglyceride
(TG) in HepG2 cells
To determine the effect of ATF4 on lipid metabolism
in HepG2 cells, the cells were washed twice with phosphate-buffered
saline (PBS), and lysed on ice with radioimmunoprecipitation buffer
(Pulilai Bioengineering Institute, Changchun, China) for 30 min.
After centrifugation at 447.2 × g for 20 min at 4°C, the
supernatant was transferred to a new tube. The protein
concentration was determined by the bicinchoninic acid assay
method. TG levels were measured based on an enzymatic assay from
Pulilai Bioengineering Institute, according to the manufacturer's
instructions.
Oil red O staining
Cultured cells were fixed for 30 min in 4%
paraformaldehyde (in PBS), and stained for 2 h with 1% Oil Red O.
The stained sections were imaged with an Olympus microscope and
examined in a blinded manner by the pathologist.
Reverse transcription-quantitative
polymerase chain reaction (RT-qPCR)
Total RNA was extracted from HepG2 cells using
TRIzol reagent (Invitrogen; Thermo Fisher Scientific, Inc.),
according to the manufacturer's protocol. RNA purity was confirmed
by measuring the ratio of absorbance at 260 and 280 nm on a
spectrophotometer. Reverse transcription of RNA (8 µl) was
conducted according to the instructions of the Easy Script
First-Strand cDNA Synthesis Super Mix kit (TransGen Biotech, Co.,
Ltd., Beijing, China). Specific primers (Table I) for the amplification of
regulator sterol regulatory element-binding proteins (SREBP-1c),
carbohydrate response element-binding protein (ChREBP) and
glyceraldehyde 3-phosphate dehydrogenase (GAPDH) were verified by
NCBI BLAST (http://blast.ncbi.nlm.nih.gov/Blast.cgi). qPCR was
performed on an ABI PRISM 7300 PCR system (Applied Biosystems,
Thermo Fisher Scientific Inc.) using SYBR Green I GoTaq qPCR Master
mix (Promega Corporation, Madison, WI, USA). PCR was conducted in a
total volume of 25 µl with the following reaction
conditions: 1 cycle at 95°C for 5 min, followed by 40 cycles of
95°C for 15 sec, 58°C for 20 sec and 72°C for 30 sec. The gene
expression from each sample was analyzed in duplicate and
normalized against GAPDH. The results are expressed as relative
gene expression using the 2−ΔΔCq method (20).
 | Table IPrimer sequences for amplification of
SREBP-1c, ChREBP and GAPDH. |
Table I
Primer sequences for amplification of
SREBP-1c, ChREBP and GAPDH.
| Gene | Forward | Reverse |
|---|
| GAPDH |
5′GGATGATGTTCTGGAGAGCC3′ |
5′CATCACCATCTTCCAGGAGC3′ |
| SREBP-1c |
5′CTTCCGCCCTTGAGCTG3′ |
5′CTGGTGTGTCCGTGTGG3′ |
| ChREBP |
5′TGCGGGATGAGATTGAGGA3′ |
5′TCCAGTTGTGCAGCGTAC3′ |
Evaluation of insulin signal
transduction
To observe the effect of ATF4 on insulin sensitivity
in fructose-treated HepG2 cells, HepG2 cells transfected with
specific ATF-4 vector or siRNA were incubated in the presence or
absence of 100 nmol/l insulin for 30 min. The protein expression
levels of phosphorylated (p)-Akt/total-Akt and p-glycogen synthase
kinase 3β (GSK3β)/t-GSK3β were then detected by western
blotting.
Western blotting
Cytoplasmic and nuclear proteins were extracted from
HepG2 cells using 1 ml radioimmunoprecipitation assay buffer
(Beijing Dingguo Biotechnology, Co., Ltd., Beijing, China)
containing 10 µl phenylmethylsulfonyl. The protein
concentration was determined using the bicinchoninic acid assay
method. The extracted protein samples were mixed with sodium
dodecyl sulfate (SDS) loading buffer and boiled for 10 min prior to
loading. Subsequently, protein samples were separated by 10%
SDS-PAGE and transferred onto polyvinylidene difluoride membranes
(EMD Millipore, Billerica, MA, USA). The membrane was blocked for 2
h at 37°C with non-fat milk or 5% bovine serum albumin (Ameresco,
Inc., Framingham, MA, USA) in Tris-buffered saline containing 0.05%
Tween 20 (TBST). The membrane was then incubated with the following
primary antibodies overnight at 4°C: Rabbit anti-stearoyl-CoA
desaturase 1 (SCD-1; cat. no. 2438; 1:1,000), acetyl-CoA
carboxylase (ACC; cat. no. 3662; 1:800), ATF4 (cat. no. 11815;
1:1,000), C/EBP homologous protein (CHOP; cat. no. 5554; 1:1,000),
Akt (cat. no. 9272; 1:1,000), p-Akt (Thr308) (cat. no. 9271;
1:1,000), GSK3β (cat. no. 9331; 1:1,000), p-GSK3β (Ser21/9) (cat.
no. 5676; 1:1,000), eIF2-α (cat. no. 9722; 1:1,000) and p-eIF2-α
(Ser51) (cat. no. 5199; 1:1,000) polyclonal antibodies, and rabbit
anti-XBP-1 monoclonal antibody (cat. no. 12782; 1:1,000), from Cell
Signaling Technology Inc. (Beverly, MA, USA); rabbit anti-PERK
(cat. no. sc-13073; 1:500), p-PERK (Thr980) (cat. no. sc-32577;
1:500) and fatty acid synthase (FAS; cat. no. C-20; 1:500)
polyclonal antibodies from Santa Cruz Biotechnology Inc.; rabbit
anti-IRE-1 (cat. no. ab62570; 1:1,000) and p-IRE-1 (Ser724) (cat.
no. ab48187; 1:1,000) polyclonal antibodies from Abcam; and mouse
anti-β-actin monoclonal antibody (cat. no. 66009-1-Ig;1:5,000) from
Cambridge Bioscience (Cambridge, UK). Subsequently, the membrane
was washed three times with TBST and then incubated with
horseradish peroxidase-conjugated goat anti-rabbit (cat. no.
L3012-2; 1:5,000) and anti-mouse (L3032-2; 1:5,000) secondary
antibodies (Signalway Antibody, College Park, MD, USA) at room
temperature for 2 h. After rinsing with TBST three times, the
membrane was treated with enhanced chemiluminescence (ECL) solution
(Pierce Biotechnology; Thermo Fisher Scientific Inc.) and bands
were detected by exposing the blots to X-ray films (Ruike Medical
Instrument, Xiamen, China). β-actin served as an internal control
protein. Band intensities were quantified using ImageJ software,
version 1.42q (https://imagej.nih.gov/ij/).
Statistical analysis
Data are presented as the mean ± standard deviation
of three independent experiments. Statistical analyses were
performed using SPSS 11.5 software (SPSS, Inc., Chicago, IL, USA).
Differences among groups were compared by one-way analysis of
variance. P<0.05 was considered to indicate a statistically
significant difference.
Results
4-PBA alleviates high fructose-induced
lipogenesis through inhibiting ERS in the HepG2 cells
PBA (20 mM) pretreatment inhibited fructose-induced
PERK (p-PERK, Thr980) and eIF2 α (p-eIF2 α, Ser51) phosphorylation
and suppressed ERS-induced lipogenesis. In order to determine the
effect of ERS on lipid metabolism, HepG2 cells were pretreated with
fructose plus 10, 20 mM of 4-PBA. The TG level was induced in high
fructose conditions but ameliorated by 4-PBA intervention
(P<0.01). TG was lower in the 20 mM 4-PBA group than in the 10
mM 4-PBA group, however, the levels were not identified to be
significantly different (P=0.337; Fig.
1A).
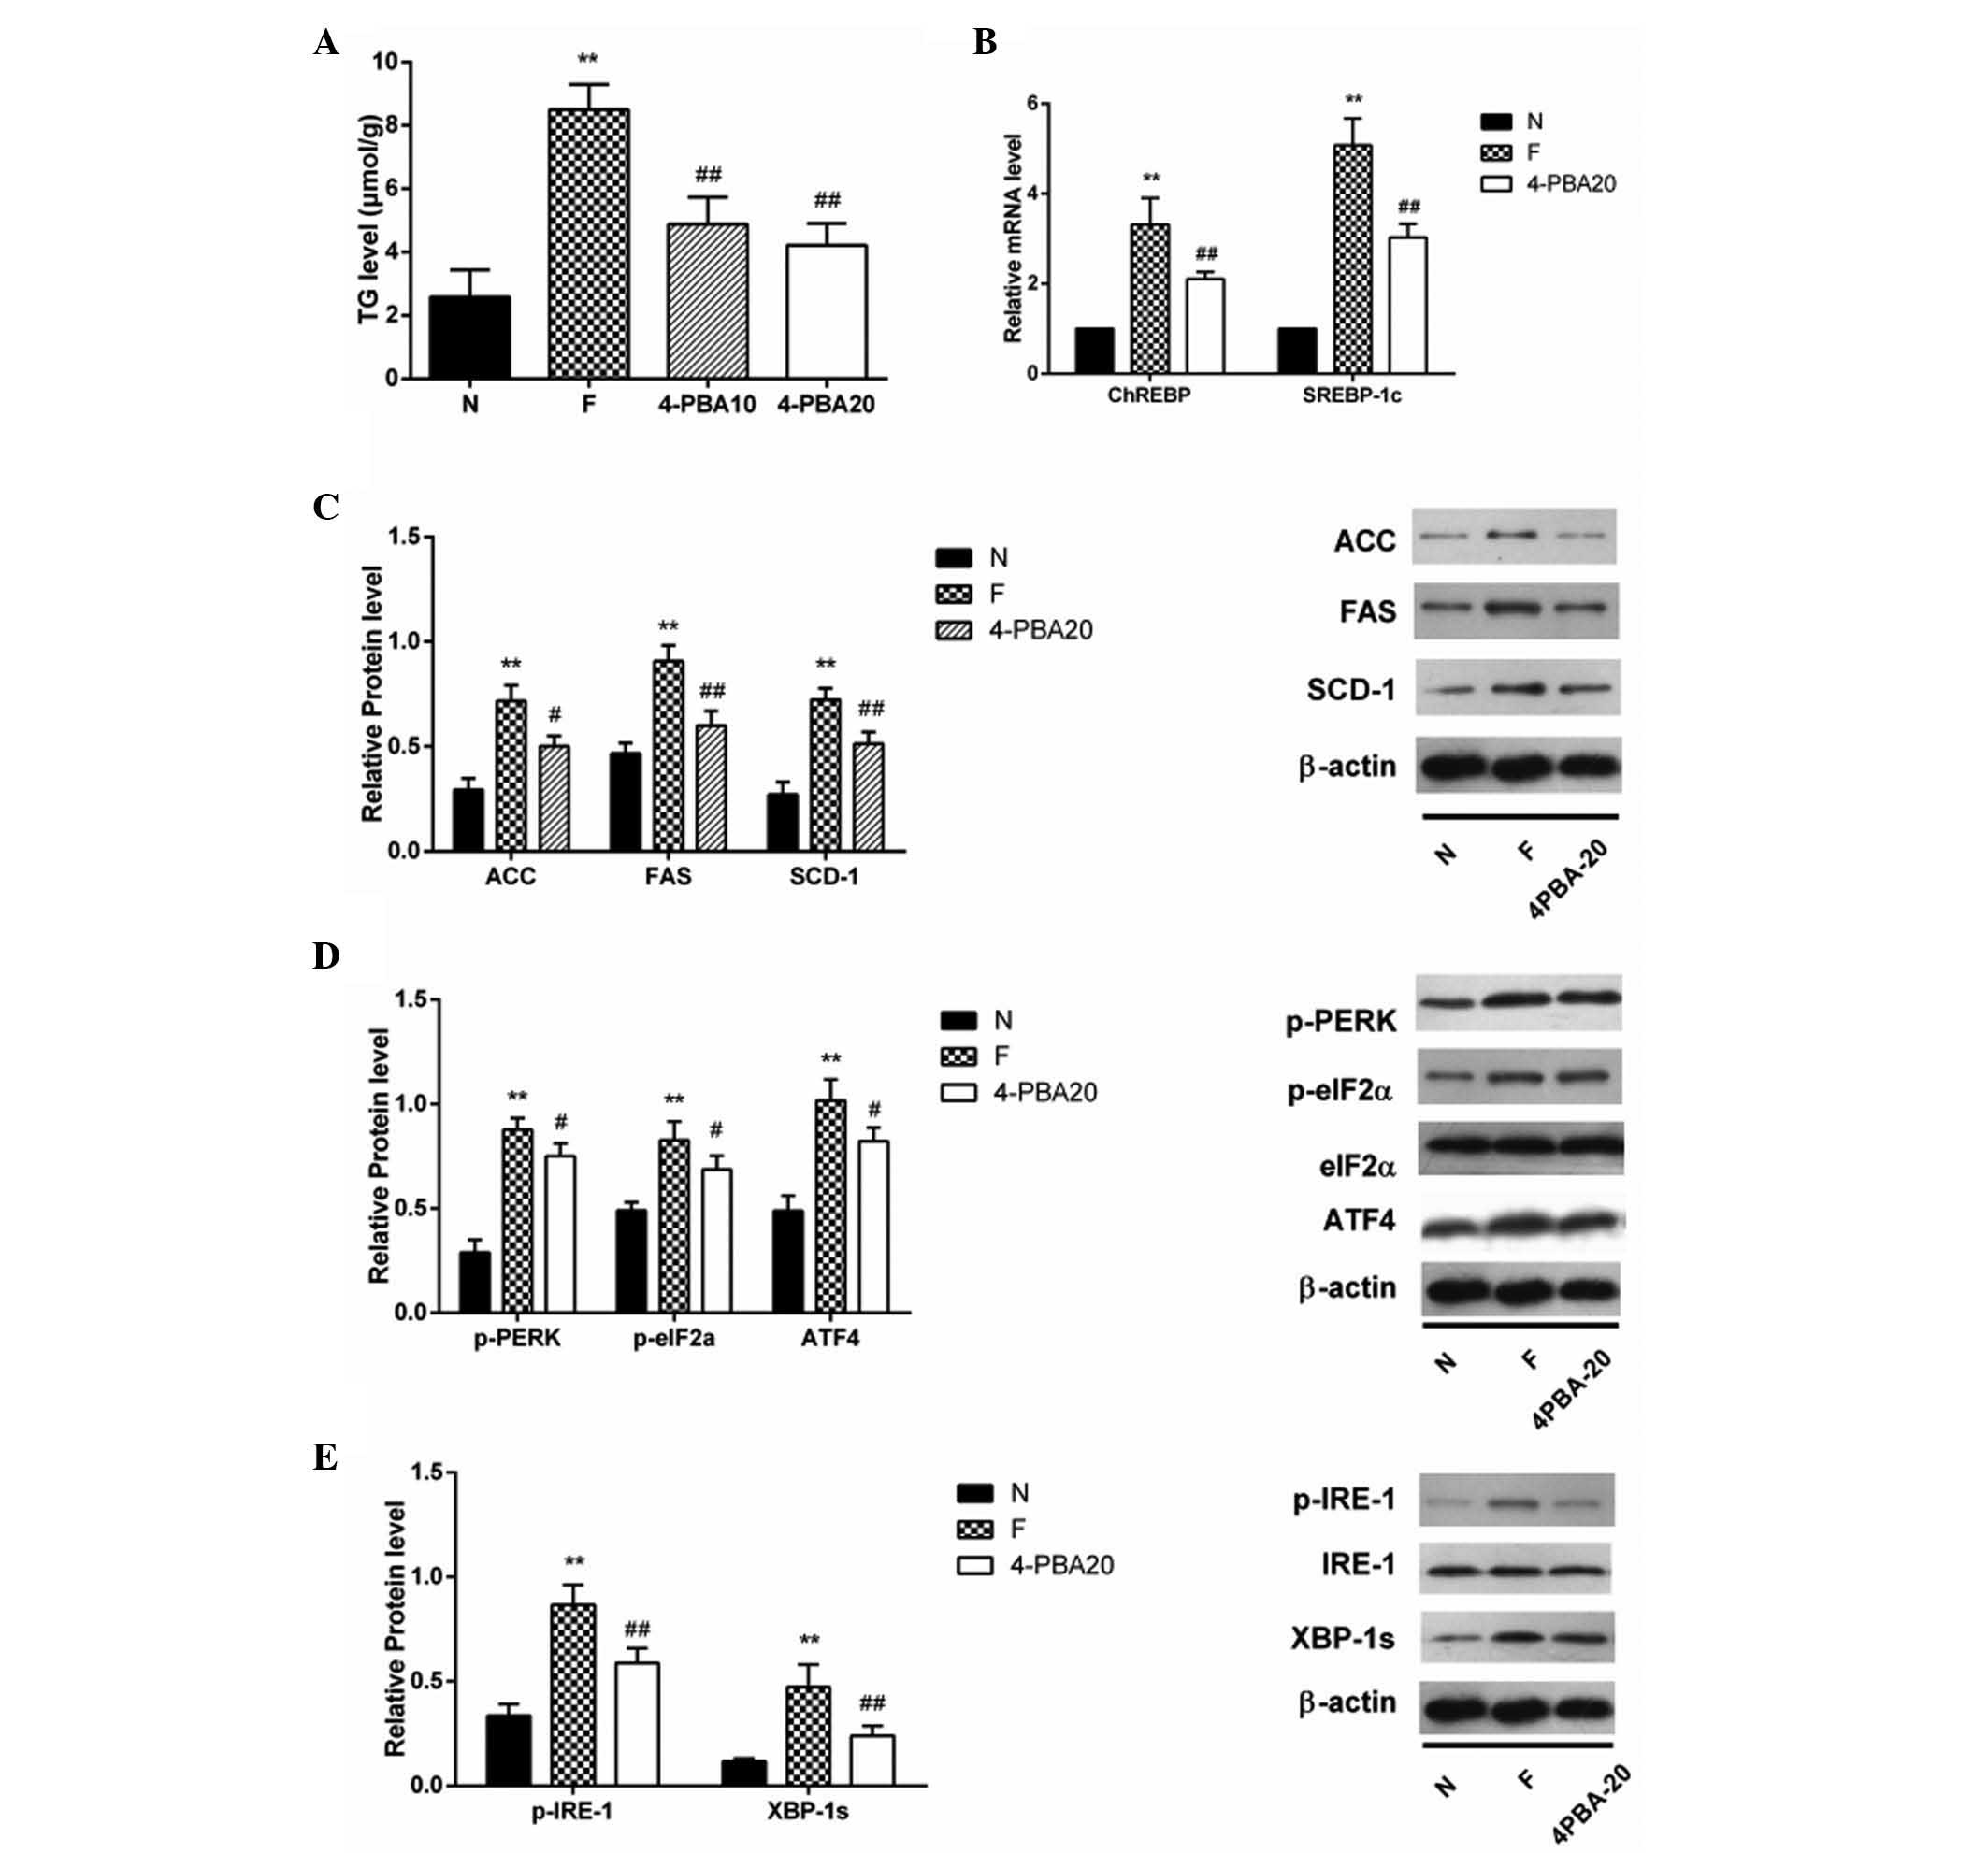 | Figure 1Lipogenesis and ERS were stimulated
in fructose-incubated HepG2 cells and were inhibited by 4-PBA. (A)
TG was detected after HepG2 cells were incubated in normal medium
(N group), high fructose (20 mM) (F group) for 72 h, and high
fructose following pretreatment for 8 h with 10 or 20 mM 4-PBA
(4PBA10 and 4PBA20 groups, respectively). (B) mRNA levels of
SREBP-1c and ChREBP mRNA were tested by polymerase chain reaction.
Fold induction represents relative expression compared with that of
the control group. (C) Protein expression of key enzymes (SCD-1,
FAS, ACC) in the lipogenic pathway in HepG2 cells were tested by
western blotting. β-actin served as the loading control. (D)
Protein expression levels of p-PERK, p-eIF-2α/eIF-2α, ATF4 and CHOP
in HepG2 cells. (E) Protein expression levels of p-IRE-1/IRE-1 and
XBP-1s in HepG2 cells. Results are presented as the mean ± standard
deviation. *P<0.05 and **P<0.01 vs. the
N group, and #P<0.05 and ##P<0.01 vs.
the F group. ERS, endoplasmic reticulum stress; 4-PBA,
4-phenylbutyric acid; TG, triglyceride; SREBP-1c, sterol regulatory
element-binding protein 1; ChREBP, carbohydrate-responsive
element-binding protein; SCD-1, stearoyl-CoA desaturase 1; FAS,
fatty acid synthase; ACC, acetyl-CoA carboxylase; p-PERK, PKR-like
ER kinase; eIF-2α, eukaryotic initiation factor 2α; ATF4,
activating transcription factor-4; CHOP, C/EBP homologous protein;
IRE-1, inositol-requiring enzyme 1; XBP-1s, spliced X-box binding
protein 1; p-, phosphorylated. |
Incubation with 20 mM 4-PBA attenuates lipogenesis
in the liver and protects against high fructose-induced SREBP-1c
and ChREBP gene expression (all P<0.01; Fig. 1B). Accordingly, the protein
contents of SCD-1, FAS and ACC were decreased in cells treated with
4-PBA (all P<0.01; Fig. 1C).
Protein levels of p-PERK, ATF4 and CHOP were increased by fructose
incubation but decreased significantly by 4-PBA intervention (all
P<0.05). The ratios of p-eIF-2α/eIF-2α and p-IRE-1/IRE-1 were
significantly increased by fructose incubation (P<0.05)and they
were markedly decreased after 4-PBA intervention, although without
statistical significance (P>0.05; Fig. 1D and E).
Tunicamycin induces lipogenesis via
stimulation of ERS
Compared with HepG2 cells cultured in normal medium
(N group), HepG2 cells treated with various concentrations of
tunicamycin (0.1, 0.5, 2 or 5 µg/ml; T0.1, T0.5, T2, T5
groups, respectively) showed increased TG levels in a
concentration-dependent manner (Fig.
2A). TG levels in the T2 and T5 groups were significantly
increased compared with that in the N group. As incubation with 5
µg/ml tunicamycin induced apoptosis to a greater extent than
2 µg/ml tunicamycin, with nearly equal effect of inducing
ERS, 2 µg/ml was selected as the tunicamycin intervention
concentration for further studies. RT-qPCR results demonstrated a
significant increase in the abundance of SREBP-1c and ChREBP mRNA
levels in HepG2 cells cultured in tunicamycin-enriched medium
compared with control (P<0.01; Fig.
2B). Key lipogenic enzyme protein expression of critical
enzymes (SCD-1, FAS and ACC) in the lipogenic pathway in HepG2
cells were increased compared with the normal group (all P<0.01;
Fig. 2C). Tunicamycin inhibits
N-linked glycosylation of proteins, leading to high levels of
stressors which were expected to rapidly activate two arms of the
UPR. Consistent with this, p-PERK, ATF4, p-IRE-1/IRE-1, CHOP
protein levels were all significantly increased (all P<0.01
except P=0.05 for p-PERK) (Fig. 2D and
E).
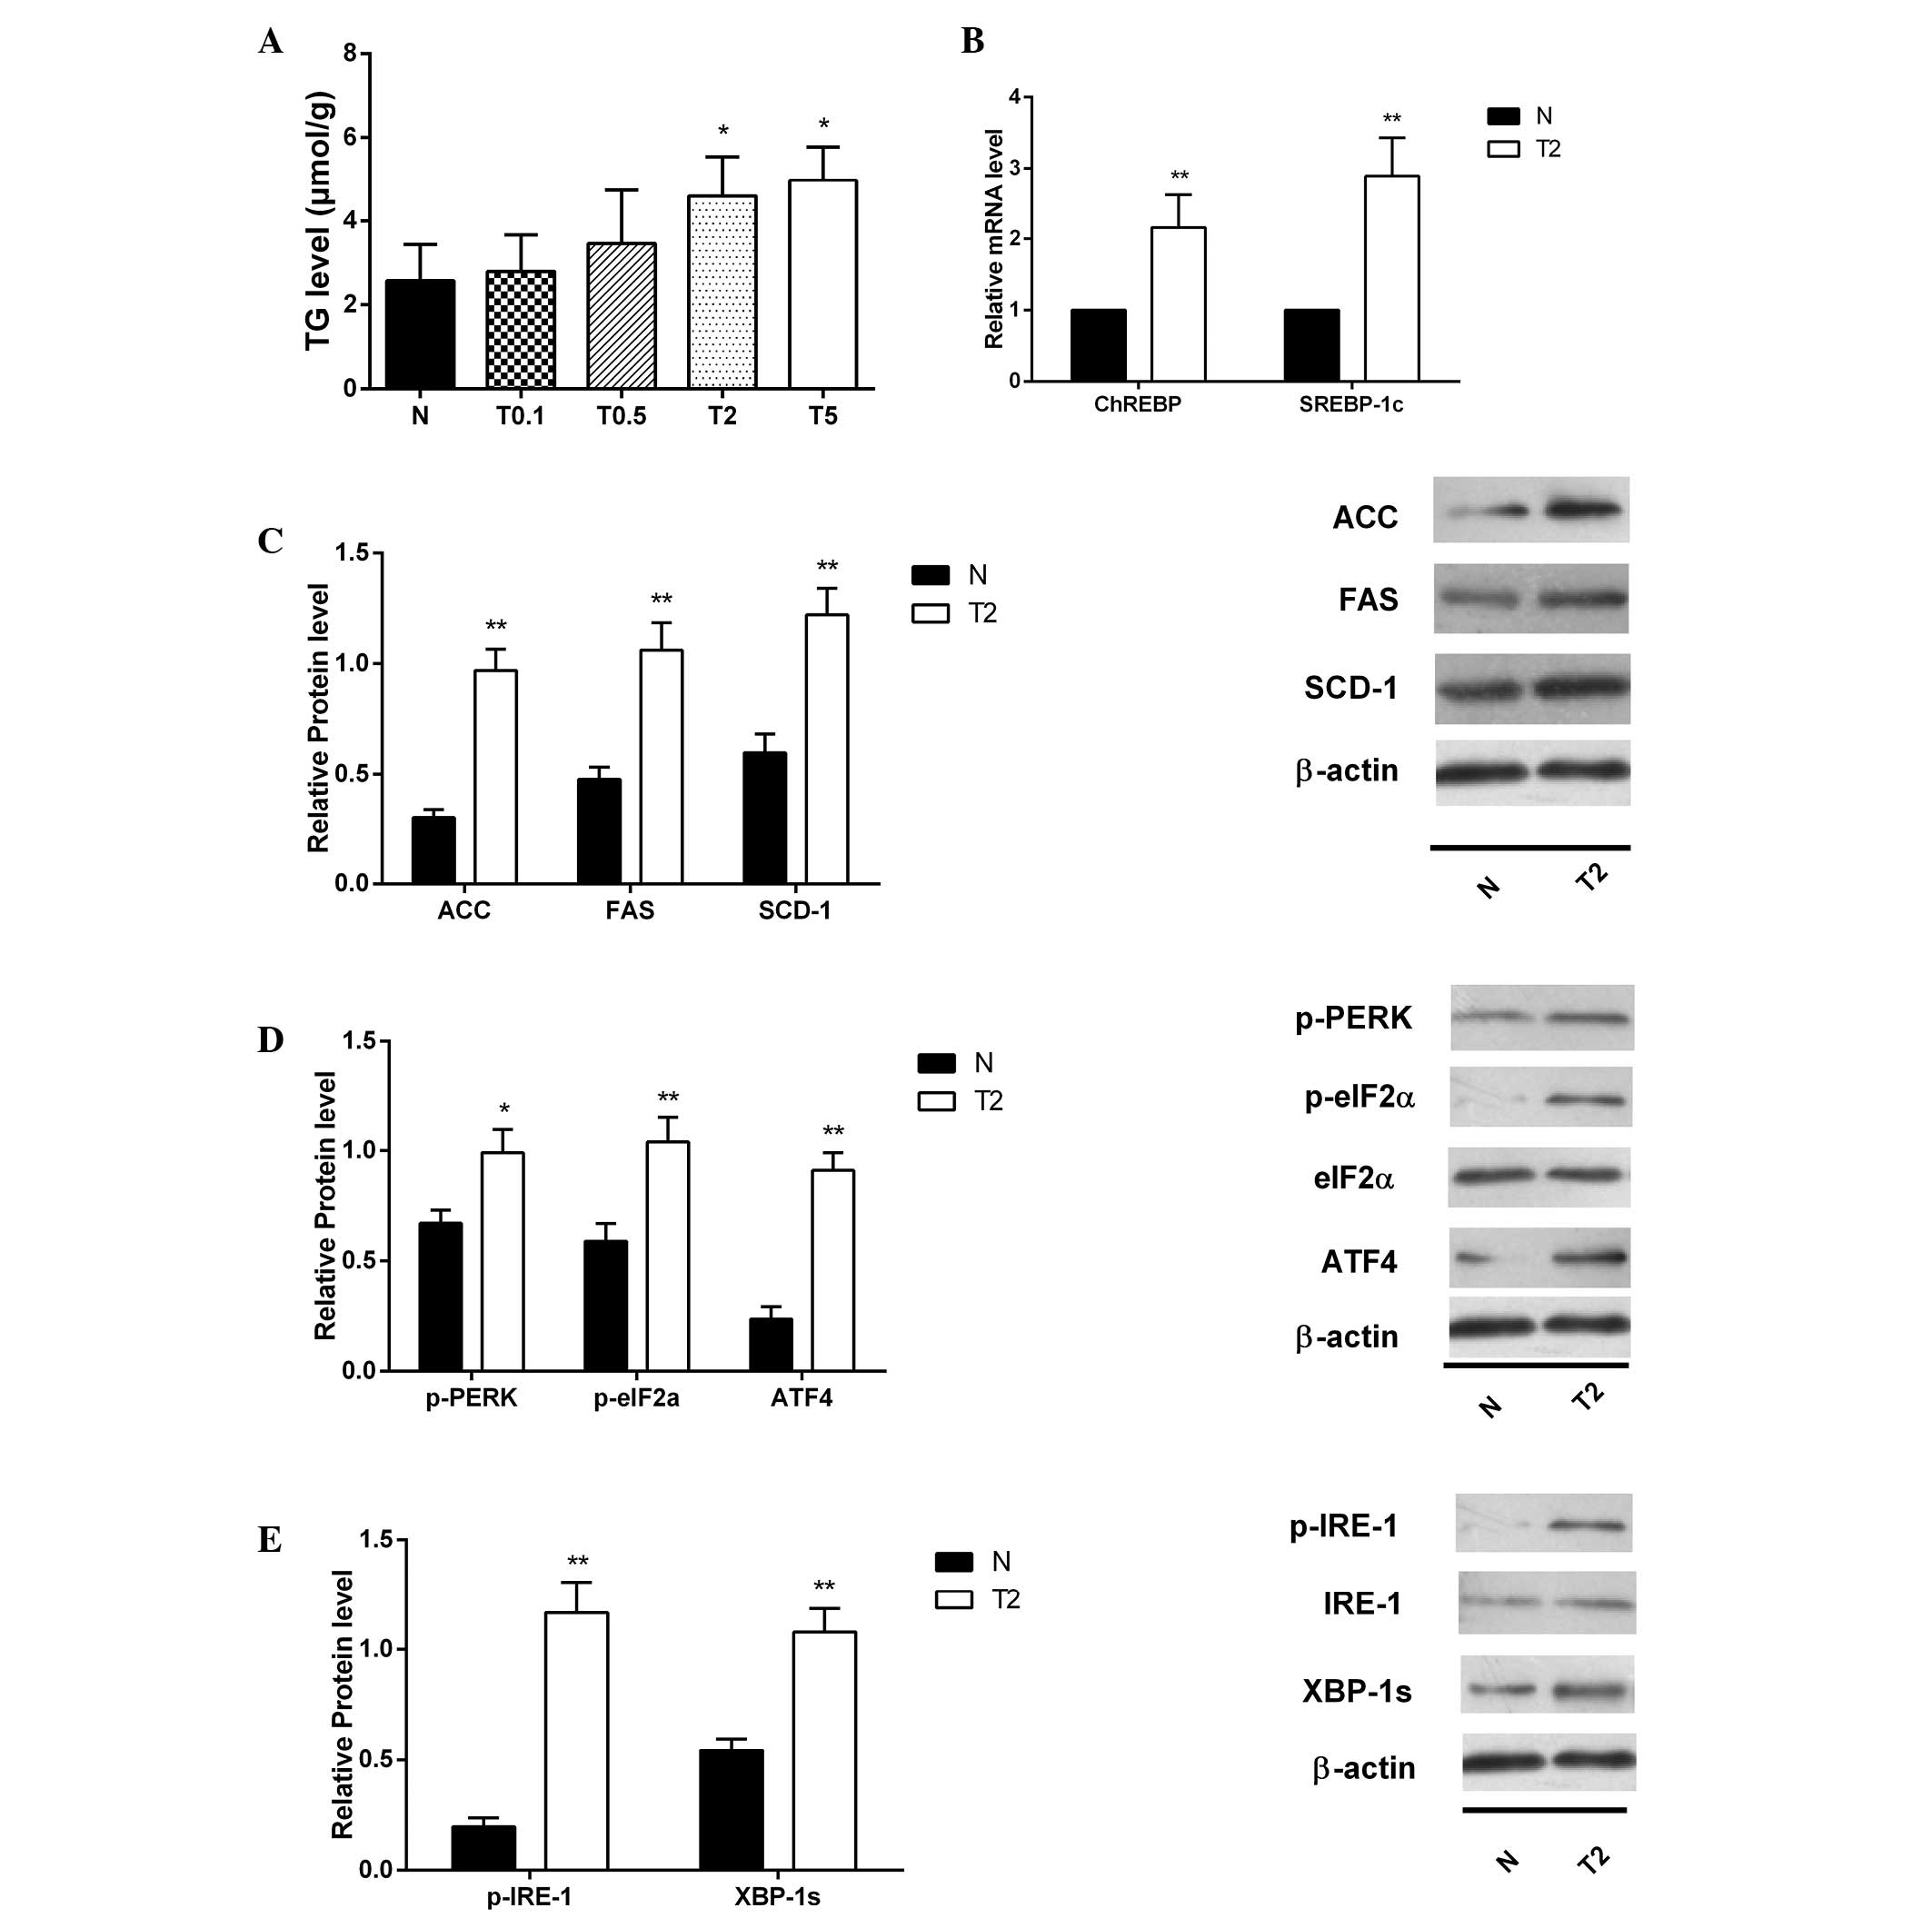 | Figure 2Lipogenesis was stimulated and ERS
occurred in HepG2 cells cultured in different concentrations of
tunicamycin. (A) TG content in the HepG2 cells exposed to different
concentrations (0.1, 0.5, 2 or 5 µg/ml; T0.1, T0.5, T2, T5
groups, respectively) of tunicamycin [mean ± standard deviation
(SD), n=3]. (B) SREBP-1c and ChREBP mRNA levels in HepG2 cells were
detected by polymerase chain reaction (mean ± SD, n=6). (C) Protein
expression of critical enzymes (SCD-1, FAS and ACC) in the
lipogenic pathway in HepG2 cells incubated with tunicamycin (mean ±
SD, n=3). (D) Protein expression of p-PERK, p-eIF-2α and ATF4 were
increased significantly in HepG2 cells incubated with tunicamycin
(mean ± SD, n=3). (E) Protein expression of p-IRE-1/IRE-1 and
XBP-1s were increased significantly in HepG2 cells incubated with
tunicamycin (mean ± SD, n=3). *P<0.05 and
**P<0.01 vs. the N group. ERS, endoplasmic reticulum
stress; TG, triglyceride; SREBP-1c, sterol regulatory
element-binding protein 1; ChREBP, carbohydrate-responsive
element-binding protein; SCD-1, stearoyl-CoA desaturase 1; FAS,
fatty acid synthase; ACC, acetyl-CoA carboxylase; p-PERK, PKR-like
ER kinase; eIF-2α, eukaryotic initiation factor 2α; ATF4,
activating transcription factor-4; CHOP, C/EBP homologous protein;
IRE-1, inositol-requiring enzyme 1; XBP-1s, spliced X-box binding
protein 1; p-, phosphorylated; N, normal medium group. |
Silencing of ATF4 expression prevents
high fructose-induced lipid deposition in HepG2 cells by inhibiting
lipogenesis
ATF4 protein was downregulated after transfection
with an siRNA targeting ATF4 (F+ATF4 siRNA group) compared with
cells treated with fructose (F group) or cells treated with
transfection reagents and fructose (F+NC group) (P<0.01;
Fig. 3A). The CHOP protein content
was increased in the F group and significantly decreased in the
F+ATF4 siRNA group (P<0.01; Fig.
3B). Lipid droplets (red-stained granules) were decreased in
F+ATF4 siRNA group cells as shown by Oil red O staining (Fig. 3C). Accordingly, TG accumulation was
reduced in the F+ATF4 siRNA group compared with the F group
(P<0.05; Fig. 3D).
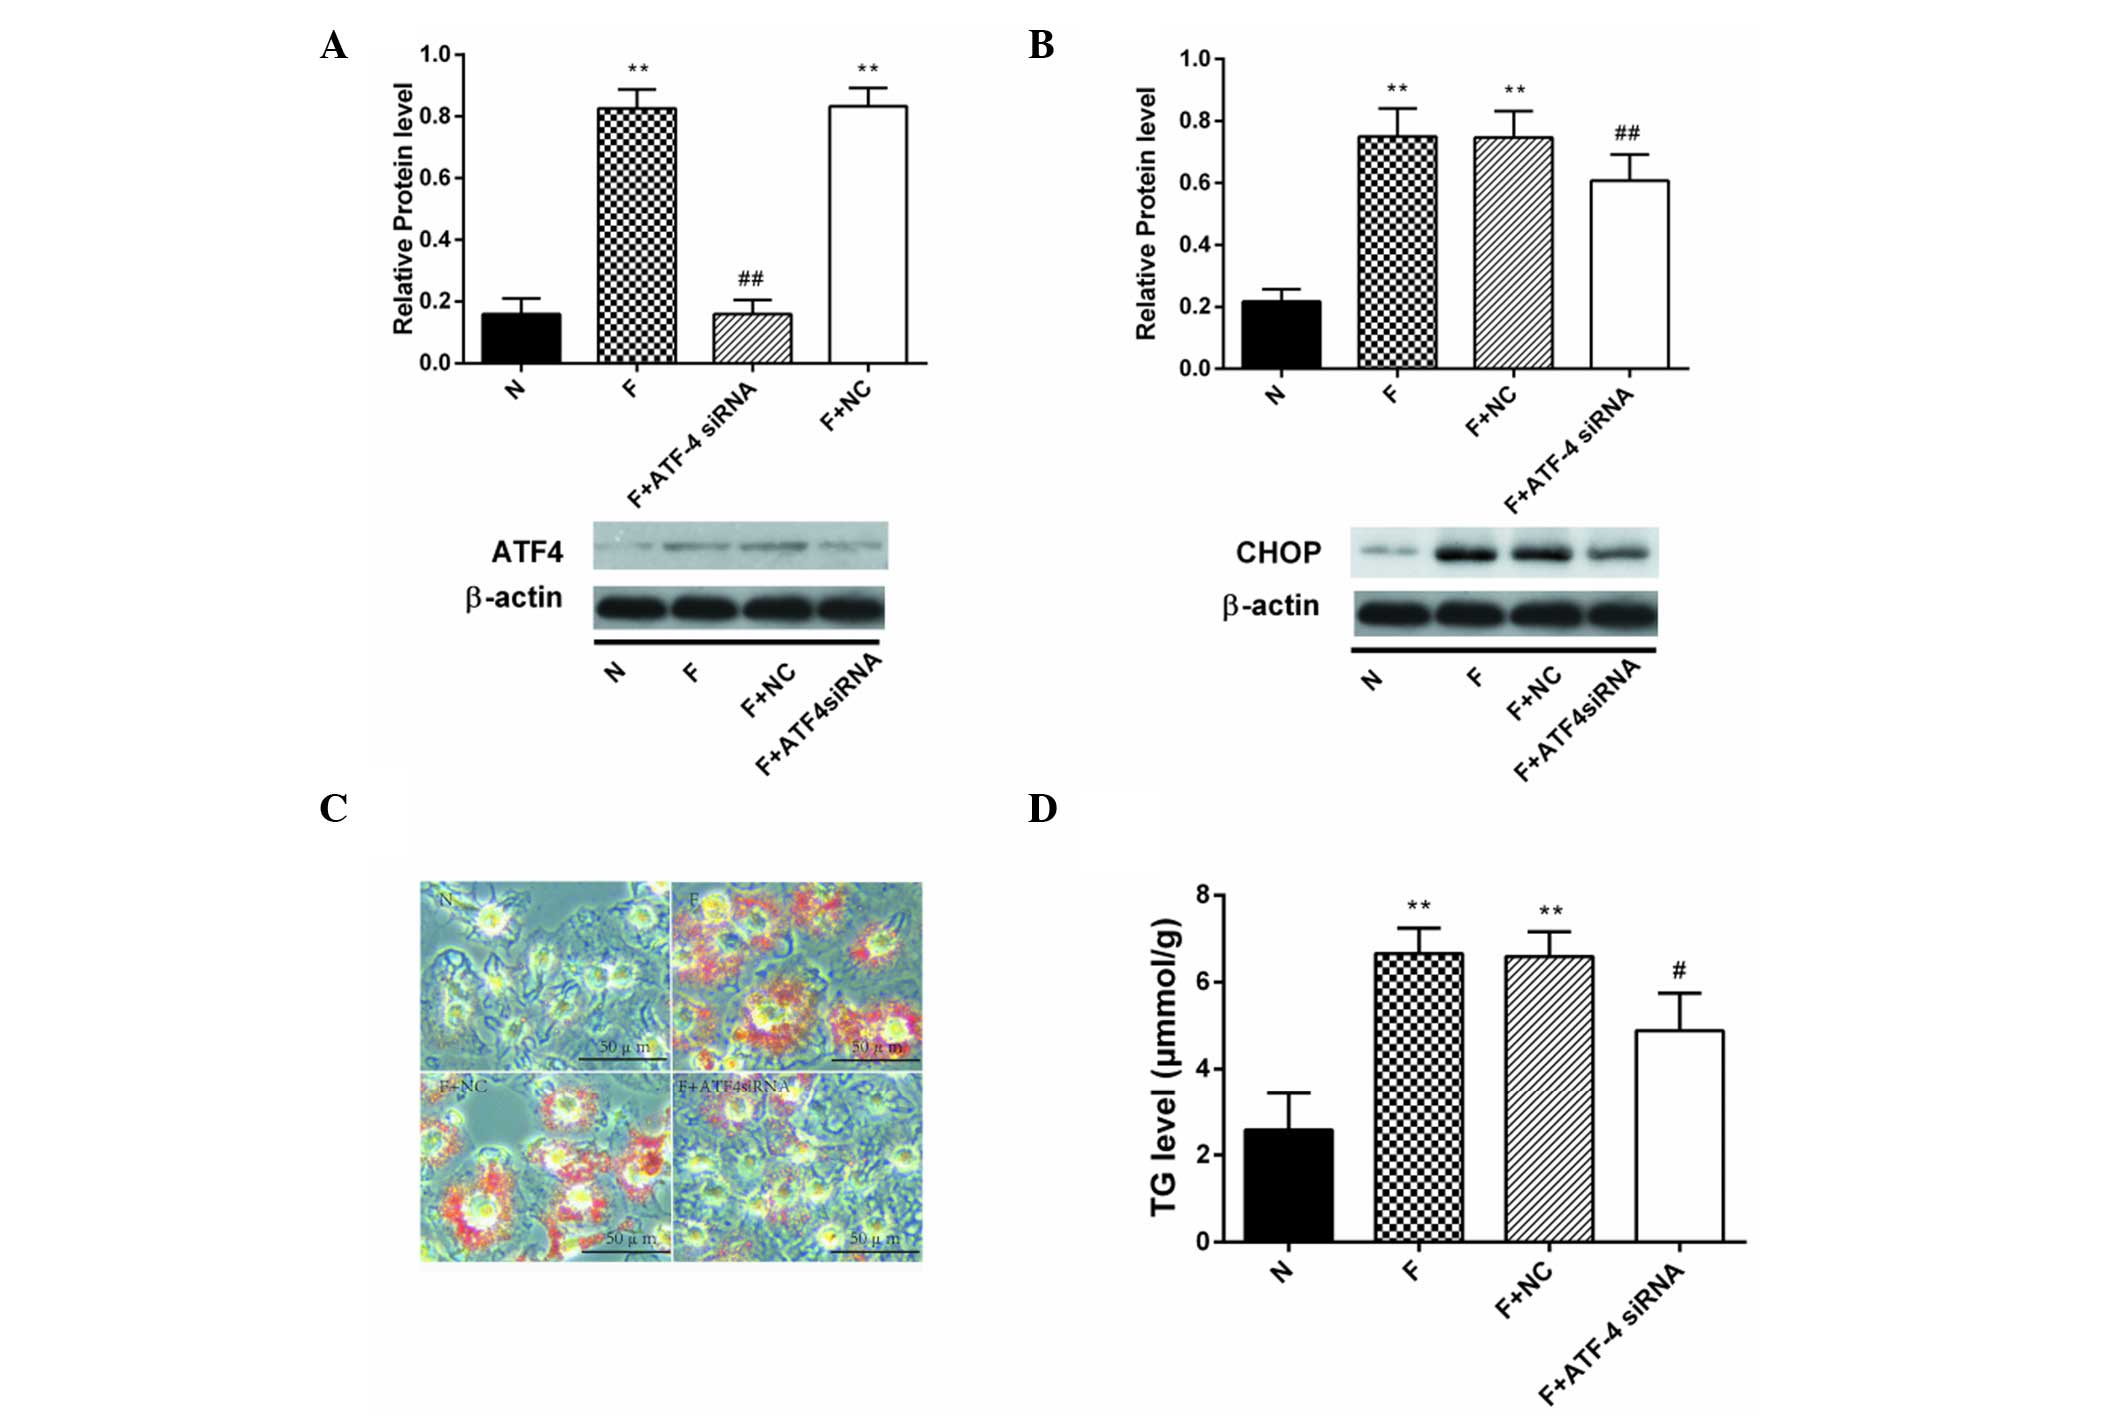 | Figure 3Lipid accumulation was attenuated in
fructose-incubated ATF4-deficient HepG2 cells. Protein expression
level of (A) ATF4 and (B) CHOP in HepG2 cells after 8 h of
transfection with ATF4 siRNA (mean ± SD, n=3). (C) Lipid droplets
were decreased in ATF4-deficient HepG2 cells cultured with 20 mM
fructose as shown by Oil red O staining. (D) TG content was
decreased in ATF4-deficient HepG2 cells cultured with 20 mM
fructose. **P<0.01, vs. the N group,
#P<0.05 and ##P<0.01 vs. the F group.
ATF4, activating transcription factor-4; CHOP, C/EBP homologous
protein; siRNA, small interfering RNA; TG, triglyceride; N, normal
medium group; F, fructose group; NC, fructose + transfection
reagents group; siRNA, small interfering RNA. |
Upstream lipogenic transcriptional factors including
ChREBP (P<0.05) and SREBP-1c mRNA (P<0.01) were significantly
downregulated in ATF4-deficient HepG2 cells (Fig. 4A). Downstream protein levels of key
lipogenic enzymes ACC, FAS and SCD-1 (P<0.05, P<0.01 and
P<0.01, respectively) were significantly downregulated in
ATF4-deficient HepG2 cells (Fig.
4B).
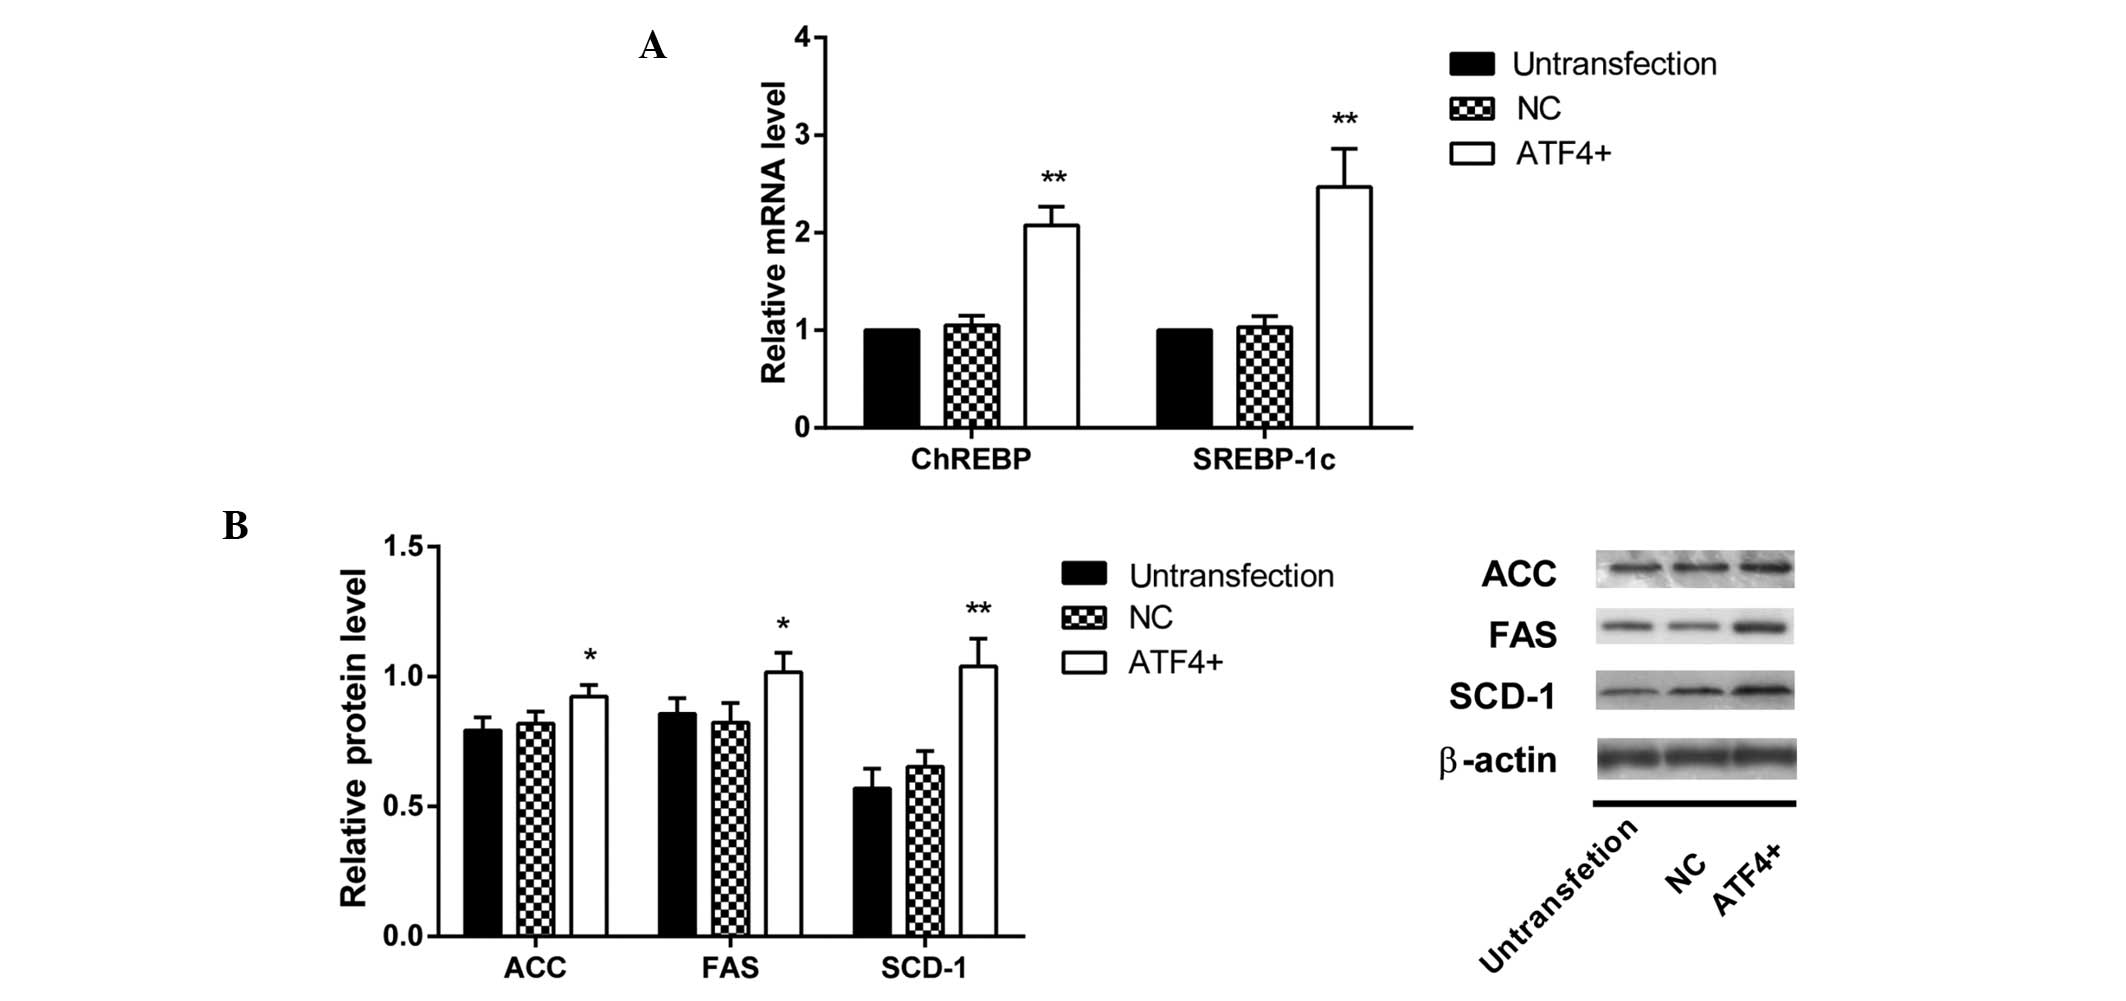
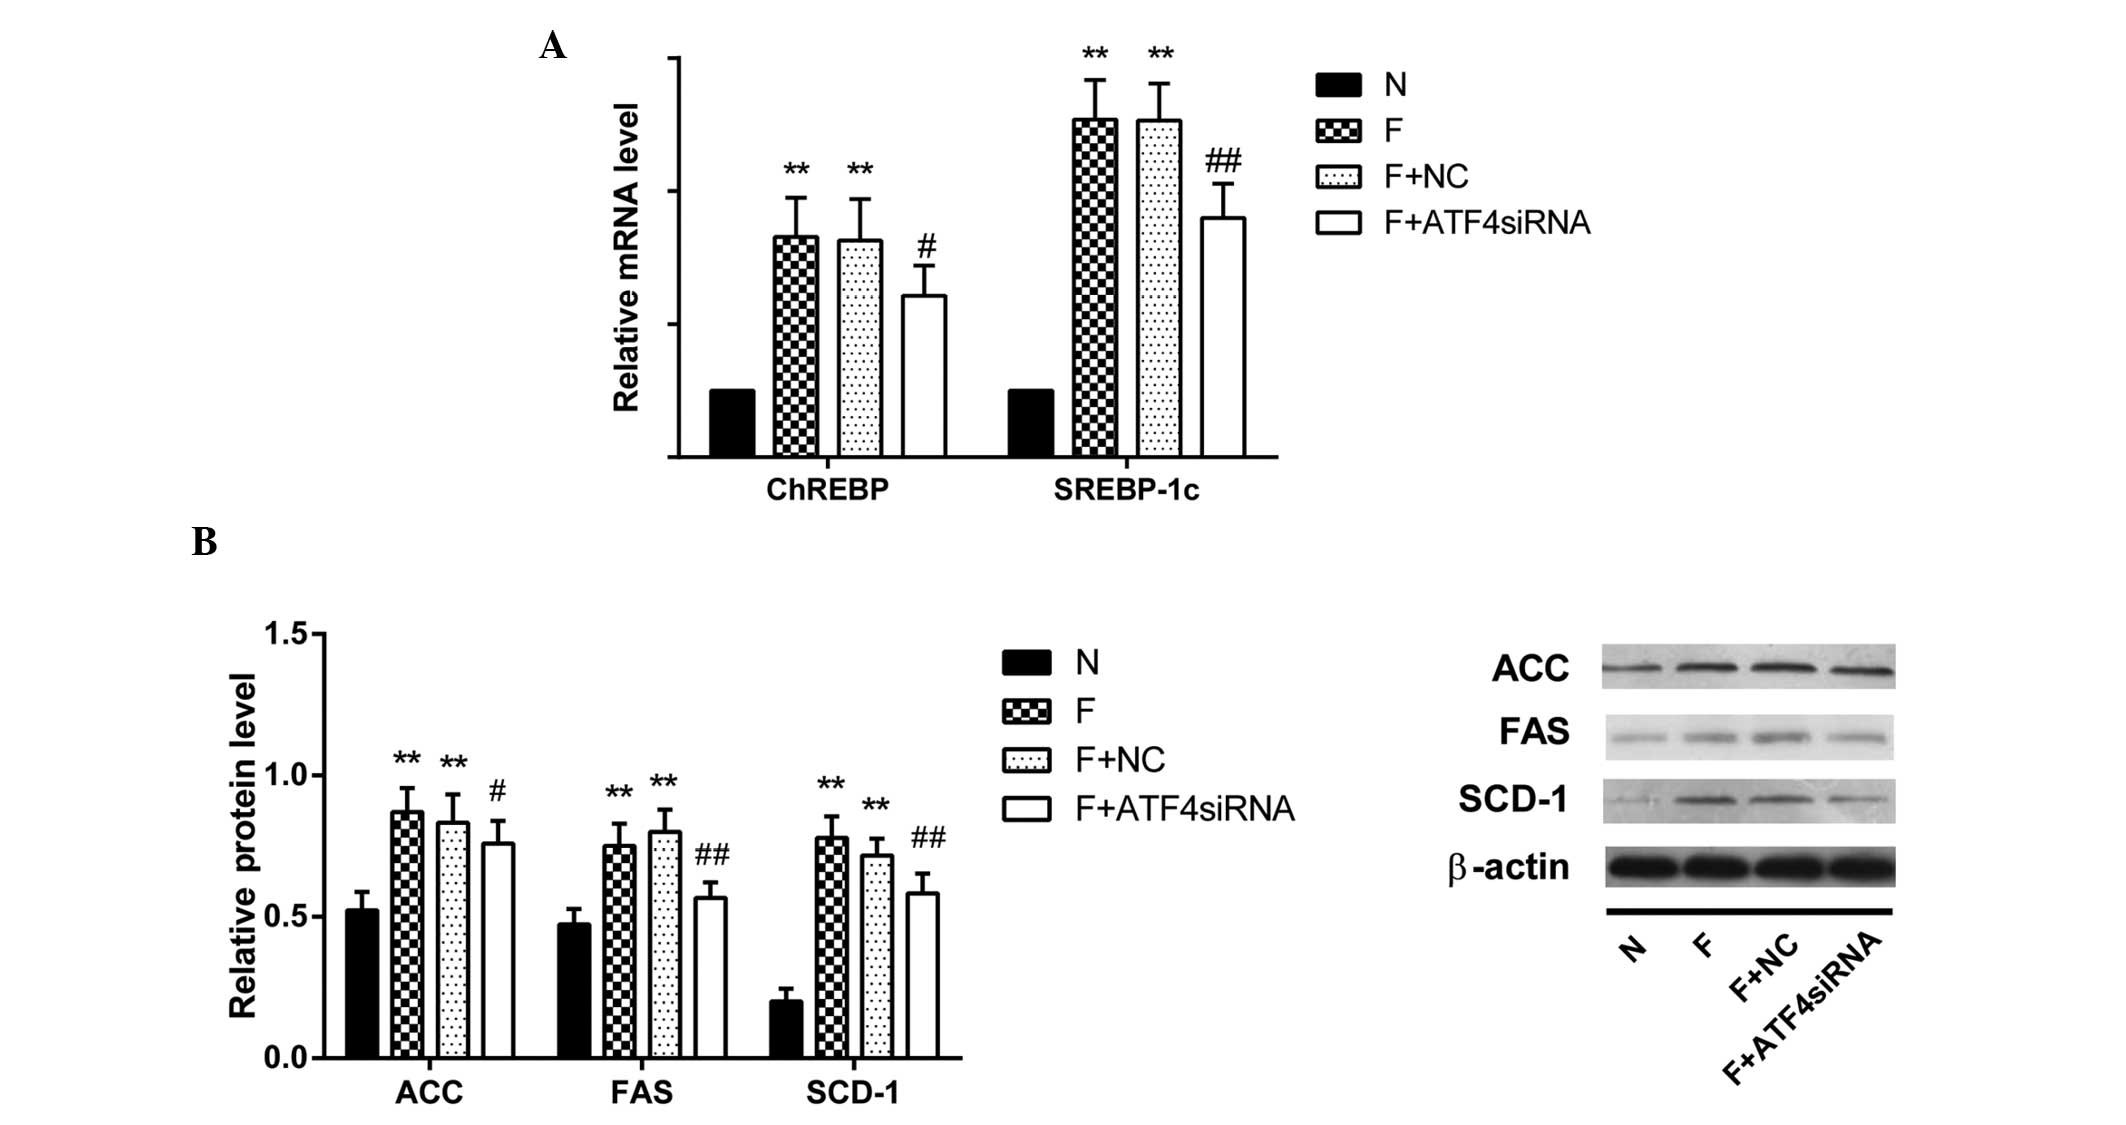 | Figure 4Expression levels of lipogenic
markers were downregulated in fructose-incubated ATF4-deficient
HepG2 cells. (A) Levels of SREBP-1c, ChREBP mRNA were tested by
polymerase chain reaction [mean ± standard deviation (SD), n=6].
(B) Protein expression levels of key enzymes in the lipogenic
pathway (SCD-1, FAS and ACC) in ATF4-deficient HepG2 cells were
determined by western blotting and densitometry. β-actin expression
served as a loading control. Fold induction represents relative
expression level compared with that of the N group, (mean ± SD,
n=3). **P<0.01 vs. the N group; #P<0.05
and ##P<0.01 vs. the F group. SREBP-1c, sterol
regulatory element-binding protein 1; ChREBP,
carbohydrate-responsive element-binding protein; SCD-1,
stearoyl-CoA desaturase 1; FAS, fatty acid synthase; ACC,
acetyl-CoA carboxylase; ATF4, activating transcription factor-4;
siRNA, small interfering RNA; N, normal medium group; F, fructose
group; F+NC, fructose + transfection reagents group. |
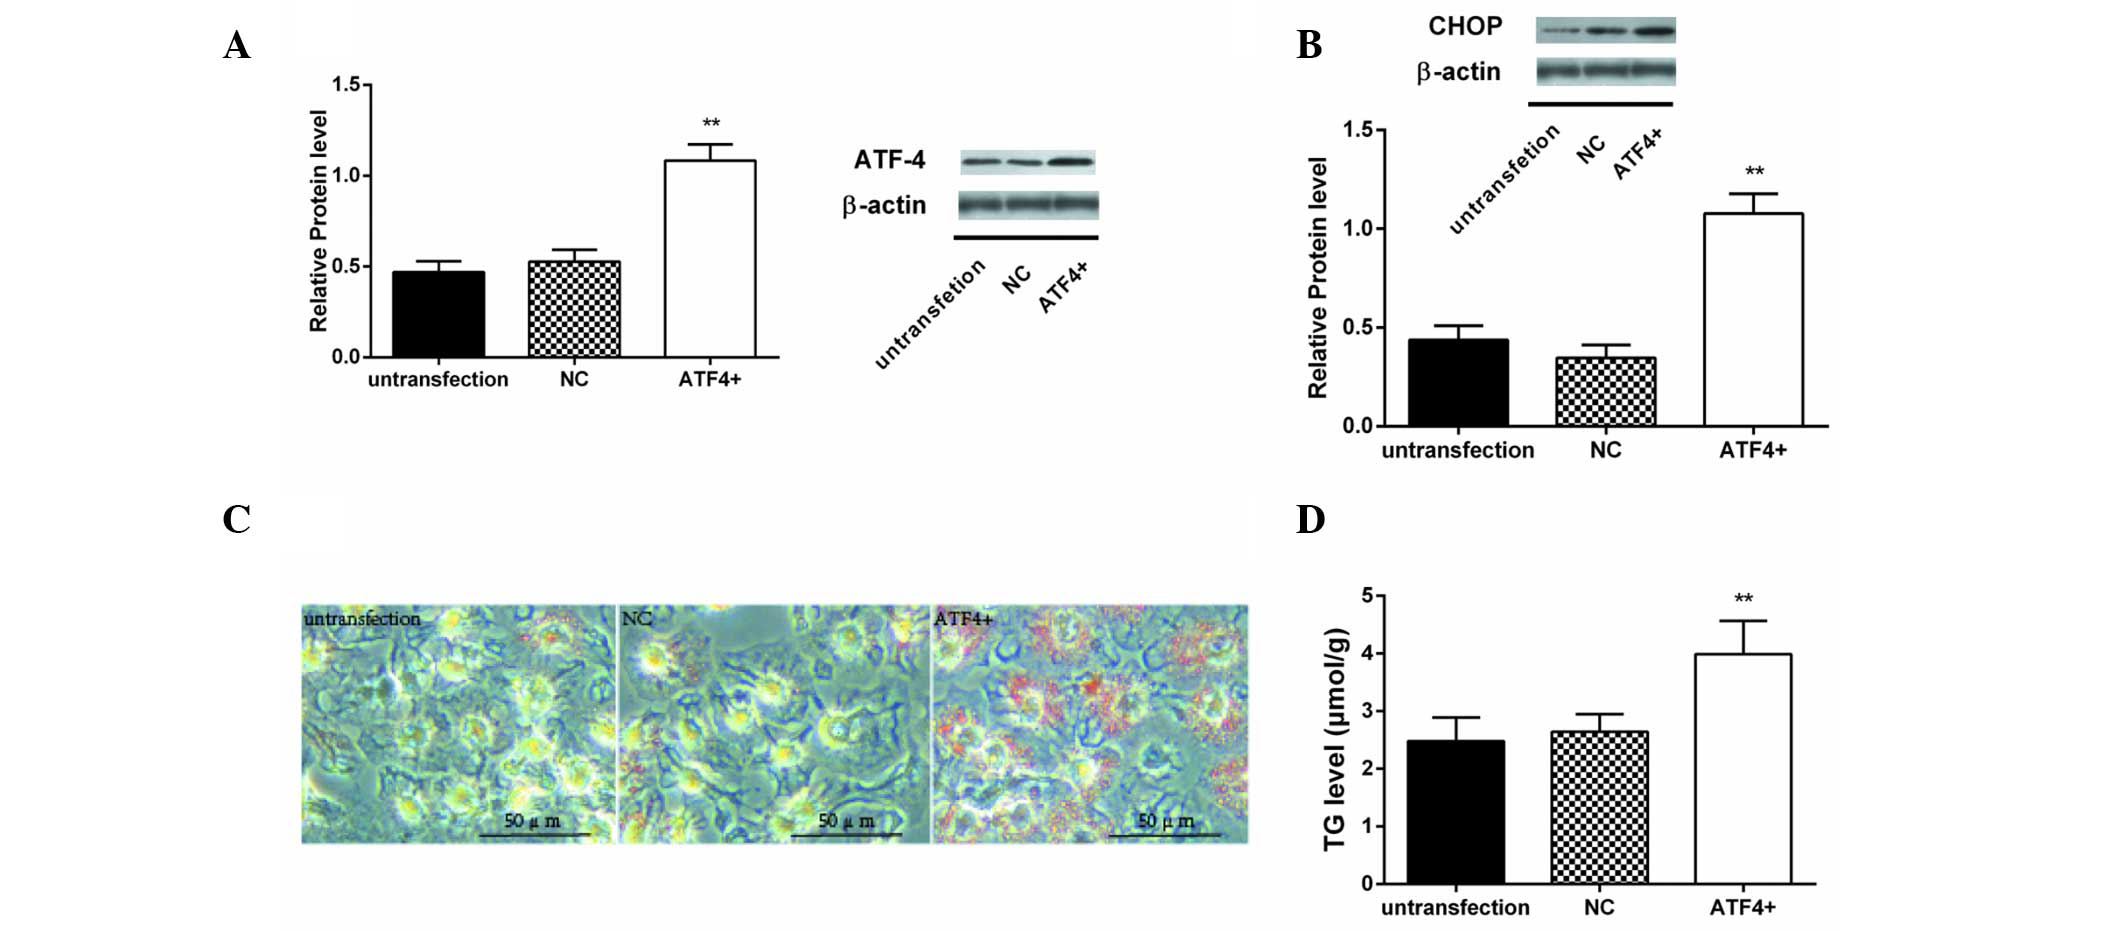
Effect of ATF4 overexpression on lipid
synthesis in HepG2 cells
An ATF4 plasmid and empty vector as negative control
were respectively transfected into HepG2 cells. After 8 h of
transfection, ATF4 protein levels were significantly increased
(P<0.01; Fig. 5A). The protein
content of CHOP was shown to be significantly increased in HepG2
cells after transfection with the ATF4 plasmid compared with the
untransfected cells (Fig. 5B).
Lipid droplets (red-stained granule) were increased in HepG2 cells
transfected with ATF4 plasmid (Fig.
5C). In addition, TG content was higher in HepG2 cells
transfected with ATF4 plasmid than cells grown in normal medium and
cells transfected with empty vector (P<0.01; Fig. 5D).
RT-qPCR results demonstrated a significant increase
in the abundance of SREBP-1c mRNA levels in HepG2 cells transfected
with the ATF4 plasmid (all P<0.05); whereas there was no change
in ChREBP mRNA levels (Fig. 6A).
Protein contents of ACC, FAS and SCD-1 were significantly increased
compared with that in the untransfected cells (P<0.05, P<0.05
and P<0.01 respectively; Fig.
6B).
Effects of ATF4 silencing and
overexpression on insulin sensitivity in HepG2 cells
The decreased sensitivity of HepG2 cells to insulin
following stimulation with fructose was improved by ATF4 silencing,
as indicated by increased p-Akt/t-AKt (P<0.01) and p-GSK/t-GSK
(P<0.05) ratios following insulin stimulation, as compared with
the F group (Fig. 7A). Conversely,
ATF4 overexpression decreased the ratios of p-Akt/t-AKt (P<0.05)
and p-GSK/t-GSK (P<0.01) following insulin stimulation, as
compared with the F group (Fig.
7B).
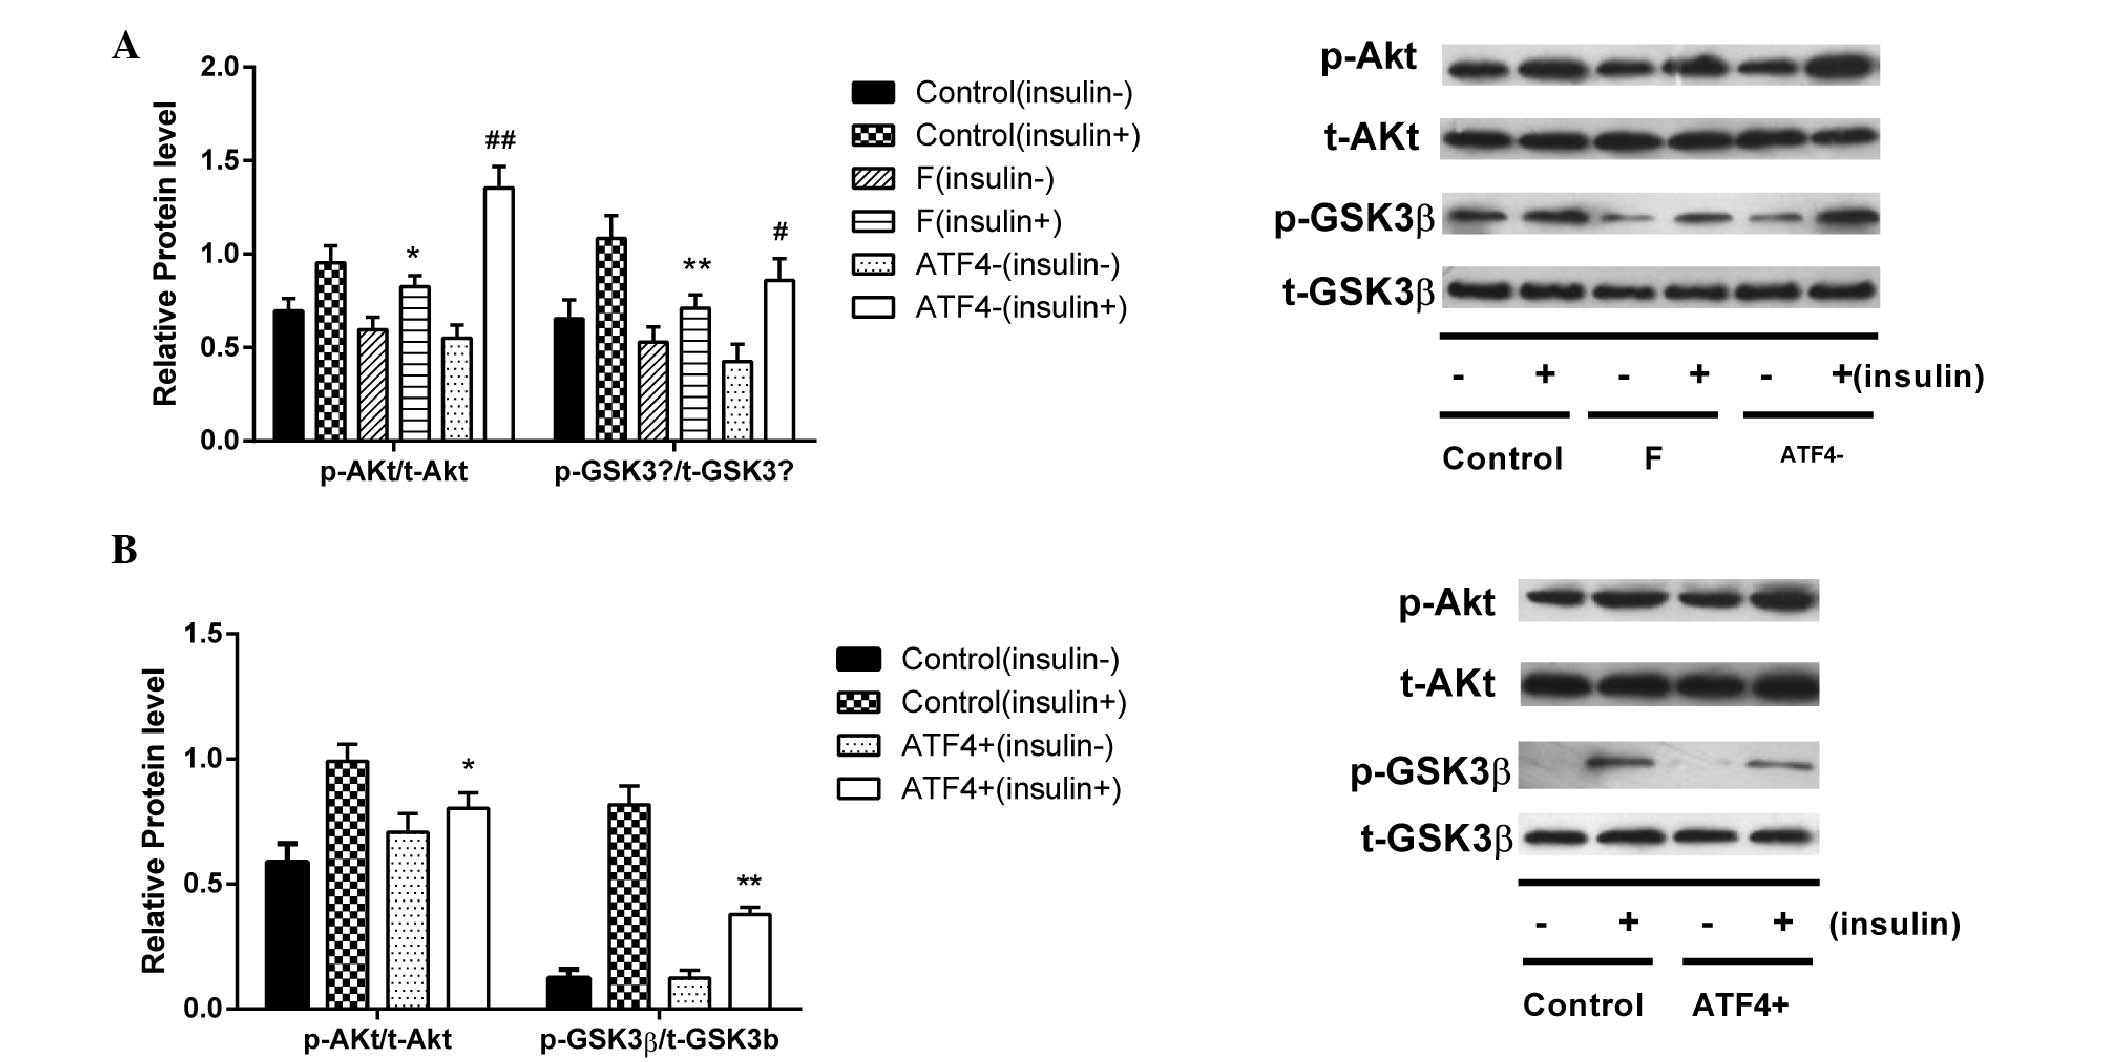 | Figure 7Effects of ATF4 silencing and
overexpression on the insulin sensitivity of HepG2 cells. HepG2
cells transfected with ATF4 vector or ATF4 small interfering
(si)RNA were incubated in the presence or absence of 100 nmol/l
insulin for 30 min and the protein expression levels of p-Akt,
t-Akt, p-GSKβ and t-GSKβ were determined by western blotting. (A)
Protein content ratios of p-Akt/t-Akt and p-GSKβ/t-GSKβ were
increased following insulin stimulation of HepG2 cells transfected
with ATF4 siRNA, indicating an increased insulin sensitivity. (B)
Protein content ratios of p-Akt/t-Akt and p-GSKβ/t-GSKβ were
decreased after insulin stimulation in ATF4-overexpressing HepG2
cells, indicating a decreased insulin sensitivity. Data are
presented as the mean ± standard deviation (n=3).
*P<0.05, **P<0.01 vs. the control
(insulin +) group. #P<0.05, ##P<0.01
vs. the F (insulin +) group. GSKβ, glycogen synthase kinase β; p-,
phosphorylated; t-Akt, total-Akt; F, fructose group. |
Discussion
Increased hepatic lipogenesis is one of the
mechanisms underlying the development of NAFLD. Recent studies
indicate that ERS is involved in the development of NAFLD and is
associated with lipogeneis (21,22).
It has been shown that ERS occurs in the fatty livers of
genetically obese, chronic high-fat-fed or high-fructose-fed
rodents (6,11–12).
Resolved hepatic ERS by 4-PBA or tauroursodeoxycholic acid can
attenuate hepatosteatosis in ob/ob mice or high-fructose-fed mice
(6,12). Nevertheless, the direct impact of
ERS inhibition and induction on lipogenesis has not been
investigated in hepatocytes in vitro. Therefore, the present
study investigated the impact of 4-PBA on lipogenesis in HepG2
cells cultured in a high concentration of fructose, which
stimulates lipogenisis in the liver (23,24).
The effect of ERS induction by tunicamycin on hepatic lipogenesis
was then determined.
This study showed that fructose increased the mRNA
expression of SREBP-1c and ChREBP, which are upstream transcription
factors of hepatic lipogenesis (25,26).
Downstream enzymes including ACC, FAS and SCD-1 were subsequently
activated. ERS was observed in fructose-cultured HepG2 cells as
reflected by the activation of the PERK-eIF2α-ATF4 and IRE-1-XBP1
pathways. The inhibition of ERS by 4-PBA decreased the gene
expression of SREBP-1c and ChREBP, and the protein expression of
ACC, FAS and SCD-1. These results are consistent with our previous
animal study, which showed that 4-PBA can inhibit de novo
lipogenesis in high-fructose-fed mice (12). To further investigate the impact of
ERS on hepatic lipogenesis, ERS was induced by tunicamycin in HepG2
cells. Accompanied by the occurrence of ERS, the lipogenesis
pathway was shown to be activated. Lipogenesis was stimulated by
ERS inducers with subsequent TG accumulation. These findings
demonstrated the regulatory role of ERS in lipogenesis in liver
cells.
Since it is indicated that ERS is involved in
lipogenesis in the liver, several previous studies have
investigated the association between ERS and lipogenesis. Studies
demonstrated that the UPR exhibits a regulatory effect on lipid
synthesis in the liver (27,28).
UPR is a self-protective mechanism in the ER to cope with ERS and
is regarded as a marker of ERS. A previous study demonstrated that
IRE-1-XBP1 and PERK-eIF2α-ATF4 pathways, two UPR pathways, are
involved in regulating lipogenesis (5). The IRE1-XBP1 pathway has been linked
to adipogenesis in mouse embryonic fibroblasts and 3T3-L1 cells
(29,30). Based on an XBP1-deficient mouse
model study, XBP-1 has been established as a novel transcription
factor governing hepatic lipogenesis (31). It has also been demonstrated that
targeted deletion of PERK in mammary epithelium reduced free fatty
acids in mouse milk and led to growth retardation in suckling pups
(32). PERK deletion resulted in
reduced expression of several lipogenic genes, including SREBP1
(33). In addition,
dephosphorylation of eIF-2α (translation initiation factor 2 α)
enhances glucose tolerance and attenuates hepatosteatosis in mice
(13). The present study focused
on the impact of ATF4 on lipogenesis in HepG2 cells.
ATF4 is expressed in a wide variety of tissues and
is stimulated in response to various cellular stresses, such as
amino acid deprivation and integrated stress stimulation (34,35).
ATF4 is also the downstream transcriptional factor involved in the
PERK-eIF2α-ATF4 pathway in UPR. One study showed that ATF4 null
mice have increased energy expenditure and are resistant to
diet-induced obesity (16).
Further studies indicated that mice with ATF4 protein deficiency
are resistant to liver steatosis induced by a high-fat-diet, high
carbohydrate diet and high-fructose diet (16,18,19).
In the present study, ATF4 deficiency attenuated the TG
accumulation induced by fructose-incubated liver cells. Conversely,
ATF4 overexpression induced TG accumulation in HepG2 cells,
indicating the impact of ATF4 on lipid metabolism in the liver.
Previous studies indicated that ATF4 is involved in
the regulation of numerous aspects of lipid metabolism.
ATF4-deficient mice exhibited increased expression of genes
associated with lipolysis and β-oxidation in white adipose tissue,
including hormone sensitive lipase, carnitine palmitoyltransferase
1, and medium-chain acyl-CoA dehydrogenase (14). In addition to lipid oxidation and
lipolysis, the impact of ATF4 deficiency on de novo
lipogenesis in the liver was investigated and it was demonstrated
that the gene and protein expression of SREBP-1c, ACC and FAS were
reduced in livers of high-fructose-fed ATF4−/− mice
(19). In the present study, the
results were consistent with these findings. In HepG2 cells with
silenced ATF4 expression, when cultured with a high concentration
of fructose, the upstream lipogenic transcription factor SREBP-1c
was downregulated compared with that in control cells. In addition,
in the present study, it was demonstrated that ChREBP, another
upstream lipogenic transcription factor, was also downregulated in
fructose-incubated HepG2 cells accompanied by reduced protein
expression of downstream lipogenic enzymes.
The regulatory effect of ATF4 on lipogenesis in
HepG2 cells was further demonstrated by the findings in
ATF4-overexpressed HepG2 cells. ATF4 overexpression stimulated the
gene expression of SREBP-1c and ChREBP. ATF4 overexpression
increased protein expression of ACC, FAS and SCD-1. Different from
these findings, however, a previous study showed that in
ATF4−/− mice fed on a high-carbohydrate diet, ATF4
deficiency reduced the expression of SCD-1 but did not have an
effect on the expression of SREBP-1 and ChREBP (18). These contrasting observations
indicate that ATF4 may exhibit different physiological roles in
lipid metabolism in the context of different nutrient compositions.
Further investigation is required to clarify how ATF4 regulates the
expression of SREBP-1c and ChREBP.
In addition to the impact of ATF4 on lipogenesis,
the influence of ATF4 on insulin action in liver cells was
demonstrated. It was shown that ATF4 overexpression induces insulin
resistance in HepG2 cells, while ATF4 deficiency can protect
insulin sensitivity in fructose-incubated HepG2 cells. The
mechanism by which ATF4 deficiency increases insulin sensitivity
may be indirect and result from the inhibition of lipogenesis and
corresponding decreases in TG accumulation. Whether ATF4 has a
direct regulatory effect on the insulin signaling pathway requires
further investigation.
In conclusion, the present study demonstrated that
inhibition of ERS protects HepG2 cells against fructose-induced TG
accumulation, while induction of ERS stimulates hepatic
lipogenesis. It was also demonstrated that these effects were
partly mediated by ATF4. The results of the present study improve
the understanding of the underlying pathophysiology of NAFLD and
demonstrate the role of ATF4 in regulating lipogenesis and in the
development of NAFLD. In addition, ATF4 may be considered a
therapeutic target of NAFLD.
Acknowledgments
This study was supported by a grant from the
National Natural Science Foundations of China (grant no. 81200639).
The authors would like to thank Professor Jiming Ye (Health
Innovations Research Institute, RMIT University, Melbourne,
Victoria, Australia) for his advice on and interest in the
study.
References
|
1
|
Malavolti M, Battistini NC, Miglioli L,
Bagni I, Borelli L, Marino M, Scaglioni F and Bellentani S:
Influence of lifestyle habits, nutritional status and insulin
resistance in NAFLD. Front Biosci (Elite Ed). 4:1015–1023. 2012.
View Article : Google Scholar
|
|
2
|
Firneisz G: Non-alcoholic fatty liver
disease and type 2 diabetes mellitus: The liver disease of our age?
World J Gastroenterol. 20:9072–9089. 2014.PubMed/NCBI
|
|
3
|
Leite NC, Villela-Nogueira CA, Cardoso CR
and Salles GF: Non-alcoholic fatty liver disease and diabetes: From
physiopathological interplay to diagnosis and treatment. World J
Gastroenterol. 20:8377–8392. 2014. View Article : Google Scholar : PubMed/NCBI
|
|
4
|
Perry RJ, Samuel VT, Petersen KF and
Shulman GI: The role of hepatic lipids in hepatic insulin
resistance and type 2 diabetes. Nature. 510:84–91. 2014. View Article : Google Scholar : PubMed/NCBI
|
|
5
|
Ren LP, Chan SM, Zeng XY, Laybutt DR,
Iseli TJ, Sun RQ, Kraegen EW, Cooney GJ, Turner N and Ye JM:
Differing endoplasmic reticulum stress response to excess
lipogenesis versus lipid oversupply in relation to hepatic
steatosis and insulin resistance. PLoS One. 7:e308162012.
View Article : Google Scholar : PubMed/NCBI
|
|
6
|
Ozcan U, Yilmaz E, Ozcan L, Furuhashi M,
Vaillancourt E, Smith RO, Görgün CZ and Hotamisligil GS: Chemical
chaperones reduce ER stress and restore glucose homeostasis in a
mouse model of type 2 diabetes. Science. 313:1137–1140. 2006.
View Article : Google Scholar : PubMed/NCBI
|
|
7
|
Basseri S and Austin RC: Endoplasmic
reticulum stress and lipid metabolism: Mechanisms and therapeutic
potential. Biochem Res Int. 2012:8413622012. View Article : Google Scholar
|
|
8
|
Zhou H, Zhang K, Janciauskiene S and Li X:
Endoplasmic reticulum stress and lipid metabolism. Biochem Res Int.
2012:2575282012. View Article : Google Scholar : PubMed/NCBI
|
|
9
|
Volmer R and Ron D: Lipid-dependent
regulation of the unfolded protein response. Curr Opin Cell Biol.
33:67–73. 2015. View Article : Google Scholar :
|
|
10
|
Lee AH and Glimcher LH: Intersection of
the unfolded protein response and hepatic lipid metabolism. Cell
Mol Life Sci. 66:2835–2850. 2009. View Article : Google Scholar : PubMed/NCBI
|
|
11
|
Ozcan U, Cao Q, Yilmaz E, Lee AH, Iwakoshi
NN, Ozdelen E, Tuncman G, Görgün C, Glimcher LH and Hotamisligil
GS: Endoplasmic reticulum stress links obesity, insulin action and
type 2 diabetes. Science. 306:457–461. 2004. View Article : Google Scholar : PubMed/NCBI
|
|
12
|
Ren LP, Song GY, Hu ZJ, Zhang M, Peng L,
Chen SC, Wei L, Li F and Sun W: The chemical chaperon
4-phenylbutyric acid ameliorates hepatic steatosis through
inhibition of de novo lipogenesis in high-fructose-fed rats. Int J
Mol Med. 32:1029–1036. 2013.PubMed/NCBI
|
|
13
|
Oyadomari S, Harding HP, Zhang Y,
Oyadomari M and Ron D: Dephosphorylation of translation initiation
factor 2alpha enhances glucose tolerance and attenuates
hepatosteatosis in mice. Cell Metab. 7:520–532. 2008. View Article : Google Scholar : PubMed/NCBI
|
|
14
|
Wang C, Huang Z, Du Y, Cheng Y, Chen S and
Guo F: ATF4 regulates lipid metabolism and thermogenesis. Cell Res.
20:174–184. 2010. View Article : Google Scholar : PubMed/NCBI
|
|
15
|
Mohamed HA, Yao W, Fioravante D, Smolen PD
and Byrne JH: cAMP-response elements in Aplysia creb1, creb2 and
Ap-uch promoters: Implications for feedback loops modulating long
term memory. J Biol Chem. 280:27035–27043. 2005. View Article : Google Scholar : PubMed/NCBI
|
|
16
|
Seo J, Fortuno ER III, Suh JM, Stenesen D,
Tang W, Parks EJ, Adams CM, Townes T and Graff JM: Atf4 regulates
obesity, glucose homeostasis and energy expenditure. Diabetes.
58:2565–2573. 2009. View Article : Google Scholar : PubMed/NCBI
|
|
17
|
Lange PS, Chavez JC, Pinto JT, Coppola G,
Sun CW, Townes TM, Geschwind DH and Ratan RR: ATF4 is an oxidative
stress-inducible, prodeath transcription factor in neurons in vitro
and in vivo. J Exp Med. 205:1227–1242. 2008. View Article : Google Scholar : PubMed/NCBI
|
|
18
|
Li H, Meng Q, Xiao F, Chen S, Du Y, Yu J,
Wang C and Guo F: ATF4 deficiency protects mice from
high-carbohydrate-diet-induced liver steatosis. Biochem J.
438:283–289. 2011. View Article : Google Scholar : PubMed/NCBI
|
|
19
|
Xiao G, Zhang T, Yu S, Lee S,
Calabuig-Navarro V, Yamauchi J, Ringquist S and Dong HH: ATF4
protein deficiency protects against high fructose-induced
hypertriglyceridemia in mice.
|
|
20
|
Livak KJ and Schmittgen TD: Analysis of
relative gene expression data using real-time quantitative PCR and
the 2(-Delta Delta C(T)) Method. Methods. 25:402–408. 2001.
View Article : Google Scholar
J Biol Chem. 288:25350–25361. 2013.
View Article : Google Scholar
|
|
21
|
Kammoun HL, Chabanon H, Hainault I, Luquet
S, Magnan C, Koike T, Ferré P and Foufelle F: GRP78 expression
inhibits insulin and ER stress-induced SREBP-1c activation and
reduces hepatic steatosis in mice. J Clin Invest. 119:1201–1215.
2009. View
Article : Google Scholar : PubMed/NCBI
|
|
22
|
Zhang XQ, Xu CF, Yu CH, Chen WX and Li YM:
Role of endoplasmic reticulum stress in the pathogenesis of
nonalcoholic fatty liver disease. World J Gastroenterol.
20:1768–1776. 2014. View Article : Google Scholar : PubMed/NCBI
|
|
23
|
Thorburn AW, Storlien LH, Jenkins AB,
Khouri S and Kraegen EW: Fructose-induced in vivo insulin
resistance and elevated plasma triglyceride levels in rats. Am J
Clin Nutr. 49:1155–1163. 1989.PubMed/NCBI
|
|
24
|
Aragno M, Tomasinelli CE, Vercellinatto I,
Catalano MG, Collino M, Fantozzi R, Danni O and Boccuzzi G:
SREBP-1c in nonalcoholic fatty liver disease induced by
Western-type high-fat diet plus fructose in rats. Free Radic Biol
Med. 47:1067–1074. 2009. View Article : Google Scholar : PubMed/NCBI
|
|
25
|
Shimano H, Horton JD, Shimomura I, Hammer
RE, Brown MS and Goldstein JL: Isoform 1c of sterol regulatory
element binding protein is less active than isoform 1a in livers of
transgenic mice and in cultured cells. J Clin Invest. 99:846–854.
1997. View Article : Google Scholar : PubMed/NCBI
|
|
26
|
Denechaud PD, Bossard P, Lobaccaro JM,
Millatt L, Staels B, Girard J and Postic C: ChREBP, but not LXRs,
is required for the induction of glucose-regulated genes in mouse
liver. J Clin Invest. 118:956–964. 2008.PubMed/NCBI
|
|
27
|
Malhi H and Kaufman RJ: Endoplasmic
reticulum stress in liver disease. J Hepatol. 54:795–809. 2011.
View Article : Google Scholar
|
|
28
|
Gentile CL, Frye M and Pagliassotti MJ:
Endoplasmic reticulum stress and the unfolded protein response in
nonalcoholic fatty liver disease. Antioxid Redox Signal.
15:505–521. 2011. View Article : Google Scholar :
|
|
29
|
Sha H, He Y, Chen H, Wang C, Zenno A, Shi
H, Yang X, Zhang X and Qi L: The IRE1alpha-XBP1 pathway of the
unfolded protein response is required for adipogenesis. Cell Metab.
9:556–564. 2009. View Article : Google Scholar : PubMed/NCBI
|
|
30
|
Sriburi R, Jackowski S, Mori K and Brewer
JW: XBP1: A link between the unfolded protein response, lipid
biosynthesis and biogenesis of the endoplasmic reticulum. J Cell
Biol. 167:35–41. 2004. View Article : Google Scholar : PubMed/NCBI
|
|
31
|
Lee AH, Scapa EF, Cohen DE and Glimcher
LH: Regulation of hepatic lipogenesis by the transcription factor
XBP1. Science. 320:1492–1496. 2008. View Article : Google Scholar : PubMed/NCBI
|
|
32
|
Bobrovnikova-Marjon E, Hatzivassiliou G,
Grigoriadou C, Romero M, Cavener DR, Thompson CB and Diehl JA:
PERK-dependent regulation of lipogenesis during mouse mammary gland
development and adipocyte differentiation. Proc Natl Acad Sci USA.
105:16314–16319. 2008. View Article : Google Scholar : PubMed/NCBI
|
|
33
|
Vallejo M, Ron D, Miller CP and Habener
JF: C/ATF, a member of the activating transcription factor family
of DNA-binding proteins, dimerizes with CAAT/enhancer-binding
proteins and directs their binding to cAMP response elements. Proc
Natl Acad Sci USA. 90:4679–4683. 1993. View Article : Google Scholar : PubMed/NCBI
|
|
34
|
Mamady H and Storey KB: Coping with the
stress: Expression of ATF4, ATF6 and downstream targets in organs
of hibernating ground squirrels. Arch Biochem Biophys. 477:77–85.
2008. View Article : Google Scholar : PubMed/NCBI
|
|
35
|
Wang C and Guo F: Effects of activating
transcription factor 4 deficiency on carbohydrate and lipid
metabolism in mammals. IUBMB Life. 64:226–230. 2012. View Article : Google Scholar : PubMed/NCBI
|