Introduction
micro (mi)RNAs are endogenous, small and non-coding
RNAs, which negatively regulate protein expression by mRNA cleavage
or translation repression (1).
Since the first miRNA was reported in Caenorhabditis elegans
by Lee et al (2), an large
quantity of miRNAs have been identified and subsequent studies
indicated that they serve crucial roles in various biological
process and regulate the expression of up to 30% of human genes
(3,4). Previous studies suggested that some
specific miRNAs have an important role in the pathogenesis of
tumors by functioning as oncogenes or tumor suppressor genes
(5–7). In addition, expression profiling of
miRNAs can also be used for differentiation of the major
histological subtypes of tumors (8,9). As
a result of their high sensitivity and the relatively easy method
of detection, miRNAs have been shown to exhibit great potential as
novel biomarkers for diagnosis, prognosis and therapy in cancer
(9).
Testicular germ cell tumors (TGCTs) arise from
carcinoma in situ cells, which resemble malignant primordial
germ cells of fetal origin. Histologically, TGCTs are divided into
seminomas and non-seminomas. For the clinical management of TGCTs,
blood-based markers, including lactate dehydrogenase, α-fetoprotein
and human chorionic gonadotropin are used for diagnosis, risk
assessment and determining patient prognosis (9). However, these biomarkers are useless
for ~40% of patients with TGCTs, suggesting that it is necessary to
discover novel candidate biomarkers. Recently, certain miRNAs,
including miR-372, -373, -449, -383 and -199a have been identified
to be dysregulated in TGCTs and they contribute to the development
of TGCTs (9–11). Among them, miR-199a-3p, one of the
miR-199a family, is of particular interest since it was reported to
be specifically upregulated by transforming growth factor (TGF)-β1
signaling in mouse GC-1 spg germ cells and may be associated with
germ cell development in our previous study (12). In testicular cancer, miR-199a-3p
has been reported to suppress cell growth, migration, invasion and
metastasis by regulating TGF-β1 signaling through the regulation of
Smad4 (13). Chen et al
(11) recently found that
miR-199a-3p negatively regulated DNA methylation, partly through
targeting DNA (cytosine-5)-methyltransferase 3A, in TGCTs (11). Although these interesting
functional studies have addressed the role of miR-199a-3p in cancer
development and progression, the regulatory role and underlying
mechanisms of miR-199a-3p in metabolism of TGCTs remains
unknown.
The present study characterized the regulation of
aerobic glycolysis by miR-199a-3p and its impact on testicular
cancer metabolism. It was revealed that miR-199a-3p suppressed cell
growth and migration, and inhibition of miR-199a-3p increased the
production of lactate in Ntera-2 cells and affected testicular
tumor metabolism by downregulating metabolic genes, including
lactate dehydrogenase A (LDHA), monocarboxylate transporter 1
(MCT1), phosphoglycerate kinase 1 (PGK1) and TP53-inducible
glycolysis and apoptosis regulator (TIGAR), suggesting that
miR-199a-3p functions as a tumor suppressor in TGCTs by regulating
the metabolism signaling pathway.
Materials and methods
Clinical tissue specimens
Formalin fixed paraffin embedded (FFPE) human
testicular tumors tissue specimens, including adjacent non-tumor
tissues, were collected at the Department of Pathology, Xiangya
Hospital of Central South University (Hunan, China). Clinical
tissue specimens included five normal testes and five TGCTs
tissues. The present study was approved by the Independent Ethical
Committee of Xiangya Hospital of Central South University.
Cell culture and transient
transfections
The human Ntera-2 testicular tumor cell line
[CRL-1973; American Type Culture Collection (ATCC), Rockville, MD,
USA] and the human embryonic kidney cell line HEK293 (CRL-1573;
ATCC) were cultured in RPMI-1640 (Gibco; Thermo Fisher Scientific,
Inc., Waltham, MA, USA), supplemented with 10% fetal bovine serum
(Gibco; Thermo Fisher Scientific, Inc.), 100 units/ml penicillin
and 100 μg/ml streptomycin. The cultures were maintained at
37°C in a humidified atmosphere with 5% CO2 in air. The
cells were seeded into a 6-well plate and cultured for 24 h prior
to transfection. Then either miR-199a-3p mimics, inhibitors or the
negative control (NC) were transfected into the cells at a final
concentration of 50 or 100 nM using TurboFect™ in vitro
Transfection reagent (Fermentas, Burlington, Canada), according to
the manufacturer's protocol. The culture medium was discarded
following transfection for 12 h and was replaced with the fresh
medium. The miR-199a-3p mimics, inhibitors and the NC were all
synthesized by Shanghai GenePharma Co., Ltd. (Shanghai, China).
Bioinformatics analysis
The expression abundance of miR-199a-3p in different
human tissues was analyzed by GEO Datasets (http://www.ncbi.nlm.nih.gov/gds/). Using both
'miR-199a-3p' and 'Expression profiling by array' as key words,
three data sets, including GSE65626, GSE53437 and GSE14985, were
selected and categorized using statistical analysis. The data of
GSE65626 was derived from glioblastoma tissue and matched adjacent
normal tissue. The data of GSE53437 was derived from heart failure
tissue and matched adjacent normal tissue. The data from GSE14985
was from multiple cancer tissue and matched adjacent normal tissue.
The potential target genes of miR-199a-3p were searched for using
TargetScan 6.2 (http://www.targetscan.org/). An RNAhybrid tool
(bibiserv.techfak.uni-bielefeld.de/rnahybrid) was
subsequently used to analyze the minimum free energy hybridization
of the miR-199a-3p and target mRNAs. RNAFold WebServer (rna.tbi.univie.ac.at/cgi-bin/RNAfold.cgi) was used to
predict the secondary structure of single-stranded target mRNAs.
Bioinformatics analysis of promoter sequence and potential
transcription factor binding sites within the 5′-regulatory region
of the selected metabolic genes was performed using the EPD
database (http://epd.vital-it.ch/) and
MatInspector (http://www.genomatix.de/online_help/help_matinspector/matinspector_help.html).
RNA isolation of FFPE testicular tissues
and Ntera-2 cells
The total RNA from FFPE tissue specimens, including
testicular tumors and normal testes, were isolated using
RecoverAll™ Total Nucleic Acid Isolation kit (Ambion; Thermo Fisher
Scientific), according to the manufacturer's protocol. For total
RNA isolation of Ntera-2 cells, RNAiso (Takara Bio., Inc., Otsu,
Japan) was used.
cDNA synthesis and quantitative
polymerase chain reaction (qPCR) for miRNA and mRNA detection
PrimeScript miRNA qPCR Starter kit Ver. 2.0 (Takara
Bio., Inc.) was used to detect the expression of miRNA. Briefly, 3
μg total RNA was digested with DNase I (Fermentas) and used
for miRNA reverse transcription by PrimeScript miRNA qPCR Starter
kit Ver. 2.0 (Takara Bio., Inc.) or for mRNA reverse transcription
by PrimeScript RT reagent kit with gDNA Eraser (Takara Bio., Inc.).
Following this, real-time qPCR was performed using a SYBR Premix Ex
Taq II kit and the MX3000 instrument (Stratagene, La Jolla, CA,
USA). The thermocycling conditions were as follows: Initial
denaturation, 95°C for 10 min; 40 cycles of 95°C for 10 sec, 60°C
for 30 sec and 72°C for 32 sec. For miRNA, has-miR-15a was used as
an internal control and for mRNA, GAPDH was used as an internal
control. Primer sequences were as follows: GAPDH, forward:
5′-GACCCCTTCATTGACCTCAA-3′ and reverse:
5′-GCATGGACTGTGGTCATGAGT-3′. The results were quantified using the
2−ΔΔCq method (14).
Cell viability analysis by
3-4,5-dimethylthiazol-2-yl-2,5 diphenyl tetrazolium bromide (MTT)
assay
Ntera-2 cells at a density of 5×10³
cells/well were seeded into a 96-well plate with 100 μl
medium for 24 h. When the cells reached 70% confluence, they were
trasfected with NC, miR-199a-3p mimics or inhibitor as above. MTT
reagent (5 mg/ml; Sigma-Aldrich, St. Louis, MO, USA) was added to
each well for 0, 24, 72 h. The cells were subsequently incubated
for 4 h at 37°C and 150 μl dimethyl sulfoxide was added to
each well following the removal of the medium to dissolve the
formazan products. The absorbance at a wavelength of 570 nm in each
well was determined using an ELISA reader.
Cell migration analysis by wound healing
assay
Ntera-2 cells at a density of 1×10⁵
cells/well were seeded into a 6-well-plate with RPMI-1640 medium
were grown to 80% confluence and transiently transfected with 100
nM NC, miR-199a-3p mimics or inhibitors as above. The 100%
confluent monolayer Ntera-2 cells were subsequently scraped with a
sterile 100 μl pipette tip and the cell debris was washed
with D-hanks solution. The cells were incubated at 37°C with 5%
CO2 overnight. Images were captured under bright field
light microscopy with a Nikon Eclipse E600 microscope and an RS
Photometrics CoolSNAP camera at 0 and 48 h after scraping.
Flow cytometry analysis
For apoptosis or cell cycle analysis,
1–5×10⁵ Ntera-2 cells from each sample were digested
with 0.25% trypsin and fixed in 70% cold ethanol overnight after
resuspending in D-hanks three times. The cells were subsequently
collected and were mixed with propidium iodide staining solution at
a final concentration of 50 μg/ml for 30 min at room
temperature in the dark. All samples were analyzed using flow
cytometry, according to the manufacturer's protocols.
Glucose metabolic assay
Ntera-2 cells were transfected with either
miR-199a-3p mimics or inhibitor, using NC as a control. The
supernatants were collected after 24 and 48 h, and detected using
an Automatic Biochemical Analyzer (7170A; Hitachi, Tokyo,
Japan).
qPCR array screening for metabolic
genes
Briefly, the total RNA was isolated from Ntera-2
cells, which were treated with either NC, miR-199a-3p mimics or
inhibitor for 48 h. The RNA was subsequently converted into cDNA.
qPCR of 148 metabolic genes was performed using a MX3000 instrument
(Stratagene) by mixing equal quantities of cDNA, SYBRGreen mix
(CWBio, Beijing, China) and specific primers. Each sample was
analyzed in triplicate. All real-time data were normalized against
GAPDH and analyzed using the RT2 profiler PCR Array Data
Analysis software version 3.5 (http://pcrdataanalysis.sabiosciences.com/pcr/arrayanalysis.php).
The primers used in qPCR screening are as described previously
(15).
Statistical analysis
The data are expressed as the mean ± standard
deviation (n=3). Statistical analysis was performed using the
Student's t-test. P≤0.05 was considered to indicate a statistically
significant difference. For the qPCR array assay, the fold changes
of ≥4 or ≤0.5 (P≤0.05) were analyzed using t-test and P-value.
Results
miR-199a-3p inhibits the proliferation of
Ntera-2 cells
Ntera-2 cells were transfected with either
miR-199a-3p mimics or inhibitor, and the results of miRNA PCR
confirmed that the transfection was highly efficient, stable and
useful for the following experiments (Fig. 1A). An MTT assay revealed that the
viability and growth of Ntera-2 cells were significantly inhibited
by miR-199a-3p mimics compared with the negative control.
Conversely the proliferation of cells was notably induced following
treatments with the miR-199a-3p inhibitor (Fig. 1B). Using flow cytometry analysis,
cell apoptosis and cell cycle distribution of Ntera-2 cells treated
with NC, miR-199a-3p mimics or inhibitor were also assessed. As
shown in Fig. 1C and D, compared
with the cell population of the NC group (G0/G1, 45.66±1.79%; S,
33.83±2.07%; G2/M, 17.15±2.29%) and the miR-199a-3p inhibitor group
(G0/G1, 45.53±1.46%; S, 34.44±3.76%; G2/M, 16.92±2.54%), the
miR-199a-3p mimics group exhibited an increased G0/G1 phase cell
population (51.83±3.25%) and decreased G2/M phase cell population
(3.61±3.15%), but no obvious effect on the percentage of S phase
cells (35.4±1.34%). In addition, the apoptotic cell population
(pre-G1 peak) was notably increased in the miR-199a-3p mimics group
(8.78%), but not in the other groups. Therefore, these data
suggested that miR-199a-3p has an anti-proliferation effect on
Ntera-2 cells and it may induce Ntera-2 cells apoptosis.
miR-199a-3p inhibits the migration of
Ntera-2 cells
Cell migration was measured using a wound healing
assay in Ntera-2 cells treated with NC, miR-199a-3p mimics or
inhibitor. The cells treated with miR-199a-3p mimics were less
migratory compared with the NC control or untreated cells at 48 h
after scratching (Fig. 2A and B).
By contrast, inhibition of miR-199a-3p significantly promoted the
migration of Ntera-2 cells (P<0.01; Fig. 2B). This result revealed that
miR-199a-3p may inhibit the migration of Ntera-2 cells.
Inhibition of miR-199a-3p significantly
increases the production of lactate in Ntera-2 cells
The production of lactate is an important index of
glycolysis. By means of detecting lactate release of Ntera-2 cells
after miR-199a-3p treatment, it was revealed that no statistically
significant changes occurred in the miR-199a-3p mimics group for
both 24 and 48 h treatment compared with the NC group (Fig. 3A). Additionally, the miR-199a-3p
inhibitor group notably increased the production of lactate at 48 h
(P<0.01). These results indicated that inhibition of miR-199a-3p
significantly enhanced the metabolism of glucose.
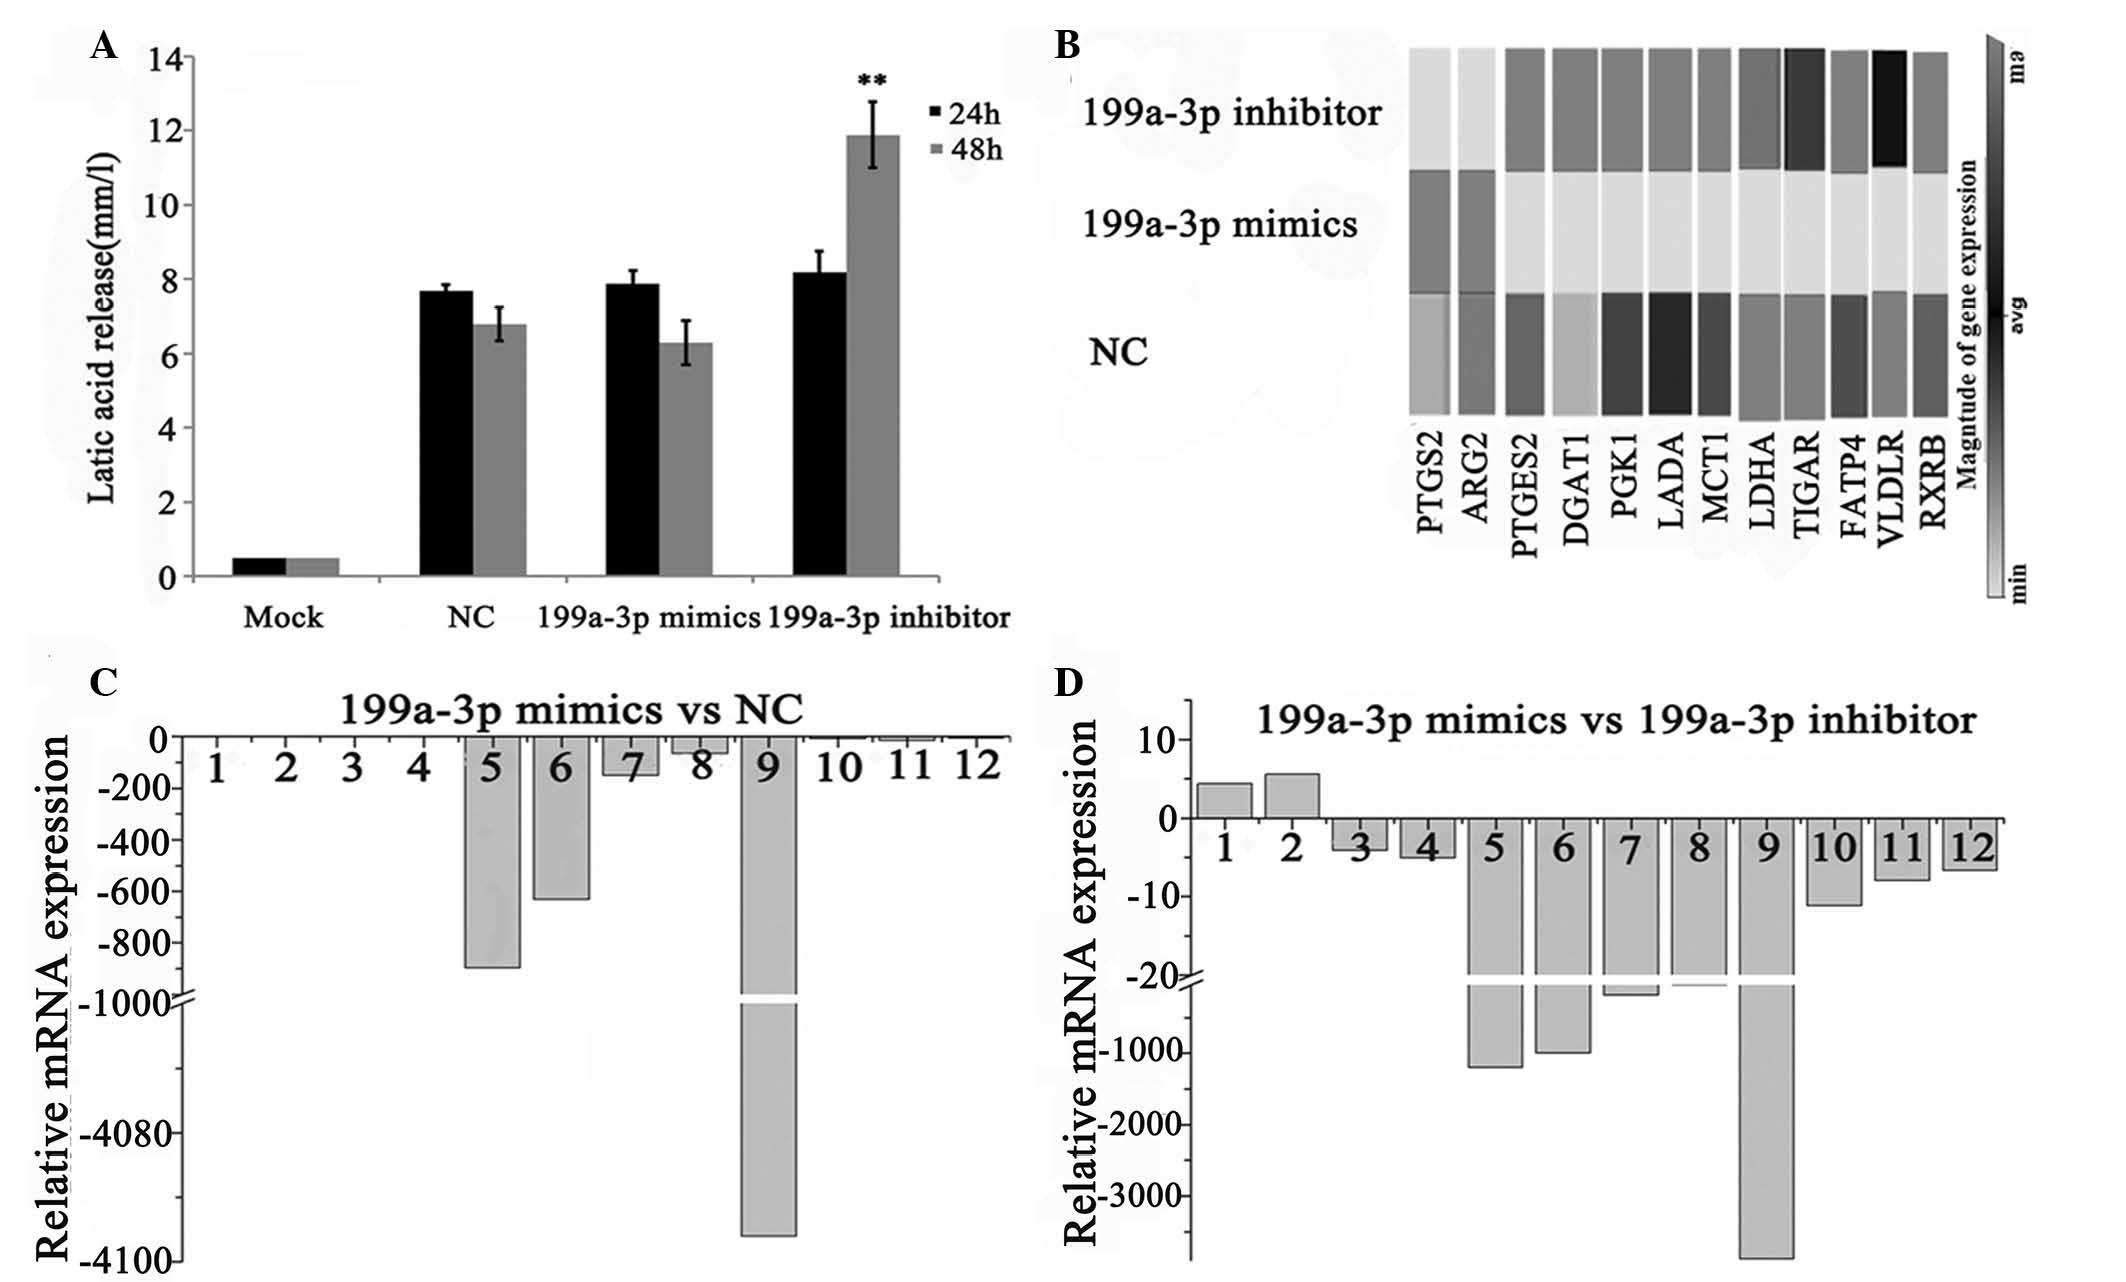 | Figure 3Impact of miR-199a-3p on the
metabolism of Ntera-2 cells. (A) The production of lactate of
Ntera-2 cells was detected following treatment with NC, miR-199a-3p
mimics or inhibitor for 24 or 48 h. (B) A heat-map of 12 selected
metabolic genes in Ntera-2 cells, which were regulated by
miR-199a-3p. The expression levels are depicted by a scale from
black (high expression) to gray (low expression). (C) The relative
mRNA expression of 12 selected metabolic genes in the miR-199a-3p
mimics group compared with the NC group. (D) The relative mRNA
expression of 12 selected metabolic genes in miR-199a-3p mimics
group compared with miR-199a-3p inhibitor group.
(**P<0.01). 1–12 refers to PTGS2, ARG2, PTGES,
DGAT1, PGK1, LADA, MCT1, TIGAR, LDHA, FATP4, VLDLR and
RXRB, respectively. NC, cells transfected with scramble
sequence; PTGS2, prostaglandin-endoperoxide synthase 2; ARG2,
arginase 2; PTGES, prostaglandin E synthase; DGAT1, diacylglycerol
O-acyltransferase 1; PGK1, phosphoglycerate kinase 1; LADA, latent
autoimmune diabetes of adults; MCT1, monocarboxylate transporter 1;
TIGAR, TP53-inducible glycolysis and apoptosis regulator; LDHA,
lactate dehydrogenase A; FATP4, fatty acid transport protein 4;
VLDLR, very-low-density-lipoprotein receptor; RXRB, retinoid X
receptor β. |
Regulation of miR-199a-3p on the
metabolic gene expression profile of Ntera-2 cells
qPCR array screening was applied to investigate the
changes at the mRNA level in Ntera-2 cells following miR-199a-3p
transfection by comparison with the control group (Figs. 3 and 4). Global gene expression levels induced
by miR-199a-3p in Ntera-2 cells from the qPCR array analysis are
presented in Fig. 3B and Fig. 4. The differentially expressed genes
with fold changes of ≥4 or ≤0.5 (P≤0.05) were analyzed using t-test
and P-value. As shown in Fig. 3D and
E, the expression of 12/148 genes were altered following
treatment with the miR-199a-3p mimics compared with the inhibitor
treatment. Of these, two genes, prostaglandin-endoperoxide
synthase 2 (PTGS2) and arginase 2 (ARG2)
were upregulated. The other 10 genes, prostaglandin E
synthase (PTGES), diacylglycerol O-acyltransferase
1 (DGAT1), PGK1, latent autoimmune diabetes of
adults (LADA), MCT1, TIGAR, LDHA, fatty acid
transport protein 4 (FATP4),
very-low-density-lipoprotein receptor (VLDLR) and
retinoid X receptor β (RXRB) were downregulated
specifically. Whereas, eight downregulated genes (PGK1, LADA,
MCT1, TIGAR, LDHA, FATP4, VLDLR, RXRB) were observed in
miR-199a-3p mimics group compared with the NC group.
Expression abundance of miR-199a-3p and
selected metabolic genes in both TGCT tissues and cell lines
The clinical relevance of aberrant metabolism caused
by dysregulated miR-199a-3p signaling was determined using TGCTs
and normal testis tissue specimens. In accordance with the
bioinformatics analysis (Fig. 5A),
the miR-199a-3p expression in testicular tumors was obviously
decreased compared with that in normal testes. For the selected
genes, PTGS2, PTGES, LADA and FATP4 revealed no
significant change between normal testes and testicular tumors,
while ARG2 and VLDLR were downregulated in the
clinical samples (Fig. 5C;
Table I). Notably, the other four
genes, including LDHA, MCT1, PGK1 and TIGAR, were
markedly upregulated in testicular tumors, which were similar to
the results in Ntera-2 cells. In order to further understand the
association between miR-199a-3p and the four selected metabolic
genes, LDHA, MCT1, PGK1 and TIGAR, the expression
levels in cell lines, including HEK293 and Ntera-2 cells were
detected. Fig. 6 demonstrated that
miR-199a-3p is expressed at a higher level in HEK293 cells compared
with the levels in Ntera-2 cells. For the four selected genes, the
mRNA level of MCT1 was similar in both HEK293 and Ntera-2
cells, while the mRNA expression of PGK1 was slightly higher
in HEK293 cells compared with in Ntera-2 cells. By contrast, a
significantly lower expression of both TIGAR and LDHA
was present in HEK293 cells compared with the Ntera-2 cells, which
is the opposite expression signature compared with miR-199a-3p.
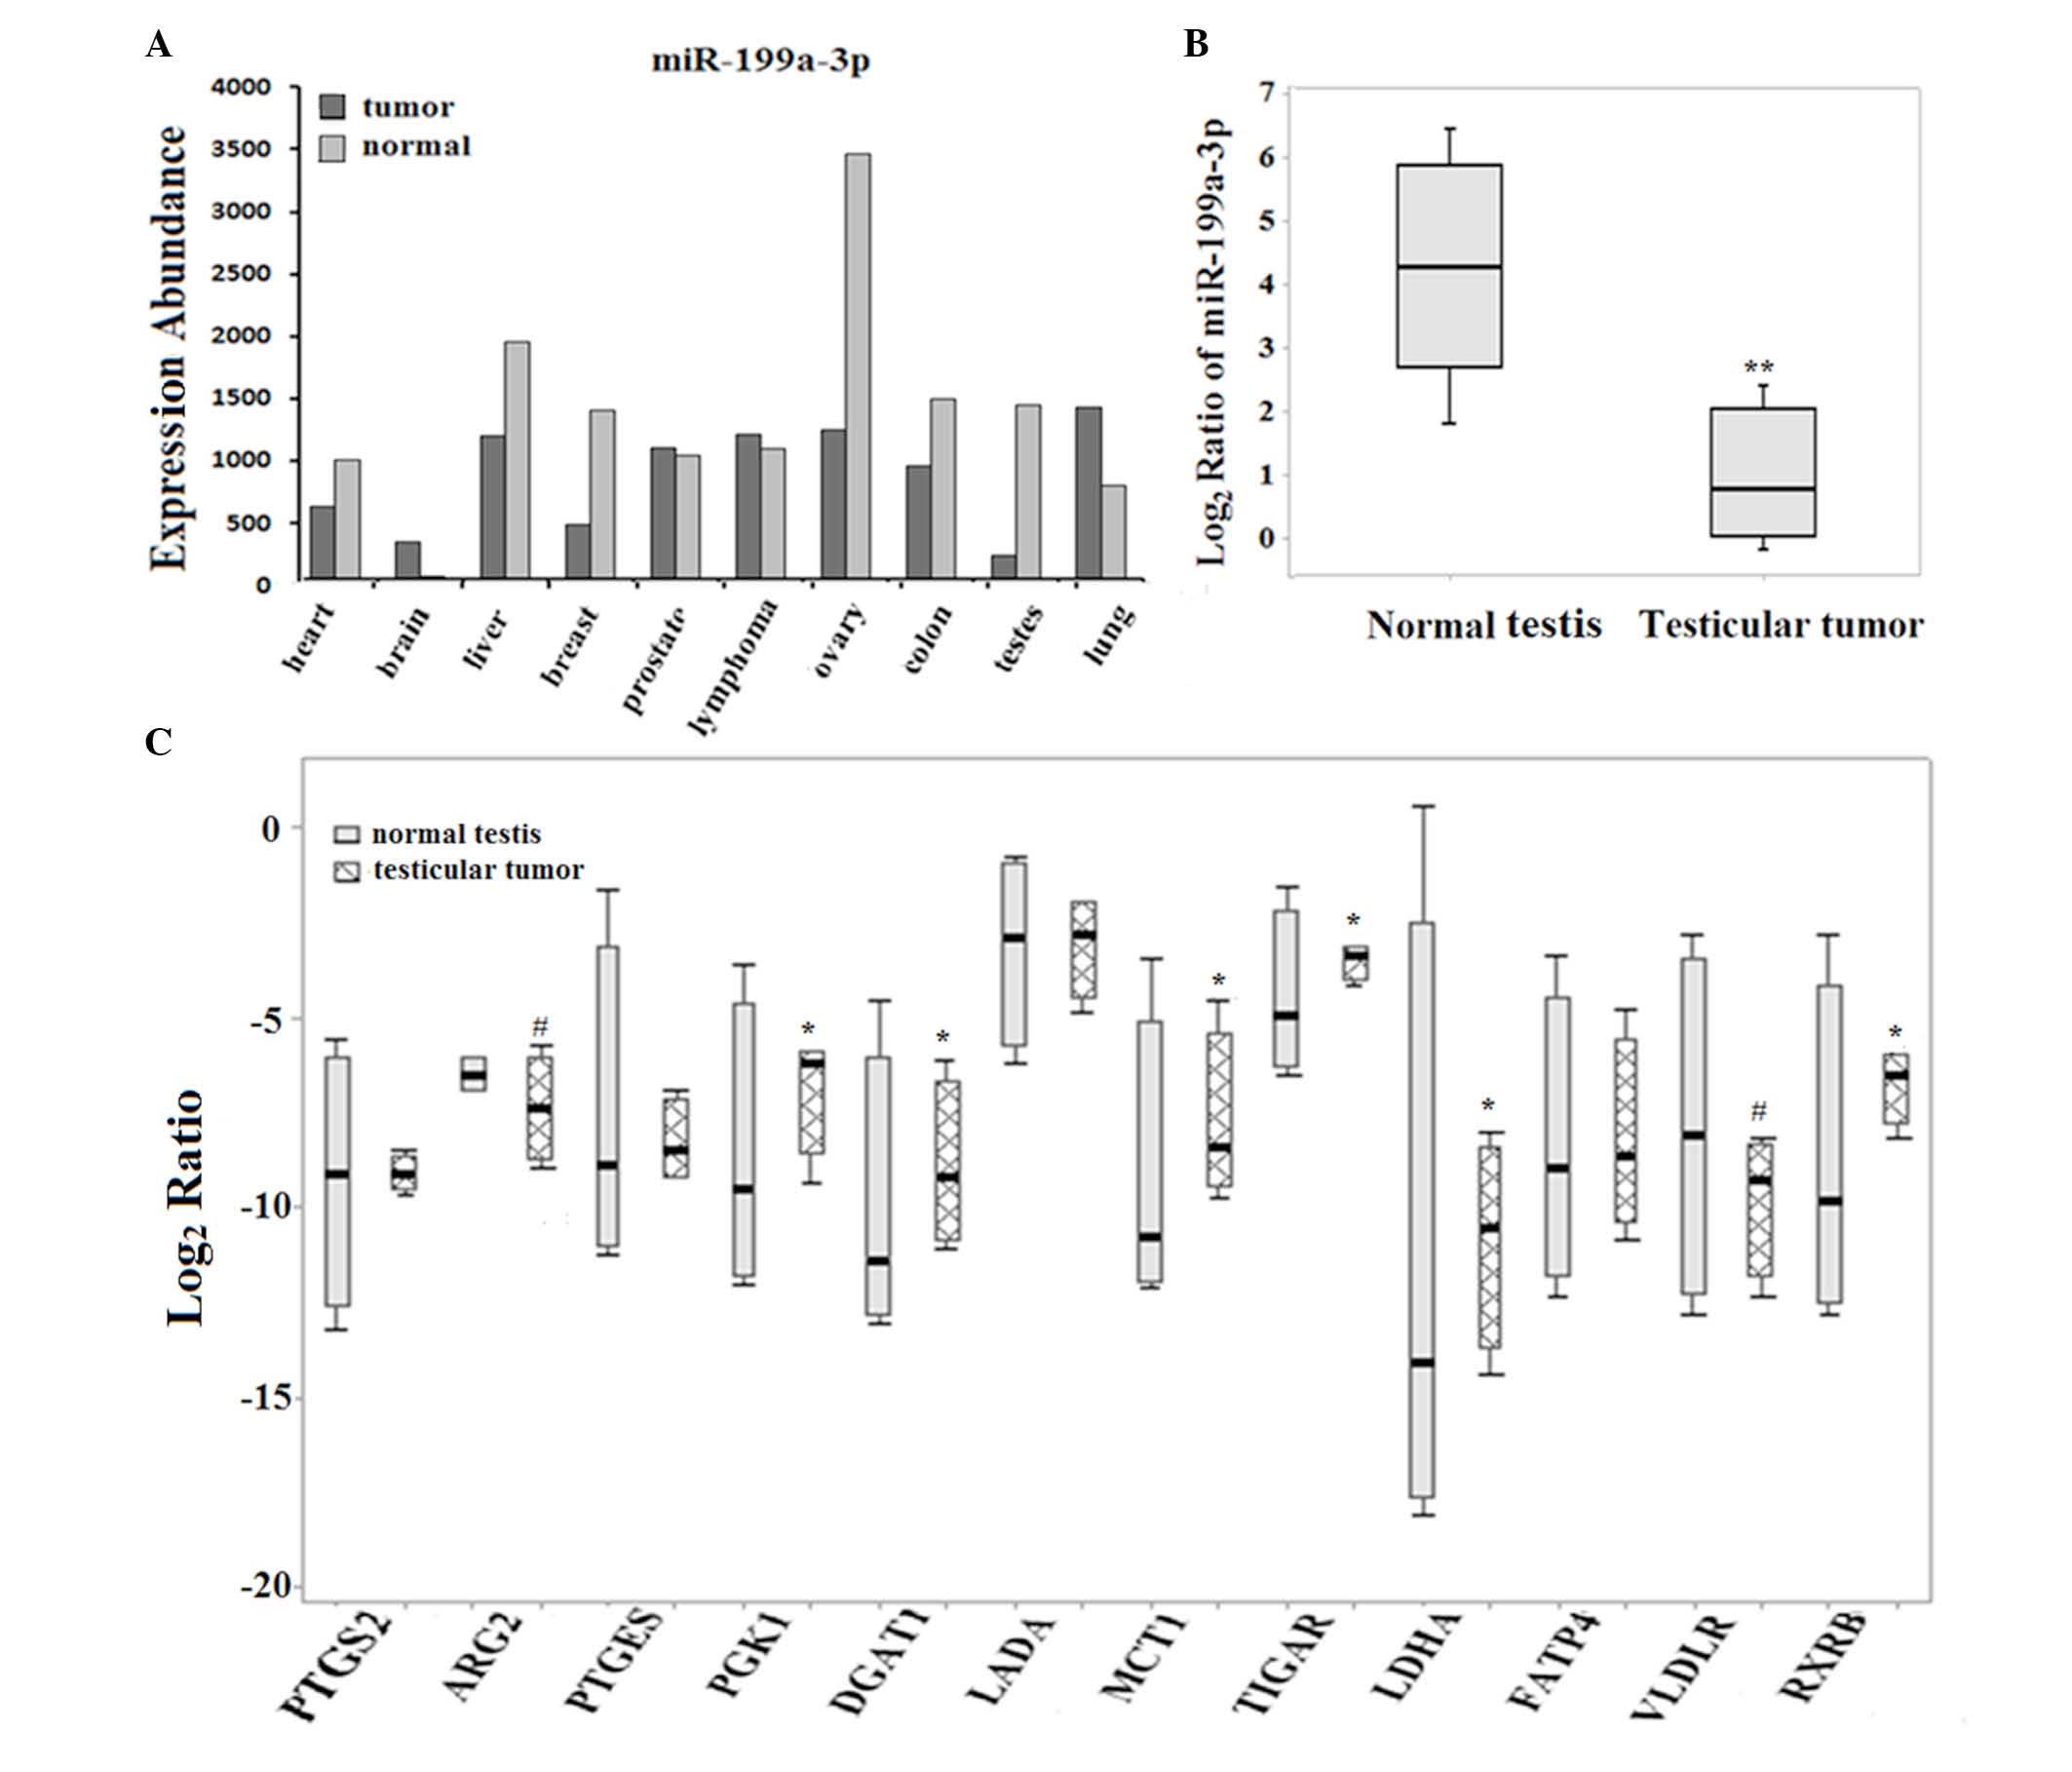 | Figure 5Expression levels of 12 selected
metabolic genes in clinical testicular samples. (A) The expression
profile of miR-199a-3p in various tissues was analyzed by
bioinformatics. (B) The expression of miR-199a-3p in both normal
testes and testicular tumors. (**P<0.01) (C) The
expression of 12 selected genes in normal testes and testicular
tumors. For clinical tissue specimens, the mRNA expressions were
represented with the box plots by calculating the Log2
ratio, which was normalized against glyceraldehyde 3-phosphate
dehyrogenase (*P<0.05 for upregulation,
#P<0.05 for downregulation). PTGS2,
prostaglandin-endoperoxide synthase 2; ARG2, arginase 2; PTGES,
prostaglandin E synthase; DGAT1, diacylglycerol O-acyltransferase
1; PGK1, phosphoglycerate kinase 1; LADA, latent autoimmune
diabetes of adults; MCT1, monocarboxylate transporter 1; TIGAR,
TP53-inducible glycolysis and apoptosis regulator; LDHA, lactate
dehydrogenase A; FATP4, fatty acid transport protein 4; VLDLR,
very-low-density-lipoprotein receptor; RXRB, retinoid X receptor
β. |
 | Table IExpression of miR-199a-3p and 12
selected genes in Ntera-2 cells transfected with the miR-199a-3p
mimics or inhibitor and in testicular tumors (n=5) vs. normal
clinical samples (n=5). |
Table I
Expression of miR-199a-3p and 12
selected genes in Ntera-2 cells transfected with the miR-199a-3p
mimics or inhibitor and in testicular tumors (n=5) vs. normal
clinical samples (n=5).
| Gene | miR-199a-3p mimics
vs. inhibitor in Ntera-2 cells | Testicular tumors
vs. normal testes |
|---|
| miR-199a-3p | ↑ | ↓ |
| PTGS2 | ↑ | No change |
| ARG2 | ↑ | ↓ |
| PTGES | ↓ | No change |
| PGK1 | ↓ | ↑ |
| DGAT1 | ↓ | ↑ |
| LADA | ↓ | No change |
| MCT1 | ↓ | ↑ |
| TIGAR | ↓ | ↑ |
| LDHA | ↓ | ↑ |
| FATP4 | ↓ | No change |
| VLDLR | ↓ | ↓ |
| RXRB | ↓ | ↑ |
miR-199a-3p may downregulate the
expression of four metabolic genes via the Sp1 binding site
Using TargetScan analysis, it was demonstrated that
none of the four selected genes (LDHA, MCT1, PGK1 and
TIGAR) have the potential recognition site of miR-199a-3p,
which suggests that the regulation is not direct. In order to
understand how miR-199a-3p downregulates the expression of these
genes, the promoter sequence of the four genes was analyzed and
revealed that the binding site of Sp1, a common transcription
factor, was in the promotor region of all four selected genes (data
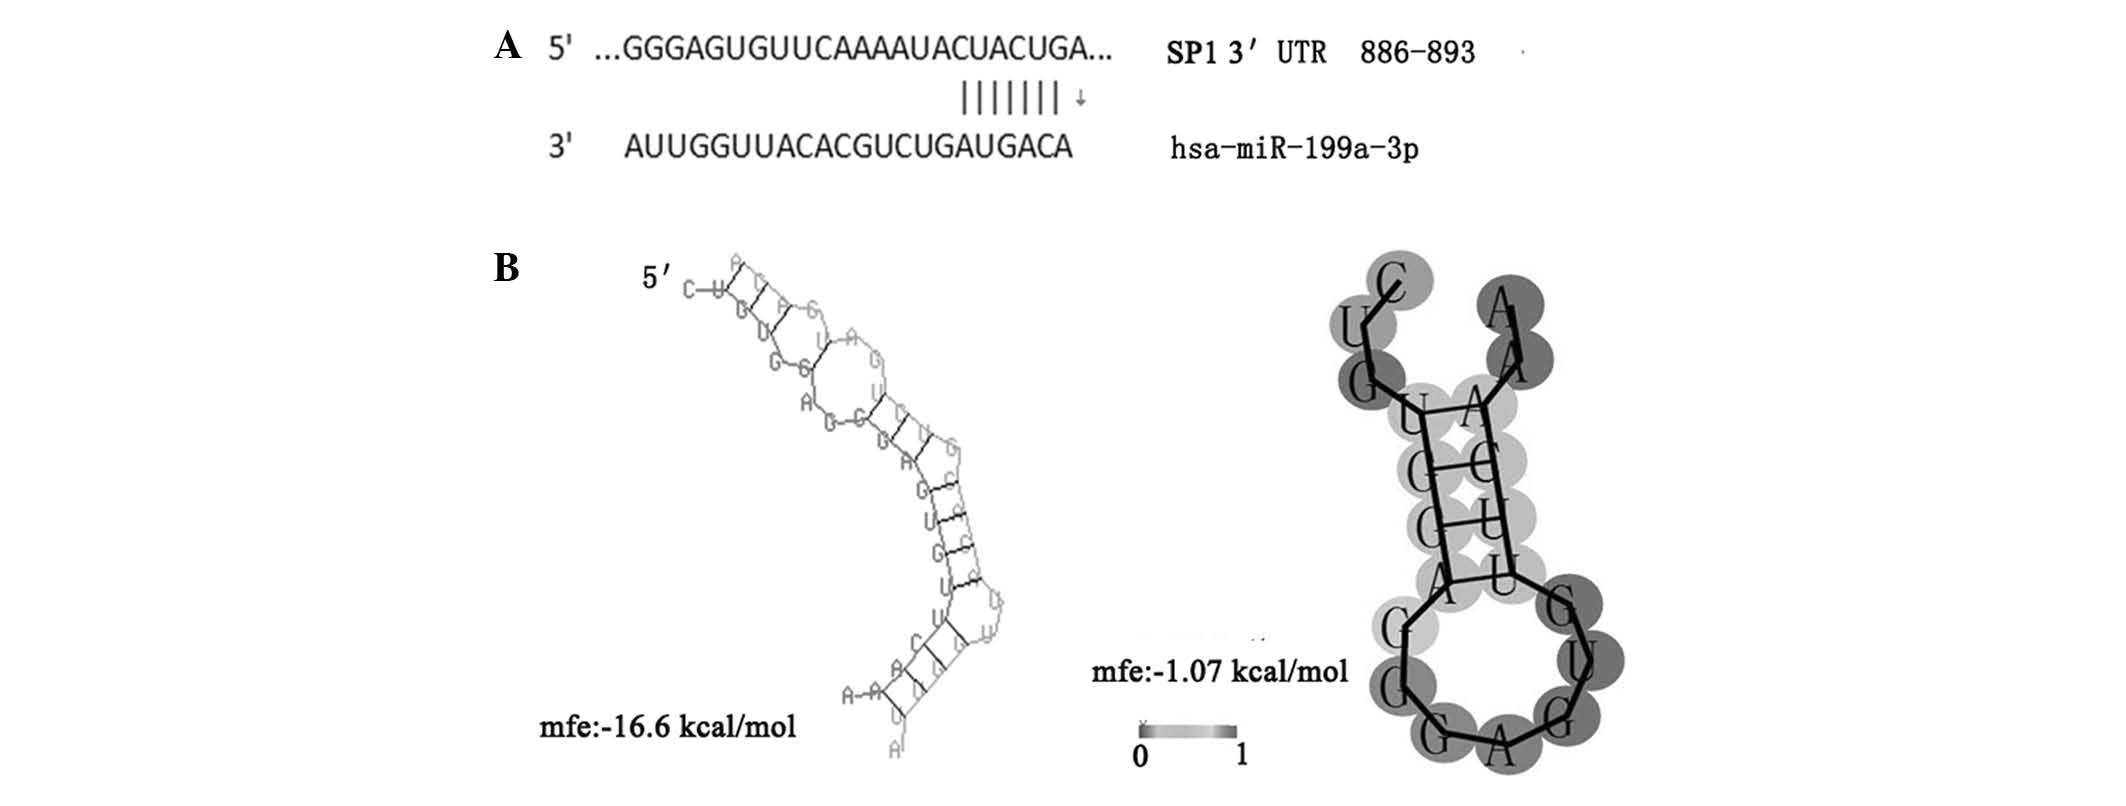
not shown). Notably, it was predicted using TargetScan analysis
that miR-199a-3p binds to the target sequences in the
3′-untranslated region (UTR) of Sp1 mRNA. In addition, further
bioinfor matics analysis revealed that the minimum free energy
hybridization of miR-199a-3p binding with the target gene Sp1 3′UTR
was markedly lower compared with that of the secondary structure of
single-stranded Sp1 mRNA, indicating that Sp1 and miR-199a-3p have
a higher possibility for binding (Fig.
7). Therefore, the present study hypothesized that miR-199a-3p
may downregulate the four metabolic genes via Sp1.
Discussion
The metabolic shift to aerobic glycolysis is a
common hallmark of cancer. Normally, non-cancerous cells catabolize
glucose by oxidative phosphorylation in the mitochondria to produce
adenosine triphosphate (ATP). However, in proliferating cancer
cells, glucose carbons were predominantly converted to lactate,
even with supply of adequate oxygen. This phenomenon of metabolic
alteration in cancer is termed the 'Warburg effect' (16). Advances in cancer metabolism
research over the last decade have demonstrated that metabolic
alterations can enhance a cancer cells capability for
proliferation, migration and invasion. In addition, clinical
studies have shown a close correlation between elevated levels of
lactate and poor patient prognosis or overall survival in different
cancer types (17). Therefore,
certain biological molecules involved in metabolic process are
currently being considered as therapeutic targets for cancer.
Since it was discovered that miRNAs are abnormally
expressed in cancer, increasing data has revealed that miRNAs serve
crucial roles in tumor growth by regulating their target genes and
a large number of miRNAs have been identified to regulate cancer
metabolism (18). Previous studies
showed that the alterations of miR-199a-3p, a member of miR-199a
family that controls the fate of cell survival and death, were
associated with the pathogenesis and progression of cancer, and it
can behave either as an oncogene or as tumor suppressor in
different cancer types (19-21).
In the present study, bioinformatics analysis (Fig. 5A) revealed that the expression of
miR-199a-3p was upregulated in tumors, including brain and lung
cancer, and downregulated in tumors, including liver, breast,
ovary, colon and testicular cancer, suggesting that patterns of
miR-199a-3p expression tend to vary among tumor types and its
functions are complicated in different tissues. The present study
also investigated that overexpression of miR-199a-3p caused the
inhibition of Ntera-2 cell proliferation and apoptosis, G1 and G2
phase arrest and suppressed cell migration (Figs. 1 and 2), which is consistent with a previous
study and suggested miR-199a-3p was a tumor suppressor in
testicular tumor cells.
To improve the understanding of the functional
mechanism of miR-199a-3p as a tumor suppressor in testicular
cancer, the present study performed a biochemical method and
high-throughput qPCR array screening analysis to detect the effect
of miR-199a-3p on global glycolysis metabolism pattern in Netra-2
cells. As shown in Figs. 3 and
4, the inhibition of miR-199a-3p
increased the production of lactate and a list of metabolic genes
regulated by miR-199a-3p was identified. Of these, two genes
(PTGS2, ARG2) were upregulated and 10 genes (PTGES,
DGAT1, PGK1, LADA, MCT1, TIGAR, LDHA, FATP4, VLDLR, RXRB) were
downregulated specifically. In clinical samples, the expression of
miR-199a-3p was clearly reduced in testicular germ cell tumors
compared with normal testicular tissue. The selected metabolic
genes, including LDHA, MCT1, PGK1 and TIGAR,
downregulated by miR-199a-3p in Netera-2 cells, were significantly
overexpressed in malignant testicular tumors, and the expression of
these genes was inversely correlated with the expression of
miR-199a-3p (Fig. 5; Table I). Among these four genes, a
significantly lower expression of both TIGAR and LDHA
was present in human embryonic kidney cells (HEK293) compared with
testicular tumor cells (Ntera-2), which is the opposite expression
signature compared with miR-199a-3p (Fig. 6). These results suggested that
miR-199a-3p may serve important roles in aerobic glycolysis and
tumorigenesis.
During aerobic glycolysis, the majority of the
pyruvate is converted into lactate in the cytoplasm by enzyme
lactate dehydrogenase (LDH). Lactate is subsequently secreted
outside of the cells by MCT1. Overexpression of MCT1 and LDHA (one
of the predominant LDH isoforms) has been reported in a variety of
solid tumor types, including colorectal, melanoma, breast and
pancreatic cancer (22–25). In order to determine what may
influence the expression levels of MCT1 or LDHA, several previous
studies have focused on examining certain factors, including
hypoxia, p53 status and chemotherapeutics (26,27).
Previously, a few studies have focused on the association between
glucose metabolism and miRNA regulation in tumors. For instance,
miR-124 is a direct regulator of MCT1 in medulloblastoma cells and
miR-375 is involved in regulation of lactate dehydrogenase B
(LDHB). The present study indicated that both LDHA and
MCT1 may be negatively regulated by miR-199a-3p in
testicular germ cell tumors.
The other selected gene in this metabolic qPCR array
screening is PGK1, one of the major glycolytic enzymes,
which catalyzes the conversion of 1,3-diphosphoglycerate to
3-phosphoglycerate. PGK1 has been previously demonstrated to be
associated with the HER-2/neu status in breast cancer (28) and a poor outcome for patients who
have lung adenocarcinoma and who are multi-drug resistant (29,30),
suggesting its potential as a biomarker for cancer. In lung cancer
cell lines, PGK1 was revealed to be regulated by miR-29a and the
present study has linked its expression to miR199a-3p in tumor
biology.
However, these four selected genes (LDHA, MCT1,
PGK1 and TIGAR) lack the potential recognition sites of
miR-199a-3p, meaning the regulation of miR-199a-3p on four genes is
not direct. Notably, the present study noticed that the potential
binding site of Sp1 was present in the promoter regions of all four
selected genes. In addition, it was predicted that miR-199a-3p can
bind to target sequences in the 3′-UTR of Sp1 mRNA by using
TargetScan analysis (Fig. 7). Sp1,
a member of Sp/Kruppel super family, is a ubiquitous transcription
factor that serves an important role in controlling the
transcription of numerous genes that contain GC boxes in their
promoters, particularly to those genes associated with the
metabolism of nucleic acids and biosynthesis (31,32).
Abnormal activation of Sp1 occurs in a wide variety of human tumor
types and high levels of Sp1 protein are considered a negative
prognostic factor (33,34). The present study speculated that
miR-199a-3p may downregulate the four metabolic genes through
Sp1.
In conclusion, the present study characterized the
role of miR-199a-3p in regulating the metabolism of Ntera-2 cells.
These results suggested that miR-199a-3p is a major metabolic
regulator in tumor suppression and miR-199a-3p may downregulate
metabolic genes (LDHA, PGK1, MCT1, TIGAR) through the
transcription factor Sp1. This led to the speculation that
downregulation of miR-199a-3p may be a potential cause of
overexpression of these metabolic genes and targeting miR-199a-3p
may be an innovative strategy in cancer treatment.
Acknowledgments
The present study was supported by the National
Natural Science Foundation of China (nos. 81270735 and
81372182).
References
|
1
|
Bartel DP: MicroRNAs: Genomics,
biogenesis, mechanism and function. Cell. 116:281–297. 2004.
View Article : Google Scholar : PubMed/NCBI
|
|
2
|
Lee RC, Feinbaum RL and Ambros V: The C.
elegans heterochronic gene lin-4 encoded small RNAs with antisense
complementarity to lin-14. Cell. 75:843–854. 1993. View Article : Google Scholar : PubMed/NCBI
|
|
3
|
Lewis BP, Burge CB and Bartel DP:
Conserved seed pairing, often flanked by adenosines, indicates that
thousands of human genes are microRNA targets. Cell. 120:15–20.
2005. View Article : Google Scholar : PubMed/NCBI
|
|
4
|
Huang Y, Shen XJ, Zou Q, Wang SP, Tang SM
and Zhang GZ: Biological functions of microRNAs: A review. J
Physiol Biochem. 67:129–139. 2011. View Article : Google Scholar
|
|
5
|
Di Leva G and Croce CM: miRNA profiling of
cancer. Curr Opin Genet Dev. 23:3–111. 2013. View Article : Google Scholar : PubMed/NCBI
|
|
6
|
Zhang B, Pan X, Cobb GP and Anderson TA:
MicroRNAs as oncogenes and tumor suppressors. Dev Biol. 302:1–12.
2007. View Article : Google Scholar
|
|
7
|
Garzon R, Calin GA and Croce CM: MicroRNAs
in cancer. Annu Rev Med. 60:167–179. 2009. View Article : Google Scholar : PubMed/NCBI
|
|
8
|
Di Leva G and Croce CM: Roles of small
RNAs in tumor formation. Trends Mol Med. 16:257–267. 2010.
View Article : Google Scholar : PubMed/NCBI
|
|
9
|
Bezan A, Gerger A and Pichler M: MicroRNAs
in testicular cancer: Implications for pathogenesis, diagnosis,
prognosis and therapy. Anticancer Res. 34:2709–2713.
2014.PubMed/NCBI
|
|
10
|
Voorhoeve PM, le Sage C, Schrier M, Gillis
AJ, Stoop H, Nagel R, Liu YP, van Duijse J, Drost J, Griekspoor A,
et al: A genetic screen implicates miRNA-372 and miRNA-373 as
oncogenes in testicular germ cell tumors. Cell. 124:1169–1181.
2006. View Article : Google Scholar : PubMed/NCBI
|
|
11
|
Chen BF, Gu S, Suen YK, Li L and Chan WY:
microRNA-199a-3p, DNMT3A, and aberrant DNA methylation in
testicular cancer. Epigenetics. 9:119–128. 2014. View Article : Google Scholar :
|
|
12
|
Rong Z, Li D and Liu X, Liu Z, Wu D and
Liu X: Screening for miRNAs and their potential targets in response
to TGF-β1 based on miRNA microarray and comparative proteomics
analyses in a mouse GC-1 spg germ cell line. Int J Mol Med.
35:821–828. 2015.PubMed/NCBI
|
|
13
|
Zhang Y, Fan KJ, Sun Q, Chen AZ, Shen WL,
Zhao ZH, Zheng XF and Yang X: Functional screening for miRNAs
targeting Smad4 identified miR-199a as a negative regulator of
TGF-β signalling pathway. Nucleic Acids Res. 40:9286–9297. 2012.
View Article : Google Scholar : PubMed/NCBI
|
|
14
|
Livak KJ and Schmittgen TD: Analysis of
relative gene expression data using real-time quantitative PCR and
the 2(-Delta Delta C(T)) method. Methods. 25:402–408. 2001.
View Article : Google Scholar
|
|
15
|
Xiao L, Hu Z, Dong X, Tan Z, Li W, Tang M,
Chen L, Yang L, Tao Y, Jiang Y, et al: Targeting epstein-barr virus
oncoprotein LMP1-mediated glycolysis sensitizes nasopharyngeal
carcinoma to radiation therapy. Oncogene. 33:4568–4578. 2014.
View Article : Google Scholar : PubMed/NCBI
|
|
16
|
Soga T: Cancer metabolism: Key players in
metabolic reprogramming. Cancer Sci. 104:275–281. 2013. View Article : Google Scholar : PubMed/NCBI
|
|
17
|
Han T, Kang D, Ji D, Wang X, Zhan W, Fu M,
Xin HB and Wang JB: How does cancer cell metabolism affect tumor
migration and invasion? Cell Adh Migr. 7:395–403. 2013. View Article : Google Scholar : PubMed/NCBI
|
|
18
|
Chan B, Manley J, Lee J and Singh SR: The
emerging roles of microRNAs in cancer metabolism. Cancer Lett.
356:301–308. 2015. View Article : Google Scholar
|
|
19
|
Brenner B, Hoshen MB, Purim O, David MB,
Ashkenazi K, Marshak G, Kundel Y, Brenner R, Morgenstern S, Halpern
M, et al: MicroRNAs as a potential prognostic factor in gastric
cancer. World J Gastroenterol. 17:3976–3985. 2011. View Article : Google Scholar : PubMed/NCBI
|
|
20
|
Wan D, He S, Xie B, Xu G, Gu W, Shen C, Hu
Y, Wang X, Zhi Q and Wang L: Aberrant expression of miR-199a-3p and
its clinical significance in colorectal cancers. Med Oncol.
30:3782013. View Article : Google Scholar : PubMed/NCBI
|
|
21
|
Feber A, Xi L, Pennathur A, Gooding WE,
Bandla S, Wu M, Luketich JD, Godfrey TE and Litle VR: MicroRNA
prognostic signature for nodal metastases and survival in
esophageal adenocarcinoma. Ann Thorac Surg. 91:1523–1530. 2011.
View Article : Google Scholar : PubMed/NCBI
|
|
22
|
Le Floch R, Chiche J, Marchiq I, Naiken T,
Ilc K, Murray CM, Critchlow SE, Roux D, Simon MP and Pouysségur J:
CD147 subunit of lactate/H+ symporters MCT1 and hypoxia-inducible
MCT4 is critical for energetics and growth of glycolytic tumors.
Proc Natl Acad Sci USA. 108:16663–16668. 2011. View Article : Google Scholar : PubMed/NCBI
|
|
23
|
Pinheiro C, Albergaria A, Paredes J, Sousa
B, Dufloth R, Vieira D, Schmitt F and Baltazar F: Monocarboxylate
transporter 1 is up-regulated in basal-like breast carcinoma.
Histopathology. 56:860–867. 2010. View Article : Google Scholar : PubMed/NCBI
|
|
24
|
Miranda-Gonçalves V, Honavar M, Pinheiro
C, Martinho O, Pires MM, Pinheiro C, Cordeiro M, Bebiano G, Costa
P, Palmeirim I, et al: Monocarboxylate transporters (MCTs) in
gliomas: Expression and exploitation as therapeutic targets. Neuro
Oncol. 15:172–188. 2013. View Article : Google Scholar :
|
|
25
|
Pinheiro C, Longatto-Filho A,
Azevedo-Silva J, Casal M, Schmitt FC and Baltazar F: Role of
monocarboxylate transporters in human cancers: State of the art. J
Bioenerg Biomembr. 44:127–139. 2012. View Article : Google Scholar : PubMed/NCBI
|
|
26
|
Walters DK, Arendt BK and Jelinek DF:
CD147 regulates the expression of MCT1 and lactate export in
multiple myeloma cells. Cell Cycle. 12:3175–3183. 2013. View Article : Google Scholar : PubMed/NCBI
|
|
27
|
Feng L, E LL, Soloveiv MM, Wang DS, Zhang
B, Dong YW and Liu HC: Synergistic cytotoxicity of cisplatin and
Taxol in overcoming Taxol resistance through the inhibition of LDHA
in oral squamous cell carcinoma. Oncol Lett. 9:1827–1832.
2015.PubMed/NCBI
|
|
28
|
Zhang D, Tai LK, Wong LL, Chiu LL, Sethi
SK and Koay ES: Proteomic study reveals that proteins involved in
metabolic and detoxification pathways are highly expressed in
her-2/neu-positive breast cancer. Mol Cell Proteomics. 4:1686–1696.
2005. View Article : Google Scholar : PubMed/NCBI
|
|
29
|
Chen G, Gharib TG, Wang H, Huang CC, Kuick
R, Thomas DG, Shedden KA, Misek DE, Taylor JM, Giordano TJ, et al:
Protein profiles associated with survival in lung adenocarcinoma.
Proc Natl Acad Sci USA. 100:13537–13542. 2003. View Article : Google Scholar : PubMed/NCBI
|
|
30
|
Duan Z, Lamendola D, Yusuf R, Penson R,
Preffer F and Seiden M: Overexpression of human phosphoglycerate
kinase 1 (PGK1) induces a multidrug resistance phenotype.
Anticancer Res. 22:1933–1941. 2002.PubMed/NCBI
|
|
31
|
Li L, He S, Sun JM and Davie JR: Gene
regulation by Sp1 and Sp3. Biochem Cell Biol. 82:460–471. 2004.
View Article : Google Scholar : PubMed/NCBI
|
|
32
|
Solomon SS, Majumdar G, Martinez-Hernandez
A and Raghow R: A critical role of Sp1 transcription factor in
regulating gene expression in response to insulin and other
hormones. Life Sci. 83:305–312. 2008. View Article : Google Scholar : PubMed/NCBI
|
|
33
|
Safe S and Abdelrahim M: Sp transcription
factor family and its role in cancer. Eur J Cancer. 41:2438–2448.
2005. View Article : Google Scholar : PubMed/NCBI
|
|
34
|
Vizcaíno C, Mansilla S and Portugal J: Sp1
transcription factor: A long-standing target in cancer
chemotherapy. Pharmacol Ther. 152:111–124. 2015. View Article : Google Scholar : PubMed/NCBI
|