Introduction
Uncontrolled proliferation is a hallmark of cancer
cell behavior (1), with
morphological manifestations in vitro in cell culture and
in vivo during tumor proliferation, invasion and metastasis.
During in vitro cell culture, cell proliferation lead to the
formation of cell clones. The clone formation rate and
morphological characteristics can reflect the biological behavior
of cancer cells (2–4).
Ki67, a cell-cycle-related non-histone and a common
predictive index of cell proliferation, is expressed during all
cell cycle phases except for the G0 phase (5), particularly in breast cancer, stomach
cancer, colon cancer, lung cancer, liver cancer, lymphoma and other
malignant tumors (6,7). Quantum dots (QDs), are novel
fluorescent nano-particles with unique properties (8–10),
including broad and continuous excitation spectra, narrow and
symmetrical emission spectra, strong brightness, high
photostability and a long fluorescence lifetime. The QD-based
molecular probe technique has a distinct advantage for
investigating the characteristics of tumor growth and invasion
compared with fluorescent proteins or organic dyes, including size
tunable light emission, enhanced signal brightness and resistance
to photo bleaching (11,12). Cell clone formation assays are an
important technical method for detecting cancer cell proliferation
potential, invasiveness and susceptibility to hazardous factors
(13). The present study focused
on three common cancer cell lines, MCF-7 breast cancer cells, SW480
colon cancer cells and SGC7901 gastric cancer cells. These cells
were used to detect the distribution and expression of Ki67 after
the cell clone formation assay using the QD-based molecular probe
technique. This in vitro study was designed to simulate the
early stages of tumor formation, in order to investigate cancer
cell growth and the proliferation.
Materials and methods
Cell culture
The MCF-7, SW480 and SGC7901 cells were obtained
from the stock from the Medical Research Center, Zhongnan Hospital
of Wuhan University (Wuhan, China). MCF-7 cells were cultured in
Dulbecco's modified Eagle's medium (DMEM)/high glucose (HyClone,
Logan, UT, USA) supplemented with 10% fetal bovine serum (FBS;
Zhejiang Tianhang Biotechnology Co., Ltd., Huzhou, China) and 1%
penicillin/streptomycin (HyClone). SW480 cells and SGC7901 cells
were cultured in RPMI-1640 (HyClone) supplemented with 10% FBS and
1% penicillin/streptomycin. Cells were incubated in a humidified
atmosphere of 95% air and 5% CO2 at a constant
temperature of 37°C.
Cell clone formation assay
Tumor cells were digested by 0.25% trypsin/0.02%
EDTA solution at the logarithmic phase to make a single-cell
suspension with culture medium. Then, a cell counting chamber wsa
sued to calculate the number of cells in a 10 µl single-cell
suspension under an inverted microscope. The cells were then
delivered into six-well culture plates containing a sterile glass
cover-slip in each well, with 500–1,000 cells added to each well.
The medium was refreshed every 3 days until cell clones could be
observed with the naked eye.
Immunostaining
This study followed the previously described
QD-based fluorescent immunostaining protocols for histological and
cytological studies with slight modifications (14–17).
Briefly, the cells on the glass coverslips were fixed with 4%
paraformaldehyde after washing with phosphate-buffered saline (PBS,
pH 7.2–7.4; Bioyear Beijing Medical System Co., Ltd., Beijing,
China). Bovine serum albumin (BSA, Biosharp, Wuhan, China), serving
as a blocking buffer, was added and the cells were cultured for 30
min at 37°C. Then, cells were stained with monoclonal mouse
anti-pan-cytokeratin (CK) (cat. no. JY-0077, Jiayuan Quantum Dots
Co. Ltd., Wuhan, China, dilution 1:25 for MCF-7 cells, 1:50 for
SW480 cells, 1:25 for SGC7901 cells) and rabbit anti-Ki67 (cat. no.
JY-0047, Jiayuan Quantum Dots Co. Ltd.; dilution 1:100 for MCF-7
cells, 1:250 for SW480 cells, 1:100 for SGC7901 cells). The
secondary antibodies were QDs-525 goat F (ab′) 2 anti-mouse IgG
conjugate (Invitrogen; Thermo Fisher Scientific, Inc., Waltham, MA,
USA; dilution 1:200, emitting green light at wavelength 525 nm),
QDs-585 goat F (ab′) 2 anti-rabbit IgG conjugate (cat. no.
Q-11411MP; Invitrogen; Thermo Fisher Scientific, Inc.; dilution
1:200, emitting yellow light at wavelength 585 nm) and QDs-605 goat
F (ab′) 2 anti-rabbit IgG conjugate (cat. no. QM 605; Jiayuan
Quantum Dots Co. Ltd.; dilution 1:100, emitting red light at
wavelength 605 nm). primary antibodies at 4°C overnight and then
with secondary antibodies at 37°C for 2 h. The cover-slips were
finally mounted on glass slides. The primary antibodies were as
follows: Monoclonal mouse anti-pan-cytokeratin (CK) (cat. no.
JY-0077, Jiayuan Quantum Dots Co. Ltd. dilution 1/25 for MCF-7
cells, 1/50 for SW480 cells, 1/25 for SGC7901 cells) and rabbit
anti-Ki67 (JY-0047, Jiayuan Quantum Dots Co. Ltd. dilution 1/100
for MCF-7 cells, 1/250 for SW480 cells, 1/100 for SGC7901 cells).
The secondary antibodies were QDs-525 goat F (ab′) 2 anti-mouse IgG
conjugate (Invitrogen, Thermo Fisher Scientific, Inc., Waltham, MA,
USA; dilution 1/200, emitting green light at wavelength 525 nm),
QDs-585 goat F (ab′) 2 anti-rabbit IgG conjugate (Invitrogen,
Thermo Fisher Scientific, Inc.; dilution 1/200, emitting yellow
light at wavelength 585 nm) and QDs-605 goat F (ab′) 2 anti-rabbit
IgG conjugate (Jiayuan, China; dilution 1/100, emitting red light
at wavelength 605 nm).
Image acquisition and evaluation
The QD-stained slides were observed under an Olympus
BX51 fluorescence microscope equipped with an Olympus DP72 camera
(Olympus Optical Co., Ltd., Tokyo, Japan) and CRi Nuance
multi-spectral imaging system (Cambridge Research &
Instrumentation, Inc., Woburn, MA, USA), at the excitation
wavelength of 330–385 nm by ultraviolet light. A spectral cube for
each slide was captured by CRi Nuance systems under the same
conditions at low magnification (×20). The QD fluorescent signal
for each cube was analyzed by CRi Nuance software package according
to the manufacturer's instructions. The quantified fluorescence
signals of Ki67 and pan-CK were calculated based on spectral
unmixing. The ratio of Ki67 total fluorescence signal values to
pan-CK total fluorescence signal values was regarded as the average
expression intensity of Ki67. The quantified fluorescence signals
of pan-CK were used to define the total number of cancer cells in
clones. The clones were divided into three types based on the cell
number in each clone, including small clones containing 14–49
cells, medium clones containing 50–100 cells, and large clones
containing >100 cells.
Statistical analysis
Values are expressed as the medium for the average
expression intensity of Ki67 in three types of cancer cells and in
different sized clones, and a χ2 test was used for
statistical analysis by SPSS 19.0 software package (IBM, Armonk,
NY, USA). P<0.05 was considered to indicate a statistically
significant difference.
Results
Cell clone formation assay
After cell culture on days 6, 8 and 12, the MCF-7,
SW480 and SGC7901 cells formed visible clones. According to the
definition that cell cluster size >50 µm in diameter
could be considered as a cell clone (18), a total of 119, 123 and 120 clones
were identified for MCF-7, SW480 and SGC7901 cells,
respectively.
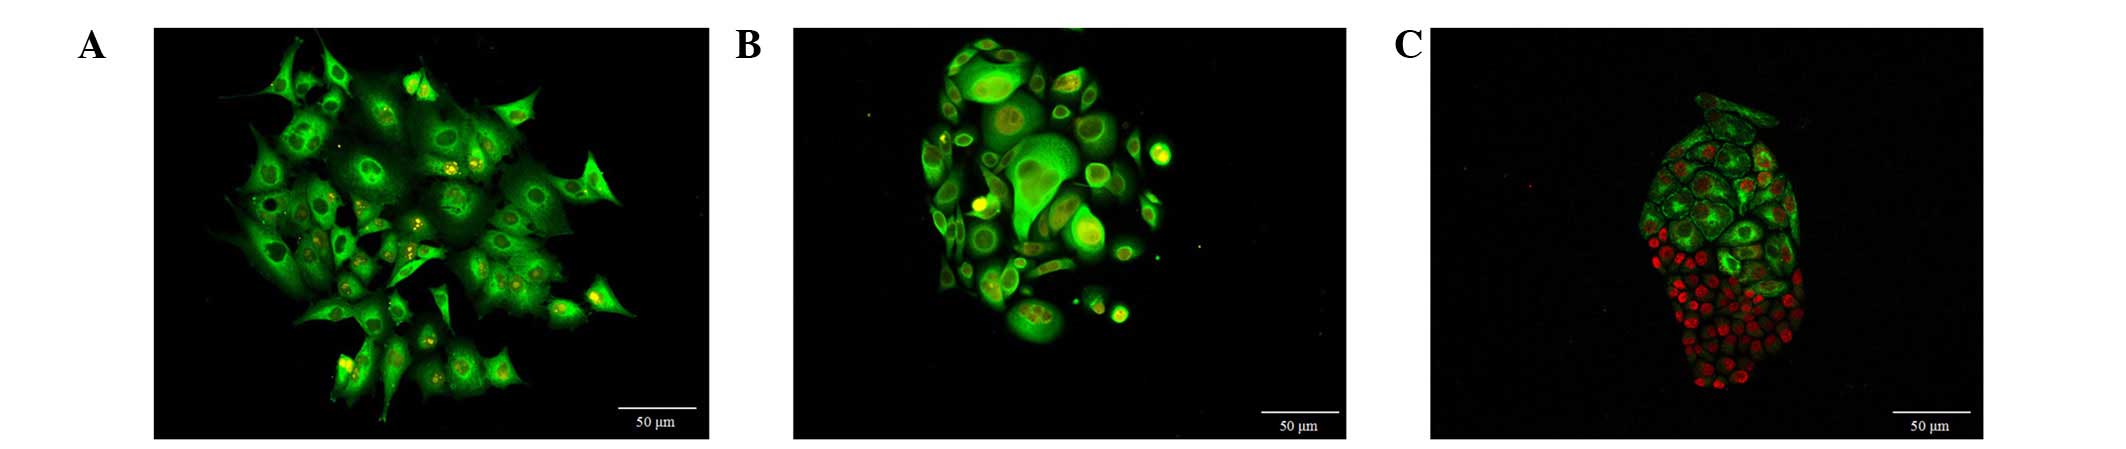
Heterogeneous morphology of cell
clones
As shown in Fig. 1,
multiple morphological features of cells in different clones could
be observed. The MCF-7 cells in clones were spindle, triangular and
various other irregular shapes (Fig.
1A). SW480 cells appeared as spindle, circular and irregular
shapes (Fig. 1B), and SGC7901
cells were polygonal and spindle-shaped (Fig. 1C). These three types of cells had
heterogeneous morphologies and cells ranged in size. Large cells
were always located in the center or on one side of the clones,
whereas, the cells at the periphery of the clones were smaller and
were actively dividing. It was common to observe large
nuclear:cytoplasmic ratios, pathological mitotic features, and
multiple nuclei and nucleoli. Cells at the clone periphery were
also observed to form several outstretching pseudopodia.
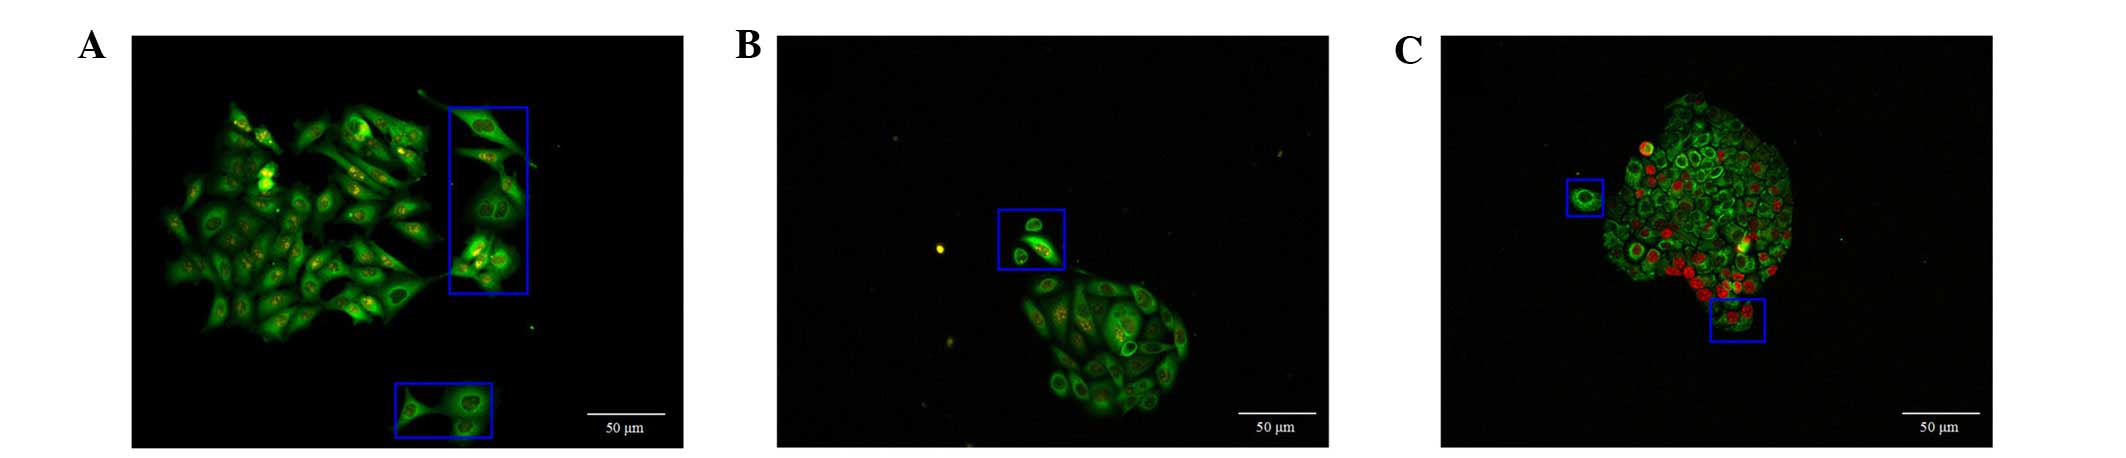
Discrete tendency of cell clones
In the majority of the cell clones, the peripheral
cancer cells exhibited outstretched pseudopodia, whereas the
remaining cells tended to deviate from the cancer cell clones and
proliferate separately (Fig.
2).
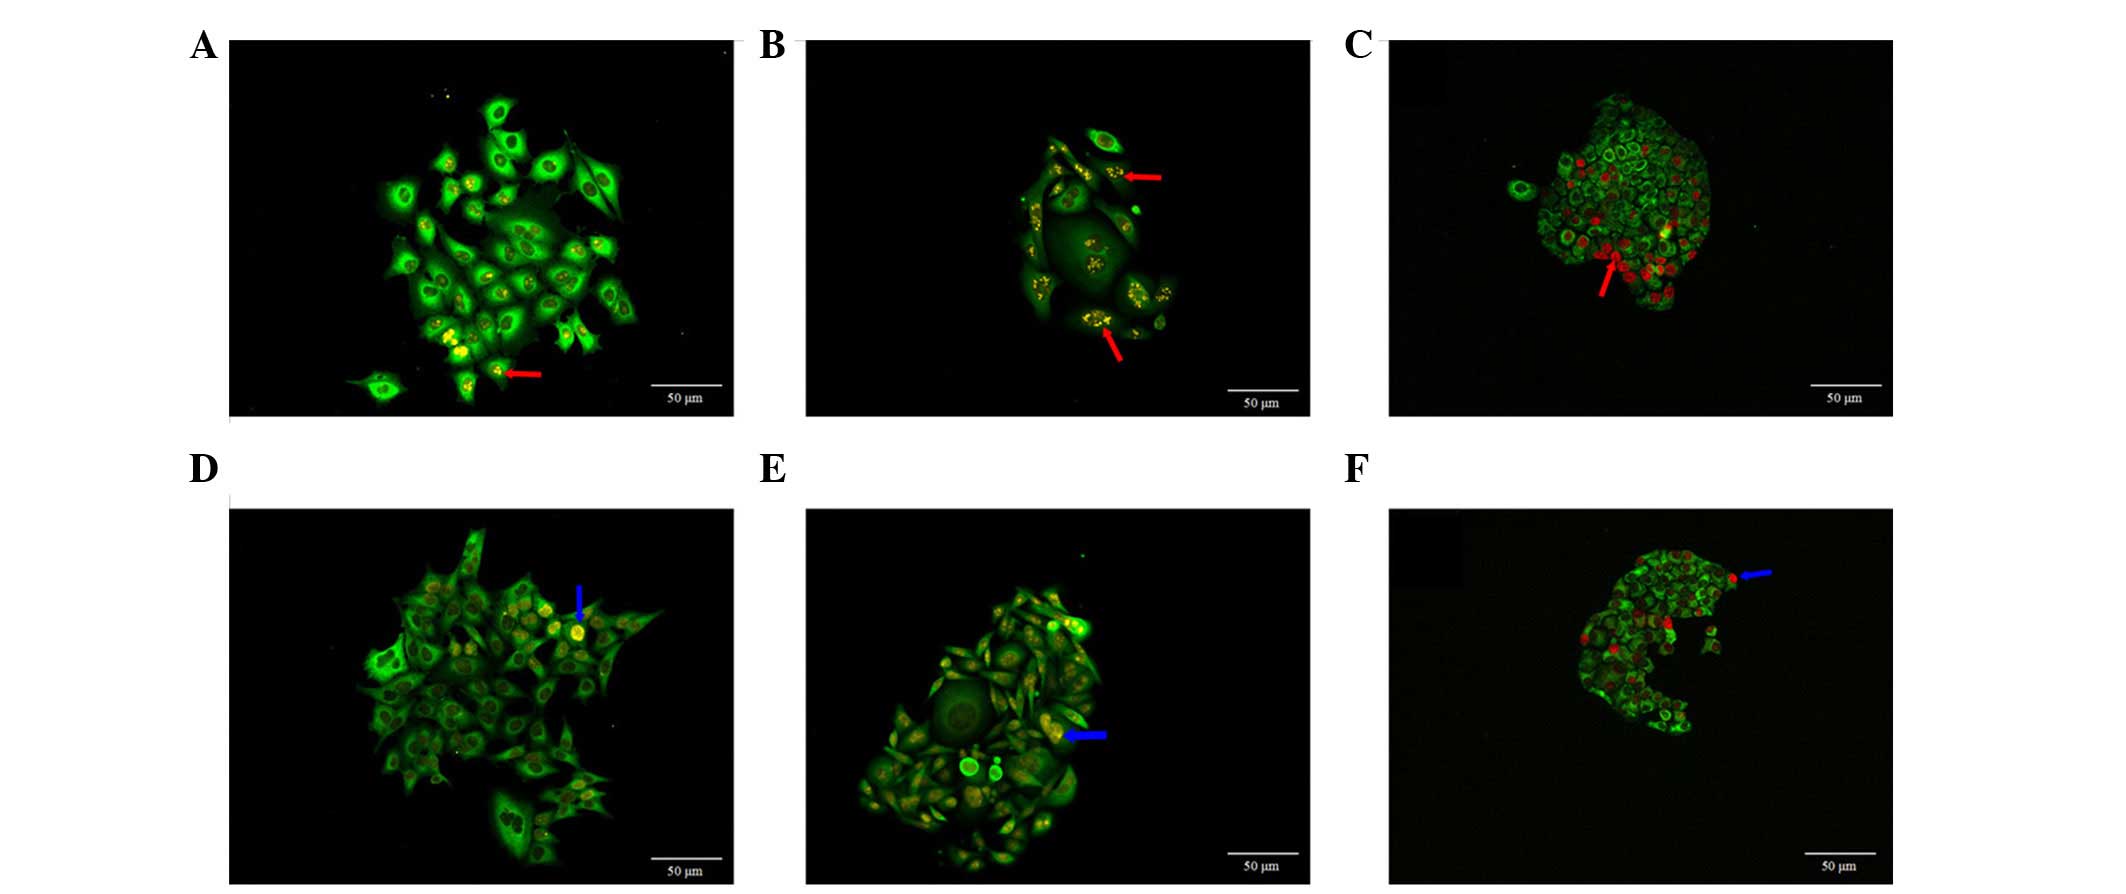
Ki67 expression and distribution in cell
clones
CRi Nuance multi-spectral imaging system was used to
obtain fluorescent signals of QDs, in which, yellow or red
fluorescent signals represented the Ki67 expression in the cell
nucleus. Ki67 expression in MCF-7 cells showed different sizes of
clumps, predominantly on one side of cell nucleus (Fig. 3A). In the majority of the SW480
cells (Fig. 3B) and SGC7901 cells
(Fig. 3C), Ki67 protein tended to
form clumps, which were evenly distributed in the cell nucleus.
Ki67 expression in these three types of cells also showed
homogeneous distribution in the cell nucleus (Fig. 3D–F).
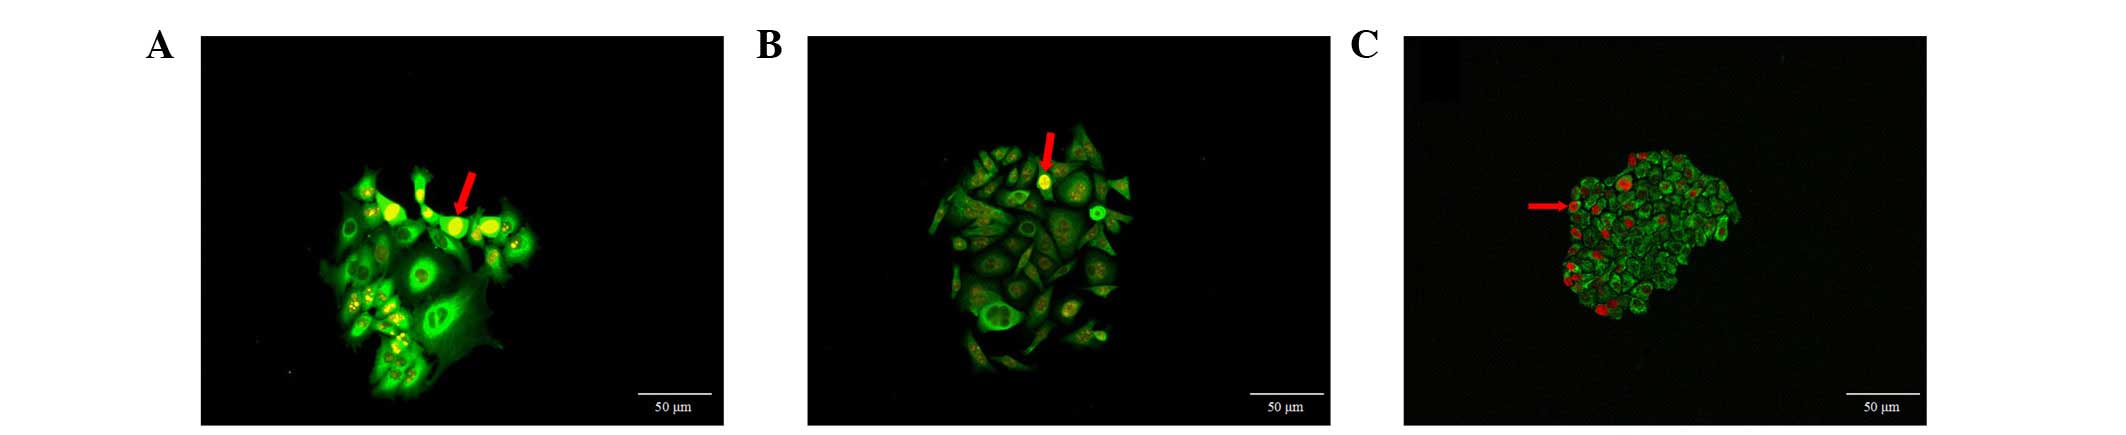
Distribution of cells with strong Ki67
expression
Ki67 was widely expressed in the three cancer cell
types. The cells with strong Ki67 expression were distributed at
the periphery of the clones or on one side of cell clones (Fig. 4). These cells presented two types
of distribution, dispersed and aggregated, the second type forming
cell clusters. However, there were only a small number of clones in
which all cells showed strong Ki67 expression. These results
demonstrate the asymmetry and asynchronism of cell proliferation in
cell clones, with a portion of dominant cells showing active
proliferation potential.
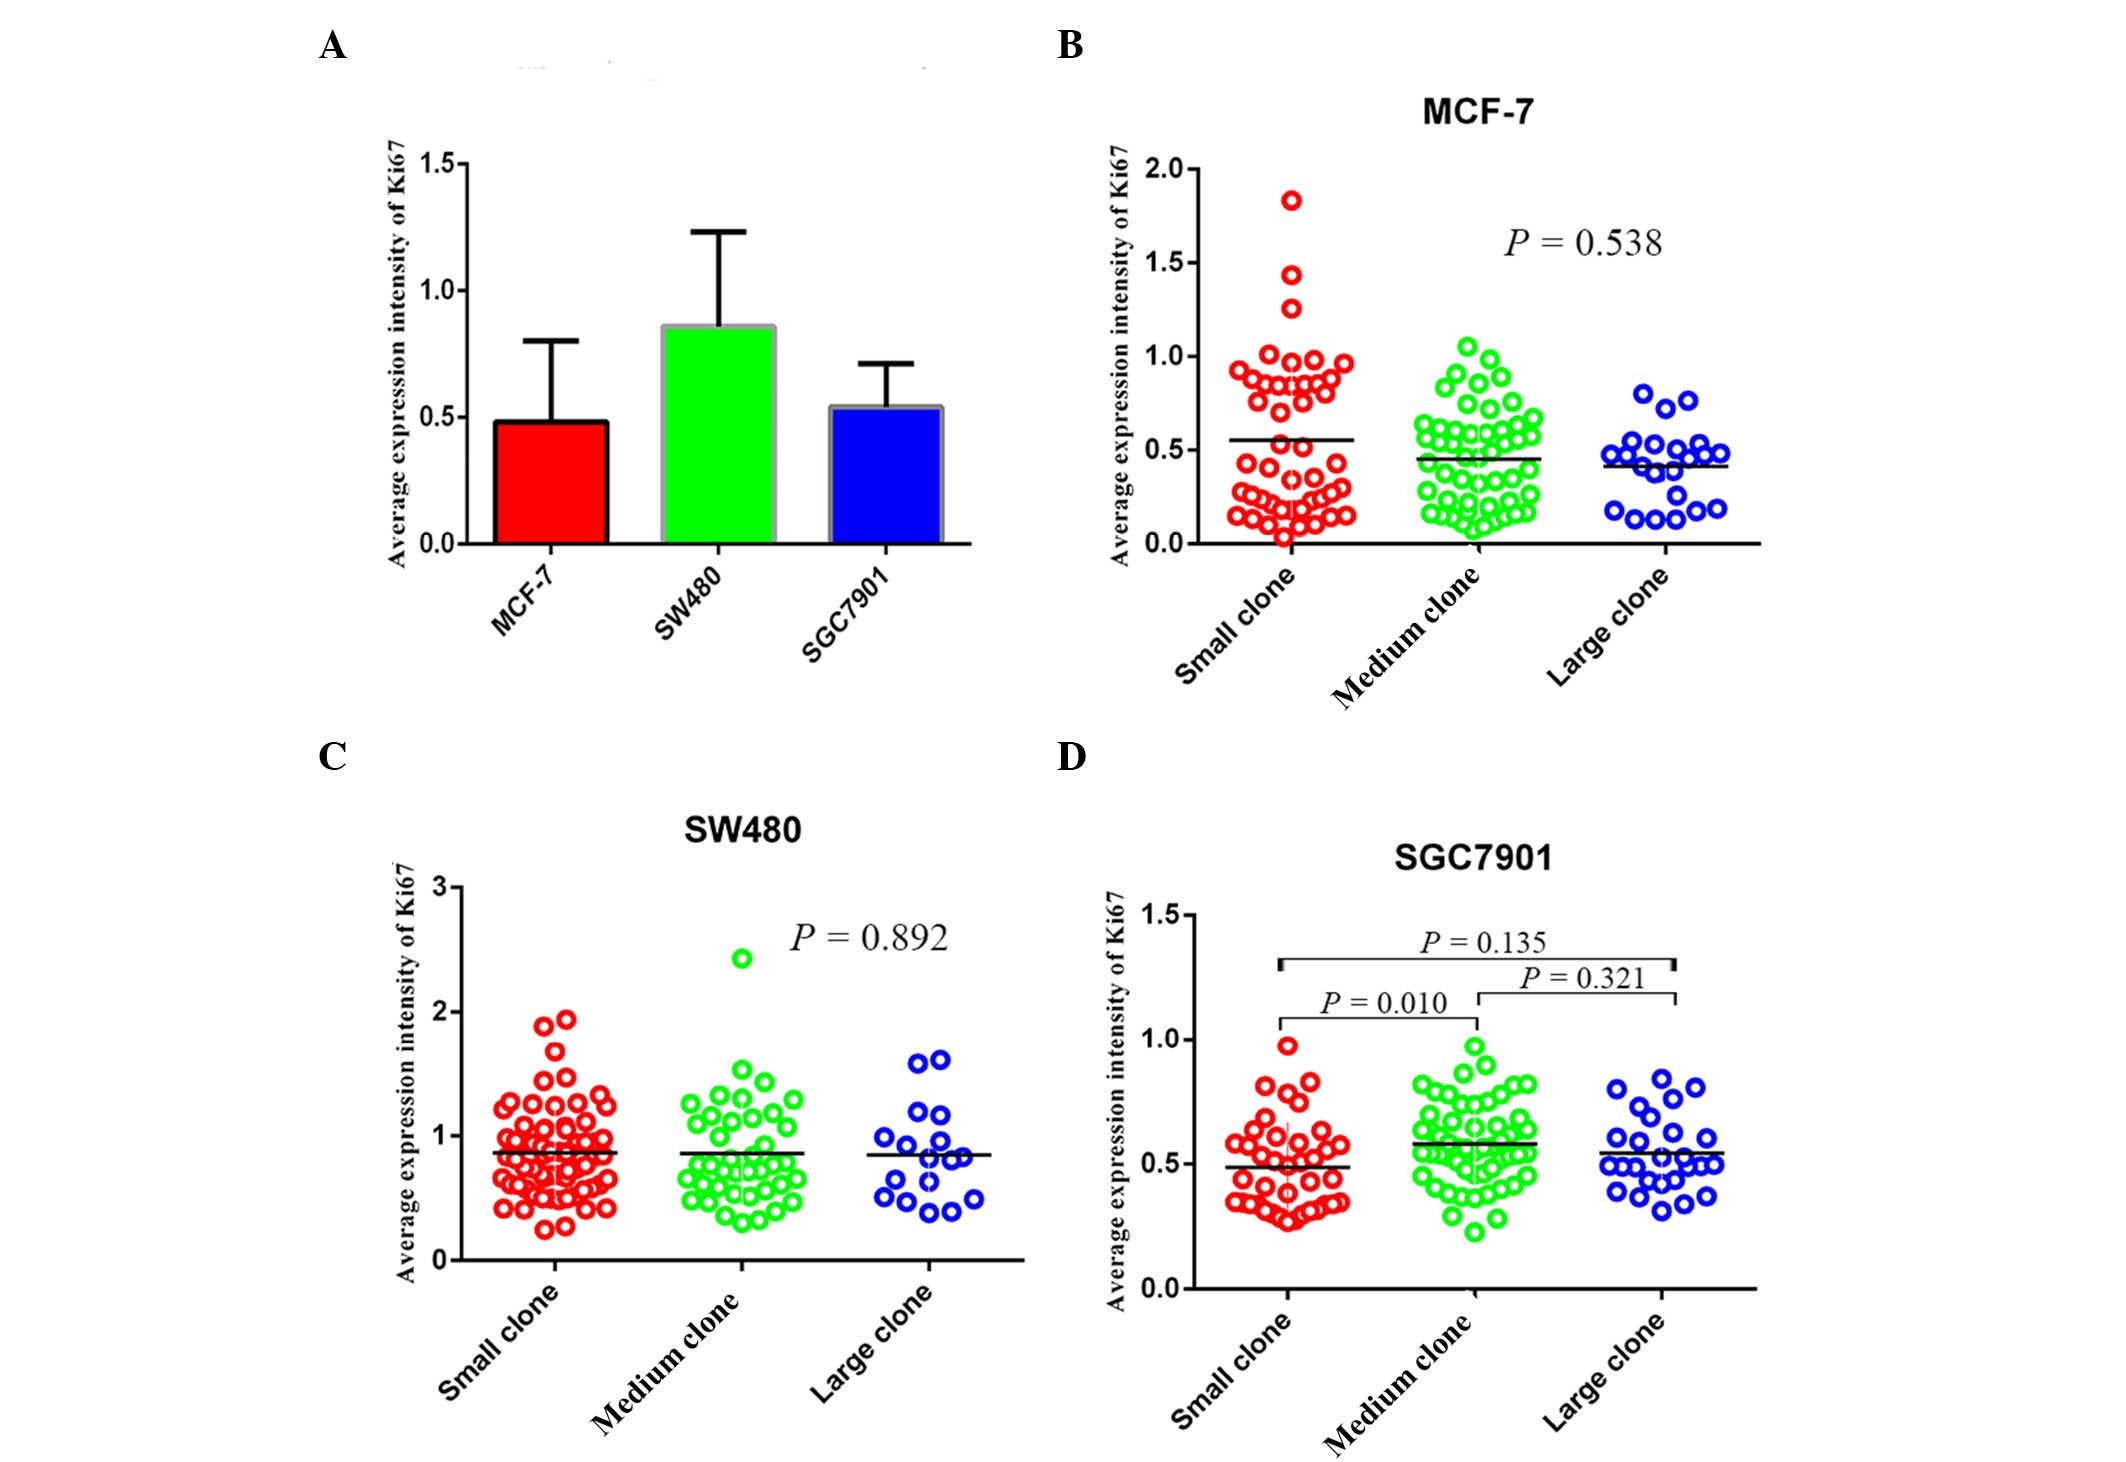
Average expression intensity of Ki67 in
the three cancer cell types
According to the statistical analysis, the mean
expression intensity of Ki67 in MCF-7, SW480 and SGC7901 cells was
0.433 (0.036, 1.833), 0.810 (0.246, 2.428) and 0.532 (0.227,
0.974), respectively (Fig. 5A).
The mean expression intensity of Ki67 in small, medium and large
clones of MCF-7 cells was 0.429 (0.036, 1.833), 0.459 (0.072,
1.052) and 0.455 (0.128, 0.801), no significant difference was
identified among the three groups (P>0.05; Fig. 5B). For SW480 cells, the
corresponding values were 0.836 (0.246, 1.939), 0.764 (0.301,
2.428) and 0.820 (0.381, 1.608), again no significant difference
was identified among the three groups (P>0.05; Fig. 5C). By contrast in SGC7901 cells,
the mean expression intensity of Ki67 in small, medium, large
clones were 0.440 (0.268, 0.974), 0.562 (0.227, 0.972) and 0.512
(0.312, 0.840), and a significant difference was identified between
the expression in the small and medium clones (P<0.05; Fig. 5D).
Discussion
Clone formation assays are a widely used technique
to investigate cell proliferation and invasion (19). QDs are novel fluorescent
nano-particles, which have shown great potential in diagnosis and
treatment, for example in vivo and in vitro imaging
and drug delivery (20–22). In the present study, a cell clone
formation assay was applied to simulate tumor development and
progression in vitro, and this was analyzed using
proliferating cell nuclear antigen Ki67 and pan-CK marked by
different QD-conjugated probes. With the aid of QD-based molecular
targeted imaging techniques, cell clone formation could be used to
demonstrate the distribution and expression of Ki67 in different
types of cancer cells, and reveal the clonal growth behavior and
proliferation characteristics of the cancer cells.
Traditional double-color fluorescent imaging
techniques mark different cellular components separately and use
image merging technology to compose a full image of the cell;
however, this can not implement in situ, simultaneous or
synchronous images of multiple cellular components, leading to
errors in the integrity and completeness of cell image information
(23,24). By contrast, the present study took
advantage of the in situ, synchronous, double-color imaging
technique which utilizes QD-based molecular probes. It was able to
capture the morphology of cancer cells in situ and
simultaneously revealed Ki67 expression and distribution in the
nucleus and pan-CK expression in the cytoplasm. Furthermore, this
information could be analyzed under CRi Nuance multi-spectral
imaging systems to output the quantitative data of Ki67 and pan-CK
expression in cancer cell clones, which indicated the effects of
proliferation behavior of each type of cancer cell during the
formation and development of whole clones.
Ki67, a cell-cycle-related non-histone, is expressed
at all cell cycle phases except for the G0 phase
(5). In this study, Ki67 protein
tended to form clumps in MCF-7 cells, which were evenly distributed
in the cell nucleuss, predominantly located on one side of the cell
nucleus. In the majority of the SW480 and SGC7901 cells, Ki67
presented different sizes of clumps evenly distributed in the cell
nucleus, which is consistent with the results of Scholzen and
Gerdes (5), which demonstrated
that Ki67 formed clumps during interphase, and was evenly
distributed in the nucleus during mitosis. Cells to undergo mitosis
had higher Ki67 expression levels. In addition, the tumor
proliferation index (25), a
traditional index of clinical pathology, could be represented by
the ratio of Ki67 positive cells to the total number of cancer
cells. In this study, the ratio of Ki67 total fluorescence signal
values to pan-CK total fluorescence signal values was regarded as
the average Ki67 expression intensity, which was 0.433 (0.036,
1.833), 0.810 (0.246, 2.428) and 0.532 (0.227, 0.974),
respectively, in MCF-7, SW480 and SGC7901 cells. The average Ki67
expression intensity was highest in the SW480 cells and
Ki67-positive cells were undergoing mitosis according to the
research of Scholzen and Gerdes (5). SGC7901 cells had the second highest
intensity level. The MCF-7 cells had the lowest intensity level,
which indicated the Ki67 positive cells in MCF-7 cells clones were
primarily in the interphase stage of cell division. These points
indicated the average expression intensity of Ki67 could reflect
cancer cell division and proliferation, and could be considered as
a proliferation index of cancer cells.
Brabletz et al (26) reported that colon cancer cells may
exhibit cell de-differentiation in the invasive front area, with
loss of an epithelial phenotype and the gain of a mesenchymal
phenotype, which could facilitate the invasion and metastasis of
tumor cells. Numerous other tumors also showed these
characteristics (26–28). The over-expression of nuclear Ki67
in the invasive front area in breast cancer was positively
associated with bone and liver metastasis (29). In the present study, in these three
types of cancer cell clones, the cells with strong Ki67 expression
were distributed at the clone periphery or at one side of the cell
clones. In addition, in the majority of the cell clones, the cancer
cells with outstretching pseudopodia were separated from clones or
showed a tendency of discretion. These phenomena indicated that the
cancer cells at the clone periphery exhibit greater proliferative
and invasive activity. Thus, cell clone formation assays was an
efficient method to simultaneously study proliferative and invasive
characteristics of tumor cells.
In conclusion, this study adopted a QD-based
molecular targeted imaging technique, simultaneously showing the
morphological characteristics of cancer cells and cell
proliferation in the process of cancer cell clone formation in
situ, which demonstrated that cancer cell proliferation was
asymmetric and unsynchronized. The phenomenon that cancer cells
within clones that had heterogeneity determined that cancer cells
had uncontrollable and in-coordinate proliferative features
(30). Additionally, this
suggested that there is theoretical feasibility and technical
possibility to develop a differentiation strategy which may allow
for the control and coordination of cancer cells.
Acknowledgments
This study was supported by the Key Project of
Natural Science Foundation of China (grant no. 81230031/H18), the
Youth Project of Natural Science Foundation of China (grant no.
8140110827/H1606) and the Key Project of the Fundamental Research
Fund for the Central Universities (grant no. 303274028).
References
|
1
|
Dowsett M, Nielsen TO, A'Hern R, Bartlett
J, Coombes RC, Cuzick J, Ellis M, Henry NL, Hugh JC, Lively T, et
al: Assessment of Ki67 in breast cancer: Recommendations from the
international Ki67 in breast cancer working group. J Natl Cancer
Inst. 103:1656–1664. 2011. View Article : Google Scholar : PubMed/NCBI
|
|
2
|
Soltysova A, Altanerova V and Altaner C:
Cancer stem cells. Neoplasma. 52:435–440. 2005.PubMed/NCBI
|
|
3
|
Franken NA, Rodermond HM, Stap J, Haveman
J and van Bree C: Clonogenic assay of cells in vitro. Nat Protoc.
1:2315–2319. 2006. View Article : Google Scholar
|
|
4
|
Munshi A, Hobbs M and Meyn RE: Clonogenic
cell survival assay. Methods Mol Med. 110:21–28. 2005.PubMed/NCBI
|
|
5
|
Scholzen T and Gerdes J: The Ki-67
protein: From the known and the unknown. J Cell Physiol.
182:311–322. 2000. View Article : Google Scholar : PubMed/NCBI
|
|
6
|
He X, Chen Z, Fu T, Jin X, Yu T, Liang Y,
Zhao X and Huang L: Ki-67 is a valuable prognostic predictor of
lymphoma but its utility varies in lymphoma subtypes: evidence from
a systematic meta-analysis. BMC Cancer. 14:1532014. View Article : Google Scholar : PubMed/NCBI
|
|
7
|
Wang LW, Qu AP, Liu WL, Chen JM, Yuan JP,
Wu H, Li Y and Liu J: Quantum dots-based double imaging combined
with organic dye imaging to establish an automatic computerized
method for cancer Ki67 measurement. Sci Rep. 6:205642016.
View Article : Google Scholar : PubMed/NCBI
|
|
8
|
Weng KC, Nobel CO,
Papahadjopolous-Sternberg B, Chen FF, Drummond DC, Kirpotin DB,
Wang D, Hom YK, Hann B and Park JW: Targeted tumor cell
internalization and imaging of multifunctional quantum
dot-conjugated immunoposomes in vitro and in vivo. Nano Lett.
8:2851–2857. 2008. View Article : Google Scholar : PubMed/NCBI
|
|
9
|
Gokarna A, Jin LH, Hwang JS, Cho YH, Lim
YT, Chung BH, Youn SH, Choi DS and Lim JH: Quantum dot-based
protein micro- and nanarrays for detection of prostate cancer
biomarkers. Proteomics. 8:1809–1818. 2008. View Article : Google Scholar : PubMed/NCBI
|
|
10
|
Chen LD, Liu J, Yu XF, He M, Pei XF, Tang
ZY, Wang QQ, Pang DW and Li Y: The biocompatibility of quantum dot
probes used for the targeted imaging of hepatocellular carcinoma
metastasis. Biomaterials. 29:4170–4176. 2008. View Article : Google Scholar : PubMed/NCBI
|
|
11
|
Chen C, Xia HS, Gong YP, Peng J, Peng CW,
Hu MB, Zhu XB, Pang DW, Sun SR and Li Y: The quantitative detection
of total HER2 load by quantum dots and the identification of a new
subtype of breast cancer with different 5-year prognosis.
Biomaterials. 31:8818–8825. 2010. View Article : Google Scholar : PubMed/NCBI
|
|
12
|
Peng CW, Liu XL, Chen C, Liu X, Yang XQ,
Pang DW, Zhu XB and Li Y: Patterns of cancer invasion revealed by
QDs-based quantitative multiplexed imaging of tumor
microenvironment. Biomaterials. 32:2907–2917. 2011. View Article : Google Scholar : PubMed/NCBI
|
|
13
|
Hamburger AW and Salmon SE: Primary
bioassay of human tumor stem cells. Science. 197:461–463. 1997.
View Article : Google Scholar
|
|
14
|
Chen C, Peng J, Xia HS, Yang GF, Wu QS,
Chen LD, Zeng LB, Zhang ZL, Pang DW and Li Y: Quantum dots-based
immunofluorescence technology for the quantitative determination of
HER2 expression in breast cancer. Biomaterials. 30:2912–2918. 2009.
View Article : Google Scholar : PubMed/NCBI
|
|
15
|
Chen C, Sun SR, Gong YP, Qi CB, Peng CW,
Yang XQ, Liu SP, Peng J, Zhu S, Hu MB, et al: Quantum dots-based
molecular classification of breast cancer by quantitative
spectroanalysis of hormone receptors and HER2. Biomaterials.
32:7592–7599. 2011. View Article : Google Scholar : PubMed/NCBI
|
|
16
|
Fang M, Yuan JP, Peng CW, Pang DW and Li
Y: Quantum dots-based in situ molecular imaging of dynamic changes
of collagen IV during cancer invasion. Biomaterials. 34:8708–8717.
2013. View Article : Google Scholar : PubMed/NCBI
|
|
17
|
Wang FB, Rong Y, Fang M, Yuan JP, Peng CW,
Liu SP and Li Y: Recognition and capture of metastatic
hepatocellular carcinoma cells using aptamer-conjugated quantum
dots and magnetic particles. Biomaterials. 34:3816–3827. 2013.
View Article : Google Scholar : PubMed/NCBI
|
|
18
|
Li X, Pan Y, Fan R, Jin H, Han S, Liu J,
Wu K and Fan D: Adenovirus-delivered CIAPIN1 small interfering RNA
inhibits HCC growth in vitro and in vivo. Carcinogenesis.
29:1587–1593. 2008. View Article : Google Scholar : PubMed/NCBI
|
|
19
|
Plumb JA: Cell sensitivity assays:
Clonogenic assay. Methods Mol Med. 88:159–164. 2004.
|
|
20
|
Frangioni JV: New technologies for human
cancer imaging. J Clin Oncol. 26:4012–4021. 2008. View Article : Google Scholar : PubMed/NCBI
|
|
21
|
Kim J, Piao Y and Hyeon T: Multifunctional
nanostructured materials for multimodal imaging, and simultaneous
imaging and therapy. Chem Soc Rev. 38:372–390. 2009. View Article : Google Scholar : PubMed/NCBI
|
|
22
|
Hong H, Zhang Y, Sun J and Cai W:
Molecular imaging and therapy of cancer with radiolabeled
nanoparticles. Nano Today. 4:399–413. 2009. View Article : Google Scholar :
|
|
23
|
Peng CW, Tian Q, Yang GF, Fang M, Zhang
ZL, Peng J, Li Y and Pang DW: Quantum-dots based simultaneous
detection of multiple biomarkers of tumor stromal features to
predict clinical outcomes in gastric cancer. Biomaterials.
33:5742–5752. 2012. View Article : Google Scholar : PubMed/NCBI
|
|
24
|
Resch-Genger U, Grabolle M,
Cavaliere-Jaricot S, Nitschke R and Nann T: Quantum dots versus
organic dyes as fluorescent labels. Nat Methods. 5:763–775. 2008.
View Article : Google Scholar : PubMed/NCBI
|
|
25
|
Beresford MJ, Wilson GD and Makris A:
Measuring proliferation in breast cancer: Practicalities and
applications. Breast Cancer Res. 8:2162006. View Article : Google Scholar : PubMed/NCBI
|
|
26
|
Brabletz T, Jung A, Spaderna S, Hlubek F
and Kirchner T: Opinion: Migrating cancer stem cells-an integrated
concept of malignant tumour progression. Nat Rev Cancer. 5:744–749.
2005. View
Article : Google Scholar : PubMed/NCBI
|
|
27
|
Watanabe T, Takahashi A, Suzuki K,
Kurusu-Kanno M, Yamaguchi K, Fujiki H and Suganuma M:
Epithelial-mesenchymal transition in human gastric cancer cell
lines induced by TNF-α-inducing protein of Helicobacter pylori. Int
J Cancer. 134:2373–2382. 2013. View Article : Google Scholar
|
|
28
|
Fang M, Yuan J, Peng C and Li Y: Collagen
as a double-edged sword in tumor progression. Tumour Biol.
35:2871–2882. 2014. View Article : Google Scholar :
|
|
29
|
Gong P, Wang Y, Liu G, Zhang J and Wang Z:
New insight into Ki67 expression at the invasive front in breast
cancer. PLoS One. 8:e549122013. View Article : Google Scholar : PubMed/NCBI
|
|
30
|
Fidler IJ: The pathogenesis of cancer
metastasis: The 'seed and soil' hypothesis revisited. Nat Rev
Cancer. 3:453–458. 2003. View
Article : Google Scholar : PubMed/NCBI
|