Introduction
Flavonoids are important phytochemicals, prevalent
in the human diet, which are claimed to exert a variety of
biological effects (1). Herbal
preparations containing high doses of flavonoids have become
widespread as interest in healthy living and alternative medicine
increases. Therefore, potential herb-drug interactions (HDIs) may
be a major concern in the co-administration of flavonoids and other
medicines (2,3).
Quercetin (3,3′,4′,5,7-pentahydroxyflavone; Que),
the predominant flavonoid, is ubiquitously present in edible
plants, herbs, beverages and dietary supplements, including onions,
grapes, berries, apples, red wine, tea, St. John's wort and ginkgo
(3). Due to its beneficial effects
on health, it has also been marketed as a dietary supplement
(3), with a recommended daily dose
of 200–1200 mg (4). It exhibits
antioxidant, anti-inflammatory, anticancer, neuroprotective,
anti-anaphylaxis and anti-aging effects (5–7). In
addition, Que is well-known to protect tissue against damage
induced by chemicals. For example, Que protects against
cyclosporine (CsA)-induced nephrotoxicity and hepatotoxicity
(8,9), acetic acid- and trinitrobenzene
sulphonic acid-induced inflammatory bowel disease-like symptoms
(10,11), atrazine-induced cytotoxicity in
cultured Sertoli-germ cells and Leydig cells (12,13),
ethanol-induced dyslipidemia and mitochondrial oxidative damage
(14), and high glucose-induced
Schwann cell damage (15).
It has been reported that Que modulates the phase I
and phase II drug-metabolizing enzymes (DMEs), including cytochrome
P (CYP) 1A1, CYP1A2, CYP1B1, CYP2A6, CYP2C9, CYP2D6, CYP3A4, UDP
glucuronosyltransferases (UGTs) and sulfotransferases (SULTs)
(16–20), and drug transporters (DTs),
including P-glycoprotein (P-gp), multidrug resistance-associated
protein 1 (MRP1), breast cancer resistance protein (BCRP), organic
anion transporter (OAT) and organic cation transporter (16,21–23).
However, the effect of Que on DMEs and DTs in vitro and
in vivo (16,24–26)
remains to be elucidated.
As a calcineurin (CN) inhibitor, CsA is widely used
to prevent rejection of transplanted organs (27). It is a substrate for CYP3A and P-gp
(27), UGT1A and 2B (28), and MRP2 (29). However, it is also a potent
inhibitor of CYP3A4, P-gp, OATP1B and 2B, MRP2, and BCRP (30,31).
Consequently, foods or dietary supplements that influence DMEs, DTs
and/or their interplay may alter the pharmacokinetics of CsA,
resulting in increased toxicity and/or diminished efficacy.
Previous studies have reported that Que interacts with CsA
resulting in a reduction or increase in the serum concentration of
CsA (31–37). These conflicting results may be due
to differences in the subjects used, the method of administration
and the dose. Furthermore, the underlying mechanisms by which the
effects of Que are mediated are poorly understood.
Increased knowledge of the interactions between DMEs
and DTs in drug absorption and disposition, as well as complex
HDIs, facilitates prediction of the pharmacokinetic properties of
drugs and potential HDIs (38,39).
There may be serious risks, particularly for drugs such as CsA with
a narrow therapeutic index, if other drugs or food constituents
that interfere with DMEs and DTs are deliberately or
unintentionally co-administered (37).
As a novel CN inhibitor, Que demonstrates
noncompetitive inhibition of CN (40), suggesting that it may have
immunosuppressant properties and may potentially enhance the effect
of CsA. As Que is widely distributed in foods and is available as a
dietary supplement, Que and CsA may frequently be administered
simultaneously. It is therefore crucial to understand the effect of
Que on DMEs and DTs, and their interactions. Thus far, to the best
of our knowledge, there have been no studies investigating the
simultaneous modulation of DME and DT expression levels by Que in
the small intestine and liver.
The aim of the present study was to evaluate whether
multiple-dose oral administration of Que influenced the
pharmacokinetics of CsA in rats. Furthermore, to investigate the
underlying mechanisms, reverse transcription-quantitative
polymerase chain reaction (RT-qPCR) and western blotting were
performed to measure the mRNA and protein expression levels of DMEs
and DTs in the small intestine and liver of rats, following Que
consumption in the presence or absence of CsA for seven consecutive
days.
Materials and methods
Materials
Que, CsA and Cyclosporine D were purchased from
Sigma-Aldrich (St. Louis, MO, USA). The CsA formulation was
Sandimmune® injection (50 mg/ml; Novartis International
AG, Basel, Switzerland) containing Cremophor® EL
(polyethoxylated castor oil), and each ml of infusion concentrate
was diluted in de-ionized water prior to use. TRIzol®
reagent was purchased from Invitrogen; Thermo Fisher Scientific,
Inc. (Waltham, MA, USA). Cremophor® EL was obtained from
BASF SE (Ludwigshafen, Germany). The first-strand complementary (c)
DNA synthesis kit and THUNDERBIRD SYBR qPCR Mix were purchased from
Toyobo Co., Ltd. (Osaka, Japan). Milli-Q plus water (EMD Millipore,
Billerica, MA, USA) was used for all preparations.
Animals
Male Sprague-Dawley (SD) rats weighing 180–220 g
were purchased from the Laboratory Animal Research Center of Tongji
Medical College of Huazhong University of Science and Technology
(Wuhan, China), and were given free access to a commercial rat chow
diet (low Que) and tap water. The animals were housed two per cage,
and maintained at 22±2°C and 50–60% relative humidity, under a 12-h
light/dark cycle. The experiments were initiated following
acclimation to these conditions for at least one week. All
experiments were performed with the approval of the Animal Research
Ethics Committee of Union Hospital of Huazhong University of
Science and Technology (permit no. 2015–015; Wuhan, China).
Experiment I
A total of 24 rats were randomly divided into three
groups, and received either solely CsA or an identical dose of CsA
together with low-, moderate- or high-dose Que in a
before-and-after design. The rats were fasted for 12-h prior to
dosing, and food was also withheld for 3 h subsequent to dosing.
Water was supplied ad libitum. The CsA solution was prepared
by diluting Sandimmune® injection with de-ionized water
to a concentration of 2 mg/ml. Que was dissolved in vehicle
(Cremophor® EL/de-ionized water). Drugs were
administered by oral gavage using a 16-gauge gavage needle (Kent
Scientific Corporation, Torrington, CT, USA). On day 1, 24 rats
assigned to the low-dose, moderate-dose and high-dose Que treatment
groups received a single oral dose of 10 mg/kg CsA alone. From days
3 to 8, rats received 25, 50 or 100 mg/kg/day of Que for six
consecutive days. Following the final dose, rats were fasted
overnight with free access to water. The following morning, Que was
again administered, followed 0.5 h later by CsA (10 mg/kg dose).
The dosages were selected based on clinical doses administered to
humans. Cremophor® EL was added to the vehicle to ensure
Que dissolution and accurate dosing. On experimental days 1 and 9,
blood samples (0.2 ml) were collected via the tail vein prior to,
and at 0.5, 1, 3, 5, 8, 12, 24, 36 and 48 h following, CsA
administration and deposited into heparinized tubes (BD
Biosciences, Franklin Lakes, NJ, USA). Blood samples were stored at
−80°C until analysis.
Experiment II
Rats were randomly divided into eight groups with
three rats in each group. Rats in the Que-treated groups were
gavaged once daily with Que at 25, 50 or 100 mg/kg without
(Que-WOC) or with (Que-WC) CsA (10 mg/kg) for 7 consecutive days.
Rats in the CsA-treated group were gavaged once daily with CsA (10
mg/kg) for 7 consecutive days. Rats in the CsA-treated group were
only gavaged with CsA (10 mg/kg); however, the Que-WC group were
treated with Que and CsA by two separate gavages within 1 min. Rats
in the control group were similarly gavaged with the equivalent
volume (5 ml/kg) of vehicle (Cremophor® EL/de-ionized
water). Animals were allowed free access to food and water
throughout the experiment; however, they were fasted overnight
prior to sacrifice to reduce the intestinal content. On day 7, 0.5
h following the final dose, rats were sacrificed by cervical
dislocation. Tissues, including the small intestine and liver, were
isolated, rinsed with saline, blotted dry, snap-frozen in liquid
nitrogen and stored at −80°C until use.
Detection of the cyclosporine blood
concentration in rats by liquid chromatography-tandem mass
spectrometry (LC-MS/MS)
Blood concentrations of CsA were measured using
validated LC-MS/MS using an internal standard of Cyclosporine D.
The standards in the rat samples were analyzed on an API-4000
triple quadruple mass spectrometer (Applied Biosystems; Thermo
Fisher Scientific, Inc.) under an electrospray ionization negative
mode (standard curves ranged from 1.00 to 4,000 ng/ml;
r2>0.99). The lower limit of quantitation for CsA was
1.00 ng/ml. The assay accuracy (% bias), and precision (% relative
standard deviations) of the quality control samples were within ±
15%.
Measurement of intestinal and hepatic
mRNA expression levels
The expression levels of mRNA encoding CYP3A1,
CYP3A2, UGT1A, OATP2B1 (small intestine only), OATP1B2 (liver
only), P-gp, BCRP and MRP2 in the small intestine and liver were
quantified by RT-qPCR. The tissues (100 mg) were homogenized in 1
ml TRIzol® reagent. Total RNA was extracted according to
the manufacturer's instructions. The RNA was quantified by the
standard optical density (OD) 260 method (41). The
OD260/OD280 ratio for each RNA sample ranged
from 1.8 to 2.2. Subsequently, RNA was converted to cDNA using the
high-capacity First Strand cDNA Synthesis kit (Toyobo, Co., Ltd.),
according to the manufacturer's instructions. qPCR was performed
using THUNDERBIRD® SYBR® qPCR Mix (Toyobo,
Co., Ltd.) and a StepOnePlus Real-Time PCR System (Applied
Biosystems; Thermo Fisher Scientific, Inc.). Specific primers for
Cyp3a1, Cyp3a2, Ugt1a, solute carrier organic anion
transporter family member (Slco) 2b1, Slco1b2, multi-drug
resistance 1 (Mdr1), Bcrp, Mrp2 and the housekeeping gene
β-actin were synthesized by Invitrogen; Thermo Fisher Scientific,
Inc. and are listed in Table I.
The PCR cycling protocol consisted of one cycle of 1 min at 95°C,
followed by 40 cycles of denaturation for 15 sec at 95°C, annealing
for 20 sec at 58°C and extension for 20 sec at 72°C. For the final
cycle only, the duration of the elongation step was 5 min. The
relative mRNA expression levels were calculated using the
2−ΔΔCq method (42).
 | Table ISummary of the gene-specific
polymerase chain reaction primer sequences, product size and
annealing temperature. |
Table I
Summary of the gene-specific
polymerase chain reaction primer sequences, product size and
annealing temperature.
| Description | Genebank | Sense primer,
5′-3′ | Antisense primer,
5′-3′ | Product size,
bp | Tm, °C |
|---|
| β-actin | NM_031144 |
CGTTGACATCCGTAAAGACCTC |
TAGGAGCCAGGGCAGTAATCT | 110 | 58 |
| Cyp3a1 | NM_013105.2 |
ACTGCATTGGCATGAGGTTTG |
ATCCCGTGGCACAACCTTT | 170 | 58 |
| Cyp3a2 | NM_153312.2 |
ATTCTAAGCATAAGCACCGAGTG |
TGTGCTGCTGGTGGTTTCAT | 158 | 58 |
| Ugt1a1 | NM_012683.2 |
ACTATTCTTGTCAAATGGCTACCC |
GTTTTCCAAATCATCGGCAGT | 231 | 58 |
| Slco2b1 | NM_080786.1 |
TCGCTGTTGTGTCTGCTACTCAG |
AACAGGGTTAAAGTCATCTGATTGG | 162 | 58 |
| Slco1b2 | NM_031650.3 |
TTCGTGGTGATAAGAAGCCG |
CAATTCAGGTTGGACGCTCTT | 162 | 58 |
| Mdr1 | NM_012623.2 |
TCCTATGCTGCTTGTTTCCG |
ATCCTGATGATGTGGGATGCT | 179 | 58 |
| Bcrp1 | NM_181381.2 |
ATTGGTGCCCTTTACTTTGGTC |
ACACTTGGCAAGAACCTCATAGG | 236 | 58 |
| Mrp2 | NM_012833.2 |
TGTGGCAGTTGAGCGAATAAGT |
AAGAGGCAGTTTGTGAGGGATG | 246 | 58 |
Measurement of intestinal and hepatic
protein expression levels
The protein expression levels of CYP3A1, CYP3A2,
UGT1A, OATP2B1 (small intestine only), OATP1B2 (liver only), P-gp,
BCRP and MRP2 in the small intestine and liver were analyzed by
western blotting. The small intestine and liver samples were
homogenized in 10X ice-cold buffer consisting of 10 mM Tris-HCl (pH
7.5), 250 mM sucrose, 1 mM phenylmethylsulfonyl fluoride and
protease inhibitor cocktail (Sigma-Aldrich), and centrifuged at
12,000 × g for 5 min at 4°C. The supernatants were stored at −80°C
until analysis. Protein concentrations were determined using the
BioRad Protein Assay (Bio-Rad Laboratories, Inc., Hercules, CA,
USA). Protein samples (40 μg) were loaded onto 8–20%
SDS-PAGE gels and subjected to electrophoresis at 120 V for 90 min.
The proteins were transferred to polyvinylidene difluoride
membranes (Merck Millipore, Darmstadt, Germany). The membranes were
blocked for 1 h with Tris-buffered saline (TBS) with 0.1% Tween-20
(TBST) containing 5% skim milk and incubated with primary antibody
overnight at 4°C. Membranes were subsequently washed three times
with TBST, and incubated with horseradish peroxidase
(HRP)-conjugated secondary antibody (1:10,000) for 30 min at room
temperature. The following primary antibodies were purchased from
Santa Cruz Biotechnology, Inc. (Dallas, TX, USA): mouse anti-CYP3A1
monoclonal antibody (1:200; sc-53246), mouse anti-P-gp monoclonal
antibody (1:500; sc-71557), rabbit anti-BCRP polyclonal antibody
(1:500; sc-25822), rabbit anti-MRP2 polyclonal antibody (1:500;
sc-20766) and mouse anti-β-actin monoclonal antibody (1:5,000;
TDY051). Additional antibodies purchased from Abcam (Cambridge, MA,
USA) were: rabbit anti-UGT1A polyclonal antibody (1:1,000;
ab194697) and rabbit anti-OATP2B1 polyclonal antibody (1:1,000;
sc-376904). Rabbit anti-CYP3A2 polyclonal antibody (1:500; AB1276)
was supplied by Merck Millipore. Secondary antibodies were goat
anti-mouse IgG-HRP (1:10,000; 074-1806) and goat anti-rabbit
IgG-HRP (1:10,000; 074-1506), which were purchased from Santa Cruz
Biotechnology, Inc. Protein bands were visualized using Enhanced
chemiluminescence plus western blotting detection system (GE
Healthcare Life Sciences, Chalfont, UK) followed by exposure to
Kodak films (Kodak, Rochester, NY, USA) and densitometry analyses
(Kodak 1D3 image analysis software version 3.6.1; Kodak). Results
were normalized relative to β-actin expression.
Pharmacokinetic analysis
The plasma concentration data were analyzed by a
non-compartmental method using Drug and Statistics software version
3.0 (Mathematical Pharmacology Professional Committee of China,
Shanghai, China). The elimination rate constant (Kel)
was calculated by log-linear regression of CsA data during the
elimination phase. The terminal half-life
(t1/2) was calculated by
0.693/Kel. The peak plasma concentration
(Cmax) and time to reach peak plasma concentration
(Tmax) of CsA in plasma were derived directly from the
concentration-time curve. The area under the plasma
concentration-time curve (AUC0−t) from time zero to the
time of last measured concentration (Clast) was
calculated by the linear trapezoidal rule. The AUC from zero to
infinity (AUC0−∞) was obtained by the addition of
AUC0−t and the extrapolated area determined by
Clast/Kel. The mean residence time (MRT) was
calculated as MRT=AUMC/AUC, where AUMC represented the area under
the first moment vs. time curve, calculated in a similar fashion to
the AUC.
Statistical analysis
Statistical analyses were performed with GraphPad
Prism version 6.0 (GraphPad Software, Inc., La Jolla, CA, USA).
Unpaired Student's t tests were performed for comparison
between independent groups. The influences of Que on changes in
mRNA and protein expression levels, as well as pharmacokinetic
parameters of CsA were evaluated by paired Student's t
tests. For multiple comparisons, one-way analysis of variance
(ANOVA) followed by Tukey's or Dunnett's post hoc test was
performed for each group. All tests were two-tailed and P<0.05
was considered to indicate a statistically significant difference.
Data are presented as the mean ± standard deviation.
Results
Effect of Que on CsA pharmacokinetic
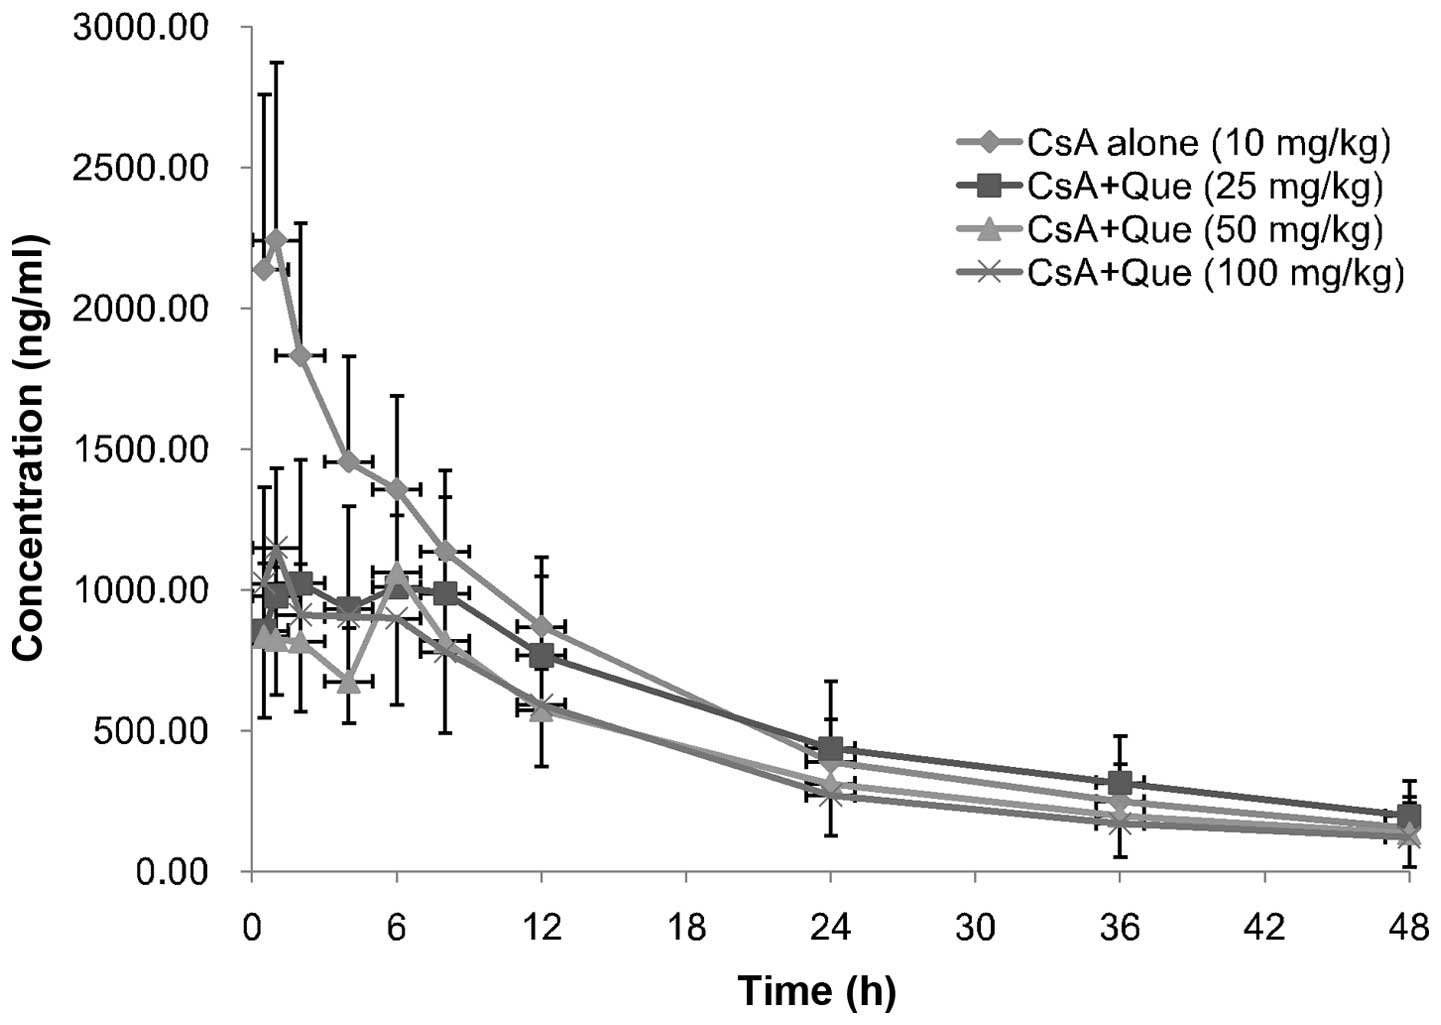
Mean plasma concentration-time profiles of CsA in
rats following oral administration of 10 mg/kg CsA in the presence
or absence of Que (25,50 or 100 mg/kg) are presented in Fig. 1; the corresponding pharmacokinetic
parameters are presented in Table
II. The presence of Que significantly altered the
pharmacokinetic parameters of CsA. Cmax of CsA in the
absence of Que on day 1 was 2412.66±544.85 ng/ml (n=24), while that
of CsA in the Que-treated rats decreased by 46 (P= 0.0094), 50 (P=
0.0175) and 47% (P= 0.0015) in the low-, moderate- and high-dose
groups, respectively (day 9, n=8 each group). In addition,
AUC0−t and AUC0−∞ of CsA in Que-treated rats
decreased, by 21 (P=0.3392) and 16% (P= 0.5694), 30 (P= 0.2567) and
33% (P= 0.4101), and 33 (P=0.0028) and 34% (P=0.0036),
respectively. Furthermore, Que-treated rats exhibited significantly
increased MRT0−t values compared with the control rats,
increasing by 16 (P=0.0426), 19 (P=0.0458), and 9% (P=0.0180) in
the low-, moderate- and high-dose groups, respectively. However,
there were no significant differences in Cmax
(P=0.6562), AUC0−t (P= 0.3087), AUC0−∞
(P=0.2197) and MRT0−t (P= 0.1498) between the three Que
treatment groups, or in the Tmax (P=0.2359), CL/F
(P=0.3325) and t1/2 (P=0.0540) of CsA between
Que-treated and non-treated groups.
| Table IIPredominant pharmacokinetic
parameters of CsA following the oral administration of CsA (10
mg/kg) to rats in the absence or presence of Que (25, 50 or 100
mg/kg). |
Table II
Predominant pharmacokinetic
parameters of CsA following the oral administration of CsA (10
mg/kg) to rats in the absence or presence of Que (25, 50 or 100
mg/kg).
| Parameters | Que, 25 mg/kg
| Que, 50 mg/kg
| Que, 100 mg/kg
|
|---|
| CsA alone | CsA+Que | CsA alone | CsA+Que | CsA alone | CsA+Que |
|---|
|
AUC0−t(ng·h/ml) |
32116.48±9821.92 |
25274.44±9623.67 |
28280.09±9226.11 |
19682.86±6525.58 |
29301.87±8789.25 |
19398.18±7754.19b |
|
AUC0−∞(ng·h/ml) |
37368.60±14650.46 |
31479.18±13392.53 |
34135.53±17290.60 |
23042.65±10567.90 |
32643.59±12685.94 |
21665.49±10194.81b |
|
AUMC0−t(ng·h2/ml) | 456519±181803 | 415848±180689 | 369183±155544 | 310041±144983 | 393299±166468 |
282844±149577a |
|
MRT0−t(h) | 13.95±1.64 | 16.13±1.52a | 12.80±1.62 | 15.27±1.86a | 13.06±1.68 | 14.27±2.05a |
|
VRT0−t(h2) | 149.03±22.23 | 156.35±26.29 | 135.55±28.71 | 150.97±20.45 | 136.57±23.31 | 145.26±23.98 |
|
t1/2 | 16.64±6.49 | 23.27±10.47 | 19.29±9.32 | 15.71±5.49 | 14.07±4.77 | 13.60±4.24 |
| V/F | 6.68±1.90 | 10.65±4.00a | 7.98±2.92 | 10.29±1.89 | 6.44±1.40 | 10.83±7.04 |
| CL/F | 0.30±0.11 | 0.38±0.24 | 0.35±0.14 | 0.50±0.17 | 0.34±0.12 | 0.57±0.30 |
|
Tmax | 0.93±0.19 | 3.56±3.22 | 0.90±0.22 | 3.58±2.69 | 0.81±0.26 | 1.56±1.52 |
|
Cmax(ng/ml) | 2405.07±447.95 |
1288.11±430.75c | 2307.00±705.51 |
1146.85±111.26b | 2485.35±579.03 |
1326.37±421.57b |
mRNA expression levels of DMEs and DTs in
the small intestine and liver
The intestinal and hepatic mRNA encoding CYP3A1,
CYP3A2, UGT1A, OATP2B1 (small intestine only), OATP1B2 (liver
only), P-gp, BCRP and MRP2 were measured by RT-PCR analysis using
intestinal and hepatic RNA prepared from rats (Fig. 2).
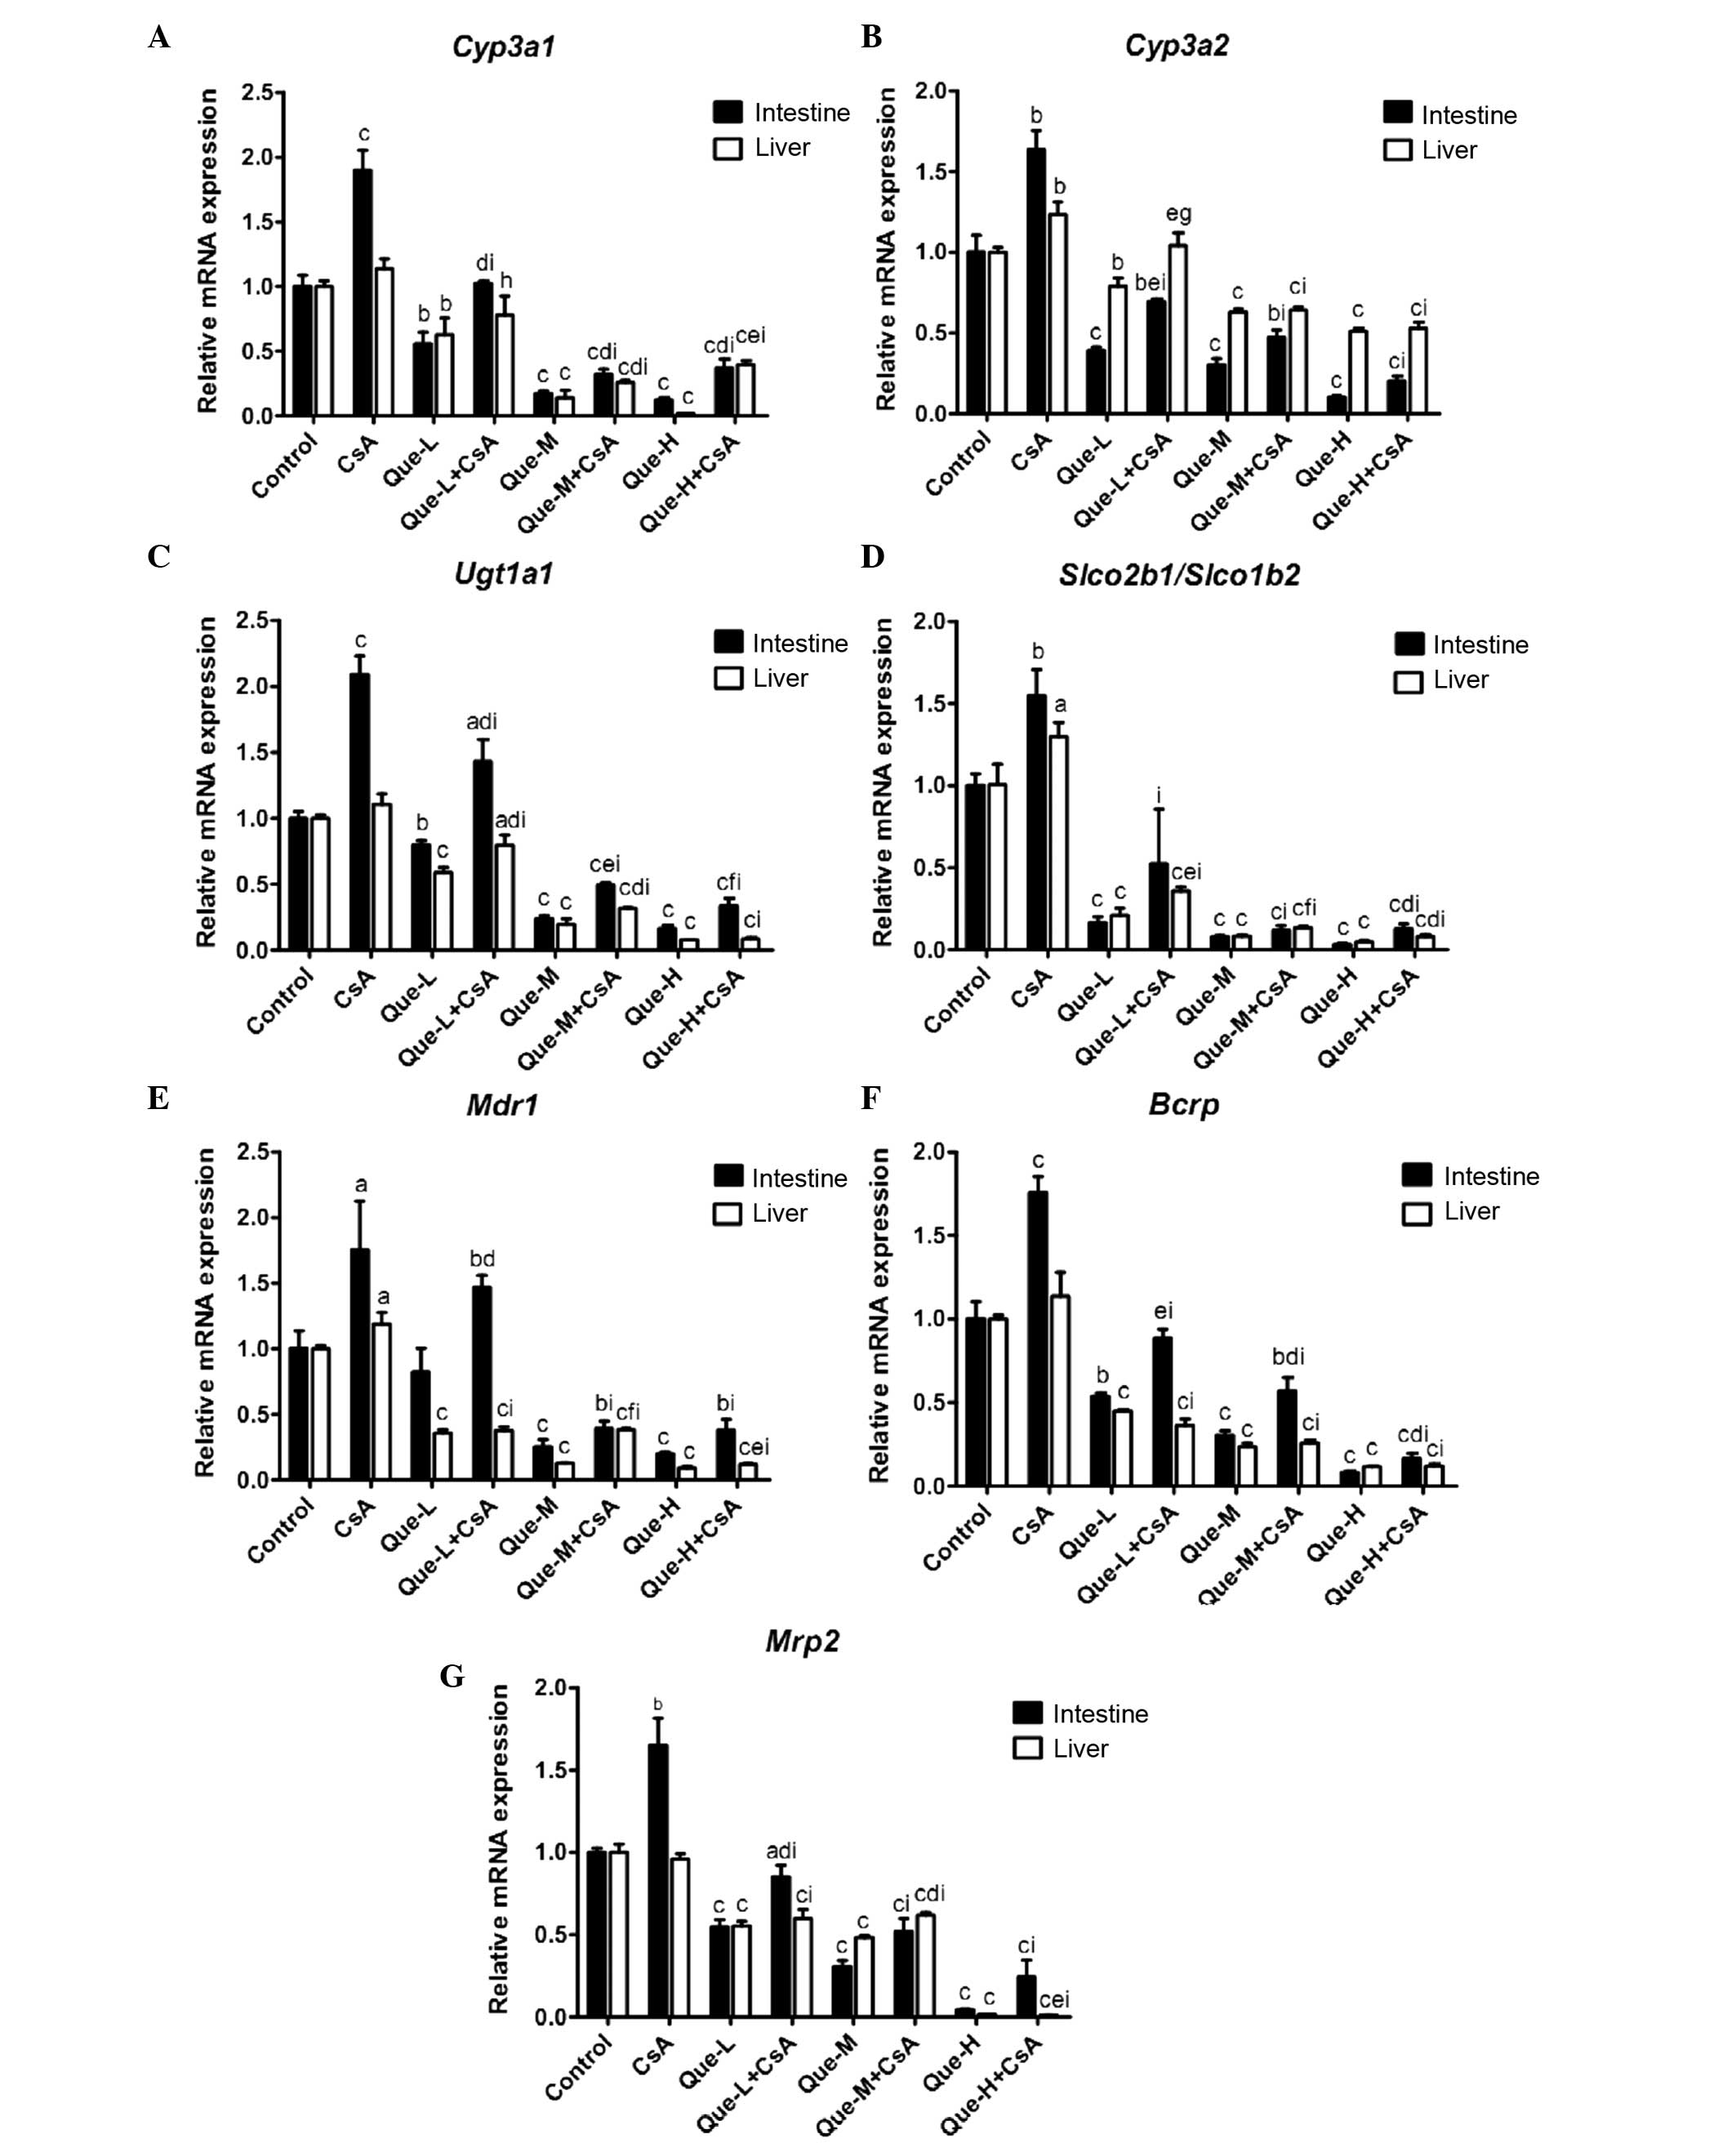 | Figure 2Effect of Que on the intestinal and
hepatic mRNA expression levels of CYP3A1, CYP3A2, UGT1A, SLCO2B1,
SLCO1B2, MDR1, BCRP and MRP2. In rats of the control, CsA
treatment, and Que treatment without (Que-WOC) and with (Que-WC)
CsA for 7 consecutive days groups, the mRNA expression levels were
measured by reverse transcription-quantitative polymerase chain
reaction and calculated as expression levels relative to the
control using the 2−ΔΔCq method. mRNA expression levels
of (A) Cyp3a1, (B) Cyp3a2, (C) Ugt1a1, (D)
Slco2b1/Slco1b2, (E) Mdr1, (F) Bcrp and
(G) Mrp2 were measured in the small intestine and liver of
rats. β-actin was used as a loading control. Data are presented as
the mean ± standard deviation (n=3). aP<0.05,
bP<0.01 and cP<0.001, compared with the
control; dP<0.05, eP<0.01, and
fP<0.001, compared to the Que-WOC group;
gP<0.05, hP<0.01, and
iP<0.001, compared to the CsA treatment alone group.
Que-L, Que low dose (25 mg/kg); Que-M, Que moderate dose (50
mg/kg); Que-H, Que high dose (100 mg/kg); CsA, cyclosporine; Que,
quercetin; Cyp, cytochrome P; Ugt1a1, UDP glucuronosyltransferase
family 1 member A complex locus; Slco, solute carrier organic anion
transporter family member; Mdr1, multi-drug resistance 1; Bcrp,
breast cancer resistance protein; Mrp2, multidrug
resistance-associated protein 2. |
mRNA expression levels of Cyp3a1 and
Cyp3a2
As presented in Fig. 2A
and B, a dose-dependent decrease (P=0.0099 and P<0.0001,
respectively) was observed in the intestinal mRNA expression levels
of Cyp3a1 and Cyp3a2 in Que-WOC rats when compared to
the control (vehicle) group, by 45 and 61% (P=0.0033 and P=0.0006,
respectively), 83 and 70% (P<0.0001 and P=0.0004, respectively),
and 88 and 90% (P<0.0001 and P=0.0001, respectively) in the
low-, moderate- and high-dose groups, respectively. By contrast,
CsA treatment increased the intestinal mRNA expression levels of
Cyp3a1 and Cyp3a2 by 90 (P=0.0008) and 63%
(P=0.0022). When compared with CsA treatment alone, a
dose-dependent decrease (P=0.0324 and P<0.0001, respectively)
was observed in the intestinal mRNA expression levels of
Cyp3a1 and Cyp3a2 in Que-WC rats, by 46 and 58%
(P=0.0006 and P=0.0002, respectively), 83 and 71% (P<0.0001 and
P<0.0001, respectively), and 81 and 88% (P<0.0001 and
P<0.0001, respectively) in the low-, moderate- and high-dose Que
co-administration groups, respectively.
Similarly, in the liver, a dose-dependent decrease
(P=0.0048 and P=0.0002, respectively) was observed in the mRNA
expression levels of Cyp3a1 and Cyp3a2 in Que-WOC
rats when compared to the control group, by 37 and 21% (P=0.0092
and P=0.0036, respectively), 86 and 37% (P<0.0001), and 98 and
49% (P<0.0001) in the respective treatment groups. Contrasting
with the small intestine, the hepatic mRNA expression level of
Cyp3a1 was not significantly influenced by CsA treatment
(P=0.0563); however, there was a significant rise (23%; P=0.0083)
in Cyp3a2. When compared to CsA treatment alone, Que-WC
treatment led to a decrease in the hepatic mRNA expression levels
of Cyp3a1 and Cyp3a2, by 31 (P=0.0206) and 16%
(P=0.0398), 77 (P<0.0001) and 48% (P=0.0002), and 65
(P<0.0001) and 57% (P<0.0001) in the respective treatment
groups. These results revealed that the mRNA expression levels of
Cyp3a1 and Cyp3a2 were inhibited by Que to a similar
extent in the small intestine and liver.
mRNA expression levels of Ugt1a1
The mRNA expression of Ugt1a1 in the Que-WOC
rats was significantly decreased in a dose-dependent manner
(P=0.0070) by 20 (P=0.0045), 76 (P<0.0001) and 84% (P<0.0001)
in the small intestine, and by 41, 81 and 92% in the liver
(P<0.0001), in the respective treatment groups (Fig. 2C). CsA treatment led to a
significant increase (109%; P=0.0002) in the intestinal mRNA
expression level of Ugt1a1 compared with the control group,
while the hepatic mRNA expression level of Ugt1a1 was not
significantly influenced by CsA treatment (P=0.0970). Similarly,
when compared to CsA treatment alone, Que-WC treatment led to a
dose-dependent decrease (P=0.0061 and P=0.0005, respectively) in
the intestinal and hepatic mRNA expression levels of Ugt1a1,
by 32 (P=0.0062) and 28% (P=0.0088), 76 (P<0.0001) and 71%
(P<0.0001), and 84 (P<0.0001) and 92% (P<0.0001) in the
respective treatment groups.
mRNA expression levels of
Slco2b1/Slco1b2
As presented in Fig.
2D, a dose-dependent decrease (P=0.0010 and P=0.0052,
respectively) was observed in the mRNA expression levels of
Slco2b1 in the small intestine and Slco1b2 in the
liver of Que-WOC rats when compared to the control (vehicle) group,
by 84 (P<0.0001) and 79% (P=0.0005), 92 (P<0.0001) and 92%
(P=0.0002), and 97 (P<0.0001) and 95% (P=0.0002) in the low-,
moderate- and high-dose groups, respectively. By contrast, CsA
treatment led to a significant increase in the mRNA expression
levels of Slco2b1 in the small intestine (54%; P=0.0057) and
Slco1b2 in the liver (29%; P=0.0292) compared with the
control. Similarly, when compared with CsA treatment, Que-WC
treatment led to a marked decrease in the intestinal Slco2b1
and hepatic Slco1b2 mRNA expression levels, by 66 (P=0.0087)
and 72% (P<0.0001), 92 (P=0.0001) and 90% (P<0.0001), and 92
(P=0.0001) and 94% (P<0.0001) in the respective treatment
groups. These results revealed that Que had a potent inhibitory
effect on the intestinal Slco2b1 and hepatic Slco1b2
mRNA expression levels.
mRNA expression levels of Mdr1
In the small intestine, as presented in Fig. 2E, moderate- and high-dose Que-WOC
treatment led to an increase in the mRNA expression levels of
Mdr1 by 75 (P=0.0008) and 80% (P=0.0004), respectively,
compared with the control group, while low-dose treatment did not
produce a significant effect (P=0.2312). Similarly, in the Que-WC
rats, moderate- and high-dose Que co-treatment led to a decrease in
the mRNA expression level of Mdr1 by 78% when compared with
CsA treatment alone (P=0.0033 and P=0.0034, respectively), while
low-dose treatment did not produce a significant effect (P=0.2661).
By contrast, CsA treatment increased the mRNA expression levels of
Mdr1 in the small intestine and liver, by 74 (P=0.0305) and
19% (P=0.0239), respectively.
In the liver, a dose-dependent decrease (P= 0.0066)
was observed in the mRNA expression levels of Mdr1 in
Que-WOC rats when compared with the control (vehicle) group, by 64,
87 and 91% in the respective treatment groups (P<0.0001).
Similarly, when compared with CsA treatment alone, Que-WC treatment
led to a decrease in the hepatic mRNA expression levels of
Mdr1, by 68, 68 and 90% in the respective treatment groups
(P<0.0001).
mRNA expression levels of Bcrp
A dose-dependent decrease (P<0.0001 and P=0.0002,
respectively) was observed in the mRNA expression levels of
Bcrp in the small intestine and liver of Que-WOC rats when
compared to the control (vehicle) group, by 46 and 55%, 70 and 77%,
and 92 and 88% in the respective treatment groups (P<0.0001,
Fig. 2F). CsA treatment led to a
significant increase in the intestinal mRNA expression levels of
Bcrp (75%; P=0.0007), while in the liver Bcrp was not
significantly influenced by CsA treatment (P=0.1736). When compared
with CsA treatment alone, Que-WC treatment led to a dose-dependent
decrease (P<0.0001) in the Bcrp mRNA expression levels,
by 50 (P=0.0002) and 68% (P=0.0008), 68 (P<0.0001) and 77%
(P=0.0004), and 91 (P<0.0001) and 89% (P=0.0002<0.001) in the
respective treatment groups. These results revealed that the mRNA
expression levels of Bcrp were inhibited by Que to a similar
extent in the small intestine and liver.
mRNA expression levels of Mrp2
As presented in Fig.
2G, a dose-dependent decrease (P<0.0001) was observed in the
mRNA expression levels of Mrp2 in the small intestine and
liver of Que-WOC rats compared with the control (vehicle) group, by
45 and 45%, 69 and 52%, and 96 and 98% in the respective treatment
groups (P<0.0001). CsA treatment led to a significant increase
in the intestinal mRNA expression levels of Mrp2 (65%;
P=0.0025), while in the liver Mrp2 was not significantly
influenced by CsA treatment (P=0.2855). When compared with CsA
treatment alone, Que-WC treatment led to a dose-dependent decrease
(P<0.0010.05) in the Mrp2 mRNA expression levels in the
small intestine and liver, by 48 (P=0.0015) and 38% (P=0.0006), 68
(P=0.0004) and 36% (P<0.001), and 85 (P= 0.0002) and 99%
(P<0.0001) in the respective treatment groups.
Taken together, these results revealed that the mRNA
expression levels of the investigated DMEs and DTs were inhibited
by Que in a dose-dependent manner, and to a similar extent in the
small intestine and liver. In addition, when compared with CsA
treatment alone, Que-WC treatment demonstrated a dose-dependent
inhibitory effect in the small intestine and liver of the
respective treatment groups.
Protein expression levels of DMEs and DTs
in the small intestine and liver
The intestinal and hepatic proteins CYP3A1, CYP3A2,
UGT1A, OATP2B1, OATP1B2, P-gp, BCRP and MRP2 were measured by
western blotting analysis in all treated rats (Fig. 3). Images of western blots performed
on the small intestine and liver of rats are presented in Fig. 3A and B respectively. Quantification
of western blots is presented in Fig.
4.
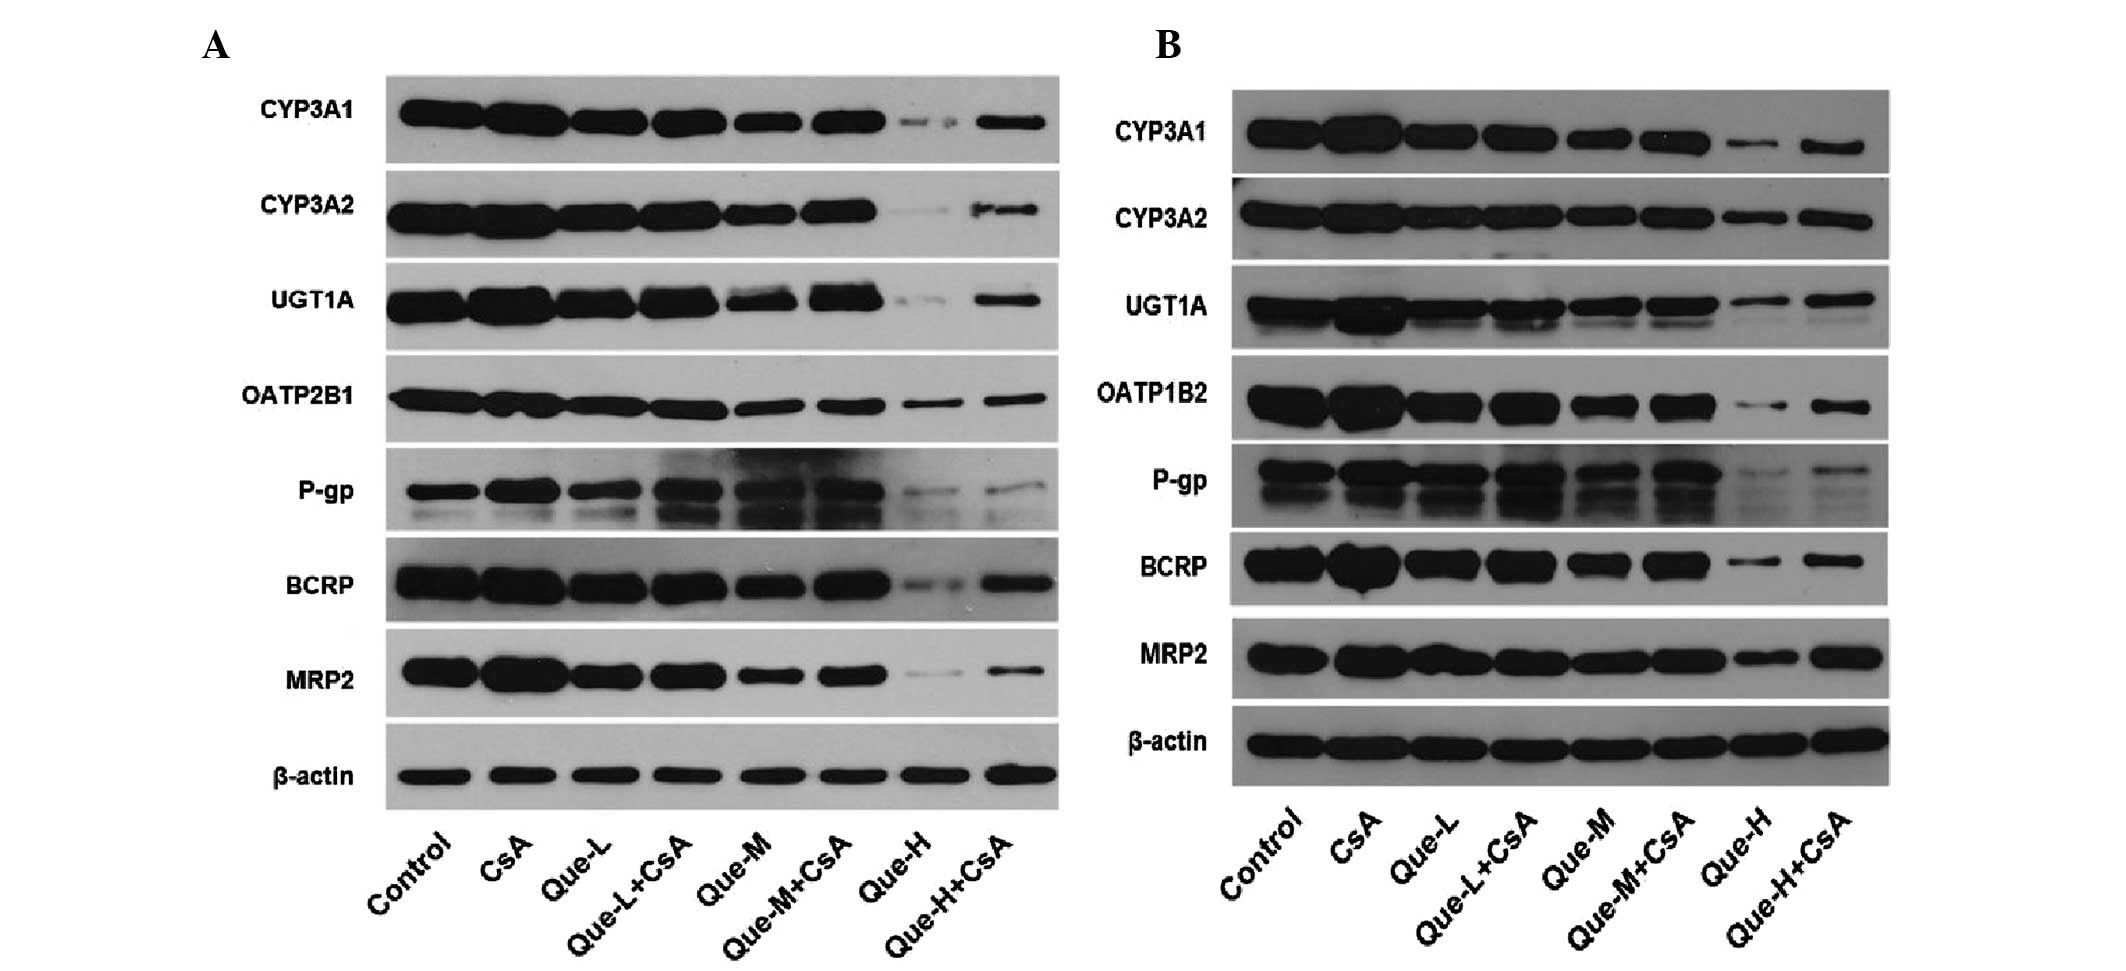 | Figure 3Effect of Que on the intestinal and
hepatic protein expression levels of CYP3A1, CYP3A2, UGT1A,
OATP2B1, OATP1B2, P-gp, BCRP and MRP2 assessed by western blotting.
In rats of the control, CsA treatment, and Que treatment without
(Que-WOC) or with (Que-WC) CsA for 7 consecutive days groups,
western blotting analysis was performed and β-actin was used as a
loading control. (A) Image of western blotting results in the small
intestine. (B) Image of western blotting results in the liver.
Que-L, Que low dose (25 mg/kg); Que-M, Que moderate dose (50
mg/kg); Que-H, Que high dose (100 mg/kg); CsA, cyclosporine; Que,
quercetin; CYP, cytochrome P; UGT1A1, UDP glucuronosyltransferase
family 1 member A; OATP, organic anion-transporting polypeptide;
P-gp, P-glycoprotein; BCRP, breast cancer resistance protein; MRP2,
multidrug resistance-associated protein 2. |
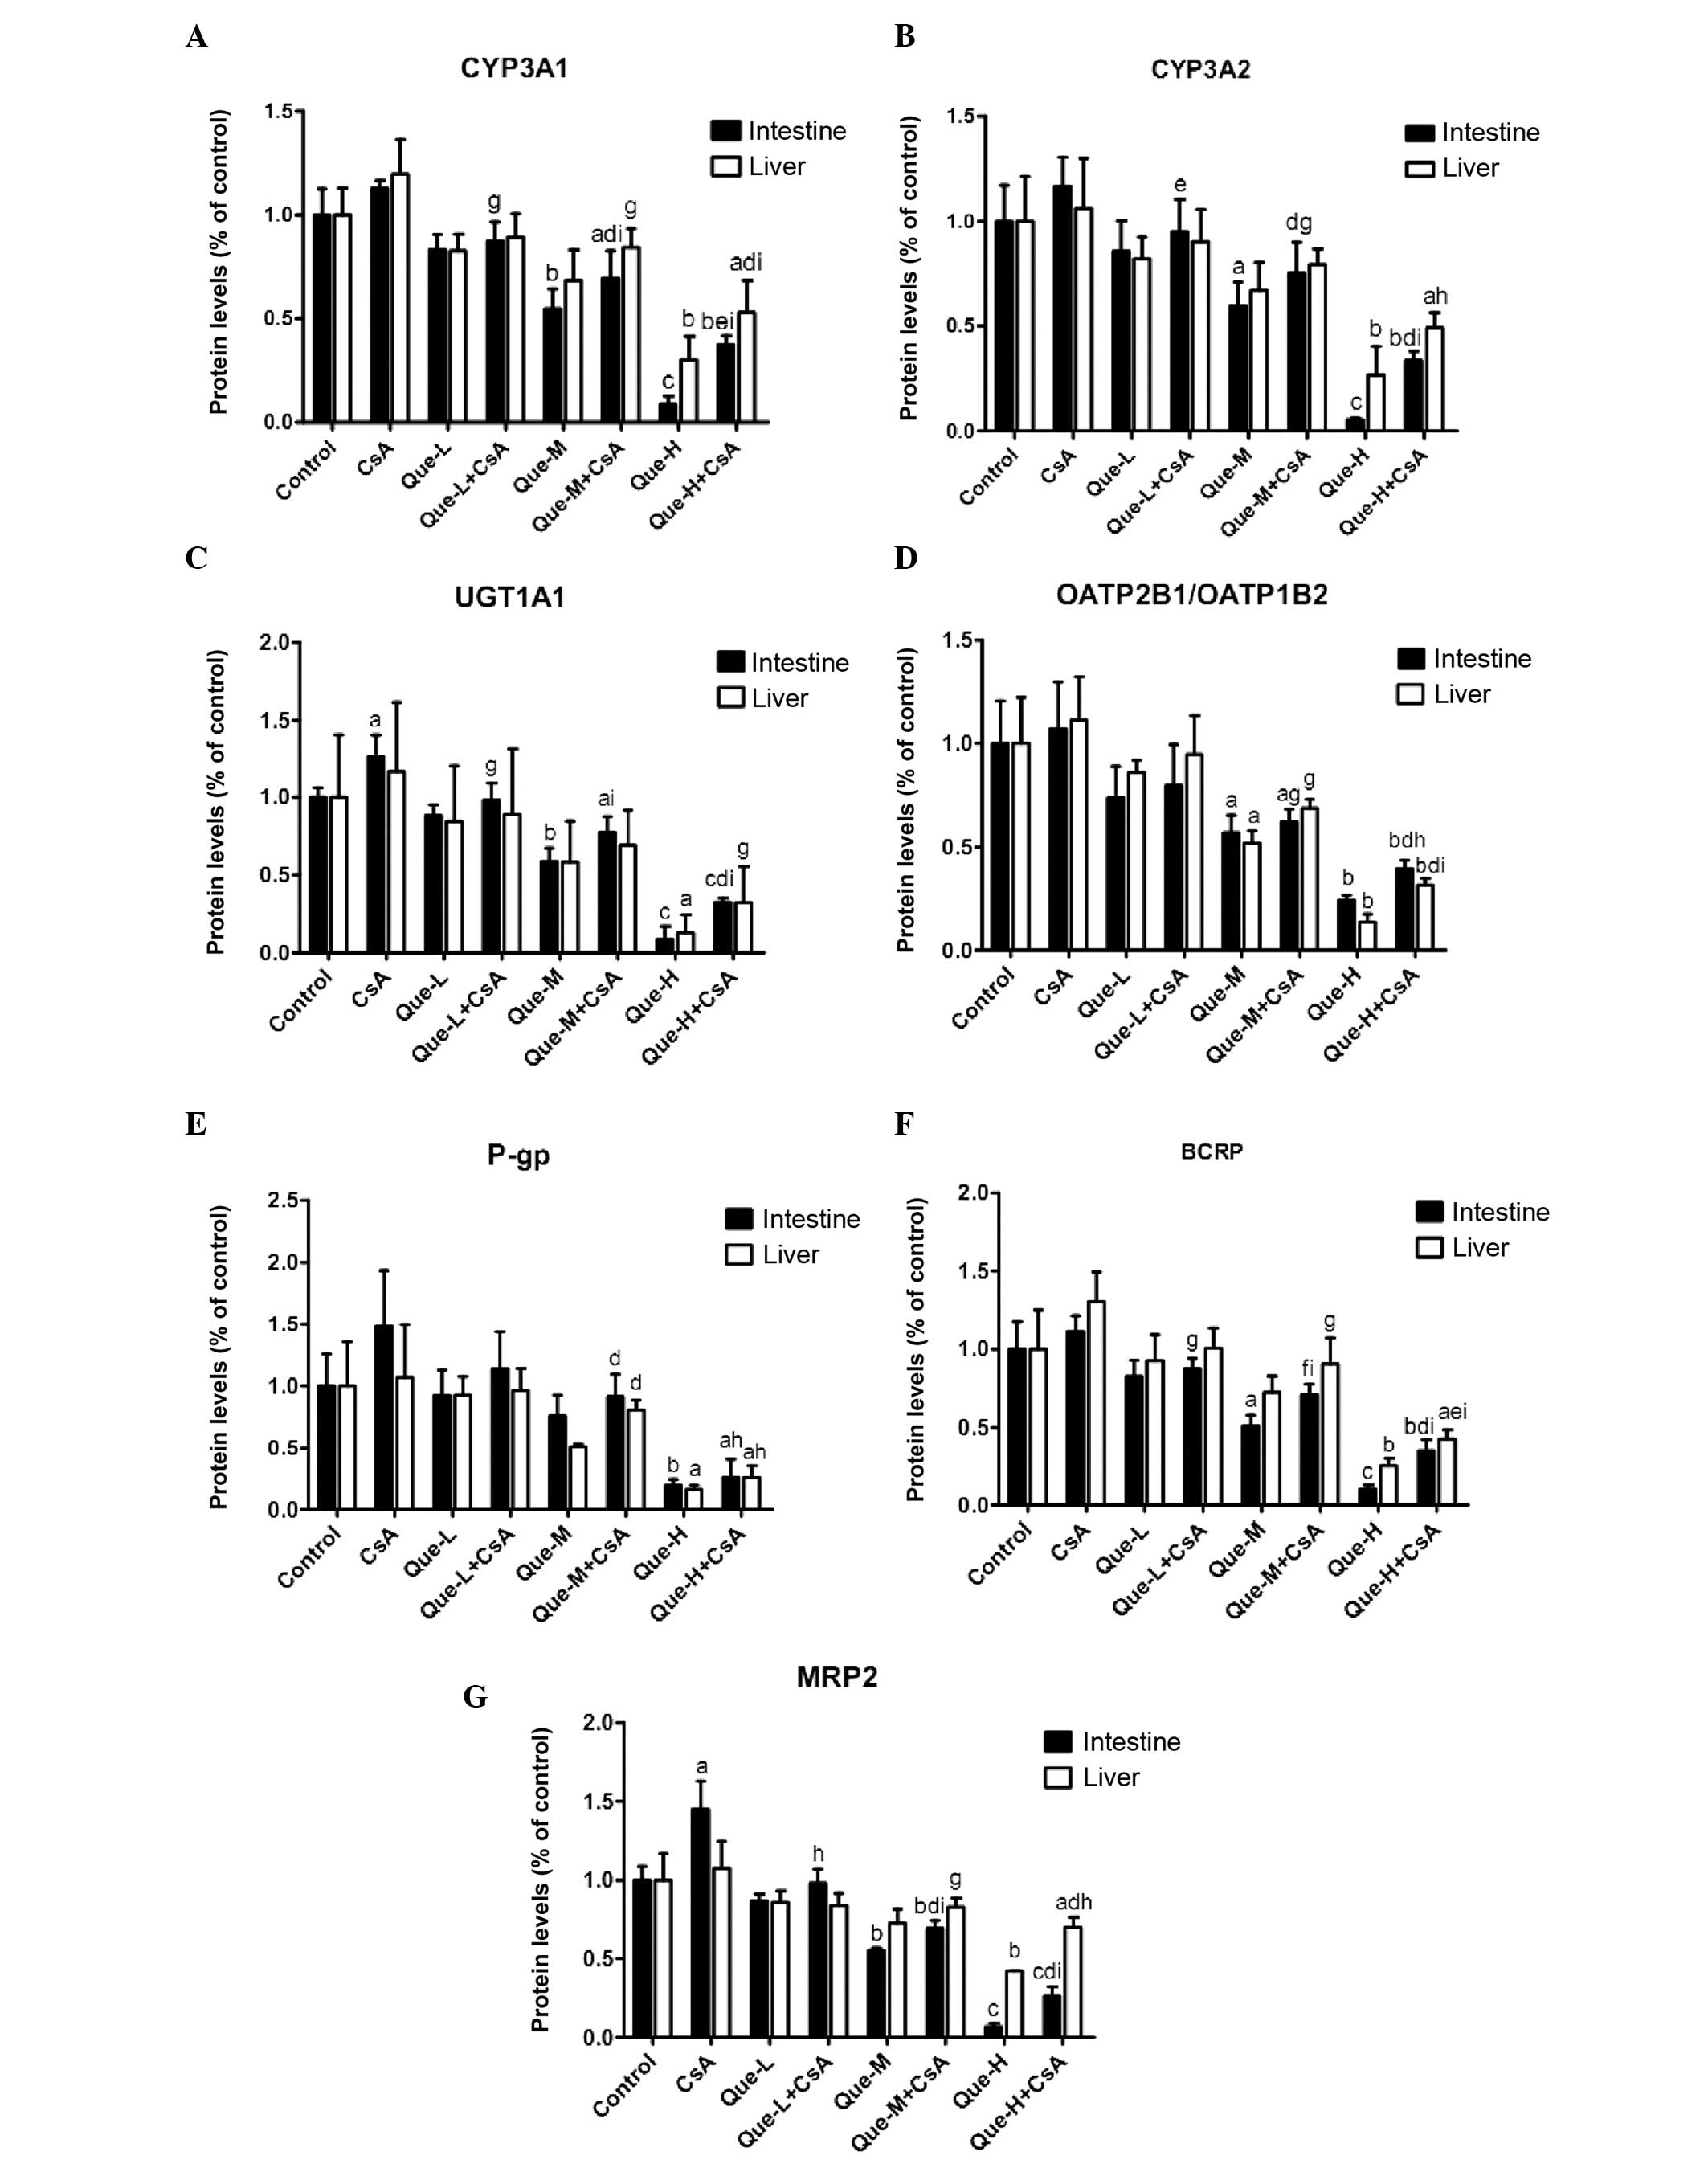 | Figure 4Quantification of the effect of Que
on intestinal and hepatic protein expression levels of CYP3A1,
CYP3A2, UGT1A, OATP2B1, OATP1B2, P-gp, BCRP and MRP2 assessed by
western blotting. Quantification of western blotting results
revealed the protein expression levels of (A) CYP3A1, (B) CYP3A2,
(C) UGT1A, (D) OATP2B1/OATP1B2, (E) P-gp, (F) BCRP and (G) MRP2
measured in the small intestine and liver of rats. Data are
presented as the mean ± standard deviation (n=3).
aP<0.05, bP<0.01 and
cP<0.001, compared with the control;
dP<0.05, eP<0.01 and
fP<0.001, compared to the Que-WOC group;
gP<0.05, hP<0.01 and
iP<0.001, compared to the CsA treatment group. Que-L,
Que low dose (25 mg/kg); Que-M, Que moderate dose (50 mg/kg);
Que-H, Que high dose (100 mg/kg); CsA, cyclosporine; Que,
quercetin; CYP, cytochrome P; UGT1A, UDP glucuronosyltransferase
family 1 member A; OATP, organic anion-transporting polypeptide;
P-gp, P-glycoprotein; BCRP, breast cancer resistance protein; MRP2,
multidrug resistance-associated protein 2. |
Protein expression levels of CYP3A1 and
CYP3A2
As presented in Fig. 4A
and B, a dose-dependent decrease (P<0.0001) was observed in
the intestinal protein expression levels of CYP3A1 and CYP3A2 in
Que-WOC rats when compared with the control (vehicle) group, by 17
(P=0.1181) and 14% (P=0.3328), 45 (P=0.0078) and 40% (P=0.0270),
and 91 (P=0.0003) and 95% (P=0.0007) in the low-, moderate- and
high-dose groups, respectively. Contrasting with the mRNA
expression level results, CsA treatment did not alter the protein
expression levels of CYP3A1 or CYP3A2 in the small intestine or
liver. This may be due to the high basal level of CYP3A, meaning an
additional increase in mRNA expression levels would not result in a
significant change in protein expression levels. When compared with
CsA treatment alone, a dose-dependent decrease (P<0.001) was
observed in the intestinal protein expression levels of CYP3A1 and
CYP3A2 in Que-WC rats, by 22 (P=0.0121) and 18% (P=0.1467), 38
(P=0.0055) and 35% (P=0.0241), and 67 (P<0.0001) and 71%
(P=0.0006) in the low-, moderate- and high-dose Que
co-administration groups, respectively.
High-dose Que treatment led to an decrease in the
hepatic protein expression levels of CYP3A1 and CYP3A2 by 70
(P=0.0022) and 73% (P=0.0075), respectively, compared with the
control, while moderate- (P=0.0501 and P=0.0867, respectively) and
low-dose (P=0.1219 and P=0.2661, respectively) treatment did not
produce significant effects. However, a dose-dependent decrease
(P=0.0006) was observed in Que-WOC rats. Similarly, when compared
with CsA treatment alone, only in the high-dose co-administration
groups was a significant decrease observed in the hepatic protein
expression levels of CYP3A1 and CYP3A2 in Que-WC rats, by 56
(P=0.0071) and 54% (P=0.0163), respectively.
Protein expression levels of UGT1A1
When compared with the control, the protein
expression levels of UGT1A1 in the Que-WOC rats was significantly
decreased in a dose-dependent manner by 12 (P=0.0888), 41
(P=0.0024) and 91% (P=0.0001) in the small intestine, and by 16
(P=0.6453), 42 (P=0.2090) and 87% (P=0.0231) in the liver (Fig. 4C). Similar to the mRNA expression
level results, CsA treatment led to a significant increase in the
intestinal protein expression level of UGT1A1 (27%; P=0.0380)
compared with the control group, while the hepatic protein
expression level of UGT1A1 was not significantly influenced by CsA
treatment (P=0.6597). Compared with CsA treatment, Que-WC treatment
led to a dose-dependent decrease (P<0.0001) in the intestinal
protein expression levels of UGT1A1, by 22 (P= 0.0490), 39 (P=
0.0079) and 74% (P= 0.0003) in the respective treatment groups.
However, only high-dose Que-WC treatment led to a decrease in the
hepatic protein expression levels of UGT1A1 (72%; P=0.0448)
compared with CsA treatment alone, while low- and moderate-dose
treatment did not produce significant effects (P=0.4835 and
P=0.1782, respectively).
Protein expression levels of
OATP2B1/OATP1B2
Similar to the mRNA results, a dose-dependent
decrease (P<0.001) in the moderate- and high-dose groups was
observed in the protein expression levels of OATP2B1 in the small
intestine and OATP1B2 in the liver in Que-WOC rats when compared
with the control (vehicle) group, by 43 (P=0.0282) and 48%
(P=0.0222), and 76 (P=0.0031) and 86% (P=0.0027), respectively,
while low-dose treatment did not produce a significant effect
(P=0.1498 and P=0.3482, respectively; Fig. 4D). CsA treatment did not alter the
protein expression levels of OATP2B1 and OATP1B2 in the small
intestine and liver. Similarly, when compared with CsA treatment,
only moderate- and high-dose Que-WC treatment led to a marked
decrease, by 42 (P=0.0297) and 38% (P=0.0254), and 63 (P=0.0071)
and 72% (P=0.0028), respectively. When compared with the mRNA
results, Que demonstrated a weak inhibitory effect on intestinal
OATP2B1 and hepatic OATP1B2 protein expression.
Protein expression levels of P-gp
As presented in Fig.
4E, high-dose Que treatment led to a significant decrease in
the intestinal and liver protein expression levels of P-gp by 81
(P=0.0059) and 84% (P=0.0153), respectively, compared with the
control group, while low- (P=0.7061 and P=0.7554, respectively) and
moderate-dose (P=0.2448 and P=0.0758, respectively) treatment did
not produce a significant effect. Similarly, only high-dose Que-WC
treatment led to a marked decline in the intestinal and liver
protein expression levels of P-gp when compared with CsA treatment,
by 83 (P=0.0108) and 76% (P=0.0330), respectively.
Protein expression levels of BCRP
A dose-dependent decrease (P<0.0001) was observed
in the protein expression levels of BCRP in the small intestine and
liver of Que-WOC rats when compared with the control (vehicle)
group, by 17 (P=0.2130) and 7% (P=0.6968), 49 (P=0.0109) and 27%
(P=0.1563), and 90 (P=0.0009) and 75% (P=0.0072) in the respective
treatment groups. When compared with CsA treatment alone, Que-WC
treatment led to a dose-dependent decrease (P<0.001) in the BCRP
protein expression levels, by 22 (P=0.0262) and 23% (P=0.0841), 36
(P=0.0044) and 31% (P=0.0475), and 69 (P=0.0004) and 67% (P=0.0015)
in the respective treatment groups (Fig. 4F). Therefore, in the small
intestine and liver the protein expression levels of BCRP were
inhibited by Que to a similar extent.
Protein expression levels of MRP2
A dose-dependent decrease (P<0.0001) was observed
in the protein expression levels of MRP2 in the small intestine and
liver of Que-WOC rats compared with the control (vehicle) group, by
13 (P=0.0874) and 14% (P=0.2608), 45 (P=0.0011) and 27% (P=0.0693),
and 93 (P<0.0001) and 58% (P=0.0041) in the respective treatment
groups. Similar to the mRNA expression level results, CsA treatment
led to a significant increase in the intestinal protein expression
level of MRP2 (45%; P=0.0187), while in the liver MRP2 was not
significantly influenced by CsA treatment (P=0.6103). When compared
with CsA treatment, Que-WC treatment led to a dose-dependent
decrease (P<0.0001 and P=0.0260, respectively) in MRP2 protein
expression levels, by 32 (P=0.0164) and 22% (P=0.0934), 52
(P=0.0023) and 23% (P=0.0776), and 82 (P=0.0004) and 35% (P=0.0235)
in the respective treatment groups (Fig. 4G).
Taken together, these results revealed that the
protein expression levels of the investigated DMEs and DTs were
dose-dependently inhibited by Que to a similar extent in the small
intestine and liver. However, in contrast to the mRNA expression
level results, the low-dose (25 mg/kg) Que treatment did not
demonstrate a significant inhibitory effect on the protein
expression levels when compared with the control.
Discussion
Currently, flavonoid-drug interactions are gaining
the attention of the scientific community, particularly with regard
to clinical practice. Increasing evidence suggests that Que may
interact with numerous xenobiotics. For example, Que has been
demonstrated to increase the bioavailability of various drugs,
including fexofenadine (43),
rosiglitazone (44) and CsA
(33) in humans; paclitaxel
(45), valsartan (46), ranolazine (47), tamoxifen (48) and doxorubicin (49) in rats; and digoxin (50) in pigs. By contrast, Que decreased
the bioavailability of talinolol (51) in humans, metoprolol (52) in rats, simvastatin (53) in pigs and CsA (32,34–36)
in pigs and rats. Therefore, the HDIs of Que co-administration with
other drugs, as well as the effect of Que on CYP3A and P-gp, remain
to be fully elucidated. To the best of our knowledge, this is the
first report to systematically demonstrate the impact of
multiple-dose administration of Que on DMEs and DTs in the small
intestine and liver, as well as on the pharmacokinetics of CsA.
CsA is an immunosuppressant that is routinely used
to prevent rejection of kidney, liver, heart and bone marrow
transplants and in addition is used to treat various autoimmune
diseases (27). Clinically, a
supra-therapeutic CsA blood level may result in adverse effects
including nephrotoxicity, hepatotoxicity and neurotoxicity
(27). Conversely, a
sub-therapeutic blood level may result in allograft rejection by
transplant recipients (54). As
CsA is effective within a narrow therapeutic index (37), a thorough understanding of its
propensity for HDIs is required prior to co-administration with
novel pharmacologic agents that may affect its efficacy.
CsA is primarily metabolized in the small intestine
and liver by isoenzymes CYP3A4 and CYP3A5 (27,55).
In addition, UGT1A and 2B, P-gp and MRP2 are involved in CsA
bioavailability (27–29). Numerous factors, including food
ingestion, changes in gastric motility, diarrhea, diabetes and
genetic polymorphism (56), may
affect CsA metabolism and bioavailability, and information is
required by clinicians and patients to prevent the inadvertent
alteration of CsA serum levels. In addition, a leading cause of
altered CsA metabolism is the co-administration of herbal medicines
that affect the activity of DMEs or DTs, or alter their
interactions with CsA, including ginkgo, St John's wort, ginger,
ginseng, garlic and berberine (2,37).
Besides the ameliorative effect of Que on
CsA-induced nephrotoxicity and hepatotoxicity (8,9), Que
is known to affect the immune system (40,57).
Que has been reported to inhibit the production of IL-2 by human T
cells in a dose-dependent manner (57), which may explain its
immunosuppressive effects. Co-administration with CsA may therefore
enhance immunosuppression.
In the present study, the pharmacokinetic
interaction between Que and CsA was investigated in rats. Based on
the ratio of surface area (human/rat), the doses of 25, 50 and 100
mg/kg were tested in rats in the present study, with the
corresponding doses in humans being 250, 500 and 1000 mg/day. The
findings of the present study demonstrated that concomitant oral
administration of Que (25,50 and 100 mg/kg) dose-independently
decreased Cmax by 46, 50, and 47% (P<0.01). In
addition, the AUC0−t and AUC0−∞ of CsA was
decreased, by 21 and 16%, 30 and 33%, and 33 and 34% (P<0.01),
respectively. Furthermore, Que-treated rats displayed significantly
increased MRT0−t values compared with control rats, with
dose-independent increases of 16, 19, and 9% (P<0.05) in the
low-, moderate- and high-dose groups, respectively. Notably, there
were no significant differences (P>0.05, by ANOVA) in
Cmax, AUC0−t, AUC0−∞ and
MRT0−t among three-dose Que co-administration groups in
the present study. Furthermore, no significant differences were
observed in the Tmax, CL/F and
t1/2 of CsA in the presence of Que when
compared to CsA alone. Therefore, Que co-administration had a
significant effect on CsA pharmacokinetics. These results were
consistent with previous reports that the bioavailability of CsA in
pigs and rats was reduced when Que or Que-derived products were
co-administered (32,34–36).
However, in a study by Choi et al (33), the AUC of CsA was increased by 18%
when Que was orally co-administered (CsA 300 mg plus Que 5 mg/kg),
by 36% when healthy male subjects received Que 30 min prior to CsA
treatment, and by 47% when subjects received Que for three days
prior to CsA treatment. This result contrasts with the results of
the present study, which may be due to differences in the subjects,
the methods of administration and the doses.
Furthermore, the results of the present study
demonstrated that Que produced a significant inhibitory effect on
the mRNA and protein expression of DMEs and DTs in the small
intestine and liver of rats. Significantly, Que administered orally
was capable of changing the mRNA and protein expression levels in
the rat small intestine, and also modified the mRNA and protein
expression levels in the rat liver. Notably, it was revealed that
the mRNA expression levels of Cyp3a1, Cyp3a2, Ugt1a1, Slco2b1,
Slco1b2, Mdr1, Bcrp and Mrp2 were inhibited by Que in a
dose-dependent manner (P<0.05) to a similar extent in the small
intestine and liver. Additionally, in the small intestine and
liver, when compared with CsA treatment alone, Que-WC treatment led
to a dose-dependent decrease (P<0.05) in the mRNA expression
levels in the low-, moderate- and high-dose co-administration
groups. Notably, Que exerted a marked inhibitory effect on
intestinal Slco2b1 and hepatic Slco1b2 mRNA
expression, with reductions of 84 and 79%, 92 and 92%, and 97 and
95% (P<0.001) in the low-, moderate- and high-dose groups,
respectively. These effects should be further investigated in
future research. Similarly, the protein expression levels of
CYP3A1, CYP3A2, UGT1A, OATP2B1, OATP1B2, P-gp, BCRP and MRP2 were
inhibited by Que in a dose-dependent manner (P<0.05) to a
similar extent in the small intestine and liver. However, in
contrast to the mRNA results, the low-dose (25 mg/kg) Que treatment
did not produce a significant inhibitory effect on the protein
expression levels when compared with the control. Notably, when
compared with the potent inhibitory effect observed on mRNA
expression levels, Que had a relatively weaker inhibitory effect on
the protein expression levels.
The results of the present study were consistent
with previous observations made in vitro and in vivo
following co-treatment with Que (18,20–22,26).
However, evidence has not always been consistent (16,17).
Rats fed a diet containing 1% Que demonstrated significantly
increased activity of UGTs in the liver and, to a lesser extent, in
the small intestine (58). Que
significantly induced CYP3A activity and this induction was
somewhat associated with the CYP3A5 genotype, being more
prominent in CYP3A5*1/*1 and
CYP3A5*1/*3 individuals
(17). A previous study in healthy
Chinese subjects demonstrated that Que significantly induced the
activity of P-gp and this effect was more pronounced in individuals
with the MDR1 3435 TT polymorphism (25). Thus, the effects of Que on P-gp
remain to be fully understood (16). In a previous study of vincristine
in MBEC4 cells, Que was observed to decrease the uptake of
vincristine at low concentrations (10 μM); however, it
increased its uptake at high concentrations (50 μM)
(59). These biphasic in
vitro results were supported by a study on ddY mice in
vivo with co-administration of vincristine and Que at low (0.1
mg/kg) and high doses (1.0 mg/kg) (59). The biphasic effects were due to an
alteration in the function of P-gp. At low concentrations, P-gp
activity was increased as a result of enhanced phosphorylation,
while at high concentrations P-gp was inhibited (59). A study identified that the major
phase II metabolites of Que (including 3′-O-methylquercetin,
4′-O-methylquercetin, quercetin-3-O-β-glucoside, and
quercetin-3-O-rhamnosylglucoside) inhibited MRP2 functions to a
similar extent as the original compound (60). Que at a concentration of 25
μM markedly induced mRNA and protein expression of BCRP in
Caco-2 cells, possibly through regulation of the aryl hydrocarbon
receptor (61). The majority of
flavonoids have been demonstrated to acutely inhibit the activity
of DMEs and DTs; however, chronically, DMEs and DTs had enhanced
expression and/or activity (16).
Aside from the previously mentioned exceptions (16–17,25,58–61),
the majority of the evidence supports an inhibitory role of Que on
DMEs and DTs.
Interplay between P-gp and CYP3A has been
previously demonstrated (38,62).
P-gp increases the availability of a drug for metabolism by
intestinal CYP3A by expelling it from enterocytes into the lumen of
the intestine, thus promoting its metabolism (38). In addition, a previous study
revealed that in CYP3A4-expressing Caco-2 cells, P-gp activity
increased CsA metabolism (63).
However, in the present study, the decrease in intestinal P-gp did
not result in a marked increase in CsA plasma concentration.
Therefore, other factors that remain to be identified, such as the
interplay between other DMEs and DTs, may be involved in the
metabolism of CsA.
As an extension to the idea of interplay between
CYPs and efflux transporters, the dependence of phase II metabolic
enzymes on efflux transporters was systematically illustrated
utilizing various model systems, which may drive the metabolic
disposition and clearance processes of flavonoids (16,64).
Notably, synergistic interplay between multiple phase II
enzyme-efflux transporter combinations has been investigated,
including UGTs-MRPs, UGTs-BCRP, SULTs-BCRP and GST-MRPs (64). Transport of metabolites increased
the total metabolite formation (64), although the mechanistic basis of
the synergistic interplay of DMEs and DTs remains to be elucidated.
Therefore, the interplay between DMEs and DTs is hypothesized to
explain the pharmacokinetic interactions between Que and CsA in the
present study (38).
As CsA is a dual substrate for DMEs and DTs, ex
vivo investigations may not fully characterize the complex HDIs
involved in the interplay between DMEs and DTs. As Que is an
inhibitor of various DME and DT proteins, the results of the
present study do not reveal whether the decrease in CsA
concentration is the result of effects on DME/DT interplay,
resulting in a decrease in the absorption of CsA, increased
metabolism or a combination of the two. Therefore, the underlying
mechanisms of the interaction revealed in the present study remain
to be fully elucidated. In vitro studies may facilitate the
identification of the underlying mechanisms involved in DME/DT
interplay, and studies in human cells are required to determine any
species-specific variations (16,38).
Notably, Que primarily exists in plants as
glycosides. Que glycosides are hydrolyzed and metabolized by DMEs
in the intestines of animals and humans (65). Furthermore, it was recently
demonstrated that Que 3-O-β-D-glucuronide and Que-3′-O-sulphate are
the primary Que conjugates in human and animal plasma, in which Que
glycosides or Que aglycone could not be detected (66,67).
In the present study, therefore, the Que metabolites rather than
Que, may interact with DMEs and DTs in vivo. Various in
vitro studies have revealed that the major phase II metabolites
of Que were equal to or more potent than Que in the inhibition of
MRP1, MRP2 and OAT1 (60,68). Therefore, it is crucial to
understand the metabolism of compounds in order to investigate
their effects. Further investigation is required to determine the
effects of Que metabolites on DMEs and DTs in vitro and
in vivo.
In conclusion, for the first time, to the best of
our knowledge, the present study demonstrated that, following
multiple-dose co-administration to rats, Que reduced CsA
bioavailability, seemingly in contrast to the individual inhibitory
effect on mRNA and protein expression levels of DMEs and DTs in the
small intestine and liver. Overlapping modulation of intestinal and
hepatic DMEs and DTs, as well as their interplay, may be
responsible for this observation. The results of the present study
suggest a novel mechanism underlying flavonoid-drug interactions,
and may be clinically significant for patients taking CsA and Que
or Que-containing dietary/herbal supplements simultaneously.
Acknowledgments
The present study was supported by the National
Natural Science Foundation of China (grant nos. 81273591 and
81503161) and the Fundamental Research Funds for the Central
Universities (grant nos. 2014YGYL003 and 2016YXZD050).
References
|
1
|
Ma Y, Zeng M, Sun R and Hu M: Disposition
of flavonoids impacts their efficacy and safety. Curr Drug Metab.
15:841–864. 2014. View Article : Google Scholar
|
|
2
|
Shi S and Klotz U: Drug interactions with
herbal medicines. Clin Pharmacokinet. 51:77–104. 2012. View Article : Google Scholar : PubMed/NCBI
|
|
3
|
Morris ME and Zhang S: Flavonoid-drug
interactions: Effects of flavonoids on ABC transporters. Life Sci.
78:2116–2130. 2006. View Article : Google Scholar : PubMed/NCBI
|
|
4
|
Egert S, Wolffram S, Bosy-Westphal A,
Boesch-Saadatmandi C, Wagner AE, Frank J, Rimbach G and Mueller MJ:
Daily quercetin supplementation dose-dependently increases plasma
quercetin concentrations in healthy humans. J Nutr. 138:1615–1621.
2008.PubMed/NCBI
|
|
5
|
Russo M, Spagnuolo C, Tedesco I, Bilotto S
and Russo GL: The flavonoid quercetin in disease prevention and
therapy: Facts and fancies. Biochem Pharmacol. 83:6–15. 2012.
View Article : Google Scholar
|
|
6
|
Cai X, Fang Z, Dou J, Yu A and Zhai G:
Bioavailability of quercetin: Problems and promises. Curr Med Chem.
20:2572–2582. 2013. View Article : Google Scholar : PubMed/NCBI
|
|
7
|
Dajas F: Life or death: Neuroprotective
and anticancer effects of quercetin. J Ethnopharmacol. 143:383–396.
2012. View Article : Google Scholar : PubMed/NCBI
|
|
8
|
Zal F, Mostafavi-Pour Z and Vessal M:
Comparison of the effects of vitamin E and/or quercetin in
attenuating chronic cyclosporine A-induced nephrotoxicity in male
rats. Clin Exp Pharmacol Physiol. 34:720–724. 2007. View Article : Google Scholar : PubMed/NCBI
|
|
9
|
Mostafavi-Pour Z, Zal F, Monabati A and
Vessal M: Protective effects of a combination of quercetin and
vitamin E against cyclosporine A-induced oxidative stress and
hepatotoxicity in rats. Hepatol Res. 38:385–392. 2008. View Article : Google Scholar
|
|
10
|
Dodda D, Chhajed R and Mishra J:
Protective effect of quercetin against acetic acid induced
inflammatory bowel disease (IBD) like symptoms in rats: Possible
morphological and biochemical alterations. Pharmacol Rep.
66:169–173. 2014. View Article : Google Scholar : PubMed/NCBI
|
|
11
|
Dodda D, Chhajed R, Mishra J and Padhy M:
Targeting oxidative stress attenuates trinitrobenzene sulphonic
acid induced inflammatory bowel disease like symptoms in rats: Role
of quercetin. Indian J Pharmacol. 46:286–291. 2014. View Article : Google Scholar : PubMed/NCBI
|
|
12
|
Abarikwu SO, Pant AB and Farombi EO: The
protective effects of quercetin on the cytotoxicity of atrazine on
rat Sertoli-germ cell co-culture. Int J Androl. 35:590–600. 2012.
View Article : Google Scholar : PubMed/NCBI
|
|
13
|
Abarikwu SO, Pant AB and Farombi EO:
Quercetin decreases steroidogenic enzyme activity, NF-κB
expression, and oxidative stress in cultured Leydig cells exposed
to atrazine. Mol Cell Biochem. 373:19–28. 2013. View Article : Google Scholar
|
|
14
|
Tang Y, Gao C, Xing M, Li Y, Zhu L, Wang
D, Yang X, Liu L and Yao P: Quercetin prevents ethanol-induced
dyslipidemia and mitochondrial oxidative damage. Food Chem Toxicol.
50:1194–1200. 2012. View Article : Google Scholar : PubMed/NCBI
|
|
15
|
Qu L, Liang X, Gu B and Liu W: Quercetin
alleviates high glucose-induced Schwann cell damage by autophagy.
Neural Regen Res. 9:1195–1203. 2014. View Article : Google Scholar : PubMed/NCBI
|
|
16
|
Jiang W and Hu M: Mutual interactions
between flavonoids and enzymatic and transporter elements
responsible for flavonoid disposition via phase II metabolic
pathways. RSC Adv. 2:7948–7963. 2012. View Article : Google Scholar : PubMed/NCBI
|
|
17
|
Duan KM, Wang SY, Ouyang W, Mao YM and
Yang LJ: Effect of quercetin on CYP3A activity in Chinese healthy
participants. J Clin Pharmacol. 52:940–946. 2012. View Article : Google Scholar
|
|
18
|
Priyadarsini RV and Nagini S: Quercetin
suppresses cytochrome P450 mediated ROS generation and NFκB
activation to inhibit the development of
7,12-dimethylbenz[a]anthracene (DMBA) induced hamster buccal pouch
carcinomas. Free Radic Res. 46:41–49. 2012. View Article : Google Scholar
|
|
19
|
Chen Y, Xiao P, Ou-Yang DS, Fan L, Guo D,
Wang YN, Han Y, Tu JH, Zhou G, Huang YF and Zhou HH: Simultaneous
action of the flavonoid quercetin on cytochrome P450 (CYP) 1A2,
CYP2A6, N-acetyltransferase and xanthine oxidase activity in
healthy volunteers. Clin Exp Pharmacol Physiol. 36:828–833. 2009.
View Article : Google Scholar : PubMed/NCBI
|
|
20
|
Rastogi H and Jana S: Evaluation of
inhibitory effects of caffeic acid and quercetin on human liver
cytochrome p450 activities. Phytother Res. 28:1873–1878. 2014.
View Article : Google Scholar : PubMed/NCBI
|
|
21
|
Brand W, Schutte ME, Williamson G, van
Zanden JJ, Cnubben NH, Groten JP, van Bladeren PJ and Rietjens IM:
Flavonoid-mediated inhibition of intestinal ABC transporters may
affect the oral bioavailability of drugs, food-borne toxic
compounds and bioactive ingredients. Biomed Pharmacother.
60:508–519. 2006. View Article : Google Scholar : PubMed/NCBI
|
|
22
|
Alvarez AI, Real R, Pérez M, Mendoza G,
Prieto JG and Merino G: Modulation of the activity of ABC
transporters (P-glycoprotein, MRP2, BCRP) by flavonoids and drug
response. J Pharm Sci. 99:598–617. 2010. View Article : Google Scholar
|
|
23
|
van Zanden JJ, Wortelboer HM, Bijlsma S,
Punt A, Usta M, Bladeren PJ, Rietjens IM and Cnubben NH:
Quantitative structure activity relationship studies on the
flavonoid mediated inhibition of multidrug resistance proteins 1
and 2. Biochem Pharmacol. 69:699–708. 2005. View Article : Google Scholar : PubMed/NCBI
|
|
24
|
Odenthal J, van Heumen BW, Roelofs HM, te
Morsche RH, Marian B, Nagengast FM and Peters WH: The influence of
curcumin, quercetin, and eicosapentaenoic acid on the expression of
phase II detoxification enzymes in the intestinal cell lines HT-29,
Caco-2, HuTu 80, and LT97. Nutr Cancer. 64:856–863. 2012.
View Article : Google Scholar : PubMed/NCBI
|
|
25
|
Wang SY, Duan KM, Li Y, Mei Y, Sheng H,
Liu H, Mei X, Ouyang W, Zhou HH and Liu ZQ: Effect of quercetin on
P-glycoprotein transport ability in Chinese healthy subjects. Eur J
Clin Nutr. 67:390–394. 2013. View Article : Google Scholar : PubMed/NCBI
|
|
26
|
Wu LX, Guo CX, Chen WQ, Yu J, Qu Q, Chen
Y, Tan ZR, Wang G, Fan L, Li Q, et al: Inhibition of the organic
anion-transporting polypeptide 1B1 by quercetin: An in vitro and in
vivo assessment. Br J Clin Pharmacol. 73:750–757. 2012. View Article : Google Scholar :
|
|
27
|
Tedesco D and Haragsim L: Cyclosporine: A
review. J Transplant. 2012:2303862012.PubMed/NCBI
|
|
28
|
Dupuis R, Yuen A and Innocenti F: The
influence of UGT polymorphisms as biomarkers in solid organ
transplantation. Clin Chim Acta. 413:1318–1325. 2012. View Article : Google Scholar : PubMed/NCBI
|
|
29
|
Kato R, Nishide M, Kozu C, Iwamoto A,
Urashima K, Suzuki K, Ijiri Y, Hayashi T and Tanaka K: Is
cyclosporine A transport inhibited by pravastatin via multidrug
resistant protein 2? Eur J Clin Pharmacol. 66:153–158. 2010.
View Article : Google Scholar
|
|
30
|
Fu J, Tjandra M, Becker C, Bednarczyk D,
Capparelli M, Elling R, Hanna I, Fujimoto R, Furegati M, Karur S,
et al: Potent nonimmunosuppressive cyclophilin inhibitors with
improved pharmaceutical properties and decreased transporter
inhibition. J Med Chem. 57:8503–8516. 2014. View Article : Google Scholar : PubMed/NCBI
|
|
31
|
Li L, Yao QQ, Xu SY, Hu HH, Shen Q, Tian
Y, Pan LY, Zhou H, Jiang HD, Lu C, et al: Cyclosporin A affects the
bioavailability of ginkgolic acids via inhibition of P-gp and BCRP.
Eur J Pharm Biopharm. 88:759–767. 2014. View Article : Google Scholar : PubMed/NCBI
|
|
32
|
Yu CP, Wu PP, Hou YC, Lin SP, Tsai SY,
Chen CT and Chao PD: Quercetin and rutin reduced the
bioavailability of cyclosporine from Neoral, animmunosuppressant,
through activating P-glycoprotein and CYP 3A4. J Agric Food Chem.
59:4644–4648. 2011. View Article : Google Scholar : PubMed/NCBI
|
|
33
|
Choi JS, Choi BC and Choi KE: Effect of
quercetin on the pharmacokinetics of oral cyclosporine. Am J Health
Syst Pharm. 61:2406–2409. 2004.PubMed/NCBI
|
|
34
|
Yang CY, Chao PD, Hou YC, Tsai SY, Wen KC
and Hsiu SL: Marked decrease of cyclosporin bioavailability caused
by coadministration of ginkgo and onion in rats. Food Chem Toxicol.
44:1572–1578. 2006. View Article : Google Scholar : PubMed/NCBI
|
|
35
|
Hsiu SL, Hou YC, Wang YH, Tsao CW, Su SF
and Chao PD: Quercetin significantly decreased cyclosporin oral
bioavailability in pigs and rats. Life Sci. 72:227–235. 2002.
View Article : Google Scholar : PubMed/NCBI
|
|
36
|
Hsu PW, Shia CS, Lin SP, Chao PD, Juang SH
and Hou YC: Potential risk of mulberry-drug interaction: Modulation
on P-glycoprotein and cytochrome P450 3A. J Agric Food Chem.
61:4464–4469. 2013. View Article : Google Scholar : PubMed/NCBI
|
|
37
|
Colombo D, Lunardon L and Bellia G:
Cyclosporine and herbal supplement interactions. J Toxicol.
2014:1453252014.PubMed/NCBI
|
|
38
|
Shi S and Li Y: Interplay of
Drug-Metabolizing enzymes and transporters in drug absorption and
disposition. Curr Drug Metab. 15:915–941. 2014. View Article : Google Scholar
|
|
39
|
Wu B: Pharmacokinetic interplay of phase
II metabolism and transport: A theoretical study. J Pharm Sci.
101:381–393. 2012. View Article : Google Scholar
|
|
40
|
Lei H, Luo J, Tong L, Peng LQ, Qi Y, Jia
ZG and Wei Q: Quercetin binds to calcineurin at a similar region to
cyclosporin A and tacrolimus. Food Chem. 127:1169–1174. 2011.
View Article : Google Scholar : PubMed/NCBI
|
|
41
|
Barbas CF III, Burton DR, Scott JK and
Silverman GJ: Quantitation of DNA and RNA. CSH Protoc.
2007:pdb.ip472007.PubMed/NCBI
|
|
42
|
Livak KJ and Schmittgen TD: Analysis of
relative gene expression data using real-time quantitative PCR and
the 2(−Delta Delta C(T)) Method. Methods. 25:402–428. 2001.
View Article : Google Scholar
|
|
43
|
Kim KA, Park PW and Park JY: Short-term
effect of quercetin on the pharmacokinetics of fexofenadine, a
substrate of P-glycoprotein, in healthy volunteers. Eur J Clin
Pharmacol. 65:609–614. 2009. View Article : Google Scholar : PubMed/NCBI
|
|
44
|
Kim KA, Park PW, Kim HK, Ha JM and Park
JY: Effect of quercetin on the pharmacokinetics of rosiglitazone, a
CYP2C8 substrate, in healthy subjects. J Clin Pharmacol.
45:941–946. 2005. View Article : Google Scholar : PubMed/NCBI
|
|
45
|
Choi JS, Jo BW and Kim YC: Enhanced
paclitaxel bioavailability after oral administration of paclitaxel
or prodrug to rats pretreated with quercetin. Eur J Pharm Biopharm.
57:313–318. 2004. View Article : Google Scholar : PubMed/NCBI
|
|
46
|
Challa VR, Babu PR, Challa SR, Johnson B
and Maheswari C: Pharmacokinetic interaction study between
quercetin and valsartan in rats and in vitro models. Drug Dev Ind
Pharm. 39:865–872. 2013. View Article : Google Scholar
|
|
47
|
Babu PR, Babu KN, Peter PL, Rajesh K and
Babu PJ: Influence of quercetin on the pharmacokinetics of
ranolazine in rats and in vitro models. Drug Dev Ind Pharm.
39:873–879. 2013. View Article : Google Scholar
|
|
48
|
Shin SC, Choi JS and Li X: Enhanced
bioavailability of tamoxifen after oral administration of tamoxifen
with quercetin in rats. Int J Pharm. 313:144–149. 2006. View Article : Google Scholar : PubMed/NCBI
|
|
49
|
Choi JS, Piao YJ and Kang KW: Effects of
quercetin on the bioavailability of doxorubicin in rats: Role of
CYP3A4 and P-gp inhibition by quercetin. Arch Pharm Res.
34:607–613. 2011. View Article : Google Scholar : PubMed/NCBI
|
|
50
|
Wang YH, Chao PD, Hsiu SL, Wen KC and Hou
YC: Lethal quercetin-digoxin interaction in pigs. Life Sci.
74:1191–1197. 2004. View Article : Google Scholar
|
|
51
|
Nguyen MA, Staubach P, Wolffram S and
Langguth P: Effect of single-dose and short-term administration of
quercetin on the pharmacokinetics of talinolol in
humans-Implications for the evaluation of transporter-mediated
flavonoid-drug interactions. Eur J Pharm Sci. 61:54–60. 2014.
View Article : Google Scholar : PubMed/NCBI
|
|
52
|
Challa SR, Challa VR and Ragam SK:
Quercetin declines plasma exposure of metoprolol tartrate in the
rat model. J Adv Pharm Technol Res. 5:185–190. 2014. View Article : Google Scholar : PubMed/NCBI
|
|
53
|
Cermak R, Wein S, Wolffram S and Langguth
P: Effects of the flavonol quercetin on the bioavailability of
simvastatin in pigs. Eur J Pharm Sci. 38:519–524. 2009. View Article : Google Scholar : PubMed/NCBI
|
|
54
|
Burke JF Jr, Pirsch JD, Ramos EL, Salomon
DR, Stablein DM, Van Buren DH and West JC: Long-term efficacy and
safety of cyclosporine in renal-transplant recipients. N Engl J
Med. 331:358–363. 1994. View Article : Google Scholar : PubMed/NCBI
|
|
55
|
Kronbach T, Fischer V and Meyer UA:
Cyclosporine metabolism in human liver: Identification of a
cytochrome P-450III gene family as the major
cyclosporine-metabolizing enzyme explains interactions of
cyclosporine with other drugs. Clin Pharmacol Ther. 43:630–635.
1988. View Article : Google Scholar : PubMed/NCBI
|
|
56
|
Elens L, Bouamar R, Shuker N, Hesselink
DA, van Gelder T and van Schaik RH: Clinical implementation of
pharmacogenetics in kidney transplantation: Calcineurin inhibitors
in the starting blocks. Br J Clin Pharmacol. 77:715–728. 2014.
View Article : Google Scholar :
|
|
57
|
Yu ES, Min HJ, An SY, Won HY, Hong JH and
Hwang ES: Regulatory mechanisms of IL-2 and IFNgamma suppression by
quercetin in T helper cells. Biochem Pharmacol. 76:70–78. 2008.
View Article : Google Scholar : PubMed/NCBI
|
|
58
|
van der Logt EM, Roelofs HM, Nagengast FM
and Peters WH: Induction of rat hepatic and intestinal
UDP-glucuronosyltransferases by naturally occurring dietary
anticarcinogens. Carcinogenesis. 24:1651–1656. 2003. View Article : Google Scholar : PubMed/NCBI
|
|
59
|
Mitsunaga Y, Takanaga H, Matsuo H, Naito
M, Tsuruo T, Ohtani H and Sawada Y: Effect of bioflavonoids on
vincristine transport across blood-brain barrier. Eur J Pharmacol.
395:193–201. 2000. View Article : Google Scholar : PubMed/NCBI
|
|
60
|
van Zanden JJ, van der Woude H, Vaessen J,
Usta M, Wortelboer HM, Cnubben NH and Rietjens IM: The effect of
quercetin phase II metabolism on its MRP1 and MRP2 inhibiting
potential. Biochem Pharmacol. 74:345–351. 2007. View Article : Google Scholar : PubMed/NCBI
|
|
61
|
Ebert B, Seidel A and Lampen A:
Phytochemicals induce breast cancer resistance protein in Caco-2
cells and enhance the transport of benzo[a]pyrene-3-sulfate.
Toxicol Sci. 96:227–236. 2007. View Article : Google Scholar
|
|
62
|
Benet LZ: The drug transporter-metabolism
alliance: Uncovering and defining the interplay. Mol Pharm.
6:1631–1643. 2009. View Article : Google Scholar : PubMed/NCBI
|
|
63
|
Gan LS, Moseley MA, Khosla B, Augustijns
PF, Bradshaw TP, Hendren RW and Thakker DR: CYP3A-like cytochrome
P450-mediated metabolism and polarized efflux of cyclosporin A in
Caco-2 cells. Drug Metab Dispos. 24:344–349. 1996.PubMed/NCBI
|
|
64
|
Li Y, Zhou J, Ramsden D, Taub ME, O'Brien
D, Xu J, Busacca CA, Gonnella N and Tweedie DJ: Enzyme-transporter
interplay in the formation and clearance of abundant metabolites of
faldaprevir found inexcreta but not in circulation. Drug Metab
Dispos. 42:384–393. 2014. View Article : Google Scholar
|
|
65
|
Chen X, Yin OQ, Zuo Z and Chow MS:
Pharmacokinetics and modeling of quercetin and metabolites. Pharm
Res. 22:892–901. 2005. View Article : Google Scholar : PubMed/NCBI
|
|
66
|
Ishizawa K, Yoshizumi M, Kawai Y, Terao J,
Kihira Y, Ikeda Y, Tomita S, Minakuchi K, Tsuchiya K and Tamaki T:
Pharmacology in health food: Metabolism of quercetin in vivo and
its protective effect against arteriosclerosis. J Pharmacol Sci.
115:466–470. 2011. View Article : Google Scholar : PubMed/NCBI
|
|
67
|
Yokoyama A, Sakakibara H, Crozier A, Kawai
Y, Matsui A, Terao J, Kumazawa S and Shimoi K: Quercetin
metabolites and protection against peroxynitrite-induced oxidative
hepatic injury in rats. Free Radic Res. 43:913–921. 2009.
View Article : Google Scholar : PubMed/NCBI
|
|
68
|
Wong CC, Botting NP, Orfila C, Al-Maharik
N and Williamson G: Flavonoid conjugates interact with organic
anion transporters (OATs) and attenuate cytotoxicity of adefovir
mediated by organic anion transporter 1 (OAT1/SLC22A6). Biochem
Pharmacol. 81:942–949. 2011. View Article : Google Scholar : PubMed/NCBI
|