Introduction
Osteosarcoma is a highly malignant bone tumor with
widespread histological heterogeneity. Clinically, osteosarcoma
lacks biomarkers for early detection and differential diagnosis and
has high local aggressiveness with rapid metastatic potential
(1). Osteosarcoma is the most
common primary bone malignancy and the third most common cancer in
adolescence and young adults (2).
To date, the cause and risk factors of osteosarcoma remain unclear
(2). Depending on the stage at
diagnosis, chemotherapy is routinely used to treat patients with
advanced osteosarcoma and chemotherapeutic drugs, including
methotrexate (MTX), doxorubicin (DOX), vincristine (VCR) and
cisplatin are commonly used in the clinic (3–5).
Despite advances in preoperative neoadjuvant chemotherapy,
osteosarcoma prognosis remains poor due to the development of
multidrug resistance (MDR) (4,6,7).
Tumor cells may become cross-resistant to a broad spectrum of
chemotherapeutic agents following single drug-induced resistance
(8). Currently, VCR remains an
effective chemotherapeutic agent to control osteosarcoma (5); however, resistance to VCR
chemotherapy frequently occurs, as tumor cells often acquire
resistance to drugs and develop MDR, resulting in treatment
failure. However, the mechanism of drug resistance in osteosarcoma
remains elusive. Thus, the current study generated VCR-resistant
osteosarcoma sublines and subsequently assessed their
characteristics, MDR and the underlying molecular events. Indeed,
drug-resistant cell sublines generated by various research groups
have reported different and even contradictory results with regards
to cell proliferation or migration ability, and cell cycle
distribution (9–12). Thus, it is speculated that these
contradictions may be caused by the different resistance index and
tumor heterogeneity, as the tumor cell phenotypes have different
cell subpopulations (13,14). Different mechanisms are responsible
for the development of drug resistances at the cellular level,
which has long been reported in morphological, transcriptional,
genetic and epigenetic studies of cancer (15), and recently in genomic studies
(16,17). The current study may provide a
useful tool for the future study of drug-resistant mechanisms and
strategies for identification of novel targets for the treatment of
patients with osteosarcoma.
Materials and methods
Cell lines and culture
The MG63 human osteosarcoma cell line was obtained
from the Institute of Biochemistry and Cell Biology, Chinese
Academy of Sciences (Shanghai, China) and cultured in high glucose
Dulbecco's modified Eagle's medium (H-DMEM; Invitrogen; Thermo
Fisher Scientific, Inc., Waltham, MA, USA) supplemented with 10%
fetal bovine serum (FBS; Hyclone, Logan, UT, USA) at 37°C in a
humidified incubator with 5% CO2.
Establishment of VCR-resistant cell
sublines
To generate VCR-resistant MG63 sublines, we exposed
MG63 cells to increasing concentrations of VCR according to a
previous study (18). Briefly,
parental MG63 cells were initially cultured in H-DMEM containing
VCR (New Hualian Pharmaceutical Co., Shanghai, China) at a
concentration of 10 ng/ml for 72 h. Surviving cells were collected
and cultured in VCR-free medium for 1–2 weeks and then further
cultured with VCR-containing H-DMEM. This procedure was repeated
for five or more times until the majority of cells survived in the
drug-containing medium. Subsequently, cells were exposed to
increasing concentrations of VCR (10, 20, 30, 50, 75, 100, 200,
300, 500, 800, 1,000 and 2,500 ng/ml). At the high VCR
concentrations, 4–6 weeks were required to establish adequate
growth. Clones selected at 100, 500, 1,000 and 2,500 ng/ml VCR were
re-purified for the subsequent experiments and termed MG63/VCR1,
MG63/VCR2, MG63/VCR3 and MG63/VCR4 respectively, collectively
termed MG63/VCR cells. Prior to each experiment, MG63 and MG63/VCR
cells were maintained in a drug-free medium and subcultured at
least three times.
Colony formation assay
Cells in an exponential growth phase were seeded in
triplicate in a 6-well plate at a density of 500 cells per well in
H-DMEM containing 10% FBS for 2 weeks. Colonies were counted
following fixation with methanol and stained with 0.1% crystal
violet (Sigma-Aldrich, St Louis, MO, USA) in phosphate-buffered
saline (PBS) for 15 min. The experiments were repeated at least
once.
Cell viability assay
The Cell Counting Kit-8 (CCK-8; Dojindo Molecular
Technologies, Inc., Kumamoto, Japan) was applied to assess the
effect of VCR, MTX, pirarubicin (THP), DOX (all from New Hualian
Pharmaceutical Co.), paclitaxel (PTX), and gemcitabine (GEM) (both
from Laboratories Pierre Fabre, Paris, France). Specifically,
mono-dispersed cells in the exponential growth phase were plated
into 96-well plates at a density of 8×10³ cells per well
and cultured in 100 µl H-DMEM supplemented with 10% FBS for
24 h. Subsequently, the culture medium was replaced with medium
containing serial dilutions of various drug formulations as
follows: 125, 25, 5, 1, 0.2, 0.04, 0.008, 0.0016 µg/ml and
drug-free medium used as a control. After 48 h, the medium was
replaced with 10% CCK-8 and cells were incubated at 37°C for 2 h.
Subsequently, the plates were measured at the wavelength of 450 nm
using a plate reader (UV8100D; LabTech, Inc., Hopkinton, MA, USA).
The inhibition ratio was calculated using the following formula:
Inhibition
ratio=(ODcontrol−ODexperiment)/ODcontrol×100%.
Based on this the 50% inhibitory concentration (IC50)
was calculated by the GraphPad Prism 5 (GraphPad Software, USA) and
the resistance indices (RI) was calculated as follows: RI=IC50
MG63/VCR/IC50 MG63.
Flow cytometry cell cycle assay
MG63 and MG63/VCR cells following different
treatments were collected following trypsin digestion, washed with
PBS and fixed in 70% ethanol at 4°C overnight. The fixed cells were
then washed again with cold PBS and stained with 50 µg/ml
DNA-binding dye propidium iodide (PI; Sigma-Aldrich) and 1.0
µg/ml RNase A (Invitrogen; Thermo Fisher Scientific, Inc.)
for 30 min at 37°C in the dark. Cells were then analyzed for cell
cycle distribution using a flow cytometer (BD LSRII; BD
Biosciences, San Jose, CA, USA) with excitation at 485 nm and
emission at 620 nm. Each experiment was performed in triplicate and
repeated three times. FACSDiva 6.0 (BD Biosciences) was used to
analyze the cell cycle distribution.
Cell migration assay
MG63 and MG63/VCR1-4 cells were seeded in 24-well
culture plates at a density of 8×10⁴ cells per well When
the cell reached ~90% confluency a 20 µl pipette tip was
used to make a scratch through the cell monolayer and cells were
washed three times with PBS and subsequently cultured in H-DMEM
without serum for up to 24 h. At the end of each experiment, images
were captured using a fluorescence IX70 microscope (Olympus
Corporation, Tokyo, Japan) and analyzed. The migration abilities
were quantified by measuring the area of the scratched regions
using ImageJ software (imagej.nih.gov).
RNA isolation and reverse
transcription-quantitative polymerase chain reaction (RT-PCR)
Total cellular RNA was isolated using Trizol reagent
(Invitrogen; Thermo Fisher Scientific, Inc.) and RT was performed
to obtain cDNA using the EX Tag kit (Takara Biotechnology Co.,
Ltd., Dalian, China) according to the manufacturer's protocols.
Subsequently, PCR was performed using SYBR® Premix Ex
Taq™ II (Takara) with an ABI7500 Fast Real-Time PCR System (Applied
Biosystems; Thermo Fisher Scientific, Inc.). Relative expression of
each gene was calculated using the 2−ΔΔCq method
(19). The conditions used for
qPCR were as follows: Denaturation at 98°C for 10 sec; annealing at
54–62°C for 30 sec; and elongation at 72°C for 1 min. PCR products
were visualized by electrophoresis on 1.5% agarose gel stained with
GelRed™ (Biotium, Inc., Hayward, CA, USA). Images were obtained
using the Bio-Rad Gel Doc XR+ (Bio-Rad Laboratories, Inc.,
Hercules, CA, USA) and analyzed using the Image Lab™ software
(version 4.0; Bio-Rad Laboratories, Inc.). PCR primers used are as
follows: Multidrug resistance protein 1 (MDR1), forward
5′-ATATCAGCAGCCCACATCAT-3′, reverse 5′-GAAGCACTGGGATGTCCGGT-3′;
MDR-associated protein 1 (MRP1), forward
5′-GTACATTAACATGATCTGGTC-3′, reverse 5′-CGTTCATCAGCTTGATCCGAT-3′;
glutathione S-transferase-π (GST-π), forward
5′-ATGCTGCTGGCAGATCAG-3′, reverse 5′-GTAGATGAGGGAGATGTATTTGCA-3′;
and β-actin, forward 5′-CTGGGACGACATGGAGAAAA-3′, reverse
5′-AAGGAAGGCTGGAAGAGTGC-3′.
Intracellular DOX accumulation
Cells in an exponential growth phase were plated
into 60-mm Petri dishes and treated with or without 1.5 µM
DOX with or without 5 µM verapamil for 3 h at 37°C.
Subsequently, cells were washed three times with ice-cold PBS and
imaged under an inverted fluorescence microscope (IX70; Olympus
Corporation) with a suitable filter at ×200 magnification.
Additionally, the cells were analyzed using flow cytometry to
measure DOX auto-fluorescence. Cells were centrifuged and suspended
in ice-cold PBS and the mono-dispersed cells were analyzed by a
flow cytometer (BD Biosciences) according to the method a previous
study (20). Cell fluorescence was
measured in duplicate at each time point, and all experiments were
repeated three times.
Statistical analysis
All data are expressed as the mean ± standard
deviation. Statistically significant difference was assessed using
the unpaired t-test to compare means between two groups, or
one-way analysis of variance to compare the mean values among three
or more groups using GraphPad Prism software (version 5.04 for
Windows; GraphPad Software, Inc., La Jolla, CA, USA). P<0.05 was
considered to indicate a statistically significant difference.
Results
Characterization of VCR-resistant
osteosarcoma cell sublines
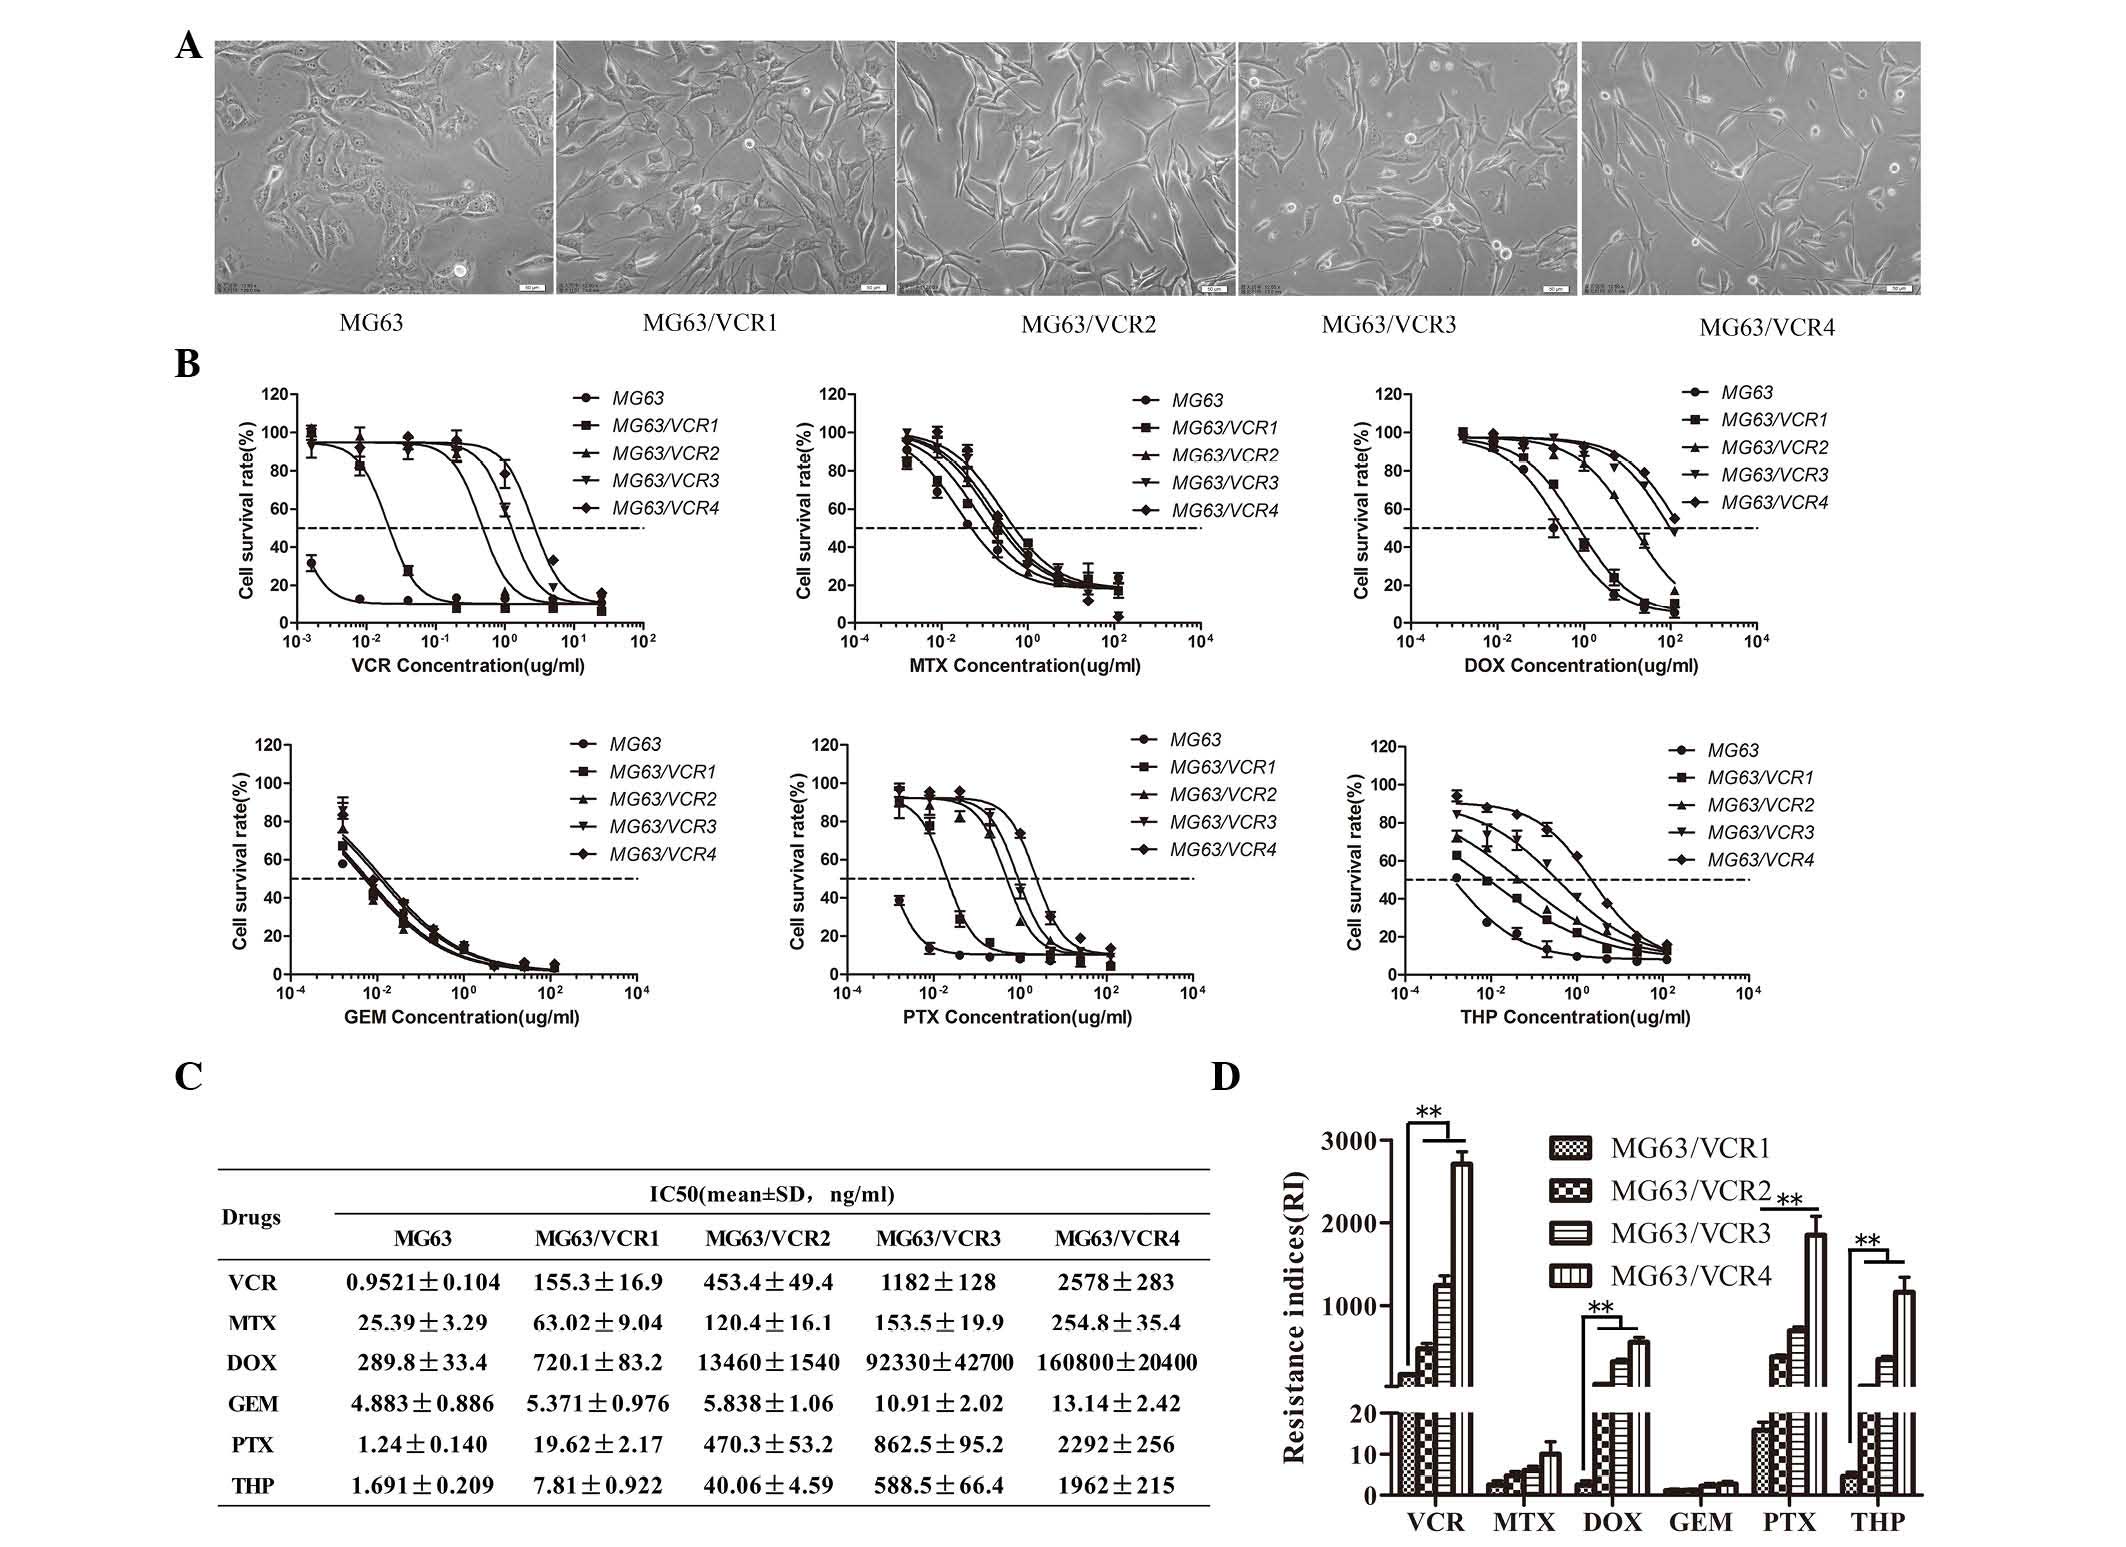
The VCR-resistant sublines exhibited specific
morphological characteristics when observed using inverted
microscope. For example, although MG63 and MG63/VCR cell lines can
proliferate and attach to the bottom of cell culture dishes,
MG63/VCR cells exhibited irregular shapes with an increased
triangular appearance and size, with some giant and small cells.
MG63/VCR cells were often spindle shaped with increased formation
of pseudopodia compared with the MG63 cells. The ratio of the long
and short axis gradually increased with increased drug RI (Fig. 1A). By contrast, parental MG63 cells
were relatively uniform in size, oval in shape with a medium
volume, and exhibited a distinct nucleolus with multiple nucleoli
(Fig. 1A).
VCR-resistant osteosarcoma cell sublines
exhibit resistance to different anticancer drugs
MG63/VCR cells exhibited less sensitivity to
VCR-induced cell cytotoxicity compared with the parental cells.
Specifically, the IC50 values of MG63 and MG63/VCR1, 2,
3 and 4 cell sublines to VCR were 0.952 and 155, 453, 1,182 and
2,578 ng/ml, respectively (Fig. 1B and
C). The RIs of the derivative-resistant sublines 1, 2, 3 and 4
were 163, 476, 1,242, and 2,708-fold higher than the parent MG63
cells, respectively. Notably, MG63/VCR cells also demonstrated a
cross-resistance to DOX, PTX and THP, and a weak resistance to MTX,
however the cells were sensitive to GEM (Fig. 1D).
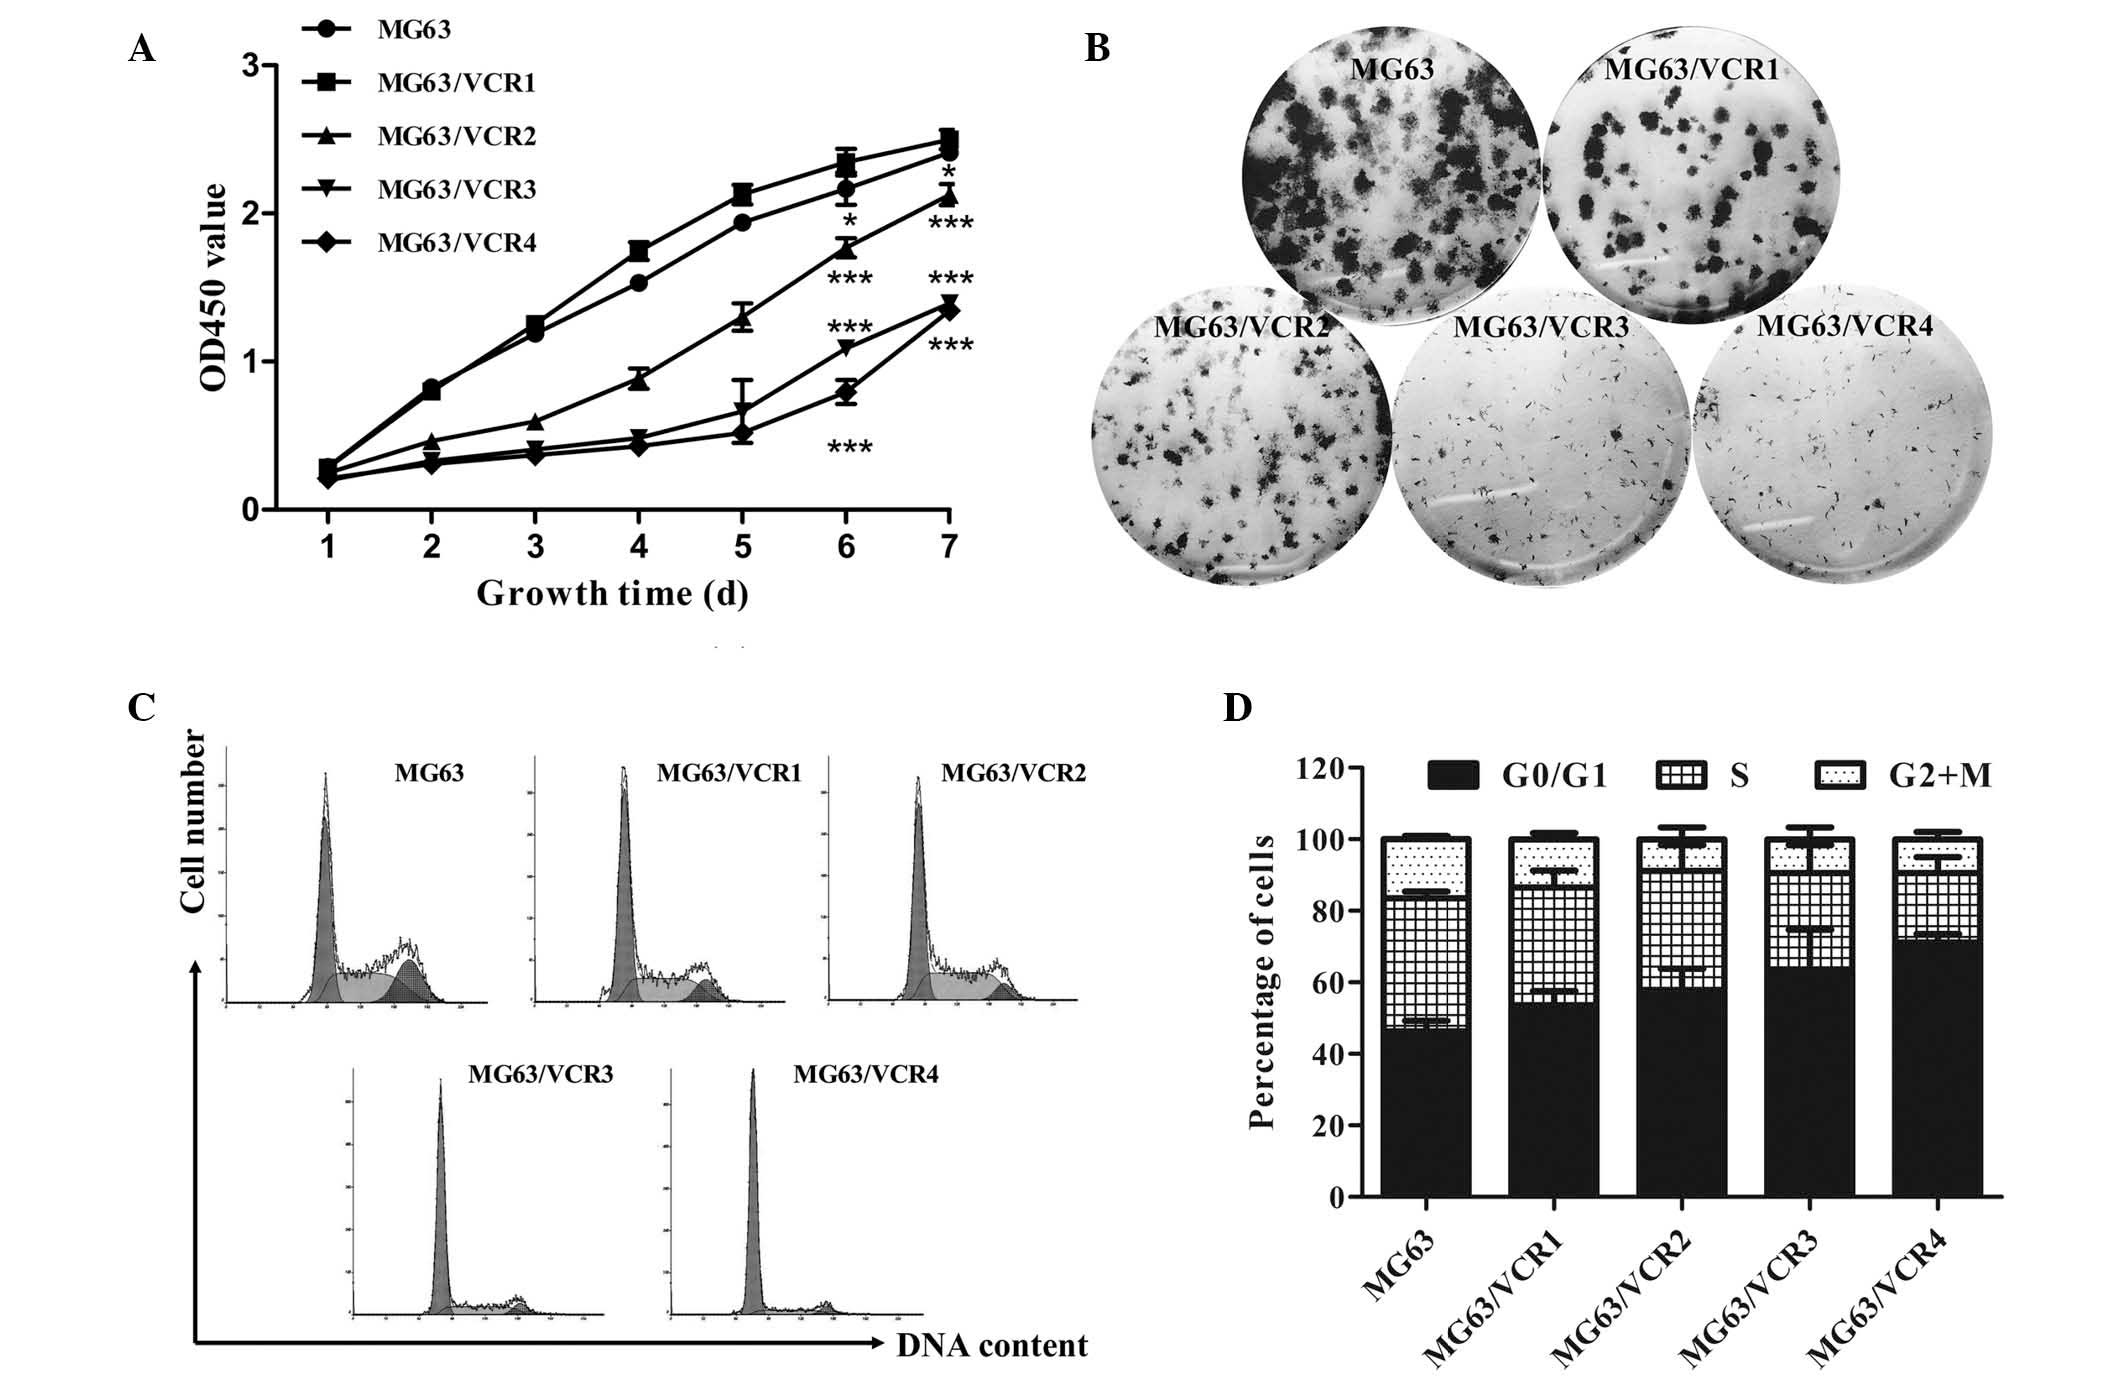
VCR-resistant osteosarcoma cell sublines
exhibit reduced proliferation capacity
MG63/VCR cell growth was reduced compared with the
parental MG63 cells (Fig. 2A) and
the colonies formed were smaller (Fig.
2B), although the colony formation ratio exhibited no
significant difference (data not shown). Cell cycle distribution
was assessed in the VCR-resistant osteosarcoma cell sublines using
flow cytometry. As demonstrated in Fig. 2C and D, there were higher
percentages of MG63/VCR cells in the G0/G1 phase and less in the S
phase compared with parental MG63 cells, which is in accordance
with the drug RI (P<0.05).
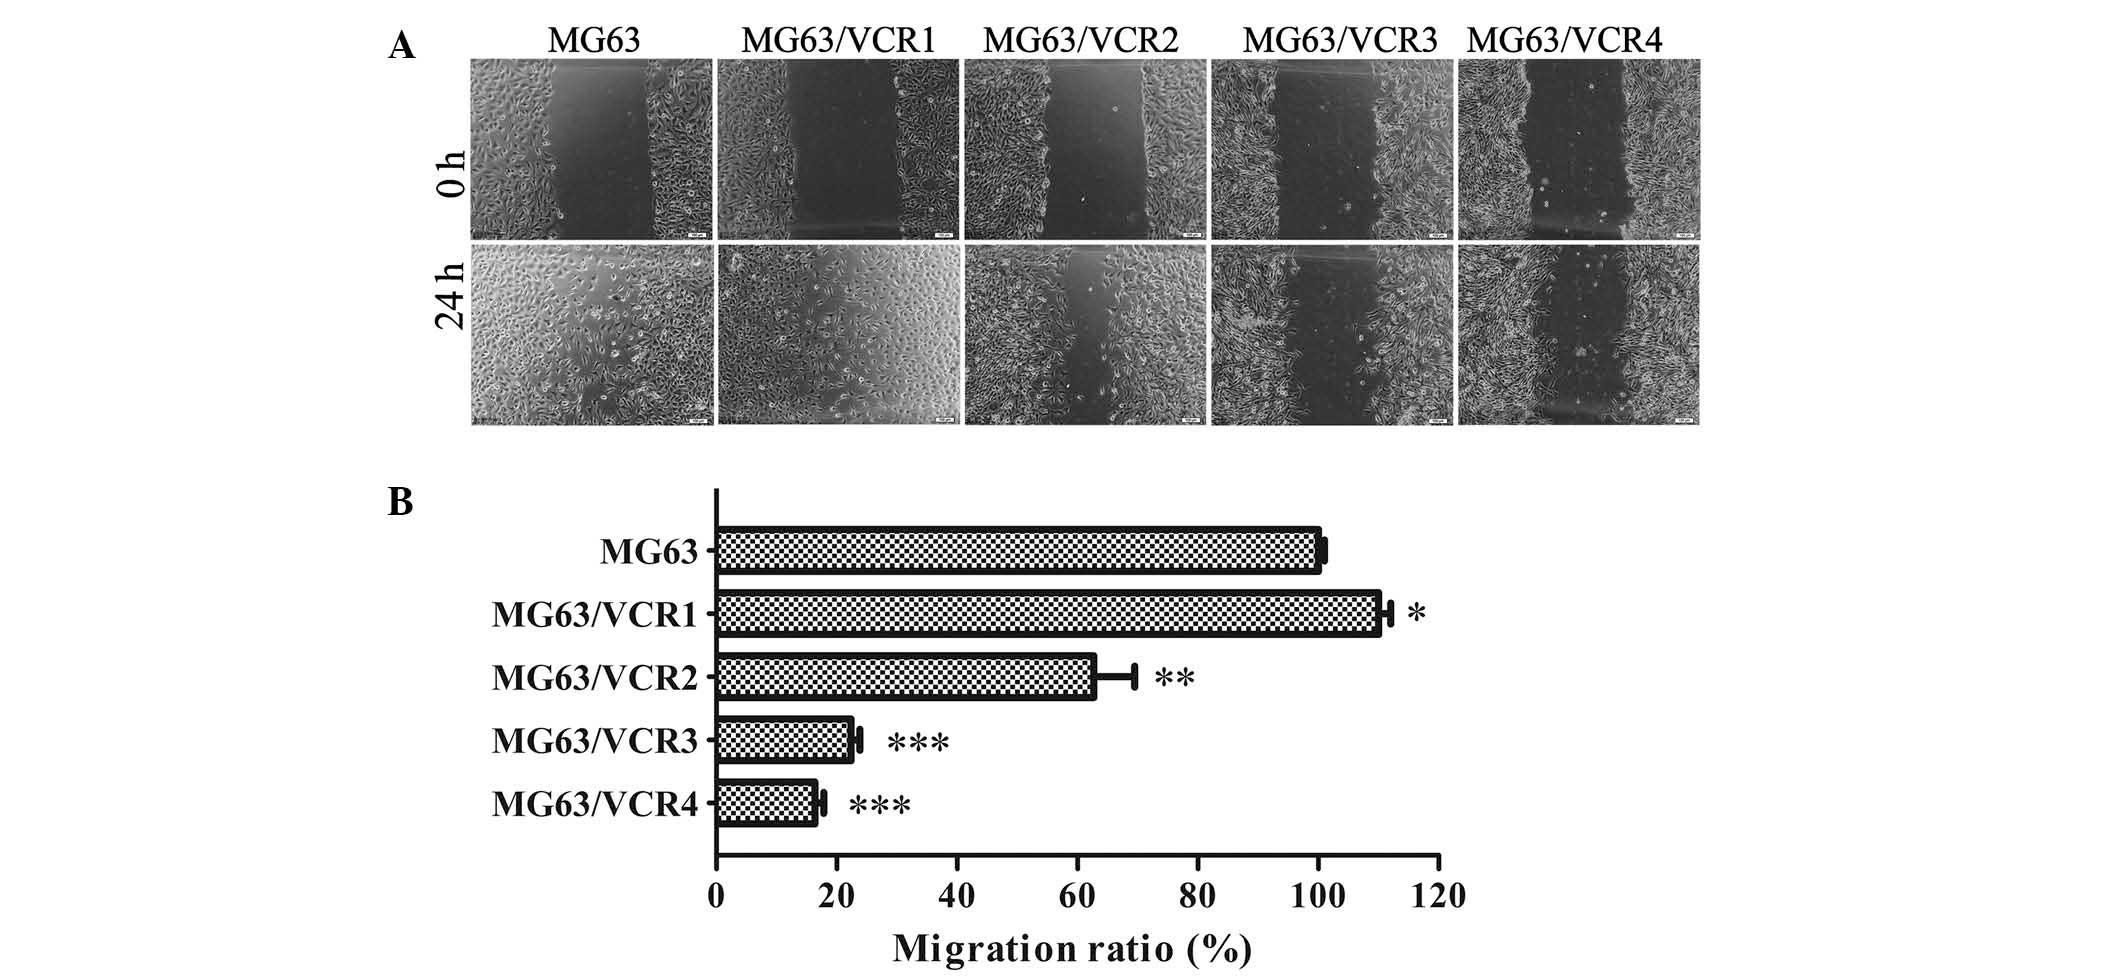
VCR-resistant osteosarcoma cell sublines
exhibit differential migration capacity
A cell wound-healing assay was performed to compare
the migration ability of MG63/VCR and MG63 cells. Remarkably, we
found slower migration ability of MG63/VCR2, MG63/VCR3, and
MG63/VCR 4 cells compared to parental MG63 cells (Fig. 3A and B). Notably, MG63/VCR1 showed
a markedly increased migration ability when compared to MG63 cells
or other sublines.
VCR-resistant osteosarcoma cell sublines
exhibit differential expression of drug resistance-associated
genes
RT-qPCR analysis of different drug
resistance-associated genes was performed and indicated that MDR1,
MRP1, topoisomerase II (TOPO-II), and LIM domain kinase 1 (LIMK1)
mRNA in MG63/VCR cells were expressed at higher levels compared
with MG63 cells (P<0.01). However, in the highly resistant
MG63/VCR3 and MG63/VCR4 cells, the levels of MRP1, TOPO-II, and
LIMK1 were significantly reduced compared with the moderately
resistant MG63/VCR2 cells. Additionally, differential expression of
GST-π mRNA was not detected between MG63/VCR and MG63 cells
(Fig. 4B).
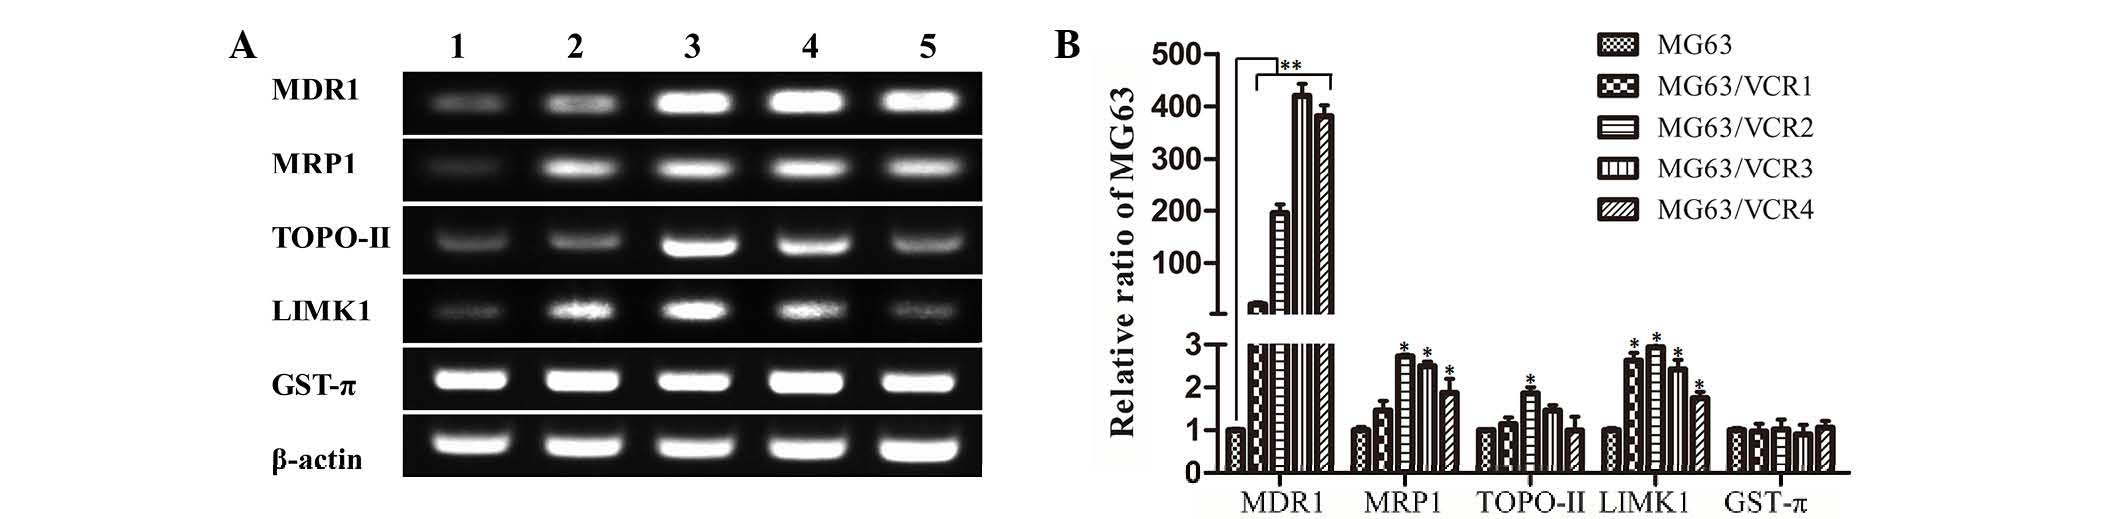 | Figure 4Gene expression of MG63 and MG63/VCR
cells. (A) RT-PCR. Expression of drug resistance-associated genes
was analyzed by RT-PCR and agarose gel electrophoresis of PCR
products of MDR1, MRP1, TOPO-II, LIMK1, GST-π, and β-actin. Lanes
1–5 represent MG63, MG63/VCR1, MG63/VCR2, MG63/VCR3, and MG63/VCR4,
respectively. (B) Expression levels of each mRNA were
quantitatively analyzed and normalized relative to β-actin level.
Data represent the mean ± standard deviation of 5 independent
experiments. *P<0.05, **P<0.01 vs. the
MG63 group. RT-PCR, reverse transcription polymerase chain
reaction; MDR1, multidrug resistance protein 1; MRP1,
MDR-associated protein 1; TOPO-II, topoisomerase II; LIMK1, LIM
domain kinase 1; GST-π, glutathione S-transferase-π; VCR,
vincristine. |
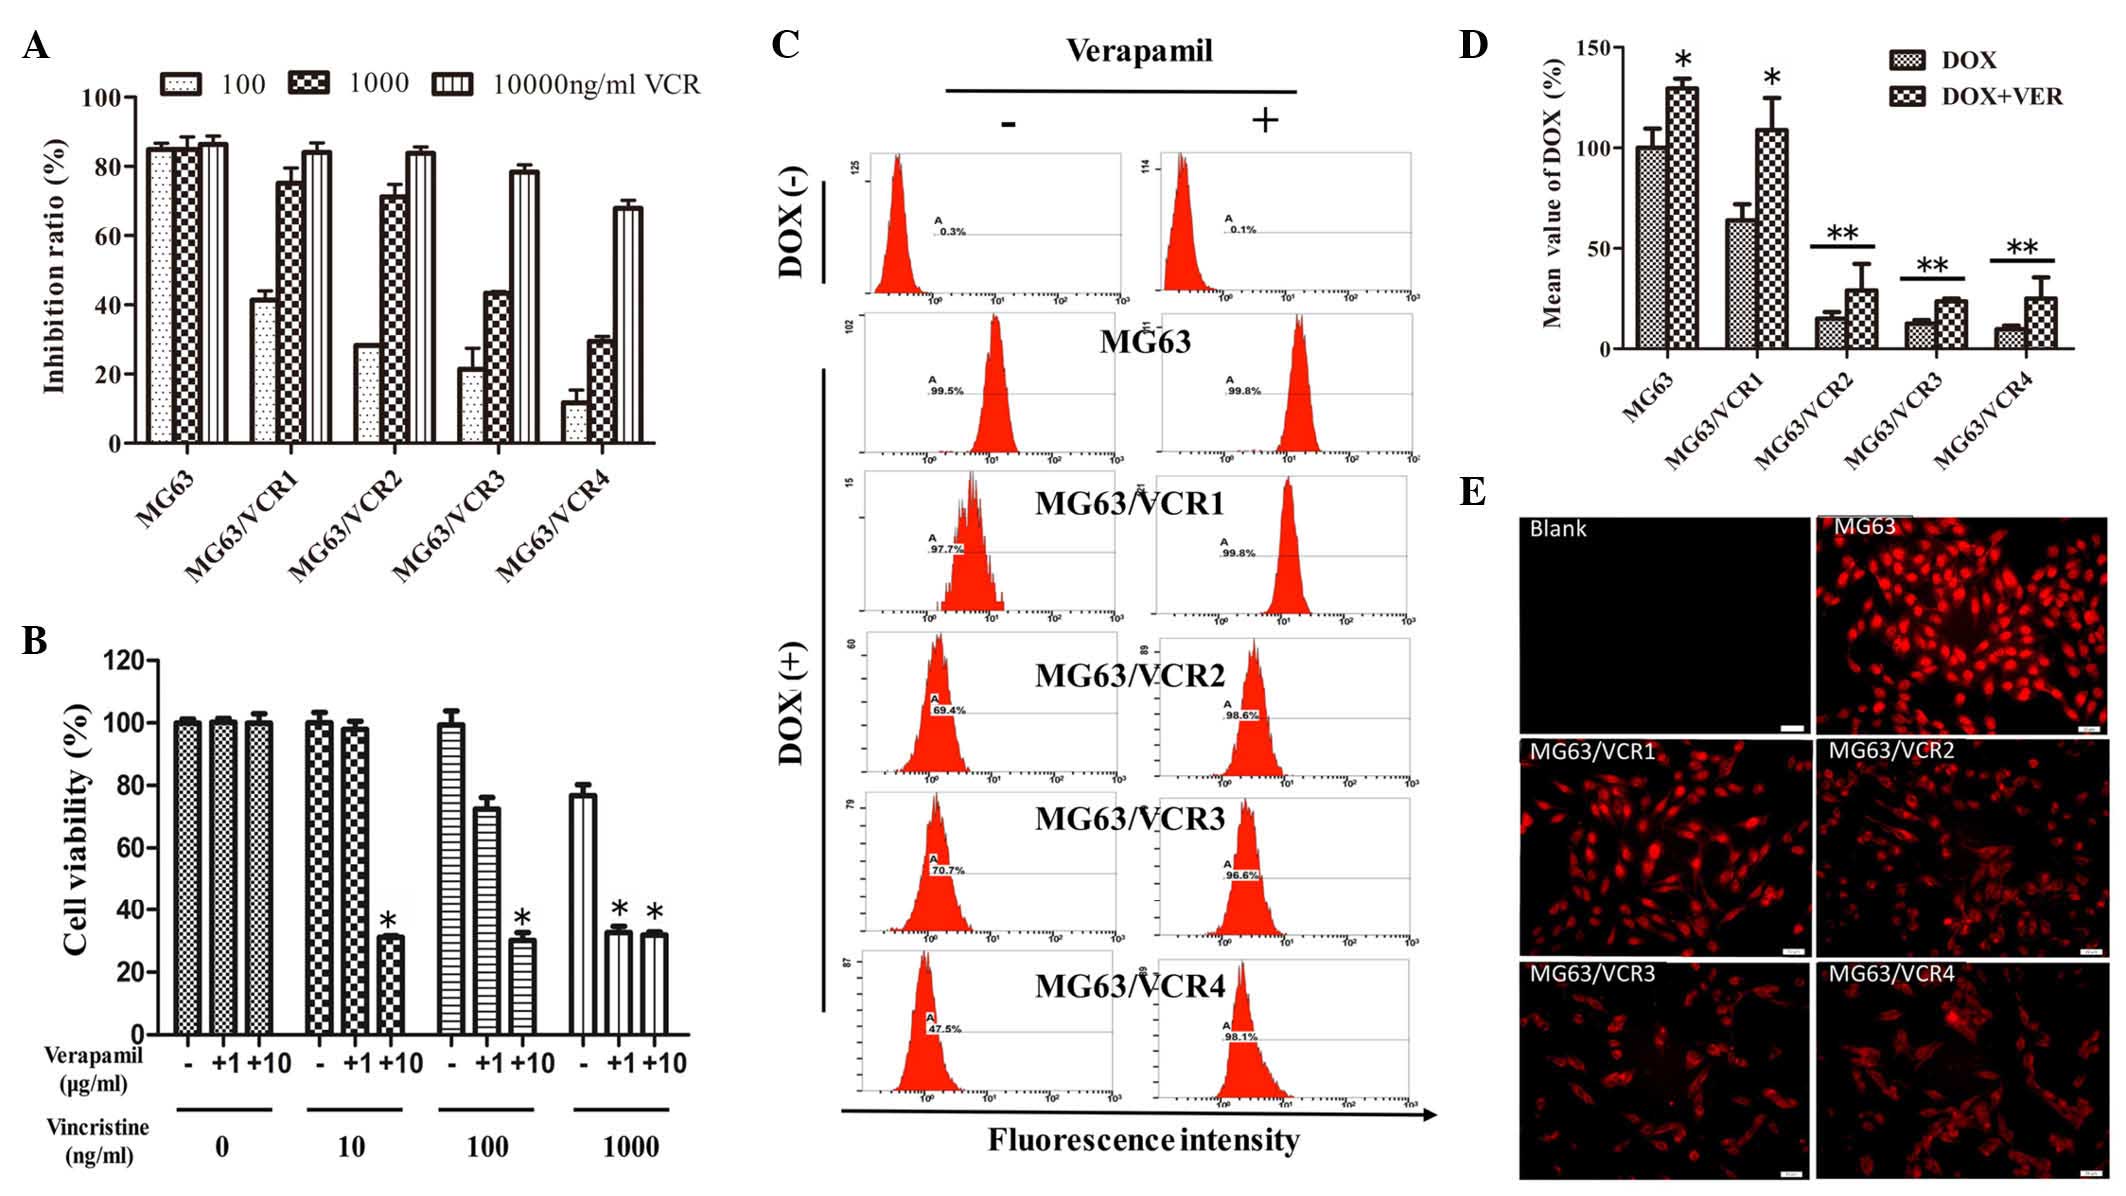
MDR1 is involved in the resistance of the
osteosarcoma cell sublines
MG63/VCR4 and MG63/VCR3 cells were highly resistant
to VCR treatment compared with MG63 cells (Fig. 5A). MG63/VCR3 cells were selected
for use in the verapamil rescue assay. Subsequent to the addition
of verapamil (a calcium channel blocker, which blocks the function
of MDR1), highly resistant MG63/VCR3 cells became sensitive to VCR
and this change was dependent on the verapamil concentrations
(Fig. 5B). DOX is auto-fluorescent
with the same wavelength as PI (20). Thus, the efflux DOX was measured in
the VCR-resistant sublines. The data indicated that DOX
accumulation was higher in MG63 cells compared with MG63/VCR1-4
sublines as demonstrated by decreased DOX fluorescence intensity in
MG63/VCR cells (Fig. 5C and D).
However, following treatment with verapamil, DOX fluorescence
intensity increased in the MG63/VCR cells compared with DOX-only
treatment.
Discussion
Chemotherapy combined with surgery is the principal
method of treatment for human cancer. However, tumor resistance to
chemotherapy and molecular targeted therapies limit the
effectiveness of current drug efficacy (1,21).
Cancer cells can become cross-resistant to a broad spectrum of
chemotherapeutic agents with different biological characteristics
and structure following a duration of single drug treatment, termed
MDR (8). At the cellular level,
various MDR mechanisms are involved in chemoresistance, including
increase in drug efflux, mutations of the drug targeting genes, DNA
repair capacity, activation of alternative signaling pathways or
evasion of cell death (21). It is
increasingly recognized that tumor lesions contain a high degree of
molecular heterogeneity (13) and
that drug resistant tumor cells may enhance a therapy-induced
selection of a resistant minor subpopulation of cells for expansion
(21,22). However, the precise mechanisms of
MDR remain undefined and require further investigation (21). The current study established a
series of VCR-resistant osteosarcoma cell lines (MG63/VCR1,
MG63/VCR2, MG63/VCR3, and MG63/VCR4) with typical MDR phenotypes.
Compared with parental MG63 cells, MG63/VCR cells exhibited
different RI to VCR and cross-resistance to other structurally and
mechanistically different drugs (Fig.
1), including an antimicrotubule agent (PTX), antimetabolite
agent (MTX) and TOPO-II inhibitors (DOX and THP). All these drugs
are frequently used in the clinic as chemotherapeutics for
osteosarcoma (1,3). The MDR characteristics of MG63/VCR
cells may indicate the failure of the chemotherapy combination of
VCR with DOX, PTX or THP in clinical practice (3,23).
However, the data of the present study also demonstrated that these
cell sublines were sensitive to GEM, which is a nucleoside analog,
and functions to arrest tumor growth and induce tumor cell
apoptosis. Sensitivity of these sublines to GEM may be attributed
to collateral sensitivity (24).
Morphologically, the VCR-resistant cells are
distinct from their parental cell line. For example, the resistant
cells exhibited spindle-shaped morphology and increased formation
of pseudopodia. The long cytoplasmic processes at the opposite
poles of the cell were increased with increased RI (Fig. 1A), which is consistent with the
findings of a previous study in different tumor cells (25). Wen et al (26) reported that ultrastructural changes
may facilitate survival of drug-resistant cells during and after
chemotherapy. Furthermore, drug-resistant tumor cells may exhibit
different abilities in cell proliferation and migration, and
additionally other studies demonstrated different and even
contradictory results (9–12). In the current study, the
proliferation ability of MG63/VCR cells was significantly decreased
(Fig. 2) with increased RI. Park
et al (27) suggested that
reduced proliferation may be caused by an increased number of
quiescent cancer cells or non-cycling dormant cells, characterized
by resistance to therapy (27).
This conjecture has been supported by cell cycle analysis, with the
percentages of MG63/VCR cells in the G0/G1
phases significantly increased compared with the percentages in the
MG63 cells in the corresponding phases (Fig. 2C and D). MDR and metastasis are two
signs of malignant tumor. The migration ability was significantly
enhanced in the lower resistance MG63/VCR1 cells compared with the
MG63 cells. However, migration was significantly reduced in the
highly resistant MG63/VCR3 and MG63/VCR4 cells (Fig. 3A and B). The expression of certain
genes is consistent with this reduction in migration, such as
LIMK1, which is important for the regulation of the actin
cytoskeleton, thus promoting tumor cell migration and invasion.
Different sublines with different RI demonstrated divergent
drug-resistant mechanisms. Therapeutic intervention provides a
potent selective pressure for the survival of tumor cells, and a
subpopulation will survive and become resistant to the drugs, which
will inherit their biological characteristics and replace the
original tumor clones; this is analogous to Darwinian evolution
theory (13,28).
Although the precise mechanism of MDR remains
unclear, several cell membrane transporter proteins have associated
resistance with commonly used chemotherapeutics that promote drug
efflux. Notably, the ATP-binding cassette transporter family of
transmembrane proteins regulate the efflux of multiple structurally
and mechanistically unrelated chemotherapeutic agents across the
plasma membrane (21). Several
members of this protein family have been extensively studied,
including MDR1 and MRP1. Furthermore, GST enables detoxification of
endogenous compounds and the metabolism of xenobiotics (29). TOPO-II and LIMK1 are also
understood to be associated with drug resistance and tumor cell
motility (30–32). In this context, drug-resistant
cells overexpress these genes. However, certain studies have
demonstrated downregulation of several MDR-associated genes,
including MDR1 and MRP1 in drug-resistant cancer cell lines
(33,34), indicating the involvement of a
different drug resistance mechanism. The data of the current study
demonstrated that with increased RI, MDR1 mRNA expression was
raised and plateaued, whereas MRP1, LIMK1 and TOPO-II levels were
highly expressed in the moderately resistant MG63/VCR2 cells,
whereas their expression was lower in the highly resistant
MG63/VCR3 and MG63/VCR4 cells (Fig. 4A
and B). These data suggested that the mechanism of drug
resistance in cells lines with different drug resistance levels may
be different. Additionally, the current study assessed the
retention level of DOX in the cells, and then challenged these
cells with the MDR1 antagonist, verapamil (2–6 µM of which
is sufficient to block MDR1 activity). DOX was used because it
exhibits auto-fluorescence at the same wavelength as PI (20). The data demonstrated that the level
of DOX was reduced in these sublines with increased RI (Fig. 5). Following verapamil treatment,
the level of DOX in the cells was markedly increased, suggesting
that MDR1-associated drug resistance was associated with a marked
reduction in DOX accumulation and may be an important mechanism by
which MG63/VCR sublines are resistant to chemotherapeutics. Further
studies are required to assess how MDR1 activity affects MDR cell
sublines.
In conclusion, the current study established stable
MG63/VCR MDR osteosarcoma cell sublines, which were cross-resistant
to other drugs. These sublines may serve as a useful tool for
further study of the molecular mechanisms of osteosarcoma drug
resistance and novel therapeutic strategies for osteosarcoma.
Acknowledgments
This study was supported by Projects of
International Cooperation of Jilin Provincial Science &
Technology Department (grant no. 20150101175JC) and the National
Natural Science Foundation of China (grant nos. 81172000 and
30772488).
References
|
1
|
Luetke A, Meyers PA, Lewis I and Juergens
H: Osteosarcoma treatment-where do we stand? A state of the art
review. Cancer Treat Rev. 40:523–532. 2014. View Article : Google Scholar
|
|
2
|
Ottaviani G and Jaffe N: The epidemiology
of osteosarcoma. Cancer Treat Res. 152:3–13. 2009. View Article : Google Scholar
|
|
3
|
Ta HT, Dass CR, Choong PF and Dunstan DE:
Osteosarcoma treatment: State of the art. Cancer Metastasis Rev.
28:247–263. 2009. View Article : Google Scholar : PubMed/NCBI
|
|
4
|
Ferrari S and Palmerini E: Adjuvant and
neoadjuvant combination chemotherapy for osteogenic sarcoma. Curr
Opin Oncol. 19:341–346. 2007. View Article : Google Scholar : PubMed/NCBI
|
|
5
|
Panda S, Choudhary K, Srivastava G,
Padhiary SK, Dhull KS and Sanghavi D: An Indian perspective on
gnathic osteosarcoma: A comprehensive literature review of the last
three decades. J Oral Maxillofac Surg Med Pathol. 26:198–206. 2014.
View Article : Google Scholar
|
|
6
|
Picci P: Osteosarcoma (Osteogenic
sarcoma). Orphanet J Rare Dis. 2:62007. View Article : Google Scholar : PubMed/NCBI
|
|
7
|
Rosen G: Neoadjuvant chemotherapy for
osteogenic sarcoma: A model for the treatment of other highly
malignant neoplasms. Recent Results Cancer Res. 103:148–157. 1986.
View Article : Google Scholar : PubMed/NCBI
|
|
8
|
Thomas H and Coley HM: Overcoming
multidrug resistance in cancer: An update on the clinical strategy
of inhibiting p-glycoprotein. Cancer Control. 10:159–165.
2003.PubMed/NCBI
|
|
9
|
Niu BH, Wang JJ, Xi Y and Ji XY: The
establishment and characterization of adriamycin-resistant cell
lines derived from Saos-2. Med Sci Monit. 16:BR184–BR192.
2010.PubMed/NCBI
|
|
10
|
Okugawa K, Kobayashi H, Hirakawa T, Sonoda
T, Ogura T and Nakano H: In vivo establishment and characterization
of a paclitaxel-resistant human ovarian cancer cell line showing
enhanced growth properties and drug-resistance only in vivo. J
Cancer Res Clin Oncol. 130:178–186. 2004. View Article : Google Scholar
|
|
11
|
Kanzawa F, Sugimoto Y, Minato K, Kasahara
K, Bungo M, Nakagawa K, Fujiwara Y, Liu LF and Saijo N:
Establishment of a camptothecin analogue (CPT-11)-resistant cell
line of human non-small cell lung cancer: Characterization and
mechanism of resistance. Cancer Res. 50:5919–5924. 1990.PubMed/NCBI
|
|
12
|
Negoro K, Yamano Y, Fushimi K, Saito K,
Nakatani K, Shiiba M, Yokoe H, Bukawa H, Uzawa K, Wada T, et al:
Establishment and characterization of a cisplatin-resistant cell
line, KB-R, derived from oral carcinoma cell line, KB. Int J Oncol.
30:1325–1332. 2007.PubMed/NCBI
|
|
13
|
Swanton C: Intratumor heterogeneity:
Evolution through space and time. Cancer Res. 72:4875–4882. 2012.
View Article : Google Scholar : PubMed/NCBI
|
|
14
|
Almendro V, Marusyk A and Polyak K:
Cellular heterogeneity and molecular evolution in cancer. Annu Rev
Pathol. 8:277–302. 2013. View Article : Google Scholar
|
|
15
|
McGranahan N and Swanton C: Biological and
therapeutic impact of intratumor heterogeneity in cancer evolution.
Cancer Cell. 27:15–26. 2015. View Article : Google Scholar : PubMed/NCBI
|
|
16
|
Burrell RA, McGranahan N, Bartek J and
Swanton C: The causes and consequences of genetic heterogeneity in
cancer evolution. Nature. 501:338–345. 2013. View Article : Google Scholar : PubMed/NCBI
|
|
17
|
Barteneva NS, Ketman K, Fasler-Kan E,
Potashnikova D and Vorobjev IA: Cell sorting in cancer
research-diminishing degree of cell heterogeneity. Biochim Biophys
Acta. 1836:105–122. 2013.PubMed/NCBI
|
|
18
|
Zhang H, Wang Y, Xing F, Wang J, Wang Y,
Wang H, Yang Y and Gao Z: Overexpression of LIMK1 promotes
migration ability of multidrug-resistant osteosarcoma cells. Oncol
Res. 19:501–509. 2011. View Article : Google Scholar : PubMed/NCBI
|
|
19
|
Livak KJ and Schmittgen TD: Analysis of
relative gene expression data using real-time quantitative PCR and
the 2(-Delta Delta C(T)) method. Methods. 25:402–408. 2001.
View Article : Google Scholar
|
|
20
|
Zhang X, Peng X, Yu W, Hou S, Zhao Y,
Zhang Z, Huang X and Wu K: Alpha-tocopheryl succinate enhances
doxorubicin-induced apoptosis in human gastric cancer cells via
promotion of doxorubicin influx and suppression of doxorubicin
efflux. Cancer Lett. 307:174–181. 2011. View Article : Google Scholar : PubMed/NCBI
|
|
21
|
Holohan C, Van Schaeybroeck S, Longley DB
and Johnston PG: Cancer drug resistance: An evolving paradigm. Nat
Rev Cancer. 13:714–726. 2013. View
Article : Google Scholar : PubMed/NCBI
|
|
22
|
Greaves M and Maley CC: Clonal evolution
in cancer. Nature. 481:306–313. 2012. View Article : Google Scholar : PubMed/NCBI
|
|
23
|
Souhami RL, Craft AW, Van der Eijken JW,
Nooij M, Spooner D, Bramwell VH, Wierzbicki R, Malcolm AJ,
Kirkpatrick A, Uscinska BM, et al: Randomised trial of two regimens
of chemotherapy in operable osteosarcoma: A study of the European
Osteosarcoma Intergroup. Lancet. 350:911–917. 1997. View Article : Google Scholar : PubMed/NCBI
|
|
24
|
Cerezo D, Cánovas M, García-Peñarrubia P
and Martín-Orozco E: Collateral sensitivity to cold stress and
differential BCL-2 family expression in new daunomycin-resistant
lymphoblastoid cell lines. Exp Cell Res. 331:11–20. 2015.
View Article : Google Scholar
|
|
25
|
Takeshita H, Kusuzaki K, Ashihara T,
Gebhardt MC, Mankin HJ and Hirasawa Y: Intrinsic resistance to
chemotherapeutic agents in murine osteosarcoma cells. J Bone Joint
Surg Am. 82-A:963–969. 2000.PubMed/NCBI
|
|
26
|
Wen J, Zheng B, Hu Y, Zhang X, Yang H, Luo
KJ, Zhang X, Li YF and Fu JH: Establishment and biological analysis
of the EC109/CDDP multidrug-resistant esophageal squamous cell
carcinoma cell line. Oncol Rep. 22:65–71. 2009.PubMed/NCBI
|
|
27
|
Park J, Bae EK, Lee C, Choi JH, Jung WJ,
Ahn KS and Yoon SS: Establishment and characterization of
bortezomib-resistant U266 cell line: Constitutive activation of
NF-kB-mediated cell signals and/or alterations of
ubiquitylation-related genes reduce bortezomib-induced apoptosis.
BMB Rep. 47:274–279. 2014. View Article : Google Scholar :
|
|
28
|
Gerlinger M and Swanton C: How Darwinian
models inform therapeutic failure initiated by clonal heterogeneity
in cancer medicine. Brit J Cancer. 103:1139–1143. 2010. View Article : Google Scholar : PubMed/NCBI
|
|
29
|
Kars MD, Işeri ÖD and Gündüz U: A
microarray based expression profiling of paclitaxel and vincristine
resistant MCF-7 cells. Eur J Pharmacol. 657:4–9. 2011. View Article : Google Scholar : PubMed/NCBI
|
|
30
|
Chen Q, Jiao D, Hu H, Song J, Yan J, Wu L
and Xu LQ: Downregulation of LIMK1 level inhibits migration of lung
cancer cells and enhances sensitivity to chemotherapy drugs. Oncol
Res. 20:491–498. 2013. View Article : Google Scholar : PubMed/NCBI
|
|
31
|
Zhou Y, Su J, Shi L, Liao Q and Su Q: DADS
downregulates the Rac1-ROCK1/PAK1-LIMK1-ADF/cofilin signaling
pathway, inhibiting cell migration and invasion. Oncol Rep.
29:605–612. 2013.
|
|
32
|
Zhang HS, Zhao JW, Wang H, Zhang HY, Ji
QY, Meng LJ, Xing FJ, Yang ST and Wang Y: LIM kinase 1 is required
for insulin-dependent cell growth of osteosarcoma cell lines. Mol
Med Rep. 9:103–108. 2014.
|
|
33
|
Yan XD, Li M, Yuan Y, Mao N and Pan LY:
Biological comparison of ovarian cancer resistant cell lines to
cisplatin and Taxol by two different administrations. Oncol Rep.
17:1163–1169. 2007.PubMed/NCBI
|
|
34
|
Li L, Luan Y, Wang G, Tang B, Li D, Zhang
W, Li X, Zhao J, Ding H, Reed E and Li QQ: Development and
characterization of five cell models for chemoresistance studies of
human ovarian carcinoma. Int J Mol Med. 14:257–264. 2004.PubMed/NCBI
|