Introduction
Chronic hepatitis B (CHB), with a prevalence of
7.18% in China, is the primary cause of liver-associated morbidity
and mortality (1). Maintenance of
viral suppression using antiviral treatment can reverse severe
liver fibrosis or early cirrhosis, and reduce liver-associated
complications in patients with CHB (2). The use of liver biopsy, which is
considered to be the conventional reference standard for the
staging of fibrosis, has been challenged over the past decade by
the development of novel non-invasive methods (3). These novel techniques rely on two
distinct but complementary approaches: A 'physical' approach based
on the liver stiffness measurement (LSM), and a 'biological'
approach based on the serum biomarkers of fibrosis (4).
Previous studies have demonstrated that assessing
LSM with FibroScan may serve as a noninvasive alternative to liver
biopsy in evaluating liver fibrosis (5–7).
However, the limitations of FibroScan include the lack of a
two-dimensional image guidance system and difficulties in
evaluating patients with ascites or those with a dense layer of fat
tissue under the skin (8,9). Real-time tissue elastography (RTE) is
a free-hand technique that is used to visualize the elasticity of
the target area by capturing echo signals derived secondary to
repetitive compressions caused by the heartbeat (10). A quantitative analysis method based
on RTE, known as the liver fibrosis index (LFI), has been developed
for assessing liver fibrosis, with the area under the receiver
operating characteristic curve (AUROC) values ranging between 0.81
and 0.87 for significant fibrosis (11–13).
Numerous studies have demonstrated that RTE is an effective tool
for diagnosing hepatic fibrosis in patients with chronic hepatitis
C (11,14). However, RTE is unable to accurately
distinguish between fibrosis stages with cut-off values (11), which has hindered the universal
application of RTE as an alternative to liver biopsy in clinical
practice, particularly in regions with a high prevalence of CHB
(15).
Therefore, the development of complementary
approaches is necessary to achieve increased diagnostic accuracy
over standard liver biopsy methods. Various biochemical scores and
ultrasonographic (US) noninvasive indexes, including aspartate
aminotransferase to platelet ratio index (APRI), fibrosis-4 (FIB-4)
index and spleen size, have been shown to predict the severity of
liver fibrosis (16). Furthermore,
previous studies have demonstrated that LFI is highly accurate for
diagnosing liver fibrosis and cirrhosis in patients with CHB
(15,17). In order to improve the current
diagnostic methods, particularly in patients with CHB, the present
study developed two prediction models that accurately reflected the
progression of CHB into fibrosis or cirrhosis using LFI in
combination with biochemical and ultrasound parameters.
Materials and methods
Patients
A total of 103 consecutive patients with CHB were
prospectively recruited between January 2014 and September 2014 at
the First Affiliated Hospital of Wenzhou Medical University
(Wenzhou, China). Patients were ≥18 years of age, presented with
clinical indications for ultrasound-guided percutaneous liver
biopsy and did not receive antiviral therapy. The inclusion
criteria for the study were as follows: i) Positive CHB diagnosis;
ii) achievement of a satisfactory RTE of the liver; and iii)
indication for liver biopsy. The following exclusion criteria were
applied to patients: i) Positive for infection with hepatitis A, C,
D or E virus; ii) substantial alcohol intake (defined as 30 g of
alcohol daily for men and 20 g for women) (18); iii) a previous liver
transplantation; iv) malignancy or other terminal disease; and v)
refusal to undergo a liver biopsy. CHB was diagnosed according to
the practice guidelines of the Asian Pacific Association for the
Study of the Liver (19). Patients
were determined to be positive for the hepatitis B surface antigen
for >6 months and negative for anti-hepatitis C virus antibodies
in the serum. Ethics committee of the First Affiliated Hospital of
Wenzhou Medical University approved the study and informed consent
was obtained from all patients.
Clinical and laboratory information
Prior to obtaining liver biopsies and RTEs, the age,
gender, liver disease etiology, height, body weight and body mass
index (BMI) of patients were recorded. In addition, the following
laboratory data were collected: Levels of alanine aminotransferase
(ALT), aspartate aminotransferase (AST), γ-glutamyl transferase
(GGT), total bilirubin, albumin and fasting glucose, as well as the
prothrombin time, white blood cell count and platelet count. Blood
sample analyses were performed on-site (at The First Affiliated
Hospital of Wenzhou Medical University).
US evaluation and FibroScan
Laboratory tests, US examination of the upper
abdomen and transient elastography (also known as FibroScan) were
performed 1 day before liver biopsy. The portal vein diameter,
portal vein velocity (PVV), hepatic artery diameter, hepatic artery
velocity, hepatic artery resistive index, spleen size, splenic
artery diameter, splenic artery velocity, splenic artery resistive
index, splenic vein diameter and splenic vein velocity were
measured. In addition, the splenic index (SI) was calculated using
the following formula: SI (cm2) =a × b, where a is
equivalent to the transverse diameter (in cm) and b is equivalent
to the vertical diameter (in cm) of the maximal cross-sectional
images of the spleen (20). The
splenoportal index (SPI) was calculated by dividing the SI by the
mean PVV (21). FibroScan was
performed according to the instructions and training provided by
the manufacturer (Echosens, Paris, France), and the values obtained
were expressed in kilopascals (kPa). FibroScan examinations
consisted of >10 validated measurements with a success rate of
at least 60% and an interquartile range of ≤30% of the median ratio
considered to be reliable (22).
RTE procedure
Subsequent to gray-scale US examination, we used
ultrasonography (HI-VISION Ascendus; Hitachi Aloka Medical, Ltd.,
Tokyo, Japan) and the EUP-L52 linear probe (3–7 MHz; Hitachi Aloka
Medical, Ltd.) to perform RTE, as previously described by Wu et
al (17). Briefly, RTE was
performed on the right lobe of the liver through the intercostal
spaces while patients laid in supine position with their right arm
elevated over their head to widen the intercostal space. While
patients were holding their breath, strain images were induced by
cardiac motion. In order to obtain accurate and reliable images,
the region of interest (ROI) of the strain image was placed >1
cm below the surface of the liver and was 2.5×2.5 cm in size, which
could represent the degree of stiffness of the liver. An average of
3–5 suitable RTE images for each patient were selected for the
final analysis using software developed by Hitachi Aloka Medical,
Ltd. If the number of suitable RTE images obtained was
insufficient, the patient was excluded from the study. A histogram
of strain elasticity values of the ROI in arbitrary units from 0 to
255 (256 stepwise grading) according to color mapping from red (0)
to blue (255) was calculated.
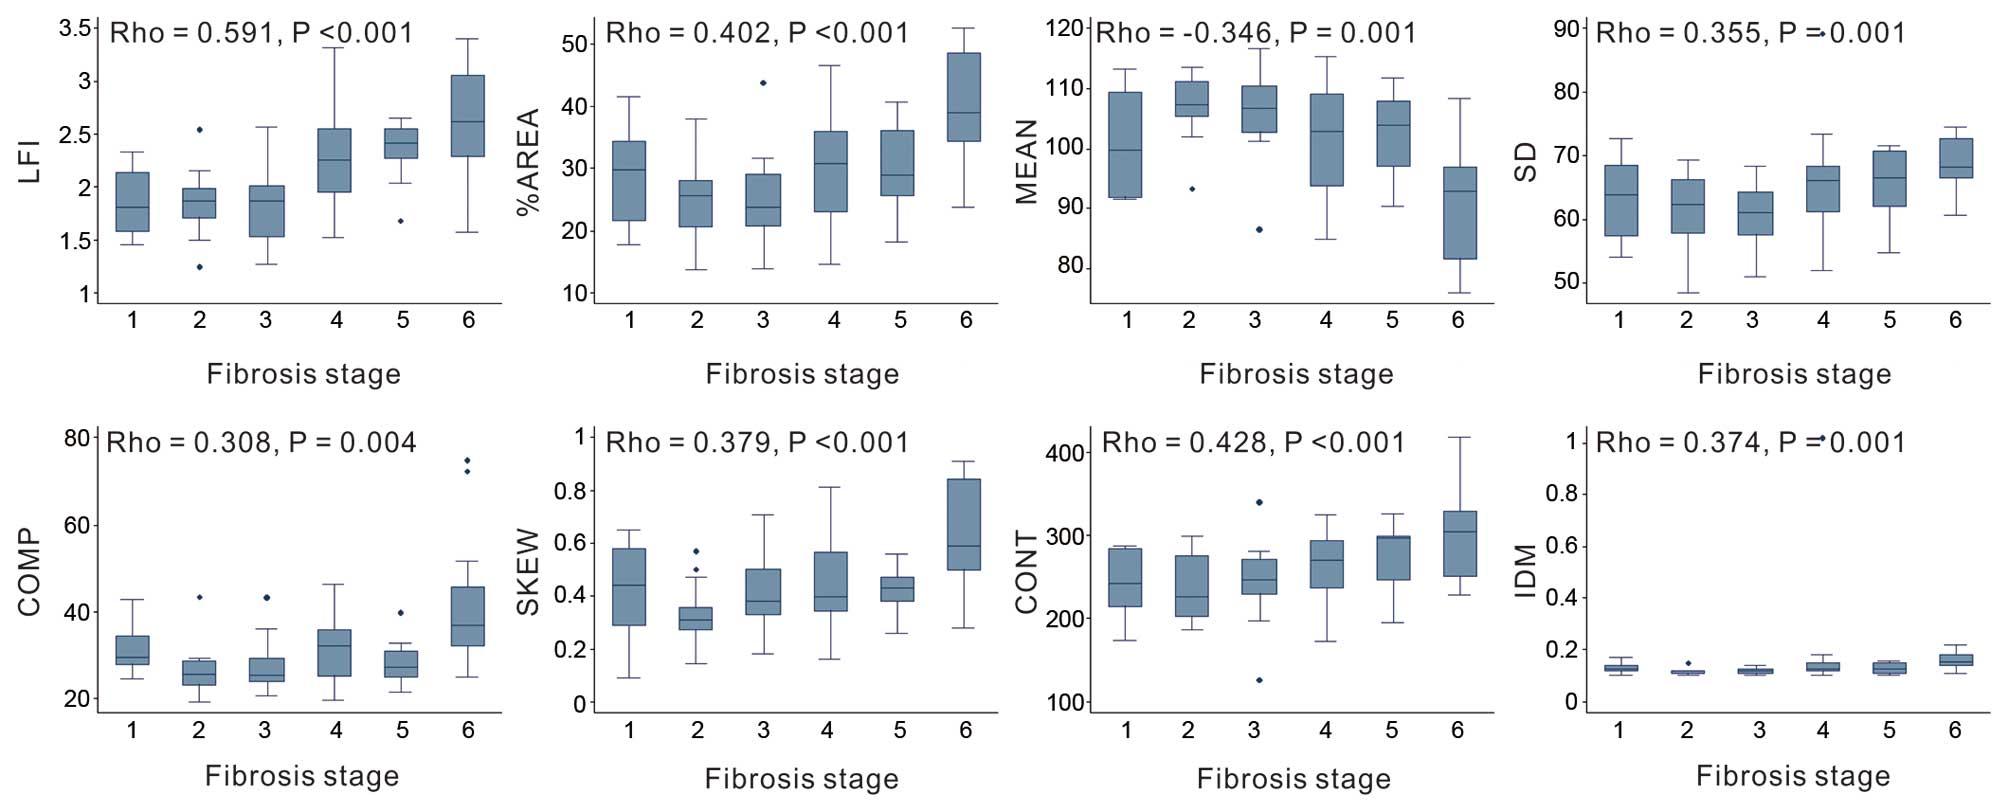
As previously reported (17), a total of nine image features were
used to quantify the variable patterns of the RTE images, as
follows: Mean relative strain value (MEAN) in the ROI; standard
deviation (SD) of the relative strain value; low-strain area
complexity (COMP; calculated using perimeter2/area);
low-strain area percentage (%AREA; calculated based on the
percentage of blue area in ROI, indicating stiffness of the
tissues); angular second moment (ASM); inverse difference moment
(IDM); entropy (ENT); kurtosis (KURT); and skewness (SKEW). In RTE
images, the %AREA was defined as the number of relative strain
pixels that was lower than the threshold value over the total
number of pixels in the ROI; COMP was defined according to the mean
complexity of each low-strain region (boundary
length2/area); SKEW was used as a scale of asymmetry and
its statistical value indicated to what degree a symmetric object
of the histogram was skewed; KURT was used as a measure of peak
sharpness and its statistical value indicated whether the
distribution of the data can be concentrated into an average value;
COMP, ENT, IDM and ASM indicated the feature values of the textual
variations, randomness, homogeneity and uniformity, respectively.
In addition, the distribution of deformation data relative to the
principal diagonal was described, which was defined as contrast
(CONT). Higher resolution resulted in a greater CONT value. The LFI
was calculated according to the following formula: LFI = −0.009MEAN
− 0.005SD + 0.023%AREA + 0.025COMP + 0.775SKEW −0.281KURT +
2.083ENT + 3.042IDM + 39.979ASM −5.542 (23).
Liver biopsy
Liver biopsies were performed by senior operators
(who conduct >300 biopsies each year) using a TRU-CORE II
MCXS1616TX co-axial biopsy needle (Argon Medical Devices, Inc.,
Plano, TX, USA). Liver biopsy specimens measured >15 mm in
length, and were fixed in formalin and embedded in paraffin. Tissue
sections (4 µm in thickness) were stained with
hematoxylin-eosin-saffron, Masson's trichrome stain for collagen,
Perl's Prussian blue stain for iron, and Gordon and Sweet's
reticulin stain. Two experienced hepatopathologists analyzed
biopsies independently and were unaware of the RTE, clinical and
laboratory results. Liver biopsy specimens <1.5 cm in length
and/or with <6 portal tracts were excluded. Liver fibrosis
stages and necroinflammatory activity grades were evaluated
according to the Ishak fibrosis scoring system (24). The Ishak system scores fibrosis
into seven categories (0–6), with Ishak score of ≥3 defined as
significant fibrosis and Ishak score of ≥5 defined as cirrhosis
(25).
Statistical analysis
The association of the RTE image features with the
clinical or morphological parameters was evaluated using Spearman's
rank correlation coefficient and scatterplots. Box plots were used
to assess the use of RTE for differentiating between each grade of
fibrosis. The χ2 test was used to compare categorical
variables, while an independent two-sample t-test was used
to compare continuous variables. The primary aim of the present
study was to stage fibrosis using an RTE-based prediction model
consisting of clinically relevant and US variables. Univariate
analysis was initially performed to identify candidate variables
among various clinical US factors for the generation of a new
formula. Variables with a P-value of <0.05 in the univariate
analysis were then included in the subsequent multivariate
analysis, where multiple logistic regression analyses was used to
select variables for inclusion in the final model. Factors with a
P-value of <0.05 were finally selected as components of the new
formula. The analyses were performed using SPSS software (version
21.0; IBM SPSS, Armonk, NY, USA). A two-tailed P-value of <0.05
was considered to indicate a statistically significant difference.
The diagnostic performance of the novel RTE-based model, FibroScan
and two biochemical scores [APRI = (AST/platelet count) × 100;
FIB-4 = (age × AST) / (platelet count × ALT1/2)] were
assessed using receiver operating characteristic (ROC) curves and
histology as a reference. APRI and FIB-4 were selected for
comparison since they are readily available noninvasive indexes
that are commonly used for the evaluation of liver fibrosis and
cirrhosis (16). AUROC values were
compared using the DeLong method (26) and MedCalc software (version
12.2.1.0; MedCalc Software, Ostend, Belgium). The sensitivity,
specificity, positive predictive value (PPV), negative predictive
value (NPV) and likelihood ratio (LR) were calculated using the ROC
curves.
Results
Clinical and histological characteristics
of the study population
A total of 103 patients with CHB fulfilled the
inclusion criteria. Among these, 6 patients were excluded due to an
invalid RTE examination, and 12 refused to undergo a liver biopsy.
In total, 85 patients were included in the present study.
Patient characteristics are summarized in Table I. A total of 52 patients (61.2%)
were male and the mean age of patients was 38.12±8.23 years. Mean
liver stiffness as determined by FibroScan was 9.11±6.36 kPa,
whereas mean LFI was 2.14±0.49. The RTE image parameters %AREA,
SKEW and CONT were significantly associated with significant
fibrosis; the %AREA, MEAN, SD, COMP, SKEW and CONT were
significantly associated with cirhosis (Fig. 1). The mean Ishak fibrosis score was
3.58±1.60, and the prevalence of significant fibrosis (Ishak score
≥3) and cirrhosis (Ishak score ≥5) was 71.8 and 27.1%,
respectively.
 | Table IClinical, biological and histological
characteristics of patients with chronic hepatitis B. |
Table I
Clinical, biological and histological
characteristics of patients with chronic hepatitis B.
| Characteristics | Value |
|---|
| Clinical data | |
| Male | 52
(61.2%) |
| Age (years) |
38.12±8.23 |
| BMI
(kg/m2) |
22.83±3.20 |
| Biological
parameters | |
| AST (U/l) |
44.81±25.97 |
| ALT (U/l) |
64.26±27.18 |
| GGT (U/l) |
42.11±26.62 |
| Serum albumin
(g/l) |
40.83±3.89 |
| Total bilirubin
(µmol/l) |
14.80±1.05 |
| White blood cells
(×1,000/mm3) | 5.88±1.59 |
| Platelet count
(×1,000/mm3) | 184.64±61.89 |
| Fasting glucose
(mmol/l) | 5.43±1.41 |
| HBV-DNA
(log10 IU/l) | 6.14±1.92 |
| HBeAg positive | 47 (55.3%) |
| Ultrasonographic
parameters | |
| Portal vein
diameter (mm) |
11.38±1.56 |
| Portal vein
velocity (cm/s) |
21.79±6.59 |
| Hepatic artery
diameter (mm) | 3.52±0.60 |
| Hepatic artery
velocity (cm/s) |
77.70±22.82 |
| Hepatic artery
resistive index | 0.74±0.07 |
| Spleen thickness
(mm) |
32.89±5.14 |
| Spleen diameter
(mm) |
92.79±9.68 |
| Splenic index |
34.73±9.48 |
| Splenoportal
index | 1.79±0.83 |
| Splenic artery
diameter (mm) | 4.34±0.83 |
| Splenic artery
velocity (cm/s) |
73.68±21.45 |
| Splenic artery
resistive index | 1.55±0.61 |
| Splenic vein
diameter (mm) | 6.11±1.19 |
| Splenic vein
velocity (cm/s) |
17.58±6.49 |
| Histological
fibrosis stage (Ishak score) | |
| 0/1/2 | 24 (28.2%) |
| 3 | 14 (16.5%) |
| 4 | 24 (28.2%) |
| 5/6 | 23 (27.1%) |
| APRI |
27.43±27.42 |
| FIB-4 | 1.47±0.97 |
| Liver stiffness
(FibroScan; kPa) | 9.11±6.36 |
| LFI | 2.14±0.49 |
Comparison of variables according to
significant fibrosis and cirrhosis
Patient characteristics stratified by the presence
of significant liver fibrosis or cirrhosis are presented in
Table II. The SI (P=0.005), SPI
(P<0.001), FIB-4 (P=0.019), liver stiffness (P=0.039) and LFI
(P<0.001) values in patients with significant fibrosis were
significantly greater compared with the values in patients without
significant fibrosis. In addition, significant differences between
the GGT (P=0.002), serum albumin (P= 0.011), platelet count (P=
0.003), portal vein diameter (P=0.039), hepatic artery diameter
(P=0.004), spleen thickness and diameter (P=0.0038 and 0.001,
respectively), SI (P<0.001), SPI (P<0.001), splenic artery
diameter (P=0.012), splenic vein velocity (P=0.031), FIB-4
(P=0.002), liver stiffness (P<0.001) and LFI (P<0.001) values
were observed between patients with and without liver cirrhosis
(Table II).
| Table IICharacteristics of patients with
chronic hepatitis B stratified by the presence of significant
fibrosis and cirrhosis. |
Table II
Characteristics of patients with
chronic hepatitis B stratified by the presence of significant
fibrosis and cirrhosis.
| Variable | No significant
fibrosis, F=0–2 (n=24) | Significant
fibrosis, F=3–6 (n=61) | P-value | No cirrhosis, F=0–4
(n=62) | Cirrhosis, F=5–6
(n=23) | P-value |
|---|
| Clinical data | | | | | | |
| Male | 11
(45.8%) | 41
(67.2) |
0.069 | 37
(59.7%) | 15
(65.2%) |
0.641 |
| Age (years) |
36.33±7.86 |
38.82±8.33 |
0.212 |
37.39±8.14 |
40.09±8.33 |
0.181 |
| BMI
(kg/m2) |
22.46±3.83 |
22.97±2.93 |
0.513 |
22.45±3.05 |
23.83±3.43 |
0.078 |
| Biological
parameters | | | | | | |
| AST (U/l) |
38.08±26.36 |
47.46±51.64 |
0.401 |
44.44±50.97 |
45.83±29.41 |
0.902 |
| ALT (U/l) |
49.96±37.53 |
69.89±99.92 |
0.346 |
61.11±88.36 |
72.74±85.24 |
0.588 |
| GGT (U/l) |
28.50±29.11 |
47.46±63.72 |
0.166 |
30.89±41.39 |
72.35±58.61 |
0.002 |
| Serum albumin
(g/l) |
41.87±3.87 |
40.42±3.85 |
0.123 |
41.48±3.71 |
39.08±3.92 |
0.011 |
| Total bilirubin
(µmol/l) |
11.35±4.84 |
16.17±14.62 |
0.356 |
12.43±5.58 |
20.78±18.46 |
0.108 |
| WBC
(×1,000/mm3) | 6.24±1.51 | 5.73±1.61 |
0.189 | 5.95±1.50 | 5.69±1.84 |
0.506 |
| Platelet count
(×1,000/mm3) | 196.25±37.01 | 180.07±69.00 |
0.280 | 196.71±61.85 | 152.09±45.00 |
0.003 |
| Fasting glucose
(mmol/l) | 5.20±1.09 | 5.52±1.52 |
0.354 | 5.39±1.17 | 5.52±1.96 |
0.713 |
| HBV-DNA
(log10 IU/l) | 6.34±2.19 | 6.07±1.81 |
0.560 | 6.16±1.99 | 6.11±1.74 |
0.917 |
| HBeAg positive | 13
(54.2%) | 34
(55.7%) |
0.102 | 36
(58.1%) | 12
(52.2%) |
0.627 |
| Ultrasonographic
parameters | | | | | | |
| Portal vein
diameter (mm) |
10.87±1.70 |
11.58±1.47 |
0.061 |
11.16±1.65 |
11.95±1.16 |
0.039 |
| Portal vein
velocity (cm/s) |
22.80±5.36 |
21.40±7.02 |
0.380 |
22.32±6.29 |
20.37±7.29 |
0.227 |
| Hepatic artery
diameter (mm) | 3.24±0.45 | 3.42±0.62 |
0.008 | 3.35±0.52 | 3.65±0.61 |
0.004 |
| Hepatic artery
velocity (cm/s) |
67.81±25.41 |
73.22±67.81 |
0.328 |
70.76±24.11 |
74.21±19.17 |
0.539 |
| Hepatic artery
resistive index | 0.73±0.052 | 0.75±0.082 |
0.519 | 0.75±0.053 | 0.72±0.11 |
0.125 |
| Spleen thickness
(mm) |
31.27±4.80 |
33.52±6.17 |
0.069 |
32.19±4.96 |
34.57±5.25 |
0.038 |
| Spleen diameter
(mm) |
89.50±6.80 |
93.98±10.38 |
0.054 |
90.57±7.68 |
98.50±12.09 |
0.001 |
| Splenic index |
30.15±7.03 |
36.53±9.76 |
0.005 |
31.51±7.25 |
43.39±9.49 | <0.001 |
| Splenoportal
index | 1.21±0.27 | 2.02±0.87 | <0.001 | 1.51±0.66 | 2.54±0.80 | <0.001 |
| Splenic artery
diameter (mm) | 4.10±0.71 | 4.43±0.86 |
0.092 | 4.20±0.76 | 4.71±0.92 |
0.012 |
| Splenic artery
velocity (cm/s) |
73.48±19.37 |
73.75±22.37 |
0.958 |
73.36±21.31 |
74.55±22.30 |
0.822 |
| Splenic artery
resistive index | 0.60±0.070 | 1.93±1.16 |
0.527 | 1.89±0.083 | 0.64±0.075 |
0.555 |
| Splenic vein
diameter (mm) | 5.97±1.08 | 6.17±1.23 |
0.496 | 5.89±1.08 | 6.71±1.29 |
0.004 |
| Splenic vein
velocity (cm/s) |
19.28±8.47 |
16.91±5.46 |
0.130 |
18.50±6.76 |
15.11±5.00 |
0.031 |
| APRI |
21.91±21.71 |
29.60±7.17 |
0.247 |
24.85±27.65 |
34.37±26.11 |
0.156 |
| FIB-4 | 1.08±0.67 | 1.62±1.03 |
0.019 | 1.27±0.85 | 2.00±1.09 |
0.002 |
| Liver stiffness
(FibroScan, kPa) | 6.84±2.46 |
10.00±7.17 |
0.039 | 7.20±2.72 |
14.25±9.80 | <0.001 |
| LFI | 1.83±0.33 | 2.26±0.49 | <0.001 | 2.00±0.42 | 2.52±0.46 | <0.001 |
Predictors of significant fibrosis and
cirrhosis
Variables associated with the presence of
significant fibrosis (Table III)
or cirrhosis (Table IV) were
assessed by univariate and multivariate analyses. Univariate
predictors were entered into a stepwise logistic regression model.
Out of all variables, SPI (P= 0.002) and LFI (P= 0.023) were
confirmed as independent predictors of significant fibrosis
(Table III), whereas GGT
(P=0.049), SPI (P=0.002) and LFI (P=0.001) were determined to be
independent predictors of cirrhosis (Table IV), based on the results of
multivariate analysis.
| Table IIIAnalysis of variables associated with
the presence of significant fibrosis in patients with chronic
hepatitis B. |
Table III
Analysis of variables associated with
the presence of significant fibrosis in patients with chronic
hepatitis B.
| Variable | Univariate analysis
| Multivariate
analysis
|
|---|
| OR | 95% CI | P-value | OR | 95% CI | P-value |
|---|
| Clinical data | | | | | | |
| Male (%) |
2.423 | 0.923–6.357 |
0.072 | | | |
| Age (years) |
1.038 | 0.979–1.101 |
0.211 | | | |
| BMI
(kg/m2) |
1.054 | 0.903–1.230 |
0.508 | | | |
| Biological
parameters | | | | | | |
| AST (U/l) |
1.008 | 0.989–1.026 |
0.418 | | | |
| ALT (U/l) |
1.004 | 0.995–1.104 |
0.369 | | | |
| GGT (U/l) |
1.011 | 0.995–1.027 |
0.191 | | | |
| Serum albumin
(g/l) |
0.901 | 0.789–1.029 |
0.126 | | | |
| Total bilirubin
(µmol/l) |
1.061 | 0.962–1.169 |
0.236 | | | |
| WBC
(×1,000/mm3) |
0.821 | 0.611–1.103 |
0.190 | | | |
| Platelet count
(×1,000/mm3) |
0.996 | 0.988–1.004 |
0.295 | | | |
| Fasting glucose
(mmol/l) |
1.213 | 0.807–1.823 |
0.354 | | | |
| HBV-DNA
(log10 IU/l) |
0.927 | 0.721–1.192 |
0.555 | | | |
| HBeAg positive
(%) |
1.066 | 0.413–2.751 |
0.896 | | | |
| Ultrasonographic
parameters | | | | | | |
| Portal vein
diameter (mm) |
1.352 | 0.981–1.863 |
0.066 | | | |
| Portal vein
velocity (cm/s) |
0.968 | 0.901–1.040 |
0.376 | | | |
| Hepatic artery
diameter (mm) |
3.417 | 1.326–8.811 |
0.011 |
1.824 | 0.532–6.250 | 0.339 |
| Hepatic artery
velocity (cm/s) |
1.011 | 0.989–1.033 |
0.325 | | | |
| Hepatic artery
resistive index |
7.335 | 0.017–3162.39 |
0.520 | | | |
| Spleen thickness
(mm) |
1.102 | 0.991–1.226 |
0.074 | | | |
| Spleen diameter
(mm) |
1.061 | 0.998–1.128 |
0.057 | | | |
| Splenic index |
1.098 | 1.025–1.176 |
0.007 |
0.965 | 0.875–1.064 | 0.469 |
| Splenoportal
index | 20.532 | 4.116–102.418 | <0.001 | 13.965 | 2.690–72.441 | 0.002 |
| Splenic artery
diameter (mm) |
1.723 | 0.909–3.266 |
0.096 | | | |
| Splenic artery
velocity (cm/s) |
1.001 | 0.979–1.023 |
0.957 | | | |
| Splenic artery
resistive index | 57.857 | 0.079–2439. 6 |
0.288 | | | |
| Splenic vein
diameter (mm) |
1.153 | 0.769–1.727 |
0.491 | | | |
| Splenic vein
velocity (cm/s) |
0.947 | 0.881–1.018 |
0.141 | | | |
| APRI |
1.105 | 0.989–1.403 |
0.259 | | | |
| FIB-4 |
2.267 | 1.091–4.711 |
0.028 | | | |
| Liver stiffness
(FibroScan kPa) |
1.230 | 1.041–1.454 |
0.015 | | | |
| LFI | 11.345 | 2.787–46.179 |
0.001 |
6.283 | 1.291–30.575 | 0.023 |
| Table IVAnalysis of variables associated with
the presence of cirrhosis in patients with chronic hepatitis B. |
Table IV
Analysis of variables associated with
the presence of cirrhosis in patients with chronic hepatitis B.
| Variable | Univariate analysis
| Multivariate
analysis
|
|---|
| OR | 95% CI | P-value | OR | 95% CI | P-value |
|---|
| Clinical data | | | | | | |
| Male (%) |
1.267 | 0.468–3.433 |
0.642 | | | |
| Age (years) |
1.042 | 0.981–1.108 |
0.181 | | | |
| BMI
(kg/m2) |
1.143 | 0.981–1.331 |
0.086 | | | |
| Biological
parameters | | | | | | |
| AST (U/l) |
1.001 | 0.991–1.011 |
0.901 | | | |
| ALT (U/l) |
1.001 | 0.996–1.006 |
0.590 | | | |
| GGT (U/l) |
1.014 | 1.002–1.026 |
0.018 |
1.012 | 1.000–1.024 | 0.049 |
| Serum albumin
(g/l) |
0.849 | 0.744–0.969 |
0.015 |
1.306 | 0.986–1.729 | 0.063 |
| Total bilirubin
(µmol/l) |
1.024 | 0.975–1.076 |
0.341 | | | |
| WBC
(×1,000/mm3) |
0.898 | 0.656–1.229 |
0.502 | | | |
| Platelet count
(×1,000/mm3) |
0.982 | 0.970–0.993 |
0.002 |
0.989 | 0.966–1.012 | 0.343 |
| Fasting glucose
(mmol/l) |
1.064 | 0.767–1.475 |
0.710 | | | |
| HBV-DNA
(log10 IU/l) |
0.987 | 0.768–1.268 |
0.916 | | | |
| HBeAg positive
(%) |
0.842 | 0.322–2.198 |
0.725 | | | |
| Ultrasonographic
parameters | | | | | | |
| Portal vein
diameter (mm) |
1.418 | 1.010–1.992 |
0.044 |
0.835 | 0.447–1.559 | 0.571 |
| Portal vein
velocity (cm/s) |
0.954 | 0.883–1.030 |
0.226 | | | |
| Hepatic artery
diameter (mm) |
2.133 | 1.539–4.589 |
0.002 |
4.467 | 0.621–32.149 | 0.137 |
| Hepatic artery
velocity (cm/s) |
1.007 | 0.986–1.028 |
0.543 | | | |
| Hepatic artery
resistive index |
0.008 | 0.001–6.408 |
0.158 | | | |
| Spleen thickness
(mm) |
1.102 | 1.002–1.213 |
0.045 |
0.977 | 0.720–1.328 | 0.884 |
| Spleen diameter
(mm) |
1.101 | 1.032–1.176 |
0.004 |
1.155 | 0.969–1.377 | 0.107 |
| Splenic index |
1.188 | 1.094–1.290 | <0.001 |
1.100 | 0.937–1.292 | 0.245 |
| Splenoportal
index |
6.513 | 2.583–16.422 | <0.001 |
5.676 | 1.939–16.618 | 0.002 |
| Splenic artery
diameter (mm) |
2.103 | 1.141–3.874 |
0.017 |
0.483 | 0.068–3.437 | 0.468 |
| Splenic artery
velocity (cm/s) |
1.003 | 0.981–1.025 |
0.820 | | | |
| Splenic artery
resistive index |
0.950 | 0.699–1.291 |
0.744 | | | |
| Splenic vein
diameter (mm) |
1.890 | 1.199–2.980 |
0.006 |
2.729 | 0.701–10.622 | 0.148 |
| Splenic vein
velocity (cm/s) |
0.896 | 0.809–0.992 |
0.034 |
1.039 | 0.974–1.323 | 0.103 |
| APRI |
1.011 | 0.995–1.029 |
0.186 | | | |
| FIB-4 |
2.082 | 1.254–3.456 |
0.005 | | | |
| Liver stiffness
(FibroScan kPa) |
1.492 | 1.247–1.785 | <0.001 | | | |
| LFI | 13.944 | 3.603–53.960 | <0.001 | 14.102 | 2.873–69.221 | 0.001 |
Development of a novel model for the
prediction of significant fibrosis and cirrhosis and determination
of diagnostic accuracy
Considering the aforementioned multivariate analysis
results, the multiple fractional equations for the prediction of
significant fibrosis and cirrhosis that included LFI were
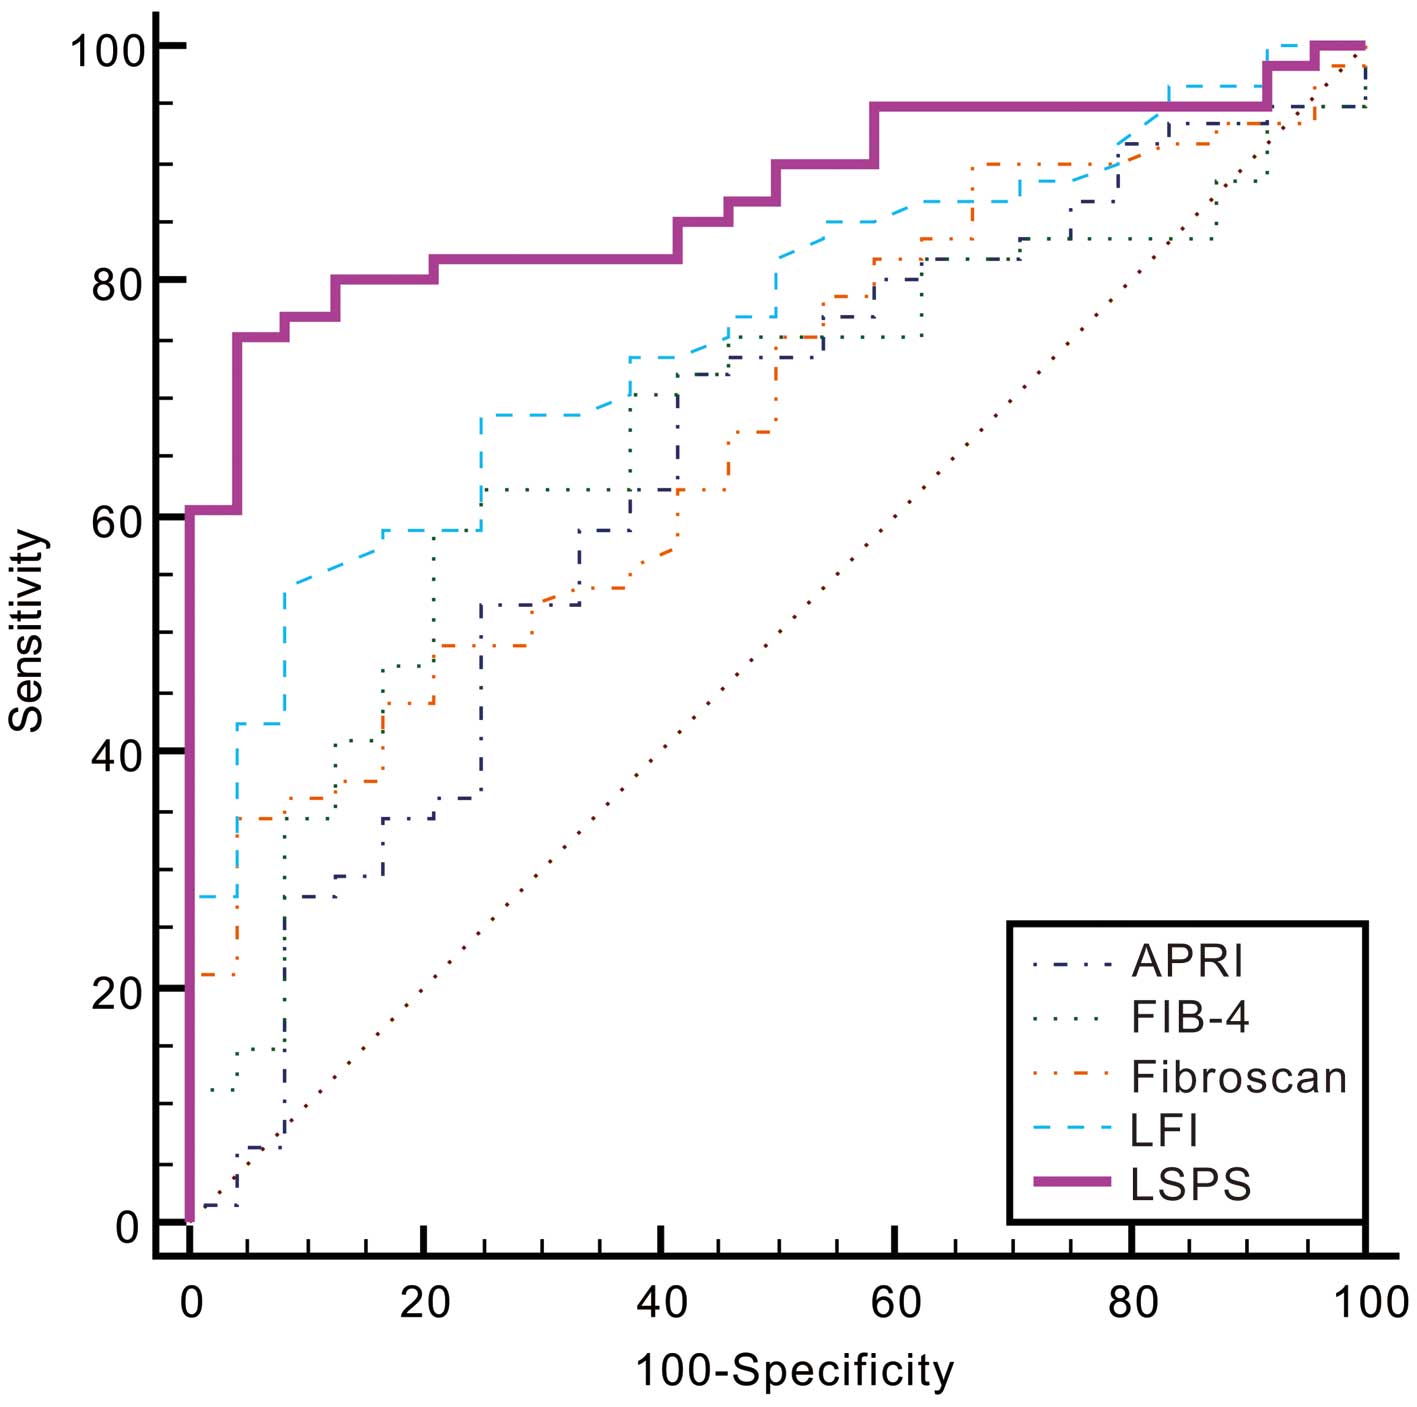
respectively derived. The novel model for the prediction of
significant fibrosis, termed the LFI-SPI score (LSPS), was derived
using the following formula: LSPS = 1.838LFI + 2.6 36SPI − 6.728. A
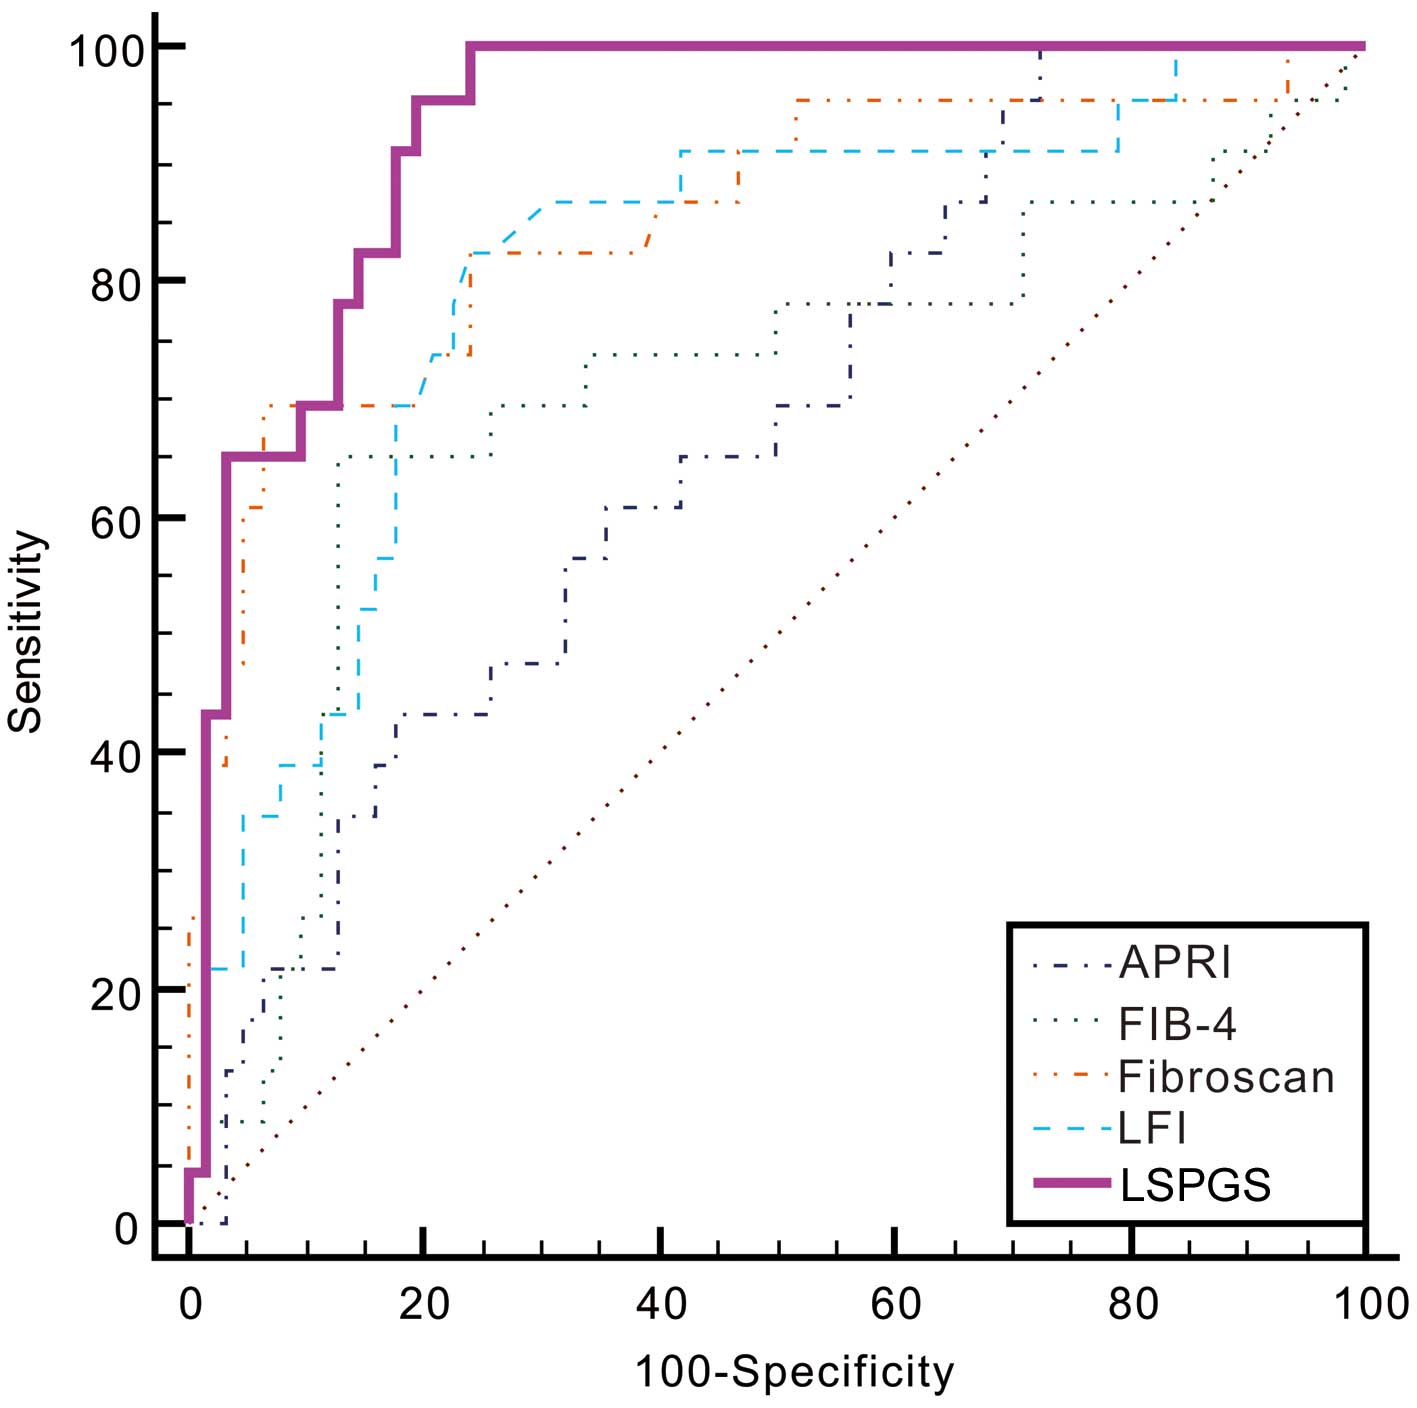
regression formula for predicting cirrhosis, termed the LFI-SPI-GGT
score (LSPGS), was derived as follows: LSPGS = 2.646LFI + 1.736SPI
+ 0.011GGT − 10.967. The AUROC of LSPS was 0.87 [95% confidence
interval (95% CI), 0.78–0.94], demonstrating the superior
diagnostic accuracy of this novel formula for the prediction of
significant fibrosis when compared with the LFI, APRI, FIB-4 and
FibroScan models (AUROC=0.76, 0.64, 0.67 and 0.68, respectively;
P=0.0109, 0.0031, 0.0044 and 0.0021, respectively; Fig. 2 and Table V). With a cut-off value of 0.7423,
LSPS had an excellent sensitivity of 75.41%, a specificity of
95.83%, positive LR (PLR) of 18.10, negative LR (NLR) of 0.26, PPV
of 97.9% and NPV of 60.5% (for 95% CI values, refer to Table V).
| Table VDiagnostic values of models for
predicting significant fibrosis in patients with chronic hepatitis
B. |
Table V
Diagnostic values of models for
predicting significant fibrosis in patients with chronic hepatitis
B.
| Models | Sensitivity
(%) | Specificity
(%) | PLR | NLR | PPV (%) | NPV (%) | AUROC | Youden index | P-value |
|---|
| LFI | 54.10
(40.8–66.9) | 91.7
(73.0–99.0) | 6.49
(1.7–25.0) | 0.50 (0.4–0.7) | 94.3
(80.8–99.3) | 44.0
(30.0–58.7) | 0.76
(0.66–0.85) | 0.4577 | 0.0109 |
| APRI | 37.7
(25.6–51.0) | 75.0
(53.3–90.2) | 1.51
(0.7–3.2) | 0.83 (0.6–1.1) | 79.3
(60.3–92.0) | 32.1
(20.3–46.0) | 0.64
(0.53–0.74) | 0.3046 | 0.0031 |
| FIB-4 | 59.02
(45.7–71.4) | 79.17
(57.8–92.9) | 2.83
(1.3–6.4) | 0.52 (0.4–0.7) | 87.8
(73.8–95.9) | 43.2
(28.3–59.0) | 0.67
(0.56–0.77) |
0.382 | 0.0044 |
| FibroScan | 34.43
(22.7–47.7) | 95.83
(78.9–99.9) | 8.26
(1.2–58.1) | 0.68 (0.6–0.8) | 95.5
(77.2–99.9) | 36.5
(24.7–49.6) | 0.68
(0.57–0.77) | 0.3026 | 0.0021 |
| LSPS | 75.41
(62.7–85.5) | 95.83
(78.9–99.9) | 18.10
(2.6–124.0) | 0.26 (0.2–0.4) | 97.9
(88.7–99.9) | 60.5
(43.4–76.0) | 0.87
(0.78–0.94) | 0.7124 | Reference |
The performance of LSPGS in predicting cirrhosis was
also high, with an AUROC of 0.93. Apart from liver stiffness (as
determined by FibroScan; AUROC=0.85; P=0.134), the LFI, APRI and
FIB-4 models (AUROC, 0.81, 0.67 and 0.71, respectively; P=0.0113,
<0.0001 and 0.0005, respectively) showed significantly lower
AUROC values compared with that of the LSPGS (Fig. 3 and Table VI). With a cut-off value of
0.1803, LSPGS had an excellent sensitivity of 95.65%, a specificity
of 80.65%, PLR of 4.94, NLR of 0.054, PPV of 64.7% and NPV of 98.0%
(for 95% CI values, refer to Table
VI).
| Table VIDiagnostic values of models for
predicting cirrhosis in patients with chronic hepatitis B. |
Table VI
Diagnostic values of models for
predicting cirrhosis in patients with chronic hepatitis B.
| Models | Sensitivity
(%) | Specificity
(%) | PLR | NLR | PPV (%) | NPV (%) | AUROC | Youden index | P-value |
|---|
| LFI | 82.61
(61.2–95.0) | 75.81
(63.3–85.8) | 3.41 (2.1–5.5) | 0.23
(0.09–0.6) | 55.9
(37.9–72.8) | 92.2
(81.1–97.8) | 0.81
(0.71–0.89) | 0.5842 |
0.0113 |
| APRI | 100.0
(85.2–100.0) | 27.42
(16.9–40.2) | 1.38 (1.2–1.6) | 0 | 33.8
(22.8–46.3) | 100.0
(80.5–100.0) | 0.67
(0.56–0.77) | 0.2742 | <0.0001 |
| FIB-4 | 65.22
(42.7–83.6) | 87.10
(76.1–94.3) | 5.05
(2.5–10.3) | 0.40 (0.2–0.7) | 65.2
(42.7–83.6) | 87.1
(76.1–94.3) | 0.71
(0.60–0.80) | 0.5231 |
0.0005 |
| FibroScan | 69.57
(47.1–86.8) | 93.55
(84.3–98.2) | 10.78
(4.0–28.9) | 0.33 (0.2–0.6) | 80.0
(56.3–94.3) | 89.2
(79.1–95.6) | 0.85
(0.76–0.92) | 0.6311 |
0.1342 |
| LSPGS | 95.65
(78.1–99.9) | 80.65
(68.6–89.6) | 4.94 (3.0–8.3) | 0.054
(0.008–0.4) | 64.7
(46.5–80.3) | 98.0
(89.6–100.0) | 0.93
(0.85–0.97) | 0.7630 | Reference |
Discussion
The use of liver biopsy to diagnose fibrosis and
cirrhosis is limited by the occurrence of sampling errors, as well
as intra and inter-observer variability (27,28).
Therefore, a reliable non-invasive diagnostic model with ~90%
accuracy is required, according to the AUROC value. Studies have
shown that the performance of various serum test formulas is not
satisfactory (29,30). Liver stiffness measured by US
methods has demonstrated the most accurate diagnostic performance
for advanced fibrosis and cirrhosis among all non-invasive
assessments of liver fibrosis and cirrhosis (31). However, the diagnostic performance
of these methods is particularly affected by hepatic inflammation,
ascites and/or steatosis (32). In
the present study, the RTE-based quantitative analysis method LFI
was calculated using multiple regression analysis of nine image
features, the majority of which were significantly associated with
the hepatic fibrosis stage. However, LFI alone was observed to have
a good diagnostic performance for liver fibrosis, particularly in
patients with CHB. The diagnostic performance of LFI to confirm
advanced fibrosis and cirrhosis may be improved further using an
algorithm that combines LFI with serum markers and US
parameters.
The aim of the present study was to develop a novel
and accurate model using routinely available laboratory tests and
US parameters of the liver and spleen, which can predict
significant fibrosis and cirrhosis in a consecutive series of
treatment-naive patients with CHB. SPI and LFI were found to be
independent predictors of significant fibrosis, whereas GGT, SPI
and LFI were independent predictors of cirrhosis. Numerous previous
studies have demonstrated that platelet count, AST level, and
AST/ALT ratio are important predictors of significant fibrosis or
cirrhosis (33,34). However, in the present study, only
the GGT laboratory parameter was independently associated with
cirrhosis, which is in agreement with the results of previous
studies (35,36). Furthermore, several assay panels
are currently available for the assessment of fibrosis, which use a
combination of markers, including GGT. GGT is associated with
hepatocyte growth factor, which is a pleiotropic cytokine produced
by hepatic stellate cells (37).
Therefore, early cholestasis or an increase in epidermal growth
factor expression may offer an explanation for the observed
increase in GGT with increasing fibrosis severity.
A total of 14 US parameters, which are considered to
be associated with the progression of chronic liver diseases, were
measured in the present study. The SPI was the only ultrasound
index to enter the discriminant function. Enlargement of the spleen
may be caused by high portal vein pressure, and the degree of
fibrosis is the most important factor affecting portal vein
pressure (38). SPI incorporates
spleen size and PVV characteristics, which may therefore provide a
more reliable indication of chronic liver disease progression.
There are two advantages to the use of SPI for predicting the
presence of significant fibrosis and cirrhosis: Firstly, SPI can be
measured concomitantly during routine biannual US screening for
hepatocellular carcinoma in patients with CHB and therefore, it
does not incur additional costs; secondly, the techniques used to
measure SI and mean PVV can be performed without difficulty.
By combining LFI and SPI, a novel formula for
predicting significant fibrosis, defined as LSPS, was derived from
the analysis conducted in the present study. LSPS had an excellent
diagnostic accuracy in staging significant fibrosis, with an AUROC
of 0.87, which was superior to noninvasive tests used in previous
studies (39,40). By contrast, the LSM scores of
patients were relatively low, which may have been due to the
inclusion of patients with greatly elevated serum ALT or AST levels
(abnormality rate, 38.8%) or other factors such as BMI (obesity
rate, 25.9%). Furthermore, for predicting the stage of liver
cirrhosis, the novel LSPGS formula was derived from the analysis by
integrating LFI, SPI and GGT values. The diagnostic performance of
LSPGS was similar to that of FibroScan, since these two models had
excellent diagnostic accuracies to detect cirrhosis (AUROC=0.93 and
0.85, respectively) and were superior to other noninvasive tests.
Notably, the predictive models consisted of objective and readily
available laboratory variables and US parameters. SPI and GGT tests
are performed routinely in clinical practice to diagnose patients
with CHB.
APRI and FIB-4 can be readily calculated from simple
blood tests, which are performed routinely in patients admitted for
a liver biopsy. However, despite the fact that APRI and FIB-4 are
useful for detecting significant fibrosis and cirrhosis in
HBV-infected patients, these tests are not accurate for excluding
the presence of fibrosis and cirrhosis (16,41).
Thus, the reliability of APRI and FIB-4 values for the day-to-day
management of patients in clinical hepatology practice is
questionable.
The present study was limited by the fact that it
was a single-center study, and thus independent external validation
in other cohorts is necessary to validate the results. The
distribution of the fibrosis stages of the enrolled subjects may
not have been an accurate representation of the disease spectrum
observed routinely during daily practice or in other medical
centers, which may affect the interpretation of the derived
indexes. In addition, the total number of patients with CHB
included in the present study was small. Patients recruited to The
First Affiliated Hospital of Wenzhou Medical University were more
likely to have presented with advanced disease. Therefore, AUROC
values for the diagnosis of severe fibrosis and cirrhosis may be
overestimated in the present study. In addition, patient numbers
were not distributed equally between Ishak scores 0 and 6 fibrosis
stages. Therefore, the possibility that this distribution improved
the predictive value of models cannot be excluded. However, the
cohort was not sufficiently large to conduct a stage-by-stage
comparison. Furthermore, this was a cross-sectional study, and
therefore the ability of LSPS and LSPGS to predict the subsequent
development or progression of fibrosis requires further
investigation in a longitudinal cohort.
In conclusion, two novel formulas (LSPS and LSPGS)
for predicting significant liver fibrosis and cirrhosis were
developed over the course of the current prospective study. The
LSPS and LSPGS formulas were found to provide excellent diagnostic
accuracies in predicting significant fibrosis and cirrhosis. These
results led to a reduction in the number of unnecessary liver
biopsies by 60.5 and 98.0% for significant fibrosis and cirrhosis,
respectively.
Acknowledgments
The present study was supported by the Scientific
Research Foundation of Wenzhou (grant no. Y20100042).
References
|
1
|
Yu R, Fan R and Hou J: Chronic hepatitis B
virus infection: Epidemiology, prevention, and treatment in China.
Front Med. 8:135–144. 2014. View Article : Google Scholar : PubMed/NCBI
|
|
2
|
Liaw YF: Reversal of cirrhosis: An
achievable goal of hepatitis B antiviral therapy. J Hepatol.
59:880–881. 2013. View Article : Google Scholar : PubMed/NCBI
|
|
3
|
Guido M, Mangia A and Faa G; Gruppo
Italiano Patologi Apparato Digerente (GIPAD); Società Italiana di
Anatomia Patologica e Citopatologia Diagnostica/International
Academy of Pathology Italian division (SIAPEC/IAP): Chronic viral
hepatitis: The histology report. Dig Liver Dis. 43(Suppl 4):
S331–S343. 2011. View Article : Google Scholar : PubMed/NCBI
|
|
4
|
Castera L: Noninvasive methods to assess
liver disease in patients with hepatitis B or C. Gastroenterology.
142:1293–1302.e4. 2012. View Article : Google Scholar : PubMed/NCBI
|
|
5
|
Gaia S, Campion D, Evangelista A, Spandre
M, Cosso L, Brunello F, Ciccone G, Bugianesi E and Rizzetto M:
Non-invasive score system for fibrosis in chronic hepatitis:
Proposal for a model based on biochemical, FibroScan and ultrasound
data. Liver Int. 35:2027–2035. 2015. View Article : Google Scholar
|
|
6
|
Hu X, Xu X, Zhang Q, Zhang H, Liu J and
Qian L: Indirect prediction of liver fibrosis by quantitative
measurement of spleen stiffness using the FibroScan system. J
Ultrasound Med. 33:73–81. 2014. View Article : Google Scholar
|
|
7
|
Kim SU, Lee JH, Kim DY, Ahn SH, Jung KS,
Choi EH, Park YN, Han KH, Chon CY and Park JY: Prediction of
liver-related events using fibroscan in chronic hepatitis B
patients showing advanced liver fibrosis. PLoS One. 7:e366762012.
View Article : Google Scholar : PubMed/NCBI
|
|
8
|
Bamber J, Cosgrove D, Dietrich CF,
Fromageau J, Bojunga J, Calliada F, Cantisani V, Correas JM,
D'Onofrio M, Drakonaki EE, et al: EFSUMB guidelines and
recommendations on the clinical use of ultrasound elastography.
Part 1: Basic principles and technology. Ultraschall Med.
34:169–184. 2013. View Article : Google Scholar : PubMed/NCBI
|
|
9
|
Cosgrove D, Piscaglia F, Bamber J, Bojunga
J, Correas JM, Gilja OH, Klauser AS, Sporea I, Calliada F,
Cantisani V, et al: EFSUMB guidelines and recommendations on the
clinical use of ultrasound elastography. Part 2: Clinical
applications. Ultraschall Med. 34:238–253. 2013. View Article : Google Scholar : PubMed/NCBI
|
|
10
|
Hu Q, Zhu SY, Kang LK, Wang XY, Lun HM and
Xu CM: Non-invasive assessment of liver fibrosis using real-time
tissue elastography in patients with chronic hepatitis B. Clin
Radiol. 69:194–199. 2014. View Article : Google Scholar
|
|
11
|
Kobayashi K, Nakao H, Nishiyama T, Lin Y,
Kikuchi S, Kobayashi Y, Yamamoto T, Ishii N, Ohashi T, Satoh K, et
al: Diagnostic accuracy of real-time tissue elastography for the
staging of liver fibrosis: A meta-analysis. Eur Radiol. 25:230–238.
2015. View Article : Google Scholar
|
|
12
|
Yada N, Kudo M, Morikawa H, Fujimoto K,
Kato M and Kawada N: Assessment of liver fibrosis with real-time
tissue elastography in chronic viral hepatitis. Oncology. 84(Suppl
1): S13–S20. 2013. View Article : Google Scholar
|
|
13
|
Fujimoto K, Kato M, Kudo M, Yada N, Shiina
T, Ueshima K, Yamada Y, Ishida T, Azuma M, Yamasaki M, et al: Novel
image analysis method using ultrasound elastography for noninvasive
evaluation of hepatic fibrosis in patients with chronic hepatitis
C. Oncology. 84(Suppl 1): S3–S12. 2013. View Article : Google Scholar
|
|
14
|
Shiraishi A, Hiraoka A, Aibiki T, Okudaira
T, Kawamura T, Imai Y, Tatsukawa H, Yamago H, Nakahara H, Shimizu
Y, et al: Real-time tissue elastography: Non-invasive evaluation of
liver fibrosis in chronic liver disease due to HCV.
Hepatogastroenterology. 61:2084–2090. 2014.
|
|
15
|
Yada N, Kudo M, Kawada N, Sato S, Osaki Y,
Ishikawa A, Miyoshi H, Sakamoto M, Kage M, Nakashima O and Tonomura
A: Noninvasive diagnosis of liver fibrosis: Utility of data mining
of both ultrasound elastography and serological findings to
construct a decision tree. Oncology. 87(Suppl 1): S63–S72. 2014.
View Article : Google Scholar
|
|
16
|
Xiao G, Yang J and Yan L: Comparison of
diagnostic accuracy of aspartate aminotransferase to platelet ratio
index and fibrosis-4 index for detecting liver fibrosis in adult
patients with chronic hepatitis B virus infection: A systemic
review and meta-analysis. Hepatology. 61:292–302. 2015. View Article : Google Scholar
|
|
17
|
Wu T, Ren J, Cong SZ, Meng FK, Yang H, Luo
Y, Lin HJ, Sun Y, Wang XY, Pei SF, et al: Accuracy of real-time
tissue elastography for the evaluation of hepatic fibrosis in
patients with chronic hepatitis B: A prospective multicenter study.
Dig Dis. 32:791–799. 2014. View Article : Google Scholar : PubMed/NCBI
|
|
18
|
Mathurin P and Bataller R: Trends in the
management and burden of alcoholic liver disease. J Hepatol. 62(1
Suppl): S38–S46. 2015. View Article : Google Scholar : PubMed/NCBI
|
|
19
|
Liaw YF, Leung N, Kao JH, Piratvisuth T,
Gane E, Han KH, Guan R, Lau GK and Locarnini S; Chronic Hepatitis B
Guideline Working Party of the Asian-Pacific Association for the
Study of the Liver: Asian-Pacific consensus statement on the
management of chronic hepatitis B: A 2008 update. Hepatol Int.
2:263–283. 2008. View Article : Google Scholar
|
|
20
|
Huang ZL, Chen XP, Zhao QY, Zheng YB, Peng
L, Gao ZL and Zhao ZX: An albumin, collagen IV, and longitudinal
diameter of spleen scoring system superior to APRI for assessing
liver fibrosis in chronic hepatitis B patients. Int J Infect Dis.
31:18–22. 2015. View Article : Google Scholar
|
|
21
|
Liu CH, Hsu SJ, Liang CC, Tsai FC, Lin JW,
Liu CJ, Yang PM, Lai MY, Chen PJ, Chen JH, et al: Esophageal
varices: Noninvasive diagnosis with duplex Doppler US in patients
with compensated cirrhosis. Radiology. 248:132–139. 2008.
View Article : Google Scholar : PubMed/NCBI
|
|
22
|
Scott DR and Levy MT: Liver transient
elastography (Fibroscan): A place in the management algorithms of
chronic viral hepatitis. Antivir Ther. 15:1–11. 2010. View Article : Google Scholar : PubMed/NCBI
|
|
23
|
Tatsumi C, Kudo M, Ueshima K, Kitai S,
Ishikawa E, Yada N, Hagiwara S, Inoue T, Minami Y, Chung H, et al:
Non-invasive evaluation of hepatic fibrosis for type C chronic
hepatitis. Intervirology. 53:76–81. 2010. View Article : Google Scholar : PubMed/NCBI
|
|
24
|
Xu S, Wang Y, Tai DC, Wang S, Cheng CL,
Peng Q, Yan J, Chen Y, Sun J, Liang X, et al: qFibrosis: A
fully-quantitative innovative method incorporating histological
features to facilitate accurate fibrosis scoring in animal model
and chronic hepatitis B patients. J Hepatol. 61:260–269. 2014.
View Article : Google Scholar : PubMed/NCBI
|
|
25
|
Ishak K, Baptista A, Bianchi L, Callea F,
De Groote J, Gudat F, Denk H, Desmet V, Korb G, MacSween RN, et al:
Histological grading and staging of chronic hepatitis. J Hepatol.
22:696–699. 1995. View Article : Google Scholar : PubMed/NCBI
|
|
26
|
Parker CB and DeLong ER: ROC methodology
within a monitoring framework. Stat Med. 22:3473–3488. 2003.
View Article : Google Scholar : PubMed/NCBI
|
|
27
|
Bedossa P, Dargère D and Paradis V:
Sampling variability of liver fibrosis in chronic hepatitis C.
Hepatology. 38:1449–1457. 2003. View Article : Google Scholar : PubMed/NCBI
|
|
28
|
Goldin RD, Goldin JG, Burt AD, Dhillon PA,
Hubscher S, Wyatt J and Patel N: Intra-observer and inter-observer
variation in the histopathological assessment of chronic viral
hepatitis. J Hepatol. 25:649–654. 1996. View Article : Google Scholar : PubMed/NCBI
|
|
29
|
Xu XY, Kong H, Song RX, Zhai YH, Wu XF, Ai
WS and Liu HB: The effectiveness of noninvasive biomarkers to
predict hepatitis B-related significant fibrosis and cirrhosis: A
systematic review and meta-analysis of diagnostic test accuracy.
PLoS One. 9:e1001822014. View Article : Google Scholar : PubMed/NCBI
|
|
30
|
Ozel BD, Poyrazoğlu OK, Karaman A, Karaman
H, Altinkaya E, Sevinç E and Zararsiz G: The PAPAS index: A novel
index for the prediction of hepatitis C-related fibrosis. Eur J
Gastroenterol Hepatol. 27:895–900. 2015. View Article : Google Scholar : PubMed/NCBI
|
|
31
|
Chon YE, Choi EH, Song KJ, Park JY, Kim do
Y, Han KH, Chon CY, Ahn SH and Kim SU: Performance of transient
elastography for the staging of liver fibrosis in patients with
chronic hepatitis B: A meta-analysis. PLoS One. 7:e449302012.
View Article : Google Scholar : PubMed/NCBI
|
|
32
|
Kim SU, Seo YS, Cheong JY, Kim MY, Kim JK,
Um SH, Cho SW, Paik SK, Lee KS, Han KH and Ahn SH: Factors that
affect the diagnostic accuracy of liver fibrosis measurement by
Fibroscan in patients with chronic hepatitis B. Aliment Pharmacol
Ther. 32:498–505. 2010. View Article : Google Scholar : PubMed/NCBI
|
|
33
|
Sheth SG, Flamm SL, Gordon FD and Chopra
S: AST/ALT ratio predicts cirrhosis in patients with chronic
hepatitis C virus infection. Am J Gastroenterol. 93:44–48. 1998.
View Article : Google Scholar : PubMed/NCBI
|
|
34
|
Murali AR, Attar BM, Katz A, Kotwal V and
Clarke PM: Utility of platelet count for predicting cirrhosis in
alcoholic liver disease: Model for identifying cirrhosis in a US
population. J Gen Intern Med. 30:1112–1117. 2015. View Article : Google Scholar : PubMed/NCBI
|
|
35
|
Imbert-Bismut F, Ratziu V, Pieroni L,
Charlotte F, Benhamou Y and Poynard T; MULTIVIRC Group: Biochemical
markers of liver fibrosis in patients with hepatitis C virus
infection: A prospective study. Lancet. 357:1069–1075. 2001.
View Article : Google Scholar : PubMed/NCBI
|
|
36
|
Lens S, Torres F, Puigvehi M, Mariño Z,
Londoño MC, Martinez SM, García-Juárez I, García-Criado Á, Gilabert
R, Bru C, et al: Predicting the development of liver cirrhosis by
simple modelling in patients with chronic hepatitis C. Aliment
Pharmacol Ther. 43:364–374. 2016. View Article : Google Scholar
|
|
37
|
Marin-Serrano E, Rodriguez-Ramos C,
Diaz-Garcia F, Martin-Herrera L, Fernández-Gutiérrez-Del-Alamo C
and Girón-González JA: Hepatocyte growth factor and chronic
hepatitis C. Rev Esp Enferm Dig. 102:365–371. 2010. View Article : Google Scholar : PubMed/NCBI
|
|
38
|
Bolognesi M, Merkel C, Sacerdoti D, Nava V
and Gatta A: Role of spleen enlargement in cirrhosis with portal
hypertension. Dig Liver Dis. 34:144–150. 2002. View Article : Google Scholar : PubMed/NCBI
|
|
39
|
Zeng X, Xu C, He D, Li M, Zhang H, Wu Q,
Xiang D and Wang Y: Performance of several simple, noninvasive
models for assessing significant liver fibrosis in patients with
chronic hepatitis B. Croat Med J. 56:272–279. 2015. View Article : Google Scholar : PubMed/NCBI
|
|
40
|
Ucar F, Sezer S, Ginis Z, Ozturk G,
Albayrak A, Basar O, Ekiz F, Coban S, Yuksel O, Armutcu F and Akbal
E: APRI, the FIB-4 score, and Forn's index have noninvasive
diagnostic value for liver fibrosis in patients with chronic
hepatitis B. Eur J Gastroenterol Hepatol. 25:1076–1081. 2013.
View Article : Google Scholar : PubMed/NCBI
|
|
41
|
Li Y, Chen Y and Zhao Y: The diagnostic
value of the FIB-4 index for staging hepatitis B-related fibrosis:
A meta-analysis. PLoS One. 9:e1057282014. View Article : Google Scholar : PubMed/NCBI
|