Introduction
Genomic copy variations, including copy number
variations and chromosome aneuploidies, offer biological diversity
and lead to genetic disorders. Down syndrome (DS) is caused by
trisomy of human chromosome 21 (chr21) and is associated with
numerous deleterious phenotypes, including cognitive impairment,
childhood leukemia and immune defects (1). It occurs in ~1/700 newborns worldwide
(2). As the genetic basis for DS
is known as an extra copy of chr21, several studies have focused on
genes located on chr21. A number of genes located on chr21 are
expressed at high levels in individuals with DS (3), however, several genes on other
chromosomes are also disordered (4). Understanding the mechanism underlying
how the extra chr21 causes various disease phenotypes can lead to
improved management and, in the long term, treatment outcomes for
individuals with DS. It is important to identify a safe and
effective method to identify novel potential biomarkers.
MicroRNAs (miRNAs) are a class of small RNAs of ~22
nt, which are important in a number of key biological processes and
several human diseases at the post-transcriptional level of gene
expression (5). Previous studies
have shown that miRNAs are important in the normal regulation of
gene expression during cell proliferation and development (6). Identification of the differential
expression of genome-wide known and novel miRNAs can facilitate in
uncovering the molecular regulatory mechanisms underlying the
progression of the complex and variable phenotype of DS. A previous
finding suggested that miR-1246 may serve as a likely link between
the p53 family and Down syndrome (7). Previous studies have focused
predominantly on the Hsa21-derived miRNAs and have been performed
on the tissues of humans with DS, whereas few studies have focused
on the expression profile of miRNAs isolated from human blood
samples (8–10), and investigation of novel methods
in this area is warranted.
Elkan-Miller et al (11) used a novel method for the
identification of functionally important miRNA-target interactions,
integrating transcriptome, proteome and miRNA profiles, and
advanced in silico analysis using the Functional Assignment
of miRNA via Enrichment algorithm. These miRNAs were determined by
identifying depleted or enriched targets in the protein and
transcript datasets, with an expression consistent with the
accepted model of miRNA regulation. To obtain an unbiased and
complete view of the small RNA transcriptome and further
investigate the role of miRNAs in early embryonic development of
the DS fetus, the present study investigated the regulation of
protein and miRNA expression as an initial step towards a better
understanding of the regulation of gene expression in DS. The aim
was to provide an expansive view of DS from the integrated
bioinfomatics analysis of proteomics and miRNA data sets.
Materials and methods
Patients and controls
A total of six DS and six matched control fetal cord
blood samples (18–22 weeks of gestation) were obtained from the
Shenzhen People's Hospital (Shenzhen, China). The diagnosis of DS
was confirmed through chromosome examination. The six DS and six
control cord blood samples were combined to form pooled DS and
control cord blood samples, respectively, for small RNA library
construction and Illumina sequencing. The cord blood samples were
obtained by puncture extraction with the assistance of a color
Doppler ultrasound as the prenatal women were undergoing prenatal
diagnosis. The characteristics of each case are provided in the
Table I. The present study was
approved by the Ethics Committee of Shenzhen People's Hospital. The
CBMCs were separated using Ficoll-Paque (Sigma-Aldrich; Thermo
Fisher Scientific, Inc., Waltham, MA, USA) density gradient
centrifugation according to the manufacturer's protocol. Briefly, 2
ml of blood was layered on 3 ml of Ficoll-Paque and centrifuged for
25 min at 1,000 × g at room temperature. Mononuclear cells
were aspirated with a pipette, washed twice in phosphate-buffered
saline by centrifugation for 10 min at 700 × g at room
temperature and dissolved in 1 ml TRIzol® reagent
(Invitrogen; Thermo Fisher Scientific, Inc.). These samples were
stored at −80°C until further use (12).
 | Table I.Characteristics of each case. |
Table I.
Characteristics of each case.
| Mother ID | Age (years) | Gestational age
(weeks) | Karyotype
resulta |
|---|
| Patient 1 | 44 | 20 | 47, XX, +21 |
| Patient 2 | 36 | 20 | 47, XX, +21 |
| Patient 3 | 30 | 21 | 47, XY, +21 |
| Patient 4 | 34 | 20 | 47, XX, +21 |
| Patient 5 | 33 | 22 | 47, XY, +21 |
| Patient 6 | 32 | 19 | 47, XX, +21 |
| Control 1 | 37 | 21 | 46, XX |
| Control 2 | 36 | 20 | 46, XY |
| Control 3 | 30 | 20 | 46, XX |
| Control 4 | 34 | 18 | 46, XY |
| Control 5 | 33 | 22 | 46, XX |
| Control 6 | 32 | 21 | 46, XX |
The total plasma protein was extracted, and the
concentration was measured using a BCA protein kit (Pierce
Biotechnology, Rockford, IL, USA). In the present study, prior to
proteomic analysis, 40 µg of protein from each sample in each group
was pooled.
Written informed consent was obtained from all
guardians or subjects involved. The use of material for experiments
was approved by the Ethics Committee of 181 Hospital (Guilin,
China). The study was performed in accordance with the Helsinki
Declaration on ethical principles for medical research involving
human subjects.
Deep sequencing
Total RNA isolation from the CBMCs was performed
using TRIzol reagent (Invitrogen; Thermo Fisher Scientific, Inc.)
according to the manufacturer's protocol. Small RNA library
preparation and sequencing were performed using Illumina sequencing
technology (BGI, Shenzhen, China). In brief, the small RNA was
isolated by separating 10 µg of the total RNA using denaturing
polyacrylamide gel electrophoresis (PAGE) and excising the region
of the gel corresponding to 15–30 nt, based on standard
oligonucleotide markers. Small RNAs were then reverse transcribed
to cDNA using miRNA-specific stem-loop-like reverse transcription
primers and amplified by the ABI PRISM 7500 Sequence Detection
System (Applied Biosystems; Thermo Fisher Scientific, Inc).
Finally, the amplified cDNAs were purified on a 6% Tris-Borate-EDTA
PAGE and were sequenced on the Illumina Hi-seq 2000 system
(Illumina, Inc., San Diego, CA, USA). Two small RNA sequencing data
sets comprising the DS and control CBMCs were obtained from
Illumina fast track sequencing services. The frequencies of each
small RNA sequence reads were calculated as sequence tags, and only
sequences of 18–30 nt were retained for further analysis. All
unique sequence reads, which passed above the filters were mapped
onto the reference human genome using the SOAP (version 2.0)
program (www.bioconductor.org/packages/2.4/bioc/html/KEGGSOAP.html)
with at most two mismatches (13).
The differential expression of miRNAs was calculated by relative
expression analysis between the DS and control.
Reverse transcription-quantitative
polymerase chain reaction (RT-qPCR) analysis
RT-qPCR was performed as described previously with a
minor modification (14). In
brief, total RNA was isolated from the CBMCs using TRIzol reagent
(Invitrogen; Thermo Fisher Scientific, Inc.) according to the
manufacturer's protocol. The RNA was then reverse transcribed into
cDNA using miRNA-specific stem-loop like RT primer (GenePharma,
Shanghai, China). PCR was performed using an Applied Biosystems
7500 real-time PCR machine (Applied Biosystems; Thermo Fisher
Scientific, Inc.). The PCR reaction was conducted at 95°C for 5
min, followed incubation at 95°C for 15 sec, 65°C for 15 sec and
72°C for 32 sec for 40 cycles using SYBR Green PCR Master Mix
(Toyobo Co., Ltd., Osaka, Japan). Each PCR was repeated at least
three times. The relative expression level of each miRNA was
normalized against the level of RNU6B. Fold-changes were calculated
according to the 2-∆∆Cq method (14).
Isobaric tagging for relative and
absolute protein quantification (iTRAQ) strong cation exchange
(SCX)-tandem mass spectrometry (MS/MS) analysis
The total protein of each corresponding group was
blocked, digested and labeled using the iTRAQ protocol (Applied
Biosystems; Thermo Fisher Scientific, Inc.). The labeled digests
were combined into each sample mixture. Multidimensional liquid
chromatography was used to separate the tryptic peptides prior to
MS. The combined samples were separated into 10 SCX fractions using
a 300Å, 35×0.3 mm, 3.5-µm particle size column (Zorbax Bio-SCX;
Agilent Technologies, Inc., Santa Clara, CA, USA) with a potassium
formate gradient in 25% acetonitrile. The peptides in these
fractions were separated on Tempo™ LC nanoflow and MALDI spotting
systems (Applied Biosystems; Thermo Fisher Scientific, Inc.)
equipped with a reversed-phase Magic C18AQ column (Phenomenex,
Inc., Torrance, CA, USA). Each chromatography run yielded ~380
MALDI spots on a stainless steel MALDI target plate. MS data
acquisition was calculated using an Applied Biosystems 4800 Plus
MALDI TOF/TOF analyzer (Applied Biosystems; Thermo Fisher
Scientific, Inc.). Only a signal to noise ratio ≥40 was selected
for MS/MS. Mass spectra from 500 laser shots were obtained for each
spot. The combined MS/MS data from 10 SCX fractions was used for a
Paragon algorithm search engine and human V3.62 (European
Bioinformatics Institute; www.ebi.ac.uk)
(15).
Bioinformatics analysis
miRNA expression profile and target gene
prediction
Three software programs were used to predict target
genes: miRanda v5 (www.ebi.ac.uk/enright-srv/microcosm/htdocs/targets/v5/),
TargetScan 5.1 (www.targetscan.org) and PicTar 2005
(pictar.mdc-berlin.de/cgi-bin/PicTar_vertebrate.cgi) (16).
The results were predicted by the three software
programs at the same time and was considered reliable. The
differentially expressed proteins were identified using iTRAQ
analysis. Standard human gene symbols of these proteins were used
to search the list of miRNA-targeted genes. Cytoscape software was
then used to obtain the miRNA and target gene regulation
network.
Protein expression profile and gene interaction
regulatory network
The differentially expressed proteins were analyzed
using the Mammalian Protein-Protein Interaction (MIPS) database
(mips.helmholtz-muenchen.de/proj/ppi/), Kyoto
Encyclopedia of Genes and Genomes (KEGG) SOAP and co-citation
calculation in PubMed (ncbi.nlm.nih.gov/pubmed). A network was constructed by
integrating the results of the differentially expressed proteins
analyzed using the MIPS database. (17).
Gene ontology (GO) and KEGG pathway analysis
To further understand the functions of the
identified proteins, the present study used the online GO tool, Web
Gene Ontology Annotation Plot (WEGO; http://wego.genomics.org.cn/). GO and KEGG pathway
mapping of the targeted genes were performed using the
web-accessible Database for Annotation, Visualization and
Integrated Discovery (DAVID) annotation system (david.ncifcrf.gov).
Results
miRNA expression profile
To investigate the expression profile of genome-wide
miRNA in the umbilical cord blood (UCB), the present study used
Illumina sequencing technology to sequence the small RNA libraries
of the DS group and normal group. A total of 344 miRNAs were
detected as being differentially expressed, if which 46 miRNAs were
upregulated and 298 miRNAs were downregulated in DS, compared with
the normal control group. To validate the results of the Illumina
sequencing, RT-qPCR assays were performed with specific stem-loop
RT primers to examine the expression levels of the Hsa21-derived
mature miRNAs and randomly selected significantly differentially
expressed miRNAs, including four downregulated miRNAs (hsa-miR-16,
miR-126, miR-21 and miR-223) and two upregulated miRNAs
(hsa-miR-196b and miR-92b*). The results of the RT-qPCR analysis
indicated similar expression levels of the miRNAs to the deep
sequencing.
Protein expression profile and gene
interaction regulation network
To investigate the expression profile of proteins in
the plasma of the UCB, the present study used iTRAQ technology.
Relative quantification of proteins was based on the ratio of peak
areas from the MS/MS spectra. Compared with the control group, 505
differentially expressed proteins were identified, including 250
downregulated and 255 upregulated proteins, with tryptic peptides
differing 1.5-fold (P<0.05) in the DS group. The differentially
expressed proteins were analyzed using the MIPS database, KEGGSOAP
and co-citation calculation in PubMed. The interaction regulation
network was constructed by integrating the results of the these
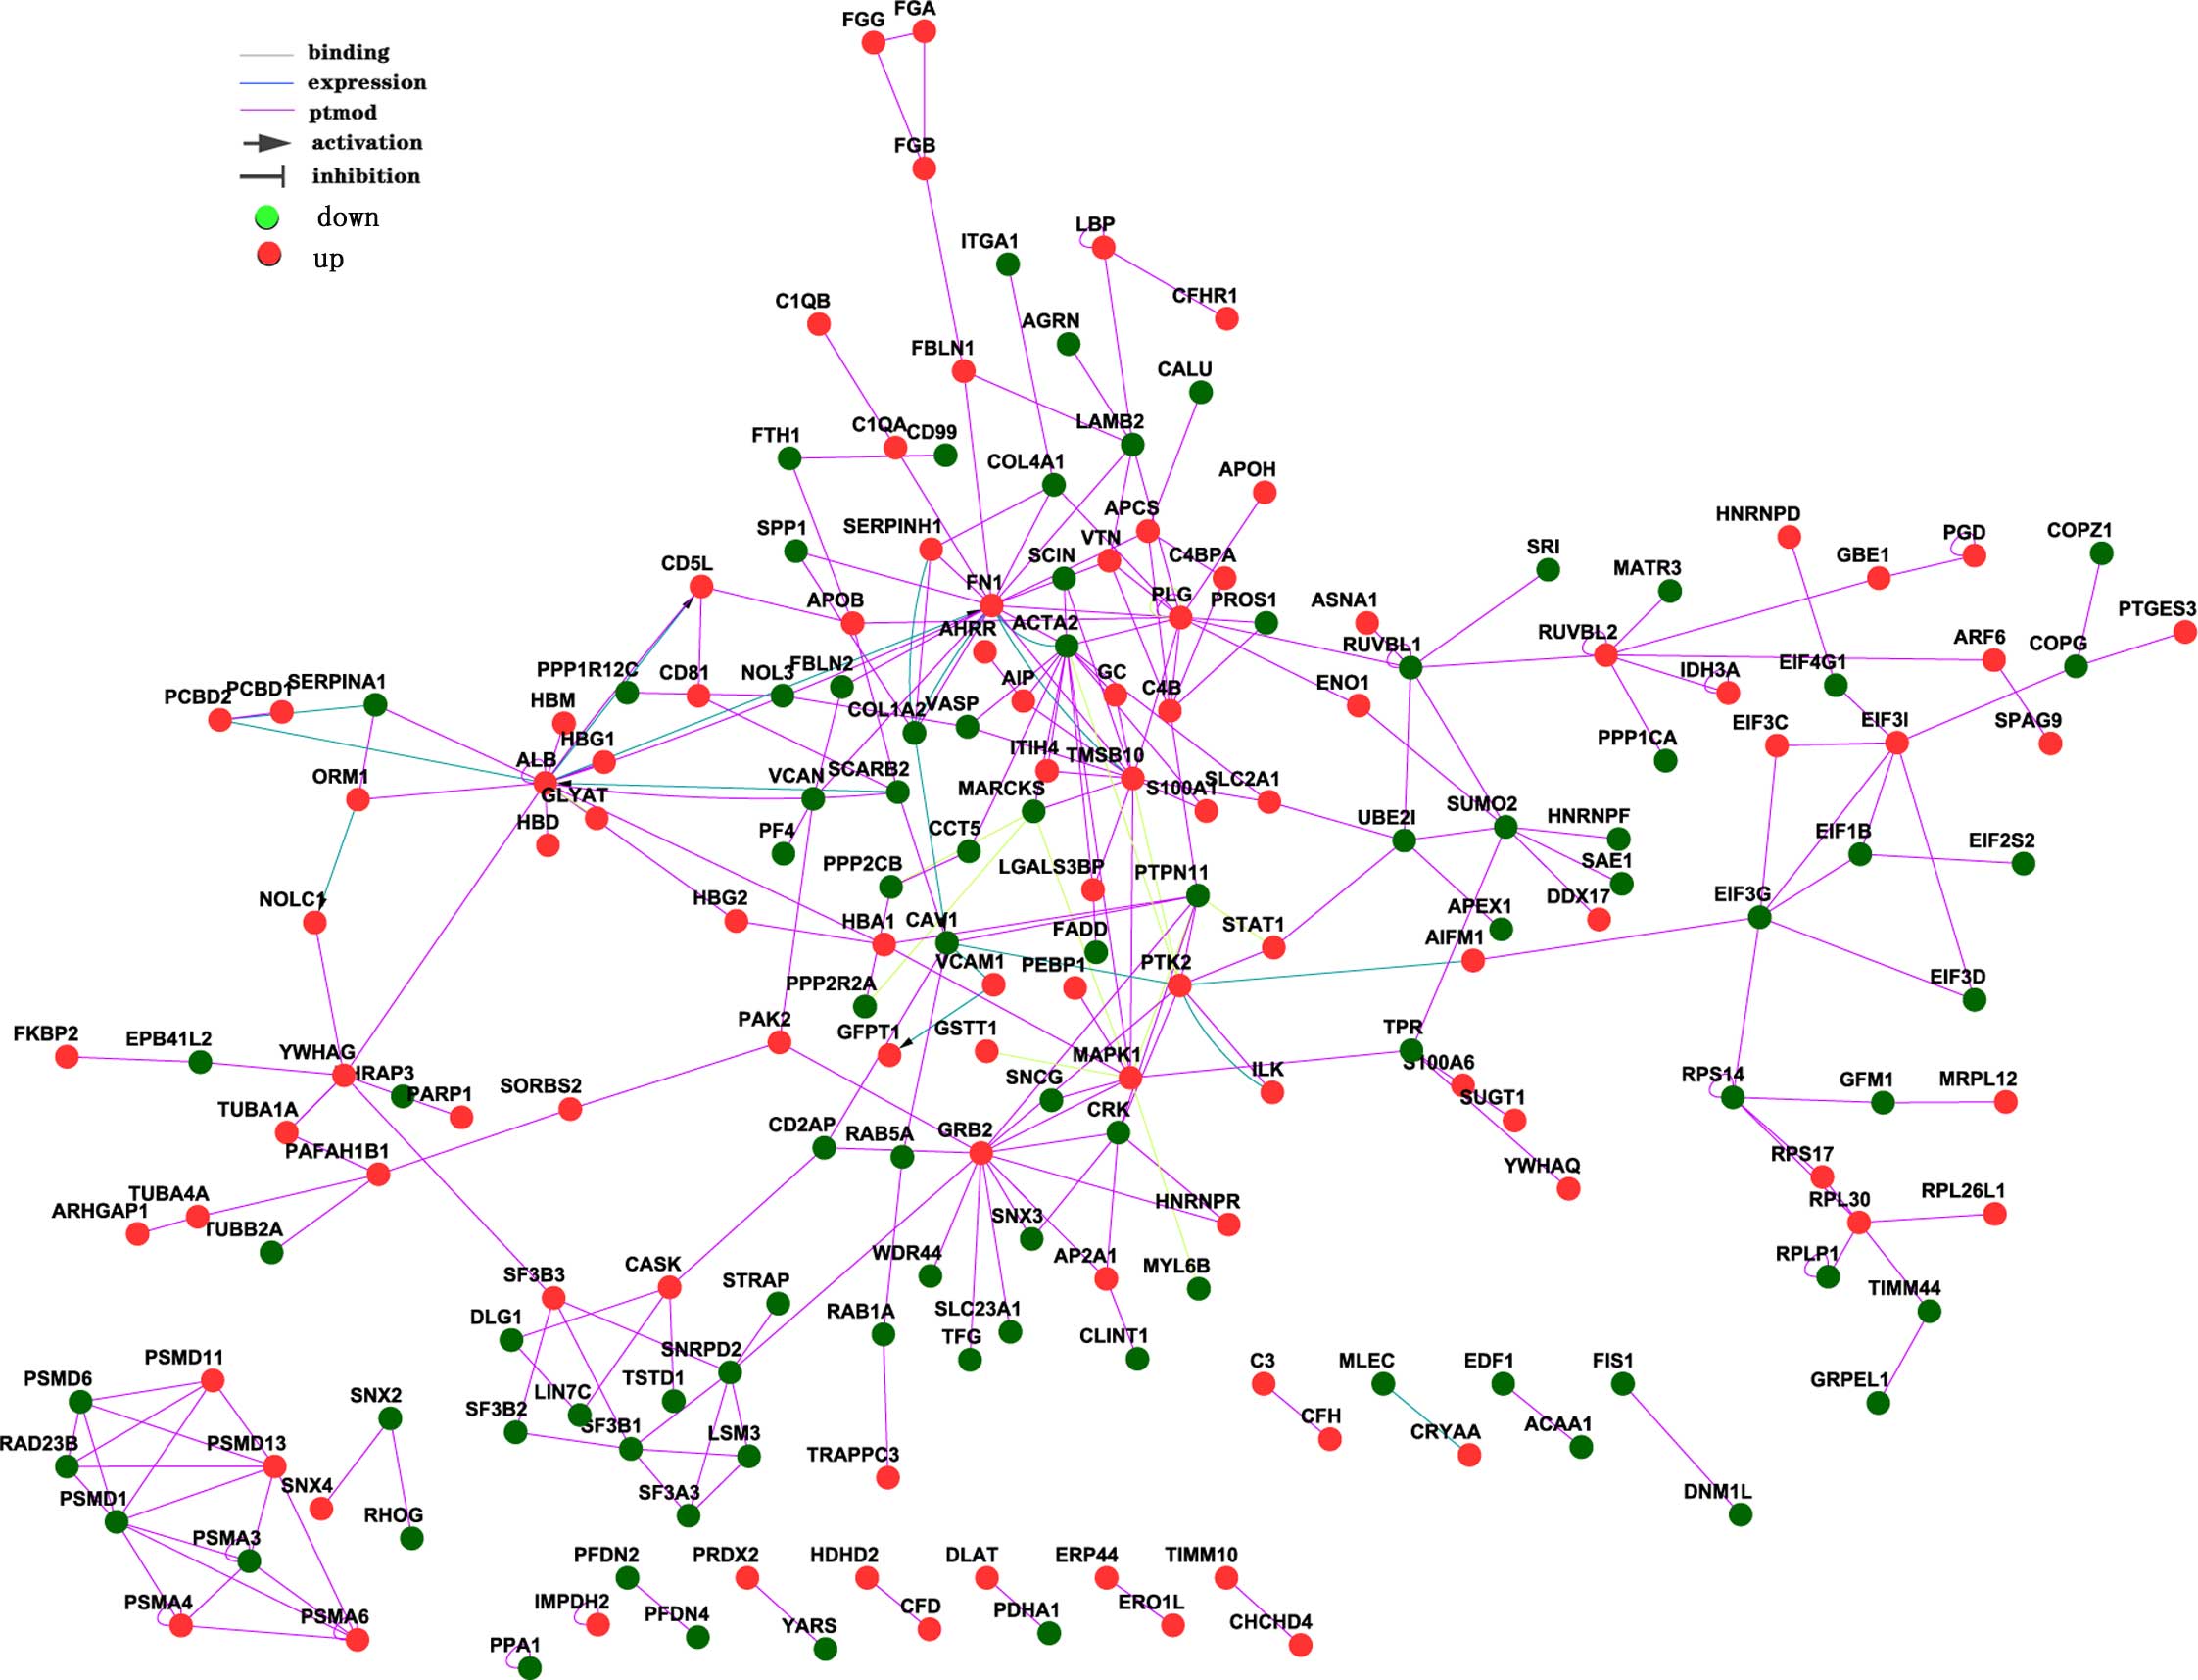
three types of data following comprehensive considerations
(Fig. 1). The network interaction
count is listed in Table II,
which indicates the interaction count of a gene with other
genes.
| Table II.Interaction count analysis of the
target gene network. |
Table II.
Interaction count analysis of the
target gene network.
| Target gene | Interaction
count |
|---|
| PSMA4 | 5 |
| PTK2 | 10 |
| PSMA6 | 6 |
| COL1A2 | 7 |
| C4B | 6 |
| YWHAG | 6 |
| EIF3I | 6 |
| MAPK1 | 11 |
| SF3B1 | 5 |
| CAV1 | 7 |
| SERPINH1 | 5 |
| SCARB2 | 5 |
| TMSB10 | 14 |
| RPL30 | 5 |
| RUVBL2 | 8 |
| PTPN11 | 8 |
| GRB2 | 13 |
| PSMA3 | 6 |
| ACTA2 | 15 |
| LAMB2 | 6 |
| ALB | 18 |
| PLG | 16 |
| UBE2I | 5 |
| FN1 | 19 |
| SUMO2 | 7 |
| MARCKS | 5 |
| EIF3G | 6 |
| RPS14 | 6 |
| RUVBL1 | 8 |
| CRK | 6 |
| PSMD1 | 7 |
| PSMD13 | 6 |
| SNRPD2 | 6 |
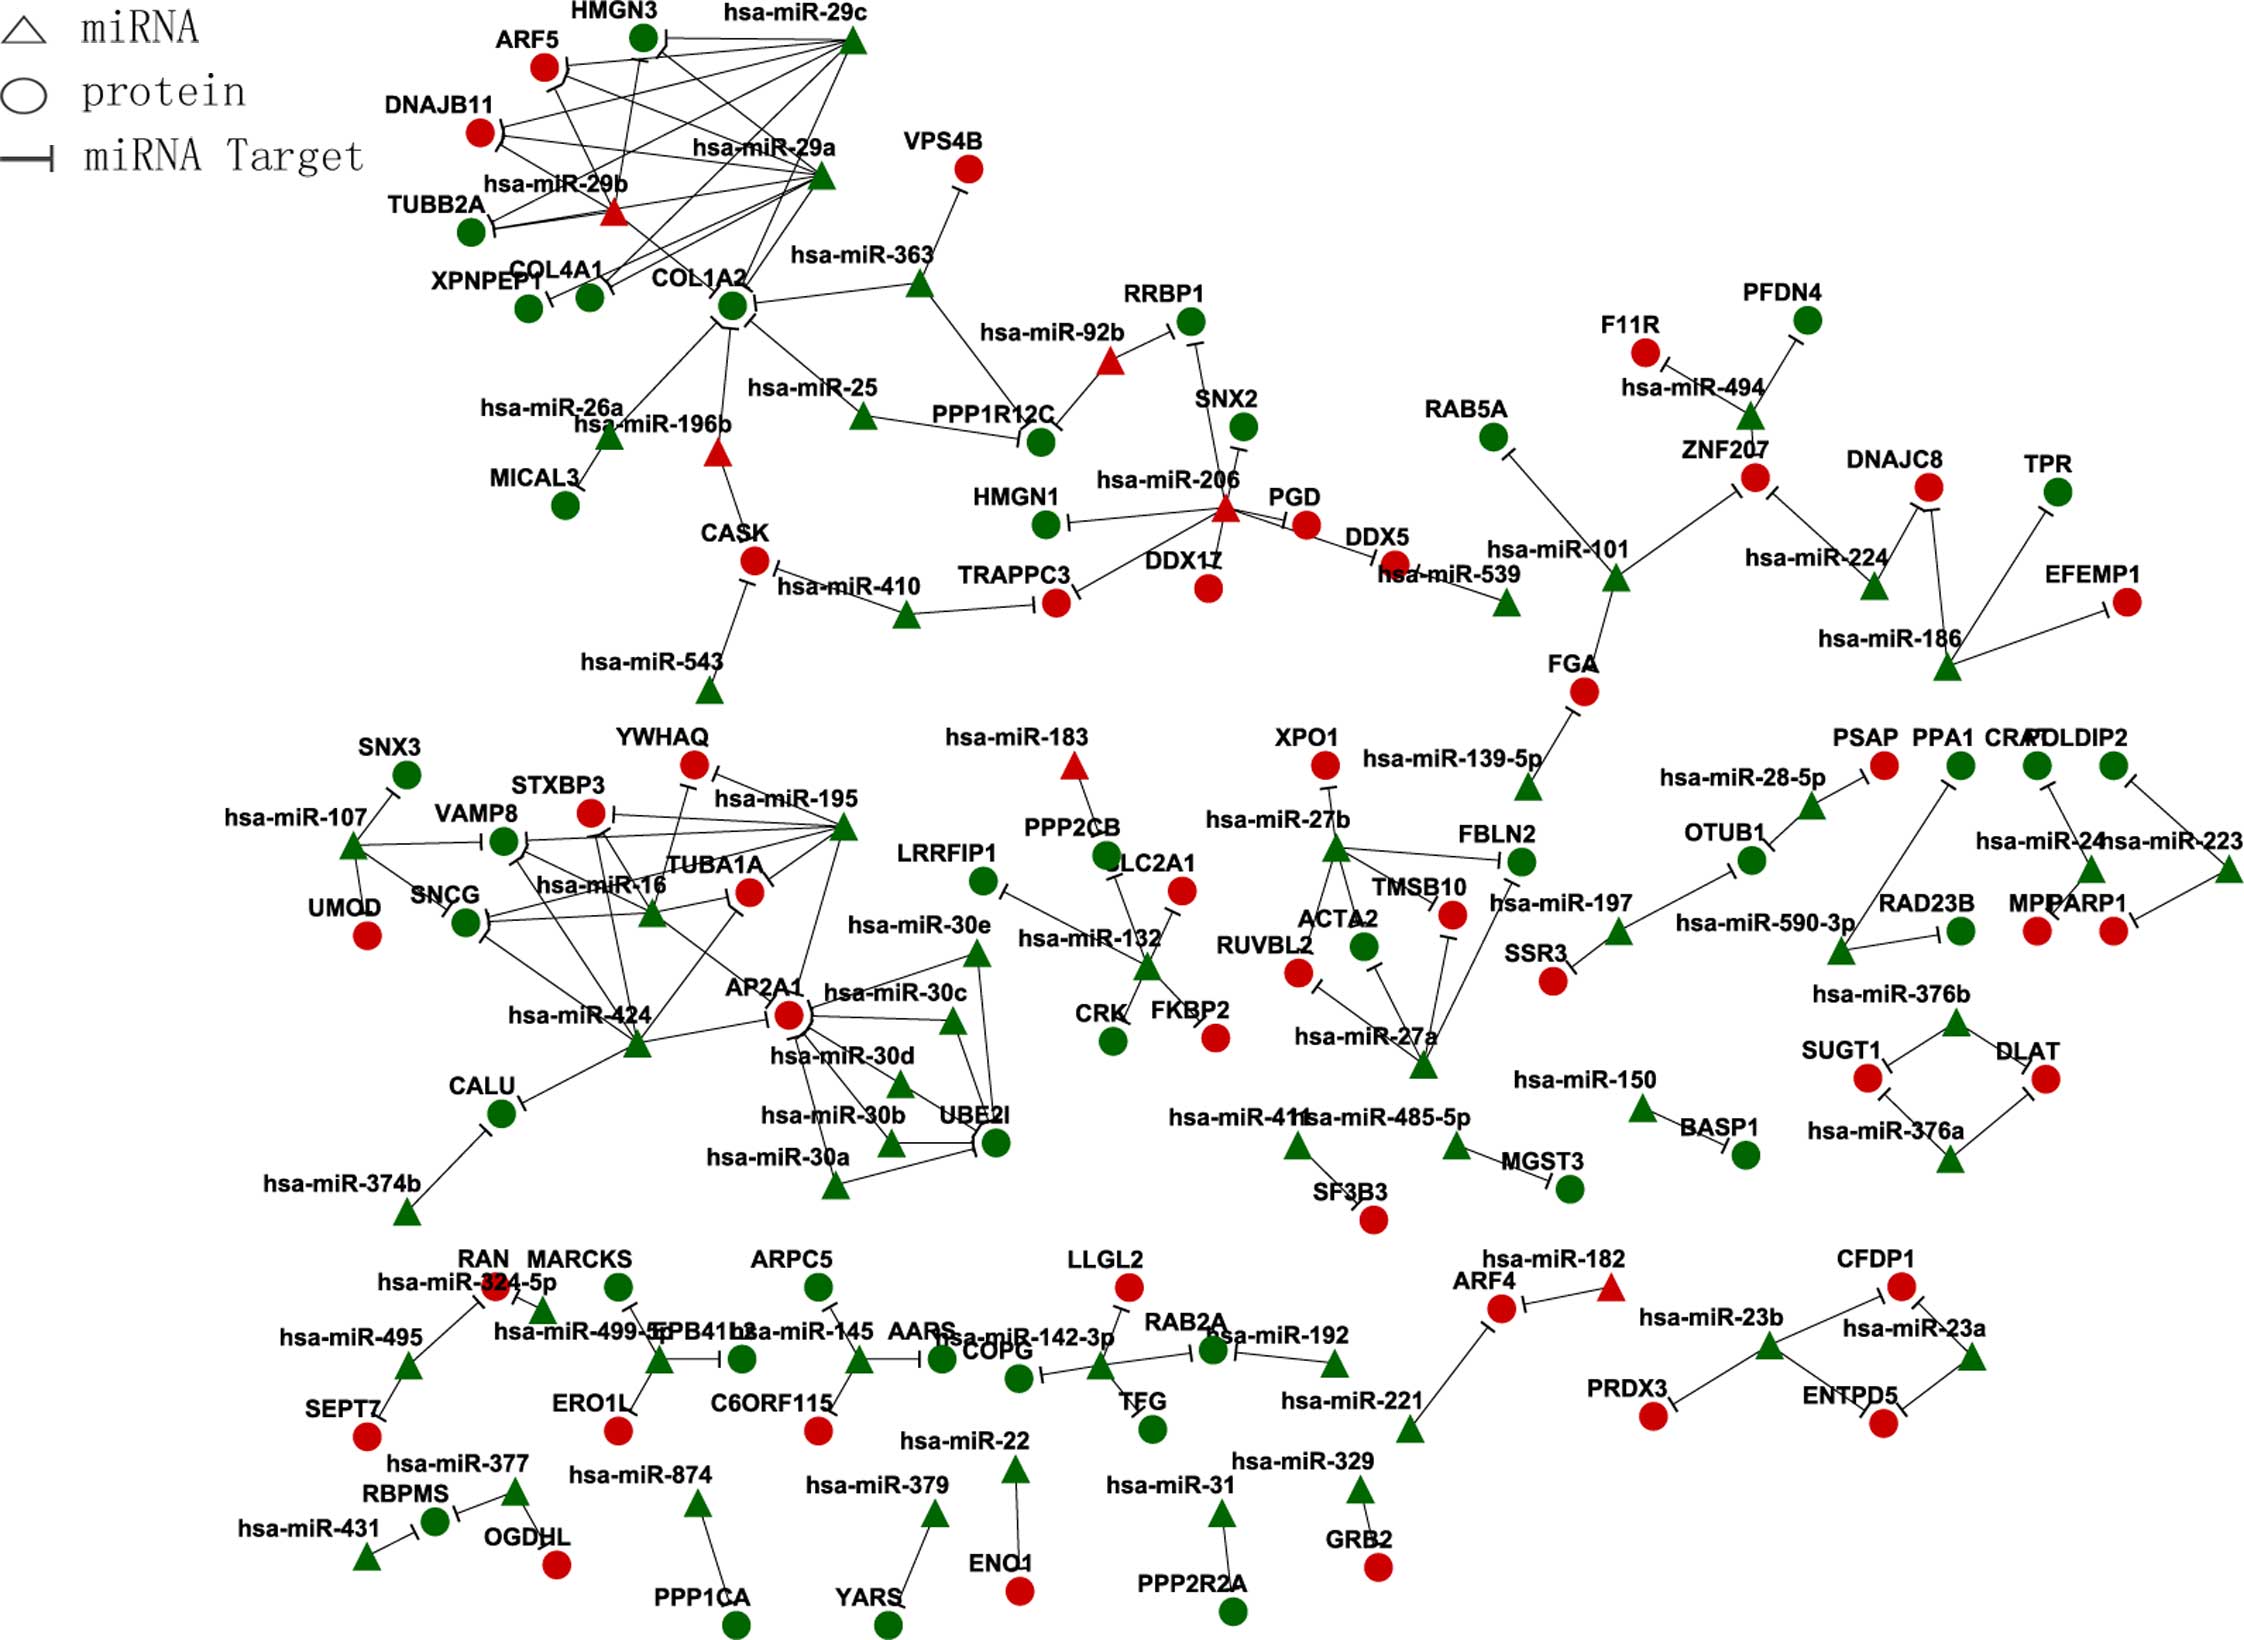
Differentially expressed gene and
differentially expressed miRNA association analysis
From the DS and normal control CBMCs, the present
study identified 344 miRNAs with significantly differing levels of
expression. These miRNAs targets were examined using the three
software programs mentioned above. The predicted targets of 58
miRNAs, including hsa-miR-27b, hsa-miR-329 and hsa-miR-27a, with
the highest total context score are listed in Table III. The predicted targets were
only found in the list of differentially expressed proteins using
iTRAQ analysis. Cytoscape software was then used to obtain the
miRNA and target gene association regulation network (Fig. 2).
| Table III.Predicted miRNA targets from three
commonly used software programs in Down syndrome. |
Table III.
Predicted miRNA targets from three
commonly used software programs in Down syndrome.
| miRNA | Target gene |
|---|
| Downregulated |
|
|
hsa-miR-142-3p | RAB2A, LLGL2, TFG,
COPG |
|
hsa-miR-197 | SSR3, OTUB1 |
|
hsa-miR-223 | PARP1, POLDIP2 |
|
hsa-miR-139-5p | FGA |
|
hsa-miR-150 | BASP1 |
|
hsa-miR-192 | RAB2A |
|
hsa-miR-16 | YWHAQ, TUBA1A SNCG,
VAMP8 AP2A1, STXBP3 |
|
hsa-miR-874 | PPP1CA |
|
hsa-miR-590-3p | RAD23B, PPA1 |
|
hsa-miR-485-5p | MGST3 |
|
hsa-miR-132 | PPP2CB, LRRFIP1
SLC2A1, CRK, FKBP2 |
|
hsa-miR-431 | RBPMS |
|
hsa-miR-411 | SF3B3 |
|
hsa-miR-24 | MPI, CRAT |
|
hsa-miR-543 | CASK |
|
hsa-miR-30a | UBE2I, AP2A1 |
|
hsa-miR-30e | UBE2I, AP2A1 |
|
hsa-miR-329 | GRB2 |
|
hsa-miR-25 | COL1A2,
PPP1R12C |
|
hsa-miR-377 | RBPMS, OGDHL |
|
hsa-miR-374b | CALU |
|
hsa-miR-107 | VAMP8, SNCG SNX3,
UMOD |
|
hsa-miR-26a | MICAL3, COL1A2 |
|
hsa-miR-379 | YARS |
|
hsa-miR-29c | DNAJB11, ARF5
COL4A1, COL1A2 COL1A2, HMGN3, TUBB2A |
|
hsa-miR-376a | SUGT1, DLAT |
| Upregulated |
|
|
hsa-miR-206 | DDX5, HMGN1, SNX2,
RRBP1 DDX17, TRAPPC3, PGD |
|
hsa-miR-196b | CASK, COL1A2 |
|
hsa-miR-183 | PPP2CB |
|
hsa-miR-424 | TUBA1A, SNCG, VAMP8
AP2A1, CALU, STXBP3 |
|
hsa-miR-31 | PPP2R2A |
|
hsa-miR-324-5p | RAN |
|
hsa-miR-224 | DNAJC8, ZNF207 |
|
hsa-miR-28-5p | PSAP, OTUB1 |
|
hsa-miR-23b | CFDP1, ENTPD5,
PRDX3 |
|
hsa-miR-27b | TMSB10, RUVBL2,
FBLN2 XPO1, ACTA2 |
|
hsa-miR-494 | PFDN4, F11R,
ZNF207 |
|
hsa-miR-145 | C6ORF115, ARPC5,
AARS |
|
hsa-miR-363 | VPS4B, COL1A2,
PPP1R12C |
|
hsa-miR-27a | TMSB10, RUVBL2
FBLN2, ACTA2 |
|
hsa-miR-101 | RAB5A, ZNF207,
FGA |
|
hsa-miR-22 | ENO1 |
|
hsa-miR-30d | UBE2I, AP2A1 |
|
hsa-miR-410 | TRAPPC3, CASK |
|
hsa-miR-495 | RAN, SEPT7 |
|
hsa-miR-499-5p | ERO1L, MARCKS,
EPB41L2 |
|
hsa-miR-186 | EFEMP1, DNAJC8,
TPR |
|
hsa-miR-539 | DDX5 |
|
hsa-miR-376b | SUGT1, DLAT |
|
hsa-miR-23a | CFDP1, ENTPD5 |
|
hsa-miR-195 | YWHAQ, TUBA1A, SNCG
VAMP8, AP2A1, STXBP3 |
|
hsa-miR-30c | UBE2I, AP2A1 |
|
hsa-miR-221 | ARF4 |
|
hsa-miR-29a | DNAJB11, ARF5,
COL4A1 HMGN3, TUBB2A XPNPEP1 |
|
hsa-miR-30b | UBE2I, AP2A1 |
|
hsa-miR-29b | HMGN3, DNAJB11,
TUBB2A ARF5, COL1A2 |
|
hsa-miR-92b | RRBP1,
PPP1R12C |
|
hsa-miR-182 | ARF4 |
GO and KEGG pathway analysis
With the aim of elucidating the specific function of
miRNAs significant to the embryonic development of DS, the present
study annotated the predicated targets with GO schemes using the
DAVID gene annotation tool. The genes of proteins potentially
regulated by differentially expressed miRNAs produced a total of 37
GO terms in DS (Table IV),
including 11 in biological process, 13 in cellular component and 13
in molecular function. By examining the GO ‘biological process’
classifications, the significant GO terms (P<0.01) were genes
involved in GO:0006519 cellular amino acid and derivative metabolic
process (24), GO:0006810
transport (85) and GO:0016043 cellular component organization (84).
The significant cellular component GO terms were genes involved in
GO:0005829 cytosol (71), GO:0005739 mitochondrion (46), GO:0005768
endosome (15) and GO:0005794
Golgi apparatus (26). Molecular
function ontology showed GO:0005515 protein binding (137),
GO:0005198 structural molecule activity (23) and GO:0019825 oxygen binding
(4). The GO terms indicated that
GRB2, TMSB10 and RUVBL2, the hsa-miR-329 and
hsa-miR-27b, hsa-miR-27a targets, and the differentially expressed
proteins were connected with each other either directly or
indirectly. There was a direct association between GRB2 and
MAPK1, PTK2 and PTPN11. There was also a
direct association between TMSB10, RUVBL2 and
ACTA2. These results suggested that a set of abundant and
significantly differentially expressed miRNAs may promote the
progression of cognitive impairment in patients with DS by
regulating genes in the pathway of nervous system development.
| Table IV.Differentially expressed proteins
annotation terms of the GO molecular function, cellular component
and biological process categories in Down syndrome. |
Table IV.
Differentially expressed proteins
annotation terms of the GO molecular function, cellular component
and biological process categories in Down syndrome.
| Term | P-value | Upregulated
(downregulated) genes (n) | Significantly
upregulated genes | Significantly
downregulated genes |
|---|
| Biological
process |
|
|
|
|
|
Cellular amino acid and
derivative metabolic process |
2.08E-06a | 11 (13) |
|
|
|
Transport |
3.20E-06a | 49 (36) | MAPK1, GRB2 |
|
|
Cellular component
organization |
0.001292a | 46 (38) | TMSB10, RUVBL2,
MAPK1, GRB2 | PTPN11 |
|
Translation | 0.069213 | 6 (6) | MAPK1 |
|
| Protein
modification process | 0.216467 | 25 (12) | RUVBL2, MAPK1 | PTPN11 |
|
Multicellular organismal
development | 0.288361 | 33 (32) | MAPK1, GRB2 | PTPN11 |
|
Carbohydrate metabolic
process | 0.415425 | 9 (3) |
|
|
| Cell
communication | 0.436129 | 20 (19) | MAPK1, GRB2 | PTPN11 |
| Cell
cycle | 0.537926 | 15 (6) | MAPK1 |
|
| Lipid
metabolic process | 0.931277 | 7 (5) |
|
|
|
Nucleobase, nucleoside,
nucleotide and nucleic acid metabolic process | 0.946888 | 38 (30) | RUVBL2, MAPK1 |
|
| Cellular
component |
|
|
|
|
|
Cytosol |
7.25E-11a | 45 (26) | MAPK1, GRB2 | PTPN11 |
|
Mitochondrion |
5.85E-07a | 20 (26) | MAPK1 |
|
|
Endosome |
0.006439a | 6 (9) | GRB2 |
|
| Golgi
apparatus |
0.009079a | 10 (16) | GRB2 |
|
|
Endoplasmic reticulum | 0.012008 | 13 (14) |
|
|
|
Extracellular region | 0.013983 | 28 (18) |
|
|
|
Cytoskeleton | 0.024579 | 18 (18) | TMSB10, MAPK1 |
|
|
Lysosome | 0.026232 | 4 (5) |
|
|
|
Vacuole | 0.031176 | 5 (5) |
|
|
|
Peroxisome | 0.493033 | 1 (1) |
|
|
|
Ribosome | 0.628763 | 2 (1) |
|
|
| Plasma
membrane | 0.844492 | 27 (31) |
|
|
|
Nucleus | 0.963673 | 41 (33) | RUVBL2, MAPK1,
GRB2 |
|
| Molecular
function |
|
|
|
|
| Protein
binding |
2.61E-06a | 73 (64) | TMSB10, RUVBL2,
PTPN11 MAPK1, GRB2 |
|
Structural molecule
activity |
0.000156a | 11 (12) |
|
|
| Oxygen
binding |
0.00194a | 3 (1) |
|
|
|
Catalytic activity | 0.070336 | 47 (49) | RUVBL2, MAPK1 | PTPN11 |
|
Nucleotide binding | 0.09617 | 28 (18) | RUVBL2, MAPK1 |
|
|
Carbohydrate binding | 0.099071 | 7 (3) |
|
|
| Lipid
binding | 0.126594 | 10 (1) |
|
|
| Enzyme
regulator activity | 0.163896 | 13 (6) |
|
|
|
Transporter activity | 0.54845 | 12 (6) |
|
|
| Motor
activity | 0.587484 | 1 (1) |
|
|
| Signal
transducer activity | 0.900132 | 14 (13) | MAPK1, GRB2 |
|
|
Transcription regulator
activity | 0.939697 | 2 (2) |
|
| Nucleic acid
binding | 0.990735 | 18 (20) | RUVBL2, MAPK1 |
|
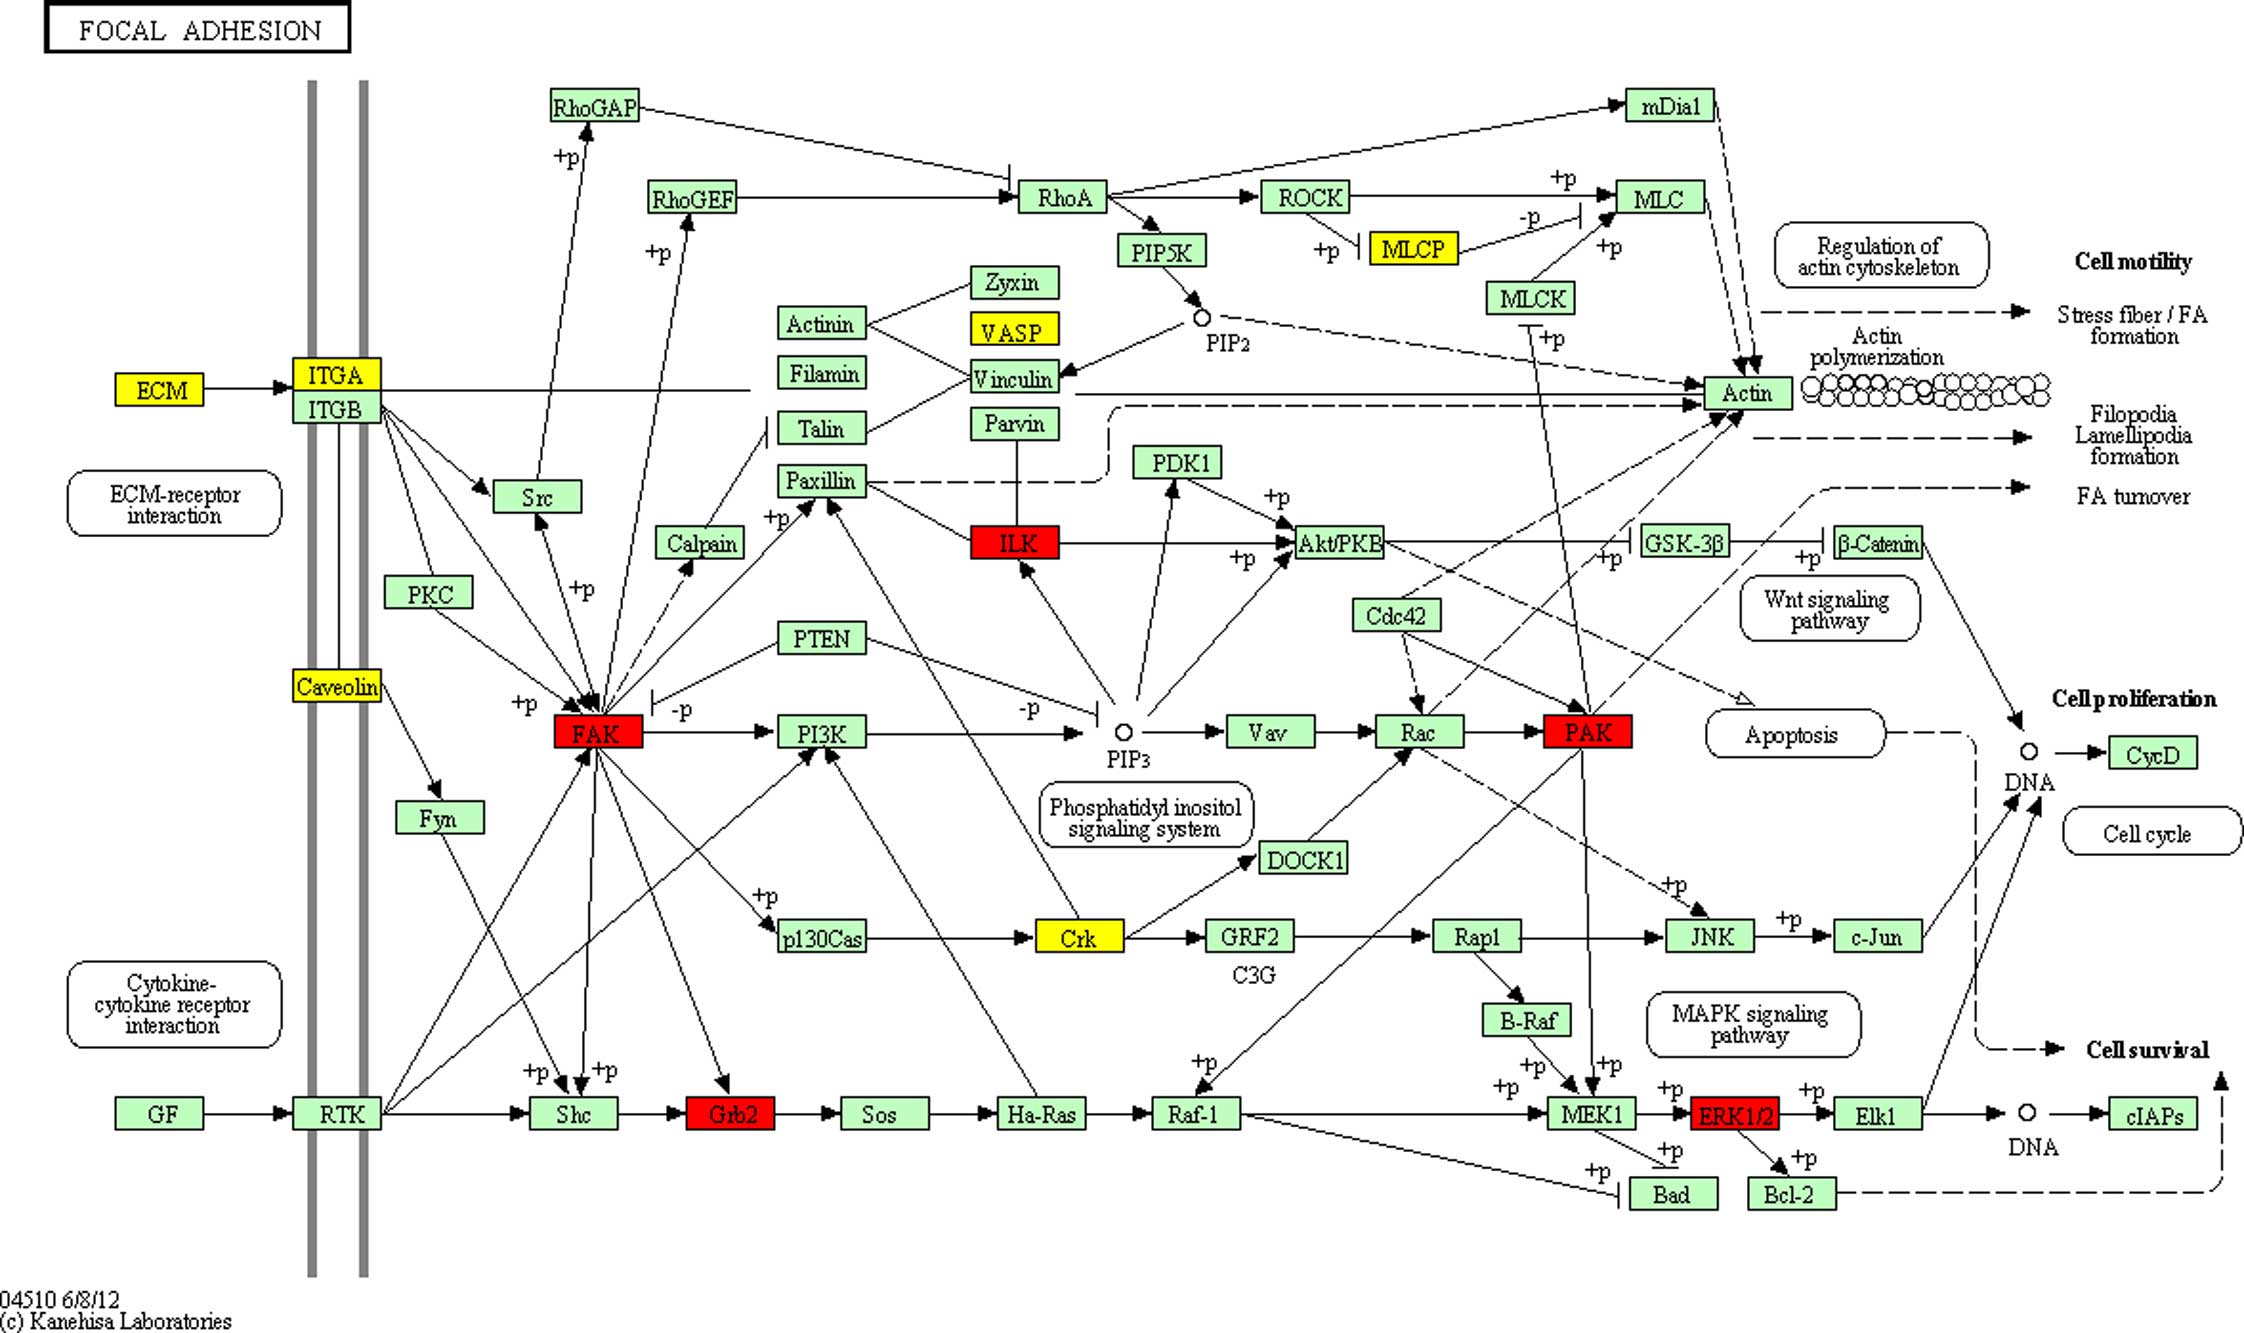
In addition, the present study obtained 28 KEGG
pathways of the differentially expressed proteins in DS (Table V), including ‘Focal adhesion’
(Fig. 3), which was significantly
enriched (P<0.05). The potential network of ‘Focal adhesion’
indicated that GRB2, hsa-miR-329 targets and the
differentially expressed proteins were connected with each other,
either directly or indirectly; and there was a direct association
of co-citation between GRB2 and MAPK1 involved in the
MAPK signaling pathway. This suggested that the
significantly differentially expressed proteins may promote the
progression of cognitive impairment in patients with DS.
| Table V.Kyoto Encyclopedia of Genes and
Genomes pathways of the differentially expressed proteins in Down
syndrome. |
Table V.
Kyoto Encyclopedia of Genes and
Genomes pathways of the differentially expressed proteins in Down
syndrome.
| Pathway |
P-valuea | Upregulated
(downregulated) gene number | Significantly
upregulated genes |
|---|
| Complement and
coagulation cascades | 1.43E-09 | 14 (2) | PLG |
| Focal adhesion | 0.001385 | 7
(10) | PTK2, MAPK1, FN1,
GRB2 |
| Chagas disease
(American trypanosomiasis) | 0.003458 | 6
(4) | MAPK1 |
| Pertussis | 0.010577 | 7
(0) | MAPK1 |
| Pyruvate
metabolism | 0.025336 | 2
(2) |
|
| Proteasome | 1.06E-06 | 6
(4) |
|
| Oxidative
phosphorylation | 0.044748 | 5
(4) |
|
| Fc gamma R-mediated
phagocytosis | 0.005818 | 2
(7) | MAPK1 |
| Amoebiasis | 0.033113 | 4
(4) | PTK2, FN1 |
|
Glycolysis/gluconeogenesis | 0.016705 | 4
(2) |
|
| Thyroid cancer | 0.029584 | 1
(2) | MAPK1 |
| Pathogenic
Escherichia coli infection | 0.006884 | 3 (3) |
|
| Glyoxylate and
dicarboxylate metabolism | 0.035541 | 1
(1) |
|
| Staphylococcus
aureus infection | 2.46E-06 | 10 (1) | PLG |
| Systemic lupus
erythematosus | 0.026282 | 6
(4) |
|
| Prion diseases | 0.002715 | 5
(0) | MAPK1 |
| Folate
biosynthesis | 0.014487 | 0
(2) |
|
| Ribosome | 0.032953 | 3
(4) |
|
| Alanine, aspartate
and glutamate metabolism | 0.040724 | 2
(1) |
|
| ECM-receptor
interaction | 0.000658 | 2
(8) | FN1 |
| Cell adhesion
molecules | 0.04671 | 3
(6) |
|
| Shigellosis | 0.01202 | 1
(5) | MAPK1 |
| Amino sugar and
nucleotide sugar metabolism | 0.000664 | 3
(4) |
|
| Citrate cycle (TCA
cycle) | 0.00118 | 4
(1) |
|
| RNA transport | 0.000224 | 6
(10) |
|
| Galactose
metabolism | 0.029584 | 2
(1) |
|
| Bacterial invasion
of epithelial cells | 0.000115 | 3
(7) | PTK2, FN1 |
| African
trypanosomiasis | 0.00363 | 5
(0) |
|
Discussion
The miRNA-guided regulation of gene expression may
involve hundreds of miRNAs and their targets in animals. Genetic
studies have successfully identified termed genetic switches of
certain miRNA activities, which have intrinsic phenotypic
consequences (18). miRNAs are
crucial in post-transcription regulation, and the extra hsa21 in DS
leads to the disordered expression of genes. The present study
aimed to identify the protein and miRNA profiles, and reveal
potential miRNA-targets in fetal DS using a combinatorial and novel
approach involving iTRAQ quantitative proteomics, deep sequencing
and bioinformatic analysis. A total of 58 known miRNAs were
detected to have significantly different expression, which may be
involved in the variable phenotypes of DS. Their predicted targets
were found in the list of the differentially expressed proteins
using iTRAQ analysis. This may indicate a general connection
between miRNA regulation of their coding genes and functional
complexity of proteins. The present study also integrated miRNA and
protein datasets and identified the three most differentially
expressed miRNAs, seven differentially expressed proteins and one
KEGG pathway in the DS fetus group. Functional analysis of miRNAs
in DS is required.
miRNAs are involved in gene regulation, and have
been recognized as predictive tools and important intervention
targets for several diseases due to the convenience and stability
of miRNA detection (19). In the
present study, the challenge was to map miRNAs to specific gene
targets and the molecular networks they regulate. Studies have
provided insights into miRNA-mediated gene regulation in Ts65Dn
mice, and the potential contribution to impaired hippocampal
synaptic plasticity and neurogenesis, and the hemopoietic
abnormalities observed in DS (20,21).
The present study found evidence for the functional importance of
several previously unknown miRNAs in DS. Specific miRNA expression
profiles may point to the particular role of the miRNA in DS.
miR-329 can inhibit cell proliferation in human glioma cells
through regulating E2F1 (22). miRNA target genes can regulate cell
development and differentiation, cell cycle, and apoptosis and
miRNAs, having an important regulatory role in cell biology
(23). miR-27b and miR-27a have
been found to negatively regulate adipocyte differentiation through
the post-transctiptional regulation of the peroxisome
proliferator-activated receptor γ (24). These findings suggest that miRNAs
with significantly differential levels of expression are key in
cell differentiation in DS. The focus of the present study was not
centred on comparing miRNA between normal and DS samples.
Therefore, more comprehensive clinical investigations are required
to characterize the differential expression of the miRNA identified
in DS.
As iTRAQ has previously been suggested to be
suitable for identifying novel plasma biomarkers (25), this method has been used to detect
for potential quantitative changes in the plasma proteome of
fetuses with DS, compared with normal fetuses. These proteins are
found in the sera of patients with Alzheimer's disease, which has a
similar pathology to DS (26). In
addition to the miRNA profile, the present study described changes
of the protein expression profile using iTRAQ. As a result, several
proteomic changes in DS were revealed. A number of genes were
identified in the analyses, and a comprehensive analysis of protein
complexes, which may be coordinately regulated by miRNAs was
performed. Gene network methods provide novel insights for
elucidating the complexity of diseases, including DS. Hub nodes
have been found to be key in several networks. Hub genes with high
levels of connection are expected to be important in biology
(27). In the present study,
GRB2, TMSB10, RUVBL2, MAPK1,
PTPN11, PTK2 and ACTA2 were identified as hub
genes. These may be important in biological process, cellular
component and molecular function in DS, and the proteins identified
in DS each require in depth examination in order to understand
their functional relevance.
Inhibition of the function of GRB2 hinders
the proliferation and transformation of various cell types and
impairs developmental processes in various organisms. Thus, it is
not unexpected that a targeted gene disruption of GRB2 is
lethal at an early embryonic stage. Nonchimeric
polytransgenic 152F7 mice, which have four human chromosome 21
genes within the DS critical region, present with learning and
memory impairment. Decreased levels of GRB2 in the 152F7
mice may contribute to impaired cytoskeletak functions in the
hippocampus (28). RUVBL2
is important in DNA damage repair, transcriptional regulation and
chromatin remodeling (29).
PTK2 is a focal adhesion-associated protein kinase involved
in spreading processes and cellular adhesion. Noonan syndrome is a
fairly common autosomal, dominantly-inherited disorder. It is the
most common syndromal cause of congenital heart disease following
DS. In the case of Noonan syndrome, genetic diseases associated
with PTPN11, mutations are broadly distributed in the coding
region of the gene, however, all appear to lead to unregulated, or
hyperactivated mutant forms of the protein (30). Impaired signaling in DS involving
different signaling systems has been suggested. In addition, the
availability of fetal brain and proteome technologies, identifying
individual brain proteins, including MAPK1, led to the
present study investigating individual signaling factors in the
brain (31). The functional
analysis of the miRNA-regulated protein complexes showed a clear
bias towards signal transduction, transcriptional regulation,
chromatin regulation and cell cycle. The method used in the present
study provided improved candidate miRNA target lists, as
demonstrated by a benchmark against large-scale, quantitative
proteomics data.
The present study identified more than one potential
miRNA-target pair from the predicted targets. Functional annotation
indicated that they were involved in clusters of meaningful and
significantly relevant biological processes. Using the target
analysis method enabled identification of the miRNA targets
affected at the protein level. In order to elucidate the functions
of the targets of miRNAs, KEGG pathway and GO term annotation were
used to their target gene pool. KEGG annotation showed a
significant change in the focal adhesions pathway in the DS group,
compared with the normal group. Further investigation of the
miRNA-gene network of the pathway showed that hsa-miR-329 may be
the key regulators of the focal adhesion pathway. Focal adhesion
showed a high level of enrichment and representation in the present
study. This pathway includes several proteins, including
MAPK. MAPK pathways can regulate cellular functions,
including differentiation, proliferation, apoptosis and migration
(32). Therefore, although the
exact mechanism remains to be fully elucidated and requires further
investigation, miRNAs may be involved in DS by regulating cell
proliferation, differentiation and the cell signaling network.
Their regulatory roles in the focal adhesions pathway may be
involved in the pathogenesis of the DS.
In the present study, the miRNA target prediction
and large-scale protein-protein interaction data used was found to
be useful for improving current biological knowledge. Taken
together, the three miRNAs (hsa-miR-329, hsa-miR-27b and
hsa-miR-27a) and seven proteins (GRB2, TMSB10,
RUVBL2, MAPK1, PTPN11, ACTA2 and
PTK2) with the highest level of differential expression in
the DS fetuses were identified. The results also identified several
directions for future investigations. Each possible miRNA-protein
pair, which was identified in the present study, is a candidate for
further extensive investigation to definitively confirm the
presence of specific miRNA-protein interactions, thus providing a
more detailed understanding of the pathogenesis of DS. miRNAs and
their target genes maintain a balance of gene expression regulatory
networks; if this balance is disrupted, it leads to disease.
Therefore, changes in specific miRNA and protein levels may affect
gene expression in DS. An understanding of the gene regulatory
networks controlled by miRNA in conjunction with protein in DS is
required. The present study indicated that miRNAs are probable
factors and potential biomarkers involved in the pathogenesis of
DS. Further investigations are required to understand the roles of
the identified miRNAs in the pathogenesis of DS. Integrating miRNA
and protein data sets is a promising strategy for understanding the
pathogenesis of DS. The findings of the present study provided
insight into the potential contribution of anomalous regulated
miRNAs to the abnormalities in DS. This may assist in structuring
antenatal diagnostic biomarkers of DS, and identify novel
therapeutic targets for the treatment of individuals with DS. The
investigation of miRNAs may also lead to the identification of
novel methods to prevent and treat other diseases.
Acknowledgements
This study was financially supported by the Shenzhen
Municipal Science and Technology Innovation Council, People's
Republic of China (grant no. 201202121 and key project
CXZZ20130321090846345) and the Guangdong Provincial S&T Program
(grant no. 2012B032000008).
Glossary
Abbreviations
Abbreviations:
|
DS
|
Down syndrome
|
|
miRNA
|
microRNA
|
|
PAGE
|
polyacrylamide gel electrophoresis
|
|
RT-qPCR
|
reverse transcription-quantitative
polymerase chain reaction
|
|
GO
|
gene ontology
|
|
ITRAQ
|
isobaric tagging for relative and
absolute protein quantification
|
References
|
1
|
Xu Y, Li W, Liu X, Ma H, Tu Z and Dai Y:
Analysis of microRNA expression profile by small RNA sequencing in
down syndrome fetuses. Int J Mol Med. 32:1115–1125. 2013.PubMed/NCBI
|
|
2
|
Pellegrini FP, Marinoni M, Frangione V,
Tedeschi A, Gandini V, Ciglia F, Mortara L, Accolla RS and Nespoli
L: Down syndrome, autoimmunity and T regulatory cells. Clin Exp
Immunol. 169:238–243. 2012. View Article : Google Scholar : PubMed/NCBI
|
|
3
|
Jin S, Lee YK, Lim YC, Zheng Z, Lin XM, Ng
DP, Holbrook JD, Law HY, Kwek KY, Yeo GS and Ding C: Global DNA
hypermethylation in down syndrome placenta. PLoS Genet.
9:e10035152013. View Article : Google Scholar : PubMed/NCBI
|
|
4
|
Costa V, Angelini C, D'Apice L, Mutarelli
M, Casamassimi A, Sommese L, Gallo MA, Aprile M, Esposito R, Leone
L, et al: Massive-scale RNA-Seq analysis of non ribosomal
transcriptome in human trisomy 21. PLoS One. 6:e184932011.
View Article : Google Scholar : PubMed/NCBI
|
|
5
|
Wang J, Haubrock M, Cao KM, Hua X, Zhang
CY, Wingender E and Li J: Regulatory coordination of clustered
microRNAs based on microRNA-transcription factor regulatory
network. BMC Syst Biol. 5:1992011. View Article : Google Scholar : PubMed/NCBI
|
|
6
|
Hwang HW and Mendell JT: MicroRNAs in cell
proliferation, cell death, and tumorigenesis. Br J Cancer.
96:(Suppl). R40–R44. 2007.PubMed/NCBI
|
|
7
|
Liao JM, Zhou X, Zhang Y and Lu H:
MiR-1246: A new link of the p53 family with cancer and down
syndrome. Cell Cycle. 11:2624–2630. 2012. View Article : Google Scholar : PubMed/NCBI
|
|
8
|
Elton TS, Sansom SE and Martin MM:
Trisomy-21 gene dosage over-expression of miRNAs results in the
haploinsuffciency of specifc target proteins. RNA Biol. 7:540–547.
2010. View Article : Google Scholar : PubMed/NCBI
|
|
9
|
Malinge S, Izraeli S and Crispino JD:
Insights into the manifestations, outcomes, and mechanisms of
leukemogenesis in down syndrome. Blood. 113:2619–2628. 2009.
View Article : Google Scholar : PubMed/NCBI
|
|
10
|
Ozen M, Creighton CJ, Ozdemir M and
Ittmann M: Widespread deregulation of microRNA expression in human
prostate cancer. Oncogene. 27:1788–1793. 2008. View Article : Google Scholar : PubMed/NCBI
|
|
11
|
Elkan-Miller T, Ulitsky I, Hertzano R,
Rudnicki A, Dror AA, Lenz DR, Elkon R, Irmler M, Beckers J, Shamir
R and Avraham KB: Integration of transcriptomics, proteomics, and
MicroRNA analyses reveals novel MicroRNA regulation of targets in
the mammalian inner ear. PLoS One. 6:e181952011. View Article : Google Scholar : PubMed/NCBI
|
|
12
|
Vasilatou D, Papageorgiou S, Pappa V,
Papageorgiou E and Dervenoulas J: The role of microRNAs in normal
and malignant hematopoiesis. Eur J Haematol. 84:1–16. 2010.
View Article : Google Scholar : PubMed/NCBI
|
|
13
|
Li R, Yu C, Li Y, Lam TW, Yiu SM,
Kristiansen K and Wang J: SOAP2: An improved ultrafast tool for
short read alignment. Bioinformatics. 25:1966–1967. 2009.
View Article : Google Scholar : PubMed/NCBI
|
|
14
|
Livak KJ and Schmittgen TD: Analysis of
relative gene expression data using real-time quantitative PCR and
the 2 (−Delta Delta C (T)) Method. Methods. 25:402–408. 2001.
View Article : Google Scholar : PubMed/NCBI
|
|
15
|
Wang L, Dai Y, Qi S, Sun B, Wen J, Zhang L
and Tu Z: Comparative proteome analysis of peripheral blood
mononuclear cells in systemic lupus erythematosus with iTRAQ
quantitative proteomics. Rheumatol Int. 32:585–593. 2012.
View Article : Google Scholar : PubMed/NCBI
|
|
16
|
Sui W, Lin H, Peng W, Huang Y, Chen J,
Zhang Y and Dai Y: Molecular dysfunctions in acute rejection after
renal transplantation revealed by integrated analysis of
transcription factor, microRNA and long noncoding RNA. Genomics.
102:310–322. 2013. View Article : Google Scholar : PubMed/NCBI
|
|
17
|
Gao W, Xu J, Liu L, Shen H, Zeng H and Shu
Y: A systematic-analysis of predicted miR-21 targets identifies a
signature for lung cancer. Biomed Pharmacother. 66:21–28. 2012.
View Article : Google Scholar : PubMed/NCBI
|
|
18
|
Flynt AS and Lai EC: Biological principles
of microRNA-mediated regulation: Shared themes amid diversity. Nat
Rev Genet. 9:831–842. 2008. View
Article : Google Scholar : PubMed/NCBI
|
|
19
|
Corsini LR, Bronte G, Terrasi M, Amodeo V,
Fanale D, Fiorentino E, Cicero G, Bazan V and Russo A: The role of
microRNAs in cancer: Diagnostic and prognostic biomarkers and
targets of therapies. Expert Opin Ther Targets. 16:(Suppl 2).
S103–S109. 2012. View Article : Google Scholar : PubMed/NCBI
|
|
20
|
Keck-Wherley J, Grover D, Bhattacharyya S,
Xu X, Holman D, Lombardini ED, Verma R, Biswas R and Galdzicki Z:
Abnormal microRNA expression in Ts65Dn hippocampus and whole blood:
Contributions to down syndrome phenotypes. Dev Neurosci.
33:451–467. 2011. View Article : Google Scholar : PubMed/NCBI
|
|
21
|
Elton TS, Sansom SE and Martin MM:
Trisomy-21 gene dosage overexpression of miRNAs results in the
haploinsufficiency of specific target proteins. RNA Biol.
7:540–547. 2010. View Article : Google Scholar : PubMed/NCBI
|
|
22
|
Xiao B, Tan L, He B, Liu Z and Xu R:
MiRNA-329 targeting E2F1 inhibits cell proliferation in glioma
cells. J Transl Med. 11:1722013. View Article : Google Scholar : PubMed/NCBI
|
|
23
|
Wang Y, Rathinam R, Walch A and Alahari
SK: ST14 (suppression of tumorigenicity 14) gene is a target for
miR-27b, and the inhibitory effect of ST14 on cell growth is
independent of miR-27b regulation. J Biol Chem. 284:23094–23106.
2009. View Article : Google Scholar : PubMed/NCBI
|
|
24
|
Kim SY, Kim AY, Lee HW, Son YH, Lee GY,
Lee JW, Lee YS and Kim JB: miR-27a is a negative regulator of
adipocyte differentiation via suppressing PPARgamma expression.
Biochem Biophys Res Commun. 392:323–328. 2010. View Article : Google Scholar : PubMed/NCBI
|
|
25
|
Sui W, Zhang R, Chen J, He H, Cui Z, Ou M,
Li W, Qi S, Wen J, Lin X and Dai Y: Quantitative proteomic analysis
of Down syndrome in the umbilical cord blood using iTRAQ. Mol Med
Rep. 11:1391–1399. 2015.PubMed/NCBI
|
|
26
|
Kolla V, Jenö P, Moes S, Tercanli S,
Lapaire O, Choolani M and Hahn S: Quantitative proteomics analysis
of maternal plasma in down syndrome pregnancies using isobaric
tagging reagent (iTRAQ). J Biomed Biotechnol. 2010:9520472010.
View Article : Google Scholar : PubMed/NCBI
|
|
27
|
Langfelder P, Mischel PS and Horvath S:
When is hub gene selection better than standard meta-analysis. PLoS
One. 8:e615052013. View Article : Google Scholar : PubMed/NCBI
|
|
28
|
Shin JH, Guedj F, Delabar JM and Lubec G:
Dysregulation of growth factor receptor-bound protein 2 and fascin
in hippocampus of mice polytransgenic for chromosome 21 structures.
Hippocampus. 17:1180–1192. 2007. View Article : Google Scholar : PubMed/NCBI
|
|
29
|
Gorynia S, Bandeiras TM, Pinho FG, McVey
CE, Vonrhein C, Round A, Svergun DI, Donner P, Matias PM and
Carrondo MA: Structural and functional insights into a dodecameric
molecular machine-the RuvBL1/RuvBL2 complex. J Struct Biol.
176:279–291. 2011. View Article : Google Scholar : PubMed/NCBI
|
|
30
|
Essawi ML, Ismail MF, Afifi HH, Kobesiy
MM, El Kotoury A and Barakat MM: Mutational analysis of the PTPN11
gene in Egyptian patients with Noonan syndrome. J Formos Med Assoc.
112:707–712. 2013. View Article : Google Scholar : PubMed/NCBI
|
|
31
|
Peyrl A, Weitzdoerfer R, Gulesserian T,
Fountoulakis M and Lubec G: Aberrant expression of
signaling-related proteins 14-3-3 gamma and RACK1 in fetal down
syndrome brain (trisomy 21). Electrophoresis. 23:152–157. 2002.
View Article : Google Scholar : PubMed/NCBI
|
|
32
|
Slattery ML, Lundgreen A and Wolff RK:
Dietary influence on MAPK-signaling pathways and risk of colon and
rectal cancer. Nutr Cancer. 65:729–738. 2013. View Article : Google Scholar : PubMed/NCBI
|