Introduction
Myeloid-derived suppressor cells (MDSCs) are a group
of heterogeneous cells originating from myeloid cells and they are
at different stages of differentiation. MDSCs expand during
infection and inflammation, and particularly during cancer. MDSCs
have a strong ability to suppress anti-tumor immunity, such as
T-cell responses. The proportion of MDSCs was demonstrated to be
20–40% of nucleated splenocytes in several mouse tumor models,
whereas the proportion of MDSCs in spleens of tumor-free mice was
2–4% (1,2). In a mouse model, MDSCs are typically
identified through expression of lymphocyte antigen 6 complex,
locus G (Ly6G) and CD11b, which are myeloid lineage differentiation
markers (1–3). It is now accepted that MDSCs can be
divided into two major subsets; polymorphonuclear and mononuclear
morphology, which are distinguished by a combination of specific
markers. Polymorphonuclear or granulocytic MDSCs (G-MDSCs) are
positive for CD11b and Ly6G, and exhibit low expression of Ly6C,
whereas mononuclear or monocytic MDSCs (M-MDSCs) are positive for
CD11b, negative for Ly6G and exhibit high expression of Ly6C
(1–3). G-MDSCs are the largest subset of
MDSCs in tumor-bearing mice, which account for >80% of all MDSCs
(1–3). Previous reports have suggested that
G-MDSCs and M-MDSCs subsets may suppress antigen-specific immune
responses through different signaling pathways and mechanisms.
M-MDSCs were demonstrated to suppress antigen-specific responses
via nitric oxide, which was dependent on interferon (IFN)-γ
(4). However, G-MDSCs produced
higher levels of reactive oxygen species (ROS), and their
inhibitory function was completely reversed by ROS scavengers
(3,4). The production and functional
regulation mechanisms of G-MDSCs and M-MDSCs may also be different.
For example, interleukin-18 specifically enhanced the
differentiation and function of M-MDSCs, but not G-MDSCs (5). IFN-γ was reported to control the
survival and function of tumor-induced G-MDSCs by suppressing the
mRNA expression levels of the anti-apoptotic molecule B cell
leukemia/lymphoma 2 related protein A1a (6).
MicroRNAs (miRNAs) are small, single-stranded
non-coding RNAs. Many are highly conserved (7). Gene expression regulation by miRNAs
affects various biological processes, including cell
differentiation, cell proliferation, cell apoptosis, signal
transduction, immune responses and hematopoiesis. MiRNAs
predominantly decrease the expression of their target genes through
inducing degradation of mRNA or inhibiting mRNA translation,
however there is also evidence supporting that miRNAs may increase
the expression of certain target genes (8). MDSCs that originate from
hematopoietic stem cells are highly accumulated in the spleen,
peripheral blood, lymphoid organs and tumor tissue in tumor-bearing
mice and patients with cancer. MDSCs are essentially
undifferentiated hematopoietic cells and are also immune-regulating
cells (9). Therefore, the
production and function of MDSCs may be regulated by miRNAs. Recent
studies have authenticated this assumption. For example, miRNA
(miR)-17 and miR-20a attenuate the suppressive potential of MDSCs
through modulating signal transducer and activator of transcription
(STAT) 3 expression (10). MiR-494
is required for the accumulation and function of tumor-expanded
MDSCs by targeting the mRNA of phosphatase and tensin homolog
(PTEN) (11). MiR-155 and miR-21
promote the expansion of functional MDSCs (12). Twist basic helix-loop-helix
transcription factor and miR-34a participate in the generation of
tumor-induced MDSCs (13). MiR-34a
expands MDSCs via apoptosis inhibition (14). Determining the miRNA profiles of
MDSCs may provide novel insight into the molecular mechanisms and
illuminate the features of tumor-induced MDSCs, which will
facilitate the design and development of novel anti-cancer drugs.
MiRNA microarrays have been performed by Liu et al (11) and Li et al (12) to analyze the miRNA profiles of
tumor-induced MDSCs, however, the miRNA microarrays were conducted
using the whole MDSC population, not MDSCs subtypes (11,12).
As the G-MDSCs and M-MDSCs have different mechanisms of production
and function, the miRNA profiles of these two subsets may also be
different.
The current study aimed to identify the miRNA
profiles of G-MDSCs induced by malignant tumor using a GeneChip
miRNA 3.0 array, and to predict the function of the miRNAs in
tumor-induced G-MDSCs using bioinformatics analysis. C57BL/6 mice
bearing Lewis lung carcinoma (LLC) is a widely used model for
preclinical studies of MDSCs. To address the scientific objectives
of the present study, G-MDSCs from spleens of mice bearing LLC were
used as the experimental group and G-MDSCs from spleens of
tumor-free mice were used as the control group.
Materials and methods
Cell line
LLC cell line was purchased from the Cell Resource
Center of Shanghai Institutes for Biological Sciences, Chinese
Academy of Sciences (Shanghai, China). LLC tumor cells were
maintained in Dulbecco's modified Eagle's medium (Hyclone; GE
Healthcare Life Sciences, Logan, UT, USA) supplemented with 10%
fetal bovine serum (Hyclone; GE Healthcare Life Sciences) and 1%
penicillin-streptomycin (Gibco; Thermo Fisher Scientific, Inc.,
Waltham, MA, USA). Cells were maintained at 37°C in a humidified
atmosphere containing 95% air and 5% CO2.
Animal models
A total of 32 female C57BL/6 mice at 4–6 weeks of
age were provided by the Department of Laboratory Animal Science of
Fudan University (Shanghai, China) and were housed under specific
pathogen-free conditions. Groups of three to five mice were housed
in polypropylene cages with sterilized bedding under controlled
conditions: Temperature, 24±1°C; relative humidity, 55%. The mice
had ad libitum access to a standard diet and sterilized
water; water bottles were replaced daily. All animal experiments
were performed in accordance with approval protocol for animal use
and handling. Mice (n=12) were subcutaneously injected in the flank
with 1×10⁶ LLC cells and were sacrificed for further analysis when
the tumor reached 15–20 mm diameter within 3–4 weeks after
injection. Tumor-free mice (n=20) were considered the control
group, and were sacrificed at 7–9 weeks old. Prior to sacrifice,
mice were anesthetized by 2% sodium pentobarbital (Sigma-Aldrich;
Merck Millipore, Darmstadt, Germany); the mice were then sacrificed
by cervical dislocation and spleens were collected. The study was
approved by the Animal Welfare and Ethics Committee of the
Department of Laboratory Animal Science, Fudan University (permit
no. 20150295A010).
G-MDSC purification
Mice spleens were dissociated mechanically and
individual spleen cells were obtained through a 75-µm cellular
sieve, and then centrifuged at 250 × g for 5 min at 4°C.
Single-cell suspensions were passed through a 30-µm nylon mesh
(pre-separation filters; cat. no. 130-041-407; Miltenyi Biotec
GmbH, Bergisch Gladbach, Germany). Red blood cells were eliminated
using ACK Lysis Buffer (Leagene Biotech Co., Ltd., Beijing, China)
in accordance with the manufacturer's instructions. Cells were
counted and washed with PBS. Single-cell suspensions
(1×10⁶/L per sample) prepared from the spleen were
stained with the following specific fluorophore-conjugated
anti-mouse antibodies in PBS for 15 min in the dark:
CD11b-allophycocyanin (1.25 µg/ml; cat. no. M1/70; eBioscience,
Inc., San Diego, CA, USA), Ly6G-phycoerythrin (18.2 µg/ml; cat. no.
1A8; BD Biosciences, Franklin Lakes, NJ, USA), and Ly6C-PerCP-Cy5.5
(9.5 µg/ml; cat. no. HK1.4; eBioscience, Inc.). The binding
specificity of each antibody was confirmed using its corresponding
isotype. The percentages of MDSCs and MDSC subsets were determined
using a BD FACSCanto™ flow cytometer (BD Biosciences), and G-MDSCs
were purified using a MoFlo flow cytometer (Dakocytomation; Agilent
Technologies, Inc., Santa Clara, CA, USA). For purification of
G-MDSCs, CD11b-positive cells were gated. The G-MDSC subset was
specifically sorted by Ly6G and Ly6C detection. The purity of
G-MDSCs was >90%. Fluorescence data were analyzed using FlowJo
version 5.7.2 software (Tree Star, Inc., Ashland, OR, USA). Each
sample used G-MDSCs from spleens of three mice bearing LLC tumors
as the experimental group or from the spleens of five tumor-free
mice as the control group.
RNA extraction and miRNA array
assay
The isolated G-MDSCs were maintained in TRIzol LS
(Invitrogen; Thermo Fisher Scientific, Inc.). Total RNA was
extracted and purified using the miRNeasy Mini kit (Qiagen GmbH,
Hilden, Germany) and RNase-free DNase l (Qiagen GmbH) according to
the manufacturer's instructions. The concentration of RNA was
measured by an SMA3000 spectrophotometer (Merinton Instrument,
Ltd., Beijing, China). Optical density 260/280 value between 1.9
and 2.1 was considered as good purity. The integrity and quality of
RNA was evaluated by JS-380A Gel Imaging Analysis System (Peiqing
Science And Technology Co., Ltd., Shanghai, China).
Qualified RNA samples were further analyzed using
the GeneChip miRNA 3.0 array (Affymetrix, Inc., Santa Clara, CA,
USA) at GMINIX Information Technology, Ltd. (Shanghai, China). This
array is a single array comprised of 179,217 probes that represent
19,913 mature miRNAs contained in the miRBase V.17 (www.mirbase.org). RNA was labeled with biotin and
hybridized with the array according to the manufacturer's
instructions. Signal scanning was conducted by a GeneChip Scanner
(Affymetrix, Inc.). Analysis of each sample was repeated twice. The
mean was used for comparisons.
Reverse transcription-quantitative
polymerase chain reaction (RT-qPCR) analysis
Total RNA was purified from G-MDSCs of LLC-bearing
and control mice using TRIzol® (Invitrogen; Thermo
Fisher Scientific, Inc.) in accordance with the manufacturer's
protocols. The concentration of RNA was determined by a NanoDrop
2000 spectrophotometer (Thermo Fisher Scientific, Inc., Pittsburgh,
PA, USA). RNA integrity was evaluated using agarose gel
electrophoresis and ethidium bromide staining. cDNA was synthesized
from 1 µg total RNA using miScript II Reverse Transcriptase Mix
(Qiagen GMbH) according to the manufacturer's instructions.
Reactions were performed using a GeneAmp® PCR system
9700 (Applied Biosystems; Thermo Fisher Scientific, Inc.) for 60
min at 37°C, followed by heat inactivation of RT for 5 min at 95°C.
The 20 µl RT reaction mixture was then diluted 5X in nuclease-free
water and maintained at −20°C. RT-qPCR was conducted with SYBR
Green I Master kit (Roche Diagnostics, Basel, Switzerland) in
accordance with the manufacturer's protocol using a Light Cycler
480 II RT-PCR platform (Roche Diagnostics). The 10 µl PCR reaction
mixture consisted of 1 µl cDNA, 5 µl 2X SYBR Green I Master, 0.2 µl
universal reverse primer (Qiagen GmbH), 0.2 µl miRNA-specific
primer and 3.6 µl nuclease-free water. Reactions were incubated at
95°C for 10 min, followed by 40 cycles at 95°C for 10 sec and 60°C
for 30 sec. Each sample was run in triplicate for analysis. At the
end of the PCR, a melting curve analysis was performed to validate
the specific generation of the expected PCR product. 5S small RNA
was used as the endogenous control to normalize the expression of
miRNAs. The miRNAs analyzed by RT-qPCR included: MiR-486, miR-192,
miR-128, miR-125a, miR-149, miR-27a, miR-125b, miR-350 and miR-328.
Primer sequences used for these miRNAs are listed in Table I. The experiments were repeated
three times independently. The comparative 2-∆∆Cq method
was used to calculate the relative expression level of miRNAs
(15).
 | Table I.Primers used for quantitative
polymerase chain reaction. |
Table I.
Primers used for quantitative
polymerase chain reaction.
| miR | Primer sequence
(5′>3′) |
|---|
| 5S |
GGAGACCGCCTGGGAATA |
| mmu-miR-486-5p |
TCCTGTACTGAGCTGCCCCGAG |
| mmu-miR-192-5p |
CTGACCTATGAATTGACAGCC |
| mmu-miR-99b-5p |
CACCCGTAGAACCGACCTTGCG |
| mmu-miR-128-3p |
TCACAGTGAACCGGTCTCTTT |
| mmu-miR-125a-5p |
TCCCTGAGACCCTTTAACCTGTGA |
| mmu-miR-149-5p |
TCTGGCTCCGTGTCTTCACTCCC |
| mmu-miR-27a-5p |
AGGGCTTAGCTGCTTGTGAGCA |
| mmu-miR-125b-5p |
TCCCTGAGACCCTAACTTGTGA |
| mmu-miR-350-3p |
TTCACAAAGCCCATACACTTTC |
| mmu-miR-328-3p |
CTGGCCCTCTCTGCCCTTCCGT |
Target prediction and bioinformatics
analyses
Four online software programs, MirTarget2
(mirdb.org/miRDB), PicTar (pictar.mdc-berlin.de),
miRanda (microrna.sanger.ac.uk), and PITA
(genie.weizmann.ac.il/pubs/mir07/mir07_prediction.html)
were used to search for the mouse target genes of the nine RT-qPCR
validated miRNAs. Probability distribution of random matches was
set at 0.05, which was Poisson P-value. Targets with P<0.05 and
predicted by all of the four algorithms were regarded as predicted
targets. The functional enrichment and pathway analyses of the
predicted target genes were performed using the Gene Ontology (GO;
geneontology.org) and Kyoto Encyclopedia of Genes
and Genomes (KEGG; www.kegg.jp) online databases. Maps
of miRNAs and their target genes were created using Cytoscape
(www.cytoscape.org). This is an open source of
bioinformatics platform for analyzing and visualizing complex
networks (16), which are equipped
with ClueGo and CluePedia plugins (17).
Statistical analysis
Stata/SE 10.1 software (StataCorp LP, College
Station, TX, USA) was used to analyze the data. Data are presented
as the mean ± standard deviation. Statistical analyses were
conducted using a two-tailed Student's t-test. For miRNA
array assay, both >1.3-fold increased or decreased change and
P<0.05 were considered to indicate a statistically significant
difference. For all other tests; P<0.05 was considered to
indicate a statistically significant difference.
Results
Accumulation of G-MDSCs in the spleens
of mice with LLC
Nucleated spleen cells were obtained from mice
bearing LLC and normal mice, and the percentages of CD11b-positive
cells, G-MDSCs and M-MDSCs subsets were detected by flow cytometry
(Fig. 1A and B). The percentage of
CD11b-positive cells was increased in spleens of mice bearing LLC
compared with normal mice (18.58±2.70% vs. 3.08±1.97%; P<0.01;
Fig. 1C); After CD11b positive
cells were gated, both the CD11b+Ly6G+Ly6Clow G-MDSCs and
CD11b+Ly6G-Ly6Chigh M-MDSCs were demonstrated to be increased in
the spleens of mice bearing LLC compared with normal mice. The
percentages of MDSCs, G-MDSCs and M-MDSCs in spleens of mice
bearing LLC were ~6-fold higher that their counterparts from
tumor-free mice (18.58±1.56% vs. 3.08±0.88% for MDSCs; 13.54±1.74%
vs. 2.14±1.44% for G-MDSCs; and 5.04±0.71% vs. 0.94±0.32% for
M-MDSCs; all P<0.01). G-MDSCs account for ~72.9% of all MDSCs.
Furthermore, the volume of spleens from mice bearing LLC was larger
than from tumor-free mice (Fig.
1D).
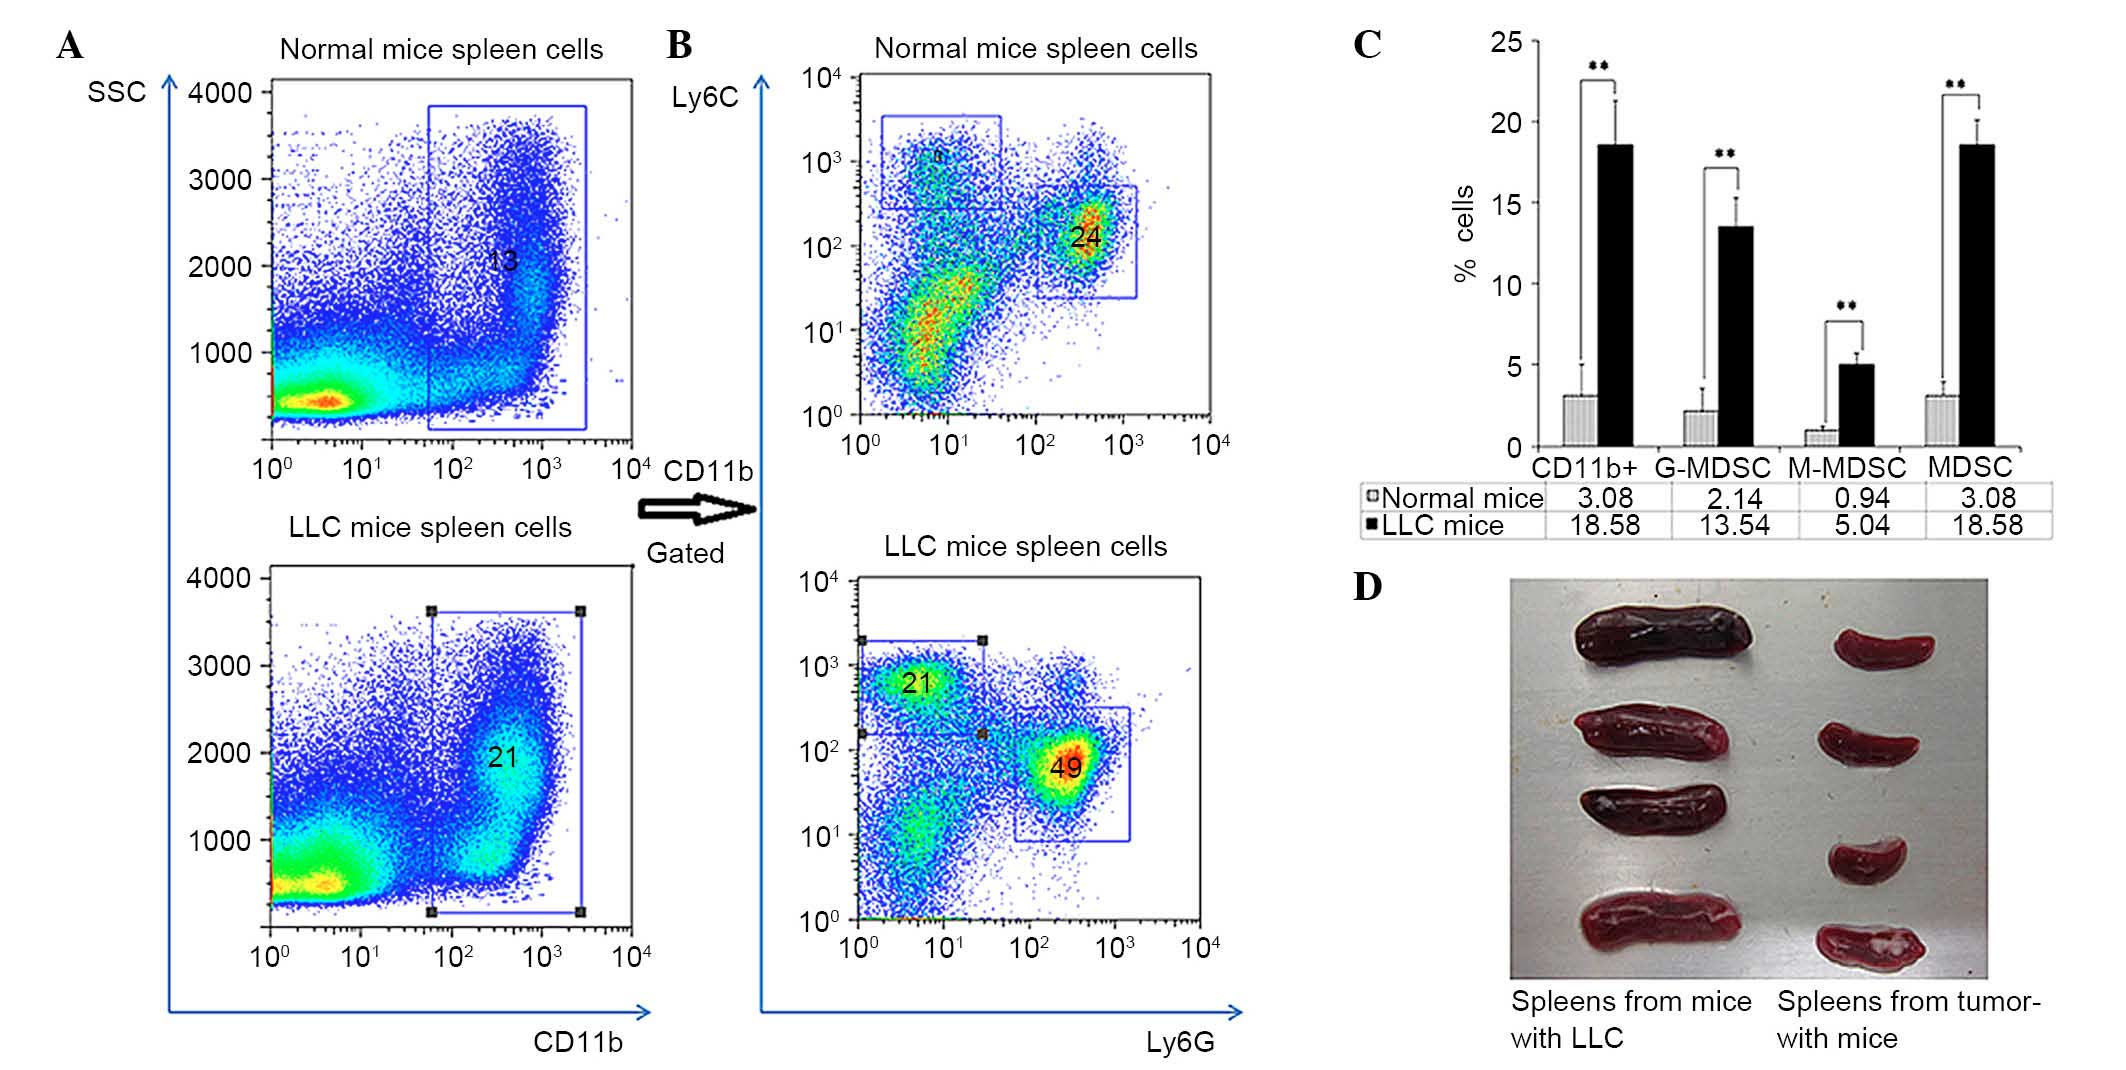 | Figure 1.Accumulation of G-MDSCs in the spleen
of mice with Lewis lung carcinoma. (A) The percentage of CD11b
positive cells increased in spleens of mice bearing LLC compared to
that of normal mice. (B) After CD11b positive cells were gated,
both the G-MDSCs
(CD11b+Ly6G+Ly6Clow) and M-MDSCs
(CD11b+Ly6G−Ly6Chi) were increased
in spleens of mice bearing LLC compared with normal mice. (C) The
percentages of CD11b+ cells, MDSCs, G-MDSCs and M-MDSCs
in spleens of mice bearing LLC were ~6-folds higher of those of
normal mice. Data are presented as the mean ± standard deviation.
**P<0.01. (D) The volume of spleens from mice bearing LLC was
larger than from tumor-free mice. SSC, side scatter; LLC, Lewis
lung carcinoma; Ly6G, lymphocyte antigen 6 complex, locus G; MSDC,
myeloid-derived suppressor cells; G-, granulocytic; M-,
monocytic. |
MiRNA expression profiles of G-MDSCs
from spleens of mice with LLC compared with tumor-free mice
Microarrays were used to evaluate the miRNA
expression profiles of the G-MDSCs from spleen of mice with LLC and
compare them with the profile in tumor-free mice. The miRNA
expression patterns between the two MDSC groups were different. In
total, 43 miRNAs that exhibited an increase or decrease of
>1.3-fold were considered differentially expressed between the
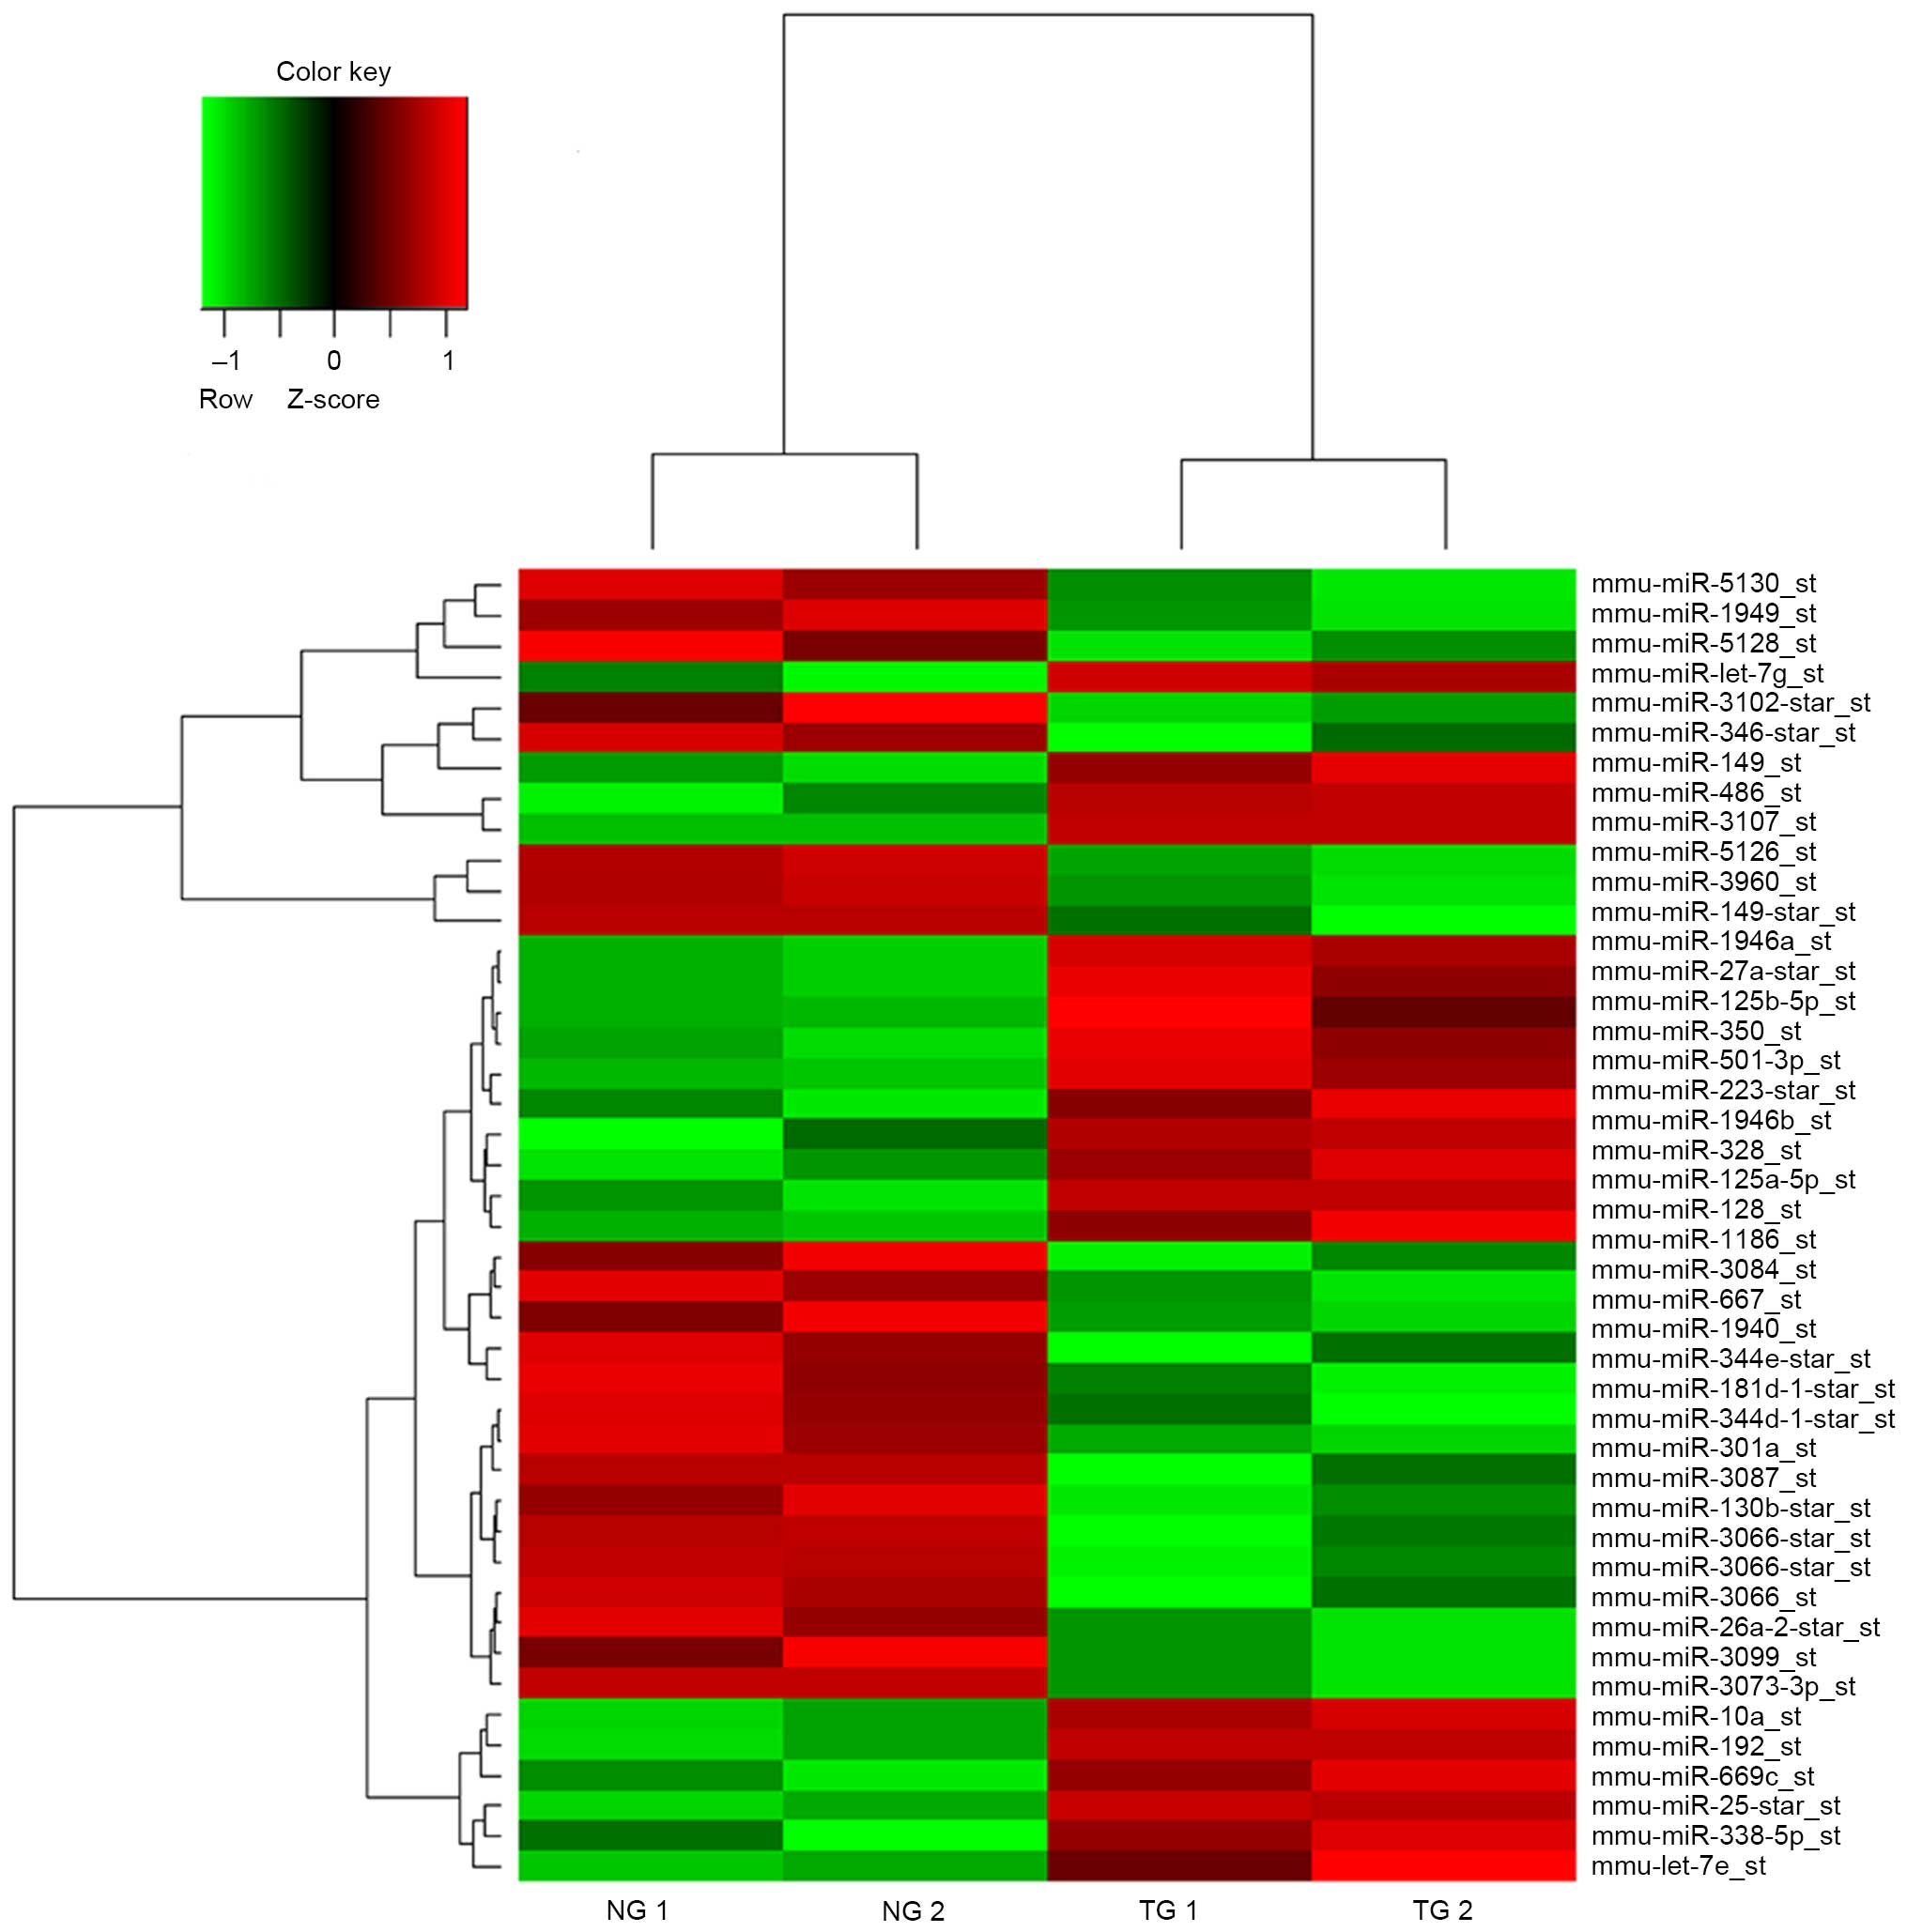
G-MDSCs from mice with LLC and tumor-free mice (Fig. 2). Of these miRNAs, 20 were
upregulated and 23 miRNAs were downregulated in the G-MDSCs from
mice with LLC compared with tumor-free mice.
Validation of results from miRNA array
by RT-qPCR
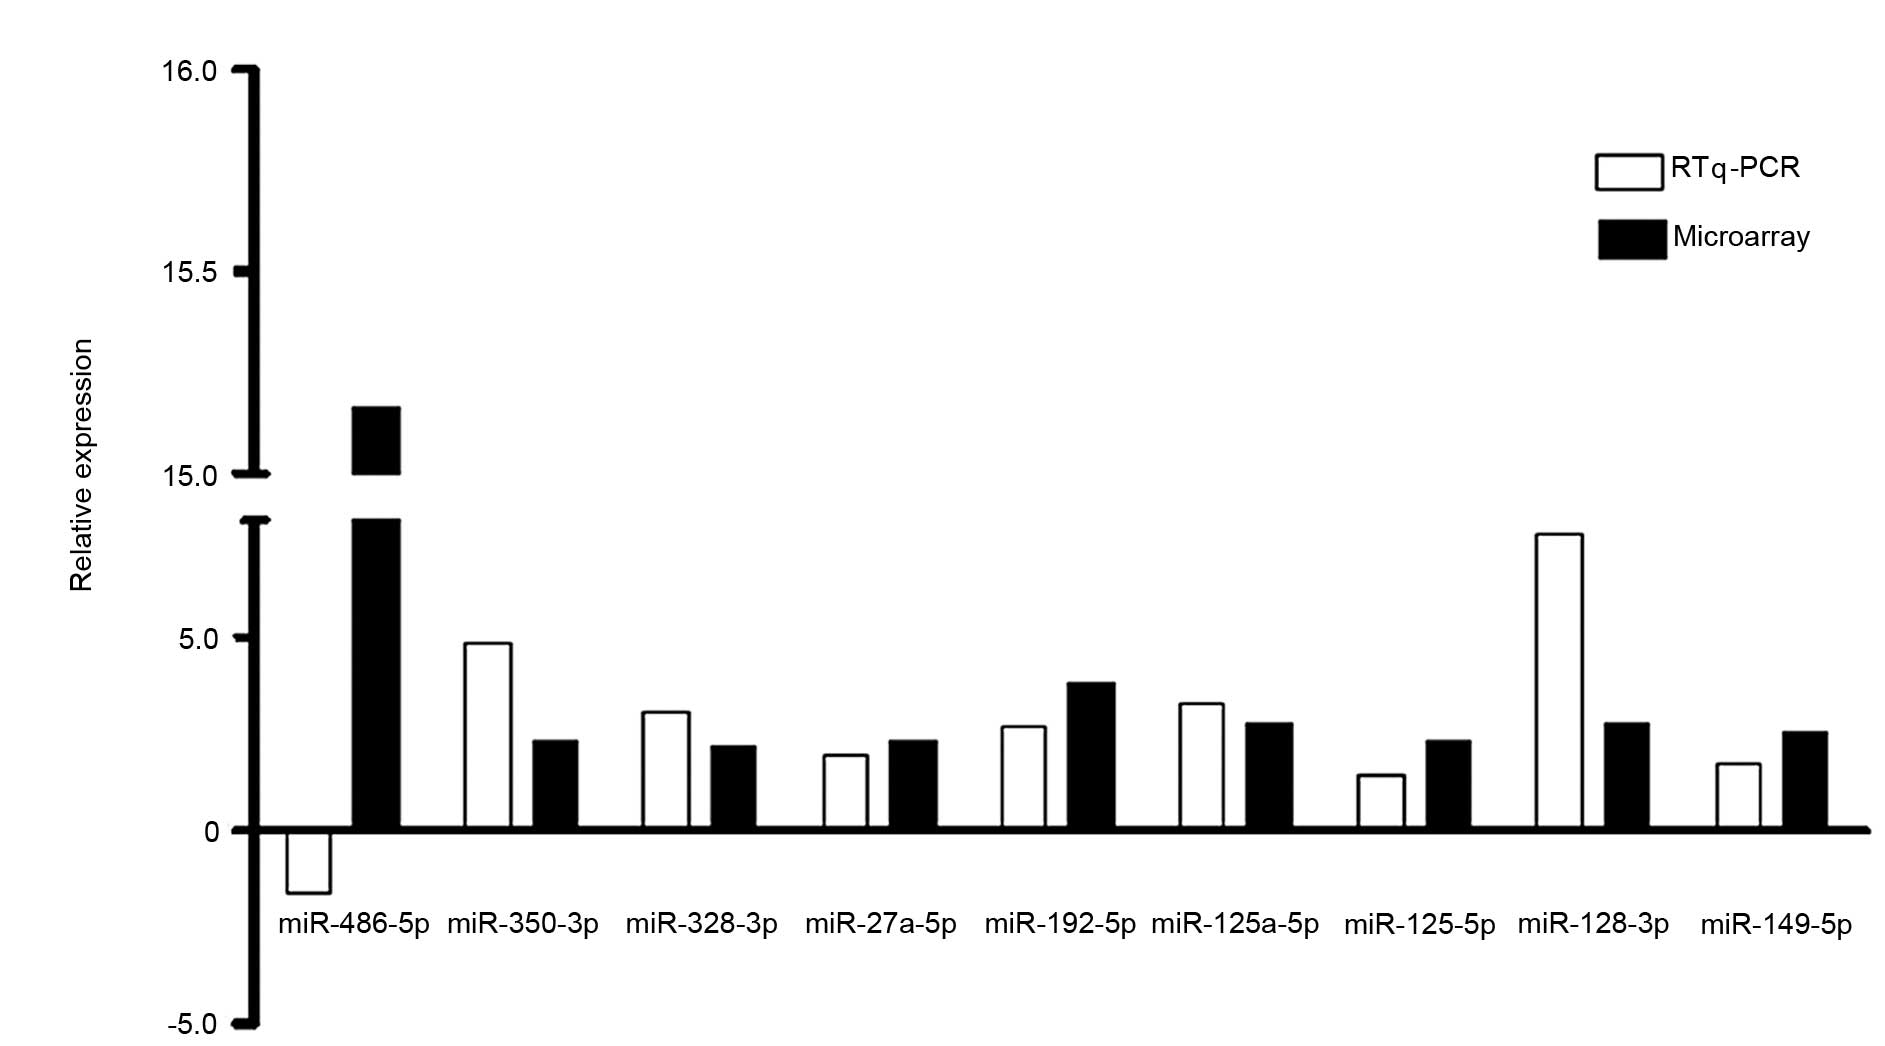
RT-qPCR was performed for 9 of the differentially
expressed miRNAs (fold change >2) to validate the results of the
miRNA microarray. The relative ratio of miRNA expression between
the G-MDSCs from mice bearing LLC with tumor-free mice was
determined by RT-qPCR. The relative ratios for the 9 detected
miRNAs were 0.6, 2.7, 7.6, 3.3, 1.8, 1.9, 1.4, 4.8 and 3.1 for
miR-486, miR-192, miR-128, miR-125a, miR-149, miR-27a, miR-125b,
miR-350 and miR-328, respectively. The RT-qPCR data from 8 out of
the 9 miRNAs was in accordance with the microarray results
(Fig. 3), excluding miR-486. The
concordance rate of the results analyzed by the two methods was
88.9%.
Target prediction and functional
analyses of the differentially expressed miRNAs
The targets of the 9 miRNAs were predicted using
four online software programs: MirTarget2, PicTar, miRanda, and
PITA. In order to increase the specificity, the results of the four
target prediction programs were integrated and only the genes that
were predicted by all the four software programs were analyzed. A
total of 729 miRNA-target RNA pairs were identified by all of the
four online software programs. For the 9 miRNAs tested by RT-qPCR,
22, 18, 163, 82, 52, 44, 85, 228 and 21 targets were predicted for
miR-486, miR-192, miR-128, miR-125a, miR-149, miR-27a, miR-125b,
miR-350 and miR-328, respectively.
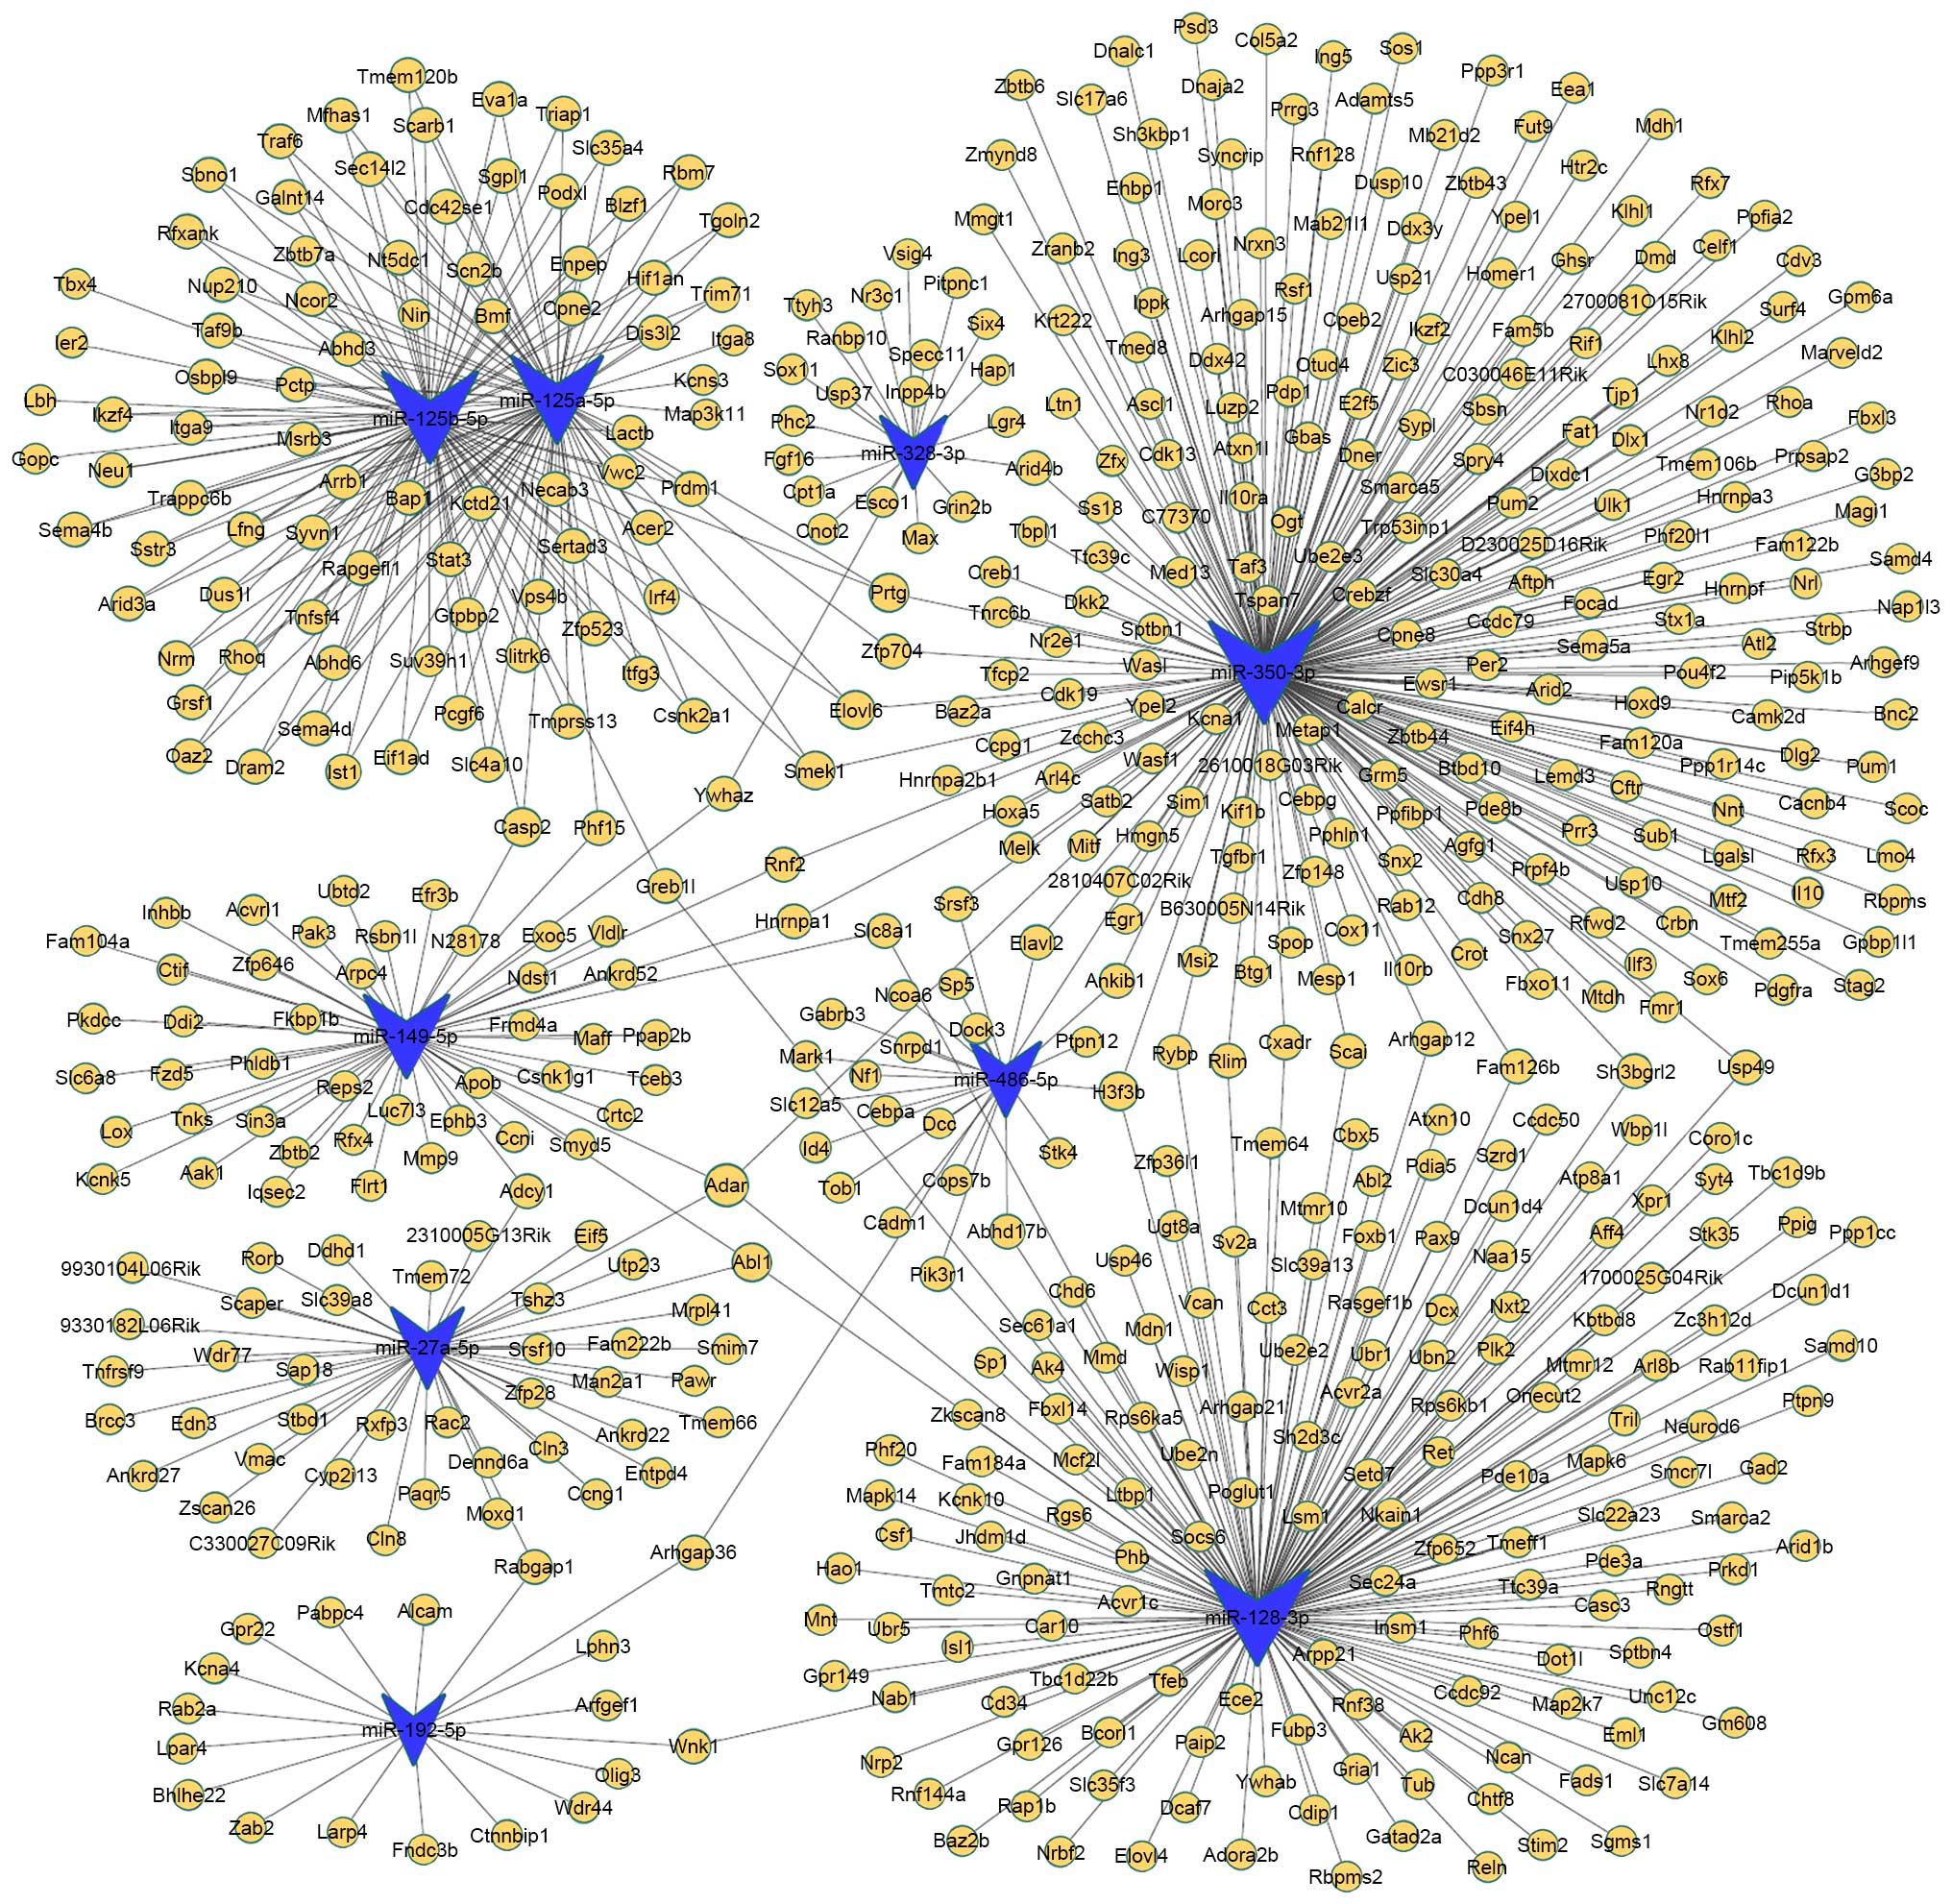
The miRNA-target mRNA pairs were ranked. A network
was generated by Cytoscape to demonstrated the association between
the predicted miRNA-target gene pairs (Fig. 4). Certain mRNAs were predicted to
be potential targets of more than two of these miRNAs. For
instance, adenosine deaminase, RNA-specific (Adar) may be a target
gene of miR-350, miR-149, miR-128 and miR27a. c-Abl oncogene 1,
non-receptor tyrosine kinase (Abl1) may be a target gene of
miR-27a, miR-149 and miR-128. Caspase 2 (casp2) may be a target
gene of miR149, miR-125a and miR-125b. H3 histone, family 3B
(H3f3b) may be a target gene of miR-128, miR-350, miR-21-5p and
miR-486. SMEK homolog 1, suppressor of mek1 (Smek1), ELOVL family
member 6, elongation of long chain fatty acids (Elovl6) and
protogenin (Prtg) may be target genes of miR350, miR-125a and
miR-125b. The majority of predicted targets for miR-125a were
shared with miR-125b.
Predicted target genes were analyzed by GO (Fig. 5A) and KEGG pathway (Fig. 5B) analyses for significant
enrichment of genes into functional annotation categories.
Significantly enriched categories including cell differentiation,
proliferation, apoptotic process, immune response and hematopoiesis
are demonstrated with -log (P-value) and the number of target
genes. The majority of these targets were involved in regulating
signal transducer activity, apoptotic process, cell
differentiation, cell cycle and adaptive immune responses (Fig. 5A). Certain target genes associated
with several vital signaling pathways of the ‘immune cell genes’,
for example transforming growth factor-β (TGF-β), mitogen-activated
protein kinase (MAPK), ErbB, Ras, T cell receptor, tumor necrosis
factor (TNF), Wnt and vascular endothelial growth factor (VEGF)
signaling pathways (Fig. 5B).
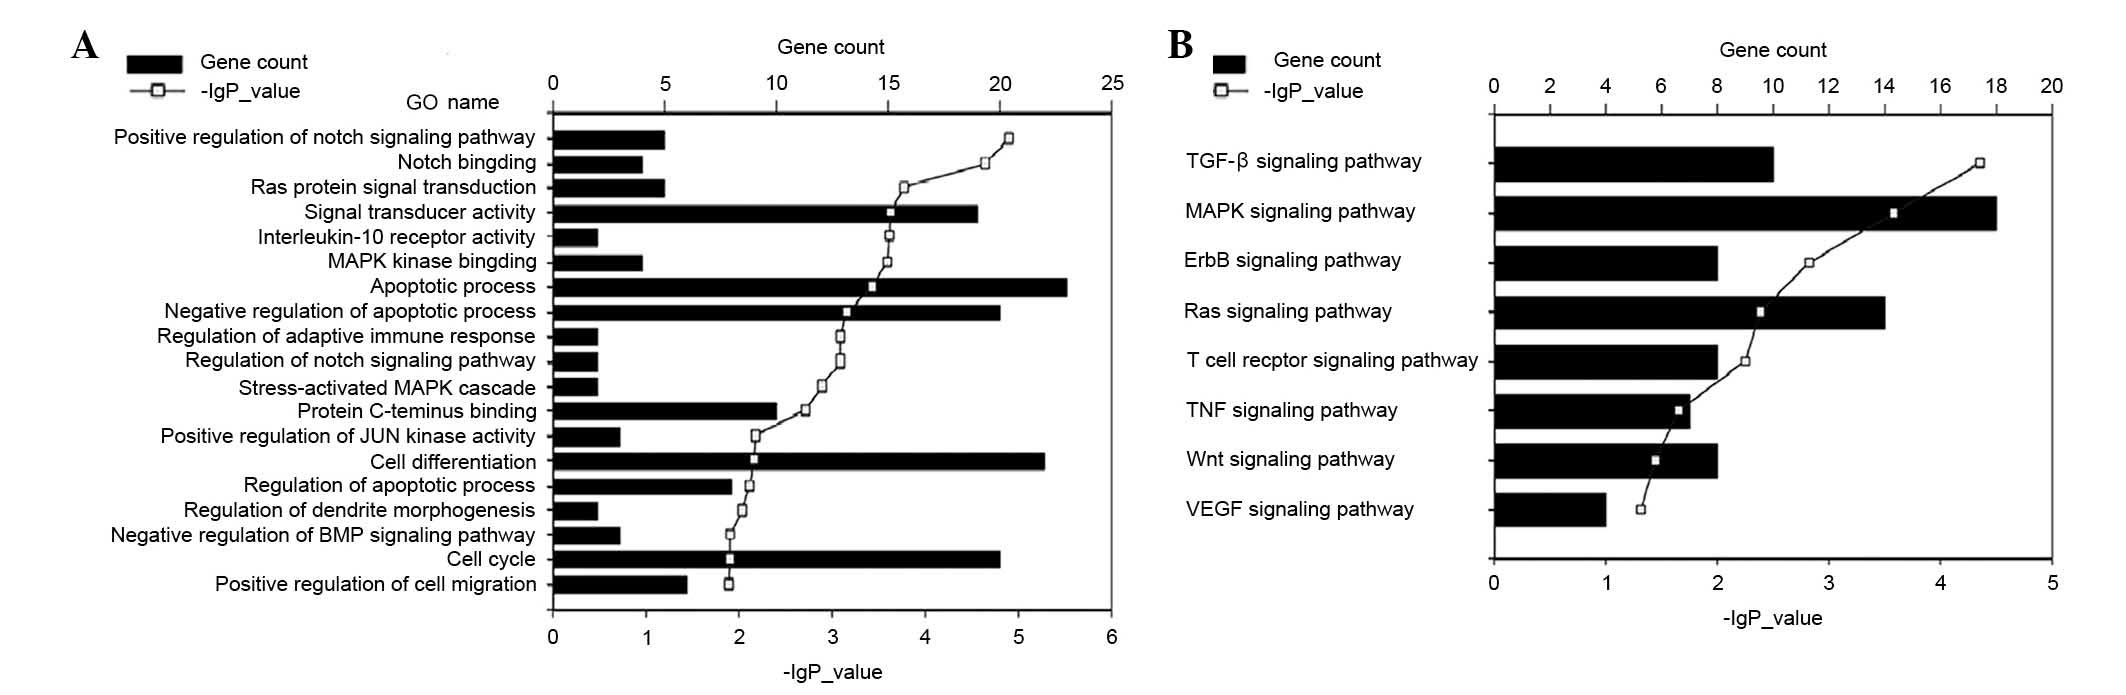 | Figure 5.miRNA target prediction and functional
annotation analysis. Predicted target genes of the nine reverse
transcription-quantitative polymerase chain reaction tested miRNAs
were analyzed using (A) GO and (B) KEGG pathway analyses for
significant enrichment of genes into functional annotation
categories. Significantly enriched categories including cell
differentiation, proliferation, apoptotic process, immune response
and hematopoiesis are shown with -log (P-value) and the number of
miRNA gene targets. GO, gene ontology; KEGG, Kyoto Encyclopedia of
Genes and Genomes; MAPK, mitogen-activated protein kinase; BMP,
bone morphogenic protein; TGF-β, transforming growth factor-β; TNF,
tumor necrosis factor; VEGF, vascular endothelial growth
factor. |
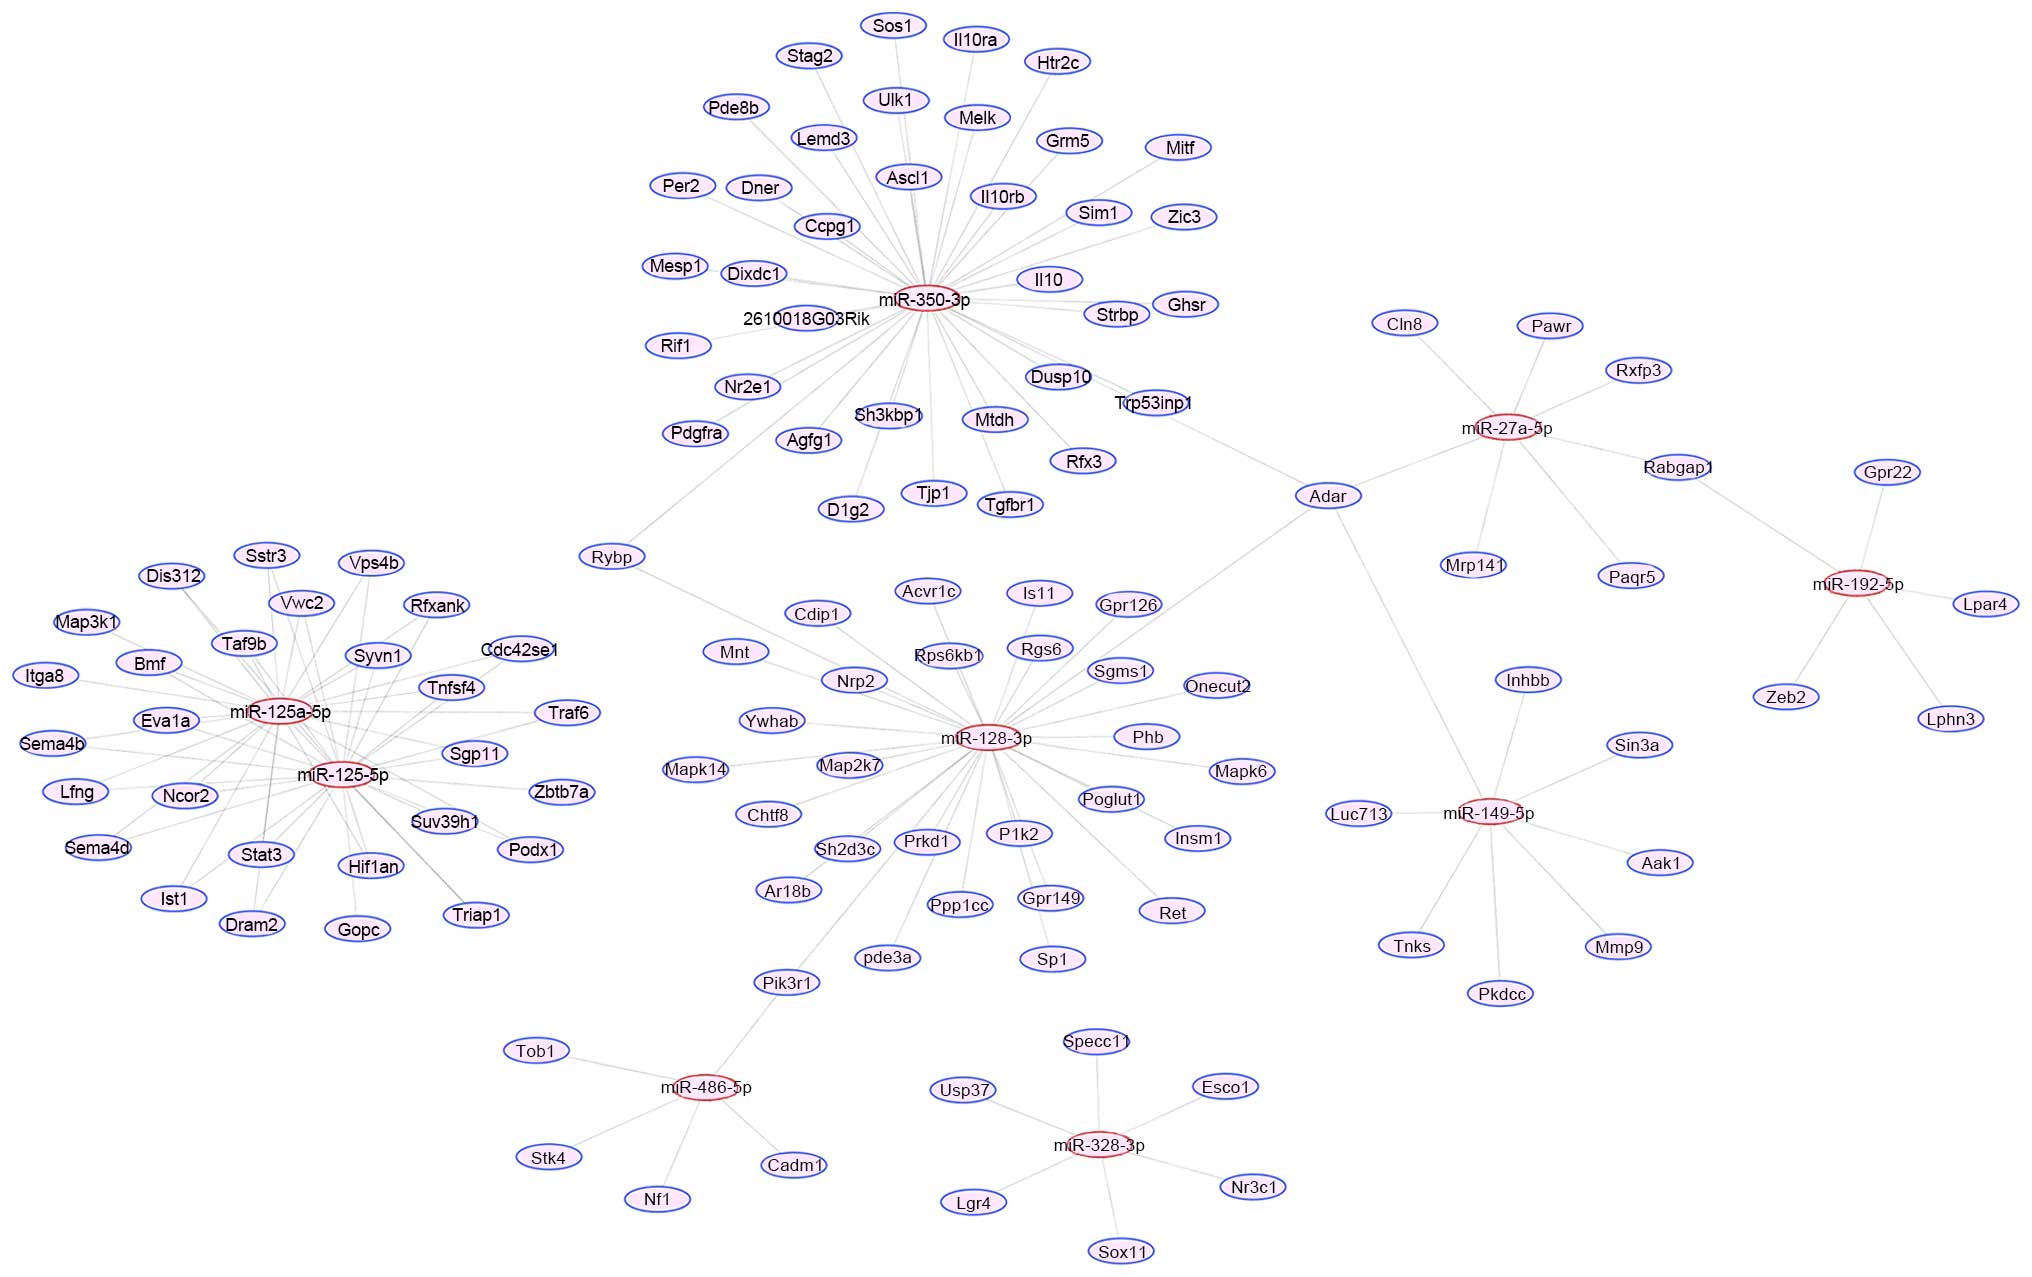
Another concise map of miRNA-target interactions was
generated limited to genes that have major functions in regulation
of signal transducer activity, apoptotic process, cell
differentiation, cell cycle and adaptive immune response (Fig. 6). Phosphatidylinositol 3-kinase,
regulatory subunit, polypeptide 1 (Pik3r1; regulated by miR-486 and
miR-128), RING1 and YY1 binding protein (Rybp; regulated by miR-128
and miR-350) and RAB GTPase activating protein 1 (Rabgap1;
regulated by miR-27a and miR-192) may also be involved in the
regulation of apoptotic process, cell differentiation, cell cycle
and adaptive immune response of G-MDSCs.
Discussion
MDSCs are a heterogeneous group of immature and
mature myeloid cells with immunosuppressive activity. MDSCs have
been divided into two main subsets; G-MDSCs and M-MDSCs, which have
different phenotypic and biological properties. In the majority of
tumor models and in many patients with cancer, G-MDSCs are the
predominant subgroup, which represent 70–80% of the whole MDSC
population, with M-MDSCs accounting for 20–30%. G-MDSCs and M-MDSCs
have been reported to possess different mechanisms of
immunosuppression (18). The
present study demonstrated that G-MDSCs accounted for ~72.9% of all
MDSCs and 13.5% of all nucleated cell in the spleens of with
transplanted LLCs, which was in accordance with previous reports
(3,18).
Previous investigation had revealed that pivotal
signaling pathways, for example PI3K, Jak/Stat, Ras and TGF-β, were
required for the development of myeloid cells and producing MDSCs.
Targeting these pathways may elucidate the mechanisms that result
in expanding MDSCs in cancer (19). Therefore, there is great interest
in clarifying the function of signaling pathways that participate
in regulate MDSCs. Evidence has demonstrated that miRNAs suppress
expression of relevant target genes in hematopoietic cells, and
subsequently change the differentiation of hematopoietic progenitor
cells. miRNAs may also be involved in the functional regulation of
hematopoietic stem cells and immune cells (20). MDSCs are immunoregulatory cells
originated from hematopoietic stem cells, which may also be
regulated by miRNAs. As G-MDSCs have certain different biological
characteristics to M-MDSCs, their miRNA expression profiles may
also be different. In the current study, the miRNA expression
profiles of the G-MDSCs induced by LLC were obtained, which
provided a basis to examine how miRNAs are involved in maintaining
the characteristics and biological function of G-MDSCs. The data of
the current study identified 43 miRNAs with a change of
>1.3-fold, which were considered as differentially expressed
miRNAs between the LLC-induced G-MDSCs and their counterparts from
tumor-free mice. The miRNA microarray results from LLC-induced
G-MDSCs were different from those of Liu et al (11) using LLC-induced total MDSCs, which
agreed with our previous assumption that G-MDSCs and M-MDSCs have
different mechanisms of production and function, and therefore
different miRNA profiles (11).
In the present study H3f3b and Prtg were predicted
to be targets of miR-128 and miR-125b, respectively. As reported
previously, miR-128 acts as a tumor suppressor, and may inhibit
head and neck squamous cell carcinoma growth by targeting H3f3b
(21). miR-125 regulates the
developmental change in competence of retinal progenitor cells,
partly via targeting Prtg (22).
All of these cases indicate that miRNAs are
important in the regulation of survival, differentiation and
function of LLC-induced G-MDSCs, although the predicted data have
not been validated by functional experiments. Further work should
be conducted to confirm the effects of these miRNAs in regulating
LLC-induced G-MDSCs and the target genes that mediate their
functions. In order to translate the findings into clinical use,
the data will require validating in MDSCs from patients with
cancer.
In summary, to the best of our knowledge, miRNA
expression profiles were determined in the G-MDSC subsets from
LLC-induced MDSCs for the first time. The data indicated that
miRNAs may be important for regulating the survival,
differentiation and biological function of tumor-induced
G-MDSCs.
Acknowledgements
This work was supported by the National Natural
Science Foundation of China (grant nos. 81101551 and 81302010),
Natural Science Foundation of Shanghai (grant no. 13ZR-1405000),
the first session Funding Schemes for Young Doctor Training of
Shanghai (grant no. 20120443) and the Project to Improve the
Ability of Scientific Research for Young Teachers of Fudan
University (grant no. 20520133345). We are grateful to Dr Zhang Wu
(State Key Laboratory of Medical Genomics and Shanghai Institute of
Hematology, Ruijin Hospital, Shanghai Jiao Tong University School
of Medicine) for his help in analysis of fluorescence data.
Glossary
Abbreviations
Abbreviations:
|
MDSCs
|
myeloid-derived suppressor cells
|
|
LLC
|
Lewis lung carcinoma
|
|
G-MDSCs
|
granulocytic myeloid-derived
suppressor cells
|
|
M-MDSCs
|
monocytic MDSCs
|
|
miRNAs
|
microRNAs
|
|
RT-qPCR
|
reverse transcription-quantitative
polymerase chain reaction
|
References
|
1
|
Gabrilovich DI and Nagaraj S:
Myeloid-derived suppressor cells as regulators of the immune
system. Nat Rev Immunol. 9:162–174. 2009. View Article : Google Scholar : PubMed/NCBI
|
|
2
|
Condamine T, Ramachandran I, Youn JI and
Gabrilovich DI: Regulation of tumor metastasis by myeloid-derived
suppressor cells. Annu Rev Med. 66:97–110. 2015. View Article : Google Scholar : PubMed/NCBI
|
|
3
|
Youn JI, Nagaraj S, Collazo M and
Gabrilovich DI: Subsets of myeloid-derived suppressor cells in
tumor-bearing mice. J Immunol. 181:5791–5802. 2008. View Article : Google Scholar : PubMed/NCBI
|
|
4
|
Movahedi K, Guilliams M, Van den Bossche
J, Van den Bergh R, Gysemans C, Beschin A, De Baetselier P and Van
Ginderachter JA: Identification of discrete tumor-induced
myeloid-derived suppressor cell subpopulations with distinct T
cell-suppressive activity. Blood. 111:4233–4244. 2008. View Article : Google Scholar : PubMed/NCBI
|
|
5
|
Lim HX, Hong HJ, Cho D and Kim TS: IL-18
enhances immunosuppressive responses by promoting differentiation
into monocytic myeloid-derived suppressor cells. J Immunol.
193:5453–5460. 2014. View Article : Google Scholar : PubMed/NCBI
|
|
6
|
Medina-Echeverz J, Haile LA, Zhao F,
Gamrekelashvili J, Ma C, Métais JY, Dunbar CE, Kapoor V, Manns MP,
Korangy F and Greten TF: IFN-γ regulates survival and function of
tumor-induced CD11b+ Gr−1 high myeloid
derived suppressor cells by modulating the anti-apoptotic molecule
Bcl2a1. Eur J Immunol. 44:2457–2467. 2014. View Article : Google Scholar : PubMed/NCBI
|
|
7
|
O'Connell RM, Rao DS, Chaudhuri AA and
Baltimore D: Physiological and pathological roles for microRNAs in
the immune system. Nat Rev Immunol. 10:111–122. 2010. View Article : Google Scholar : PubMed/NCBI
|
|
8
|
Ekimler S and Sahin K: Computational
methods for MicroRNA target prediction. Genes (Basel). 5:671–683.
2014.PubMed/NCBI
|
|
9
|
Jiang J, Guo W and Liang X: Phenotypes,
accumulation, and functions of myeloid-derived suppressor cells and
associated treatment strategies in cancer patients. Hum Immunol.
75:1128–1137. 2014. View Article : Google Scholar : PubMed/NCBI
|
|
10
|
Zhang M, Liu Q, Mi S, Liang X, Zhang Z, Su
X, Liu J, Chen Y, Wang M, Zhang Y, et al: Both miR-17-5p and
miR-20a alleviate suppressive potential of myeloid-derived
suppressor cells by modulating STAT3 expression. J Immunol.
186:4716–4724. 2011. View Article : Google Scholar : PubMed/NCBI
|
|
11
|
Liu Y, Lai L, Chen Q, Song Y, Xu S, Ma F,
Wang X, Wang J, Yu H, Cao X and Wang Q: MicroRNA-494 is required
for the accumulation and functions of tumor-expanded
myeloid-derived suppressor cells via targeting of PTEN. J Immunol.
188:5500–5510. 2012. View Article : Google Scholar : PubMed/NCBI
|
|
12
|
Li L, Zhang J, Diao W, Wang D, Wei Y,
Zhang CY and Zen K: MicroRNA-155 and MicroRNA-21 promote the
expansion of functional myeloid-derived suppressor cells. J
Immunol. 192:1034–1043. 2014. View Article : Google Scholar : PubMed/NCBI
|
|
13
|
Wang X, Chang X, Zhuo G, Sun M and Yin K:
Twist and miR-34a are involved in the generation of tumor-educated
myeloid-derived suppressor cells. Int J Mol Sci. 14:20459–20477.
2013. View Article : Google Scholar : PubMed/NCBI
|
|
14
|
Huang A, Zhang H, Chen S, Xia F, Yang Y,
Dong F, Sun D, Xiong S and Zhang J: miR-34a expands myeloid-derived
suppressor cells via apoptosis inhibition. Exp Cell Res.
326:259–266. 2014. View Article : Google Scholar : PubMed/NCBI
|
|
15
|
Livak KJ and Schmittgen TD: Analysis of
relative gene expression data using real-time quantitative PCR and
the 2(−Delta Delta C(T)) Method. Methods. 25:402–408. 2001.
View Article : Google Scholar : PubMed/NCBI
|
|
16
|
Cline MS, Smoot M, Cerami E, Kuchinsky A,
Landys N, Workman C, Christmas R, Avila-Campilo I, Creech M, Gross
B, et al: Integration of biological networks and gene expression
data using Cytoscape. Nat Protoc. 2:2366–2382. 2007. View Article : Google Scholar : PubMed/NCBI
|
|
17
|
Bindea G, Mlecnik B, Hackl H, Charoentong
P, Tosolini M, Kirilovsky A, Fridman WH, Pagès F, Trajanoski Z and
Galon J: ClueGO: A Cytoscape plug-in to decipher functionally
grouped gene ontology and pathway annotation networks.
Bioinformatics. 25:1091–1093. 2009. View Article : Google Scholar : PubMed/NCBI
|
|
18
|
Serafini P: Myeloid derived suppressor
cells in physiological and pathological conditions: The good, the
bad, and the ugly. Immunol Res. 57:172–184. 2013. View Article : Google Scholar : PubMed/NCBI
|
|
19
|
Trikha P and Carson WE III: Signaling
pathways involved in MDSC regulation. Biochim Biophys Acta.
1846:55–65. 2014.PubMed/NCBI
|
|
20
|
Hukowska-Szematowicz B, Tokarz-Deptula B
and Deptula W: MicroRNA (miRNA) and the immune system. Cent Eur J
Immunol. 37:387–390. 2012. View Article : Google Scholar
|
|
21
|
Hauser B, Zhao Y, Pang X, Ling Z, Myers E,
Wang P, Califano J and Gu X: Functions of miRNA-128 on the
regulation of head and neck squamous cell carcinoma growth and
apoptosis. PLoS One. 10:e01163212015. View Article : Google Scholar : PubMed/NCBI
|
|
22
|
La Torre A, Georgi S and Reh TA: Conserved
microRNA pathway regulates developmental timing of retinal
neurogenesis. Proc Natl Acad Sci USA. 110:E2362–E2370. 2013.
View Article : Google Scholar : PubMed/NCBI
|