Introduction
Lung cancer has been identified as one of the
leading causes of cancer-associated mortality worldwide, and 80–85%
of lung cancer cases are classified as non-small cell lung cancer
(NSCLC) (1). Considerable progress
has been made in the development of epidermal growth factor
receptor tyrosine kinase inhibitors (EGFR-TKIs), such as erlotinib
and gefitinib, which regulate the expression levels of specific
molecules in lung cancer cells (2). Gefitinib monotherapy has become more
popular as a treatment option for chemotherapy-refractory patients
and is also considered a first-line treatment option in specific
advanced cancers, including NSCLC (3,4).
However, after 6–12 months of treatment, a number of patients that
initially responded to EGFR-TKIs treatment ultimately became
resistant and underwent tumor progression. This phenomenon has been
defined as ‘acquired resistance’, and is common in patients with
NSCLC (5,6). Therefore, acquired resistance to
EGFR-TKIs is an important issue to overcome for the successful
treatment of patients with NSCLC (7). A previous study was performed with
the aim of investigating the underlying mechanisms and regulating
acquired resistance; however, in 30% of cases it remained
inevitable (8). Therefore, more
arduous efforts should be made to identify effective diagnostic
markers and to provide tailor-made TKI treatment for each patient
with EGFR-TKIs resistance.
Previous studies have attempted to identify clinical
and laboratory hematological biomarkers in order to distinguish
patients with NSCLC that were resistant to EGFR-TKIs treatment
(9–11). An EGFR mutation has been reported
to be associated with increased EGFR-TKI sensitivity in patients
with NSCLC, and ~80% of patients exhibit a good response to
EGFR-TKIs treatment when EGFR was mutated (12). However, performing EGFR mutational
profiling at every treatment stage on patients with NSCLC is
complicated, expensive and time-consuming (13). Blood testing is an alternative
option for monitoring the treatment progress at a low cost and
convenience; however, the sensitivity of this method is low
(14). Matrix-assisted laser
desorption/ionization-time of flight-mass spectrometry (MALDI-TOF
MS) has been developed for the analysis of various biological
specimens, including serum, urine and tissue samples (15,16).
MALDI-TOF MS is able to simultaneously investigate large quantities
of proteins and identify the proteomic patterns with high
sensitivity, and has been used to determine the proteomic patterns
in NSCLC (17). Furthermore, the
magnetic bead (MB)-based platform for proteomic profiling with high
sensitivity has been used to screen for biomarkers of several types
of cancer, including breast cancer, esophageal carcinoma and lung
cancer, in combination with MALDI-TOF MS (18–20).
The present study aimed to investigate the serum
biomarkers that may predict the efficacy of EGFR-TKIs treatment by
combining MALDI-TOF MS and MB methods. In addition, a model to
predict EGFR-TKIs targeted therapy resistance among patients with
advanced NSCLC was established, and its accuracy and sensitivity
were assessed using a blind test set.
Materials and methods
Patients and materials
A total of 61 patients with NSCLC treated at
Hangzhou First People's Hospital (Hangzhou, China) between June
2009 and May 2014 were enrolled in the present study. The inclusion
criteria were as follows: i) Patients with advanced NSCLC,
identified as stage IV according to TNM staging (21); ii) patients with a performance
status of 0–2, which was defined according to the Eastern
Cooperative Oncology Group (22);
and iii) patients accepted target therapy by one of three
EGFR-TKIs, specifically erlotinib, gefitinib or icotinib. Written
informed consent was obtained from all enrolled patients. Following
treatment with EGFR-TKIs, patients with progressive disease or a
stable disease >6 months were considered to be EGFR-TKIs
resistant, whereas patients with a partial response or stable
disease <6 months were considered to be EGFR-TKIs sensitive. The
protocol of the present study was approved by the Institutional
Ethics Committee of Hangzhou First People's Hospital.
Protein extraction and MALDI-TOF MS
protocol
Blood samples (2 ml) were collected at the Hangzhou
First People's Hospital by venipuncture from the patients with
advanced NSCLC prior to EGFR-TKIs treatment and stored at 4°C
within 1 h. Subsequently, the samples were centrifuged at 5,500 ×
g for 5 min at 4°C. Serum samples were isolated from the
whole blood, divided into 100 µl aliquots and stored at −80°C for
future use.
MB-based weak cation exchange chromatography
(MB-WCX; CM10 spin columns; Ciphergen Biosystems Inc., Freemont,
CA, USA) was used for peptidome separation of samples according to
the standard protocol of the manufacturer. Initially, 10 µl
magnetic suspension with weak cation was thoroughly mixed with 10
µl binding solution in a 0.5 ml microfuge tube. Subsequently, 5 µl
serum was added to each tube at room temperature. All the tubes
were placed in an MB separator (MBS; Miltenyi Biotec, Inc.,
Cambridge, MA, USA) for 1 min and the MB was then collected from
the wall of the tubes. Each sample was washed twice, and 5 µl
eluting solution was added for each sample. MB was separated again
from the suspension using the MBS and the supernatant was removed
to another sample and was blended with 5 µl stabilization
solutions. Finally, prior to the MALDI-TOF MS analysis, the targets
were prepared by spotting 1 µl proteome fraction obtained from
MB-WCX on the polished steel target (Bruker Daltonik GmbH, Bremen,
Germany). Following air drying, 1 µl mixture solution, containing 3
mg/ml α-cyano-4-hydroxycinnamic acid in 50% ACN and 50% Milli-Q
(EMD Millipore, Billerica, MA, USA) with 2% trifluoroacetic acid,
was applied onto each spot and the target was air dried again in
order to achieve co-crystallization. The peptide calibration
standard (1 pmol/µl peptide mixture) was applied in order to
calibrate the machine.
MS analysis
For proteome analysis, a linear Ultraflex MALDI-TOF
MS (Bruker Daltonik GmbH) was used at the following settings: Ion
source 1, 20.00 kV; ion source 2, 18.60 kV; lens, 6.60 kV; pulsed
ion extraction, 120 ns. Ionization was achieved by irradiation with
a crystal laser operating at 200.0 Hz. For matrix suppression, a
high gating factor with signal suppression up to 600 Da was used.
Mass spectra were detected using linear positive mode. Mass
calibration was conducted using the calibration mixture (TuneMix
mixture; Bruker Daltonics GmbH, Leipig, Germany) of proteins and
peptides in the mass range of 1,000–20,000 Da. Three MALDI
preparations (MALDI spots) were quantified for each MB fraction.
Concurrently, a total of 1,600 spectra were acquired (200 laser
shots at eight different spot positions) for each MALDI spot.
Spectra were collected automatically through the Autoflex Analysis
software (version 2.2; Bruker Daltonik GmbH) to generate the
optimized raw data by controlled adjustment of critical instrument
settings.
The criteria selected for protein mass peak
detection (mass/charge; m/z) were as follows: Signal-to-noise ratio
>3 and a 2-Da peak width filter. The intensities of the interest
peaks were normalized to total peak intensity. More than 10% of the
molecular weight was sieved in simultaneous samples, with the
discrepancy of identical peaks in different samples <0.3%
following the removal of initial data noise.
Protein identification and
bioinformatics analysis
Zhejiang University Protein Chip Data Analysis
system was used to identify the mass peaks that were significantly
different between the sensitive and resistant patient groups. All
of the peaks were analyzed by one-way analysis of variance,
followed by a Student-Newman-Keuls post-hoc test using SPSS version
19.0 (IBM SPSS, Armonk, NY, USA). P<0.05 was considered to
indicate a statistically significant difference. A predictive model
using the marker proteins was constructed using a support vector
machine (SVM), which was then trained and tested for prediction
accuracy. Subsequently, ExPASy Bioinformatics Resource Portal
(www.expasy.org/proteomics) (23) was used to detect potential
candidate proteins for the protein peaks observed in the present
study.
Results
Clinical characteristics of the
participants
Among the 61 patients enrolled in the present study,
none had a complete response to EGFR-TKIs therapy: 18 patients had
a partial response (29.5%); 18 patients had stable disease for
<6 months (29.5%), whereas another 25 patients had progressive
disease or stable disease for >6 months (41%). There were 36
patients identified as sensitive to EGFR-TKIs and 25 patients
identified as resistant to EGFR-TKIs. The clinical characteristics
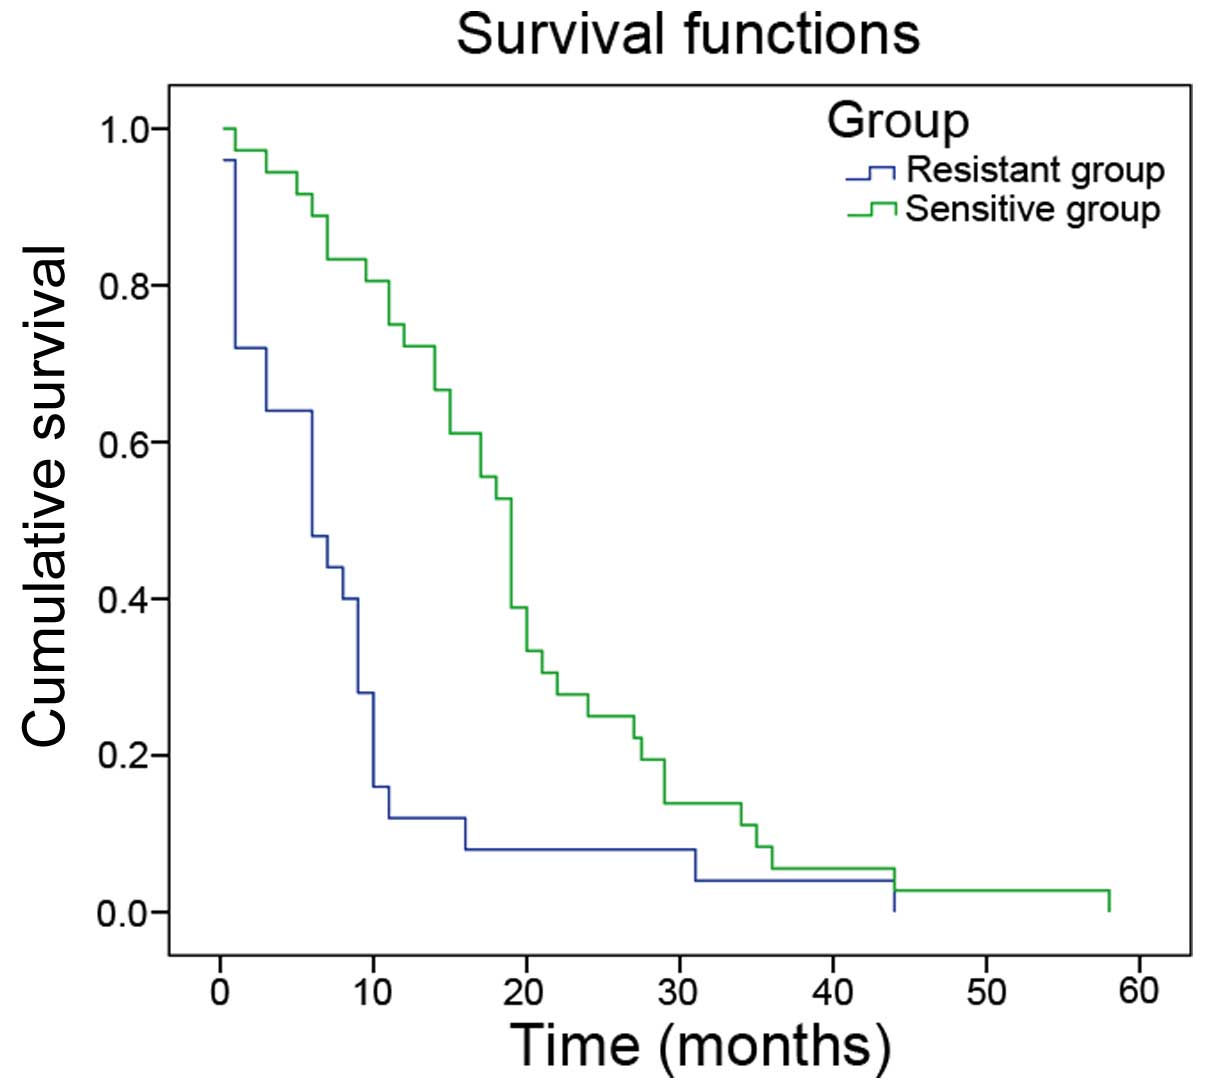
of the participants are presented in Table I. The median overall survival time
in the sensitive group was significantly greater compared with the
resistant group (19.56±1.97 vs. 8.41±1.97 months; P<0.05;
Fig. 1).
 | Table I.Clinical characteristics of the
patients with non-small cell lung cancer included in the present
study. |
Table I.
Clinical characteristics of the
patients with non-small cell lung cancer included in the present
study.
| Characteristic | Patients (n=61) | Percentage (%) |
|---|
| Gender |
|
|
| Male | 35 | 57 |
|
Female | 26 | 43 |
| Age, years |
|
|
| Median
(range) | 62 | 32–85 |
| ≤62 | 31 | 51 |
|
>62 | 30 | 49 |
| Smoking history |
|
|
|
Never | 41 | 67 |
| Current
or past smoker | 20 | 33 |
| Histology |
|
|
|
Adenocarcinoma | 55 | 90 |
|
Others | 6 | 10 |
| Patients treated
with TKIs |
|
|
|
Gefitinib | 26 | 43 |
|
Erlotinib | 6 | 9 |
|
Icotinib | 29 | 48 |
Comparison of mass spectra between
EGFR-TKIs sensitive and resistant groups
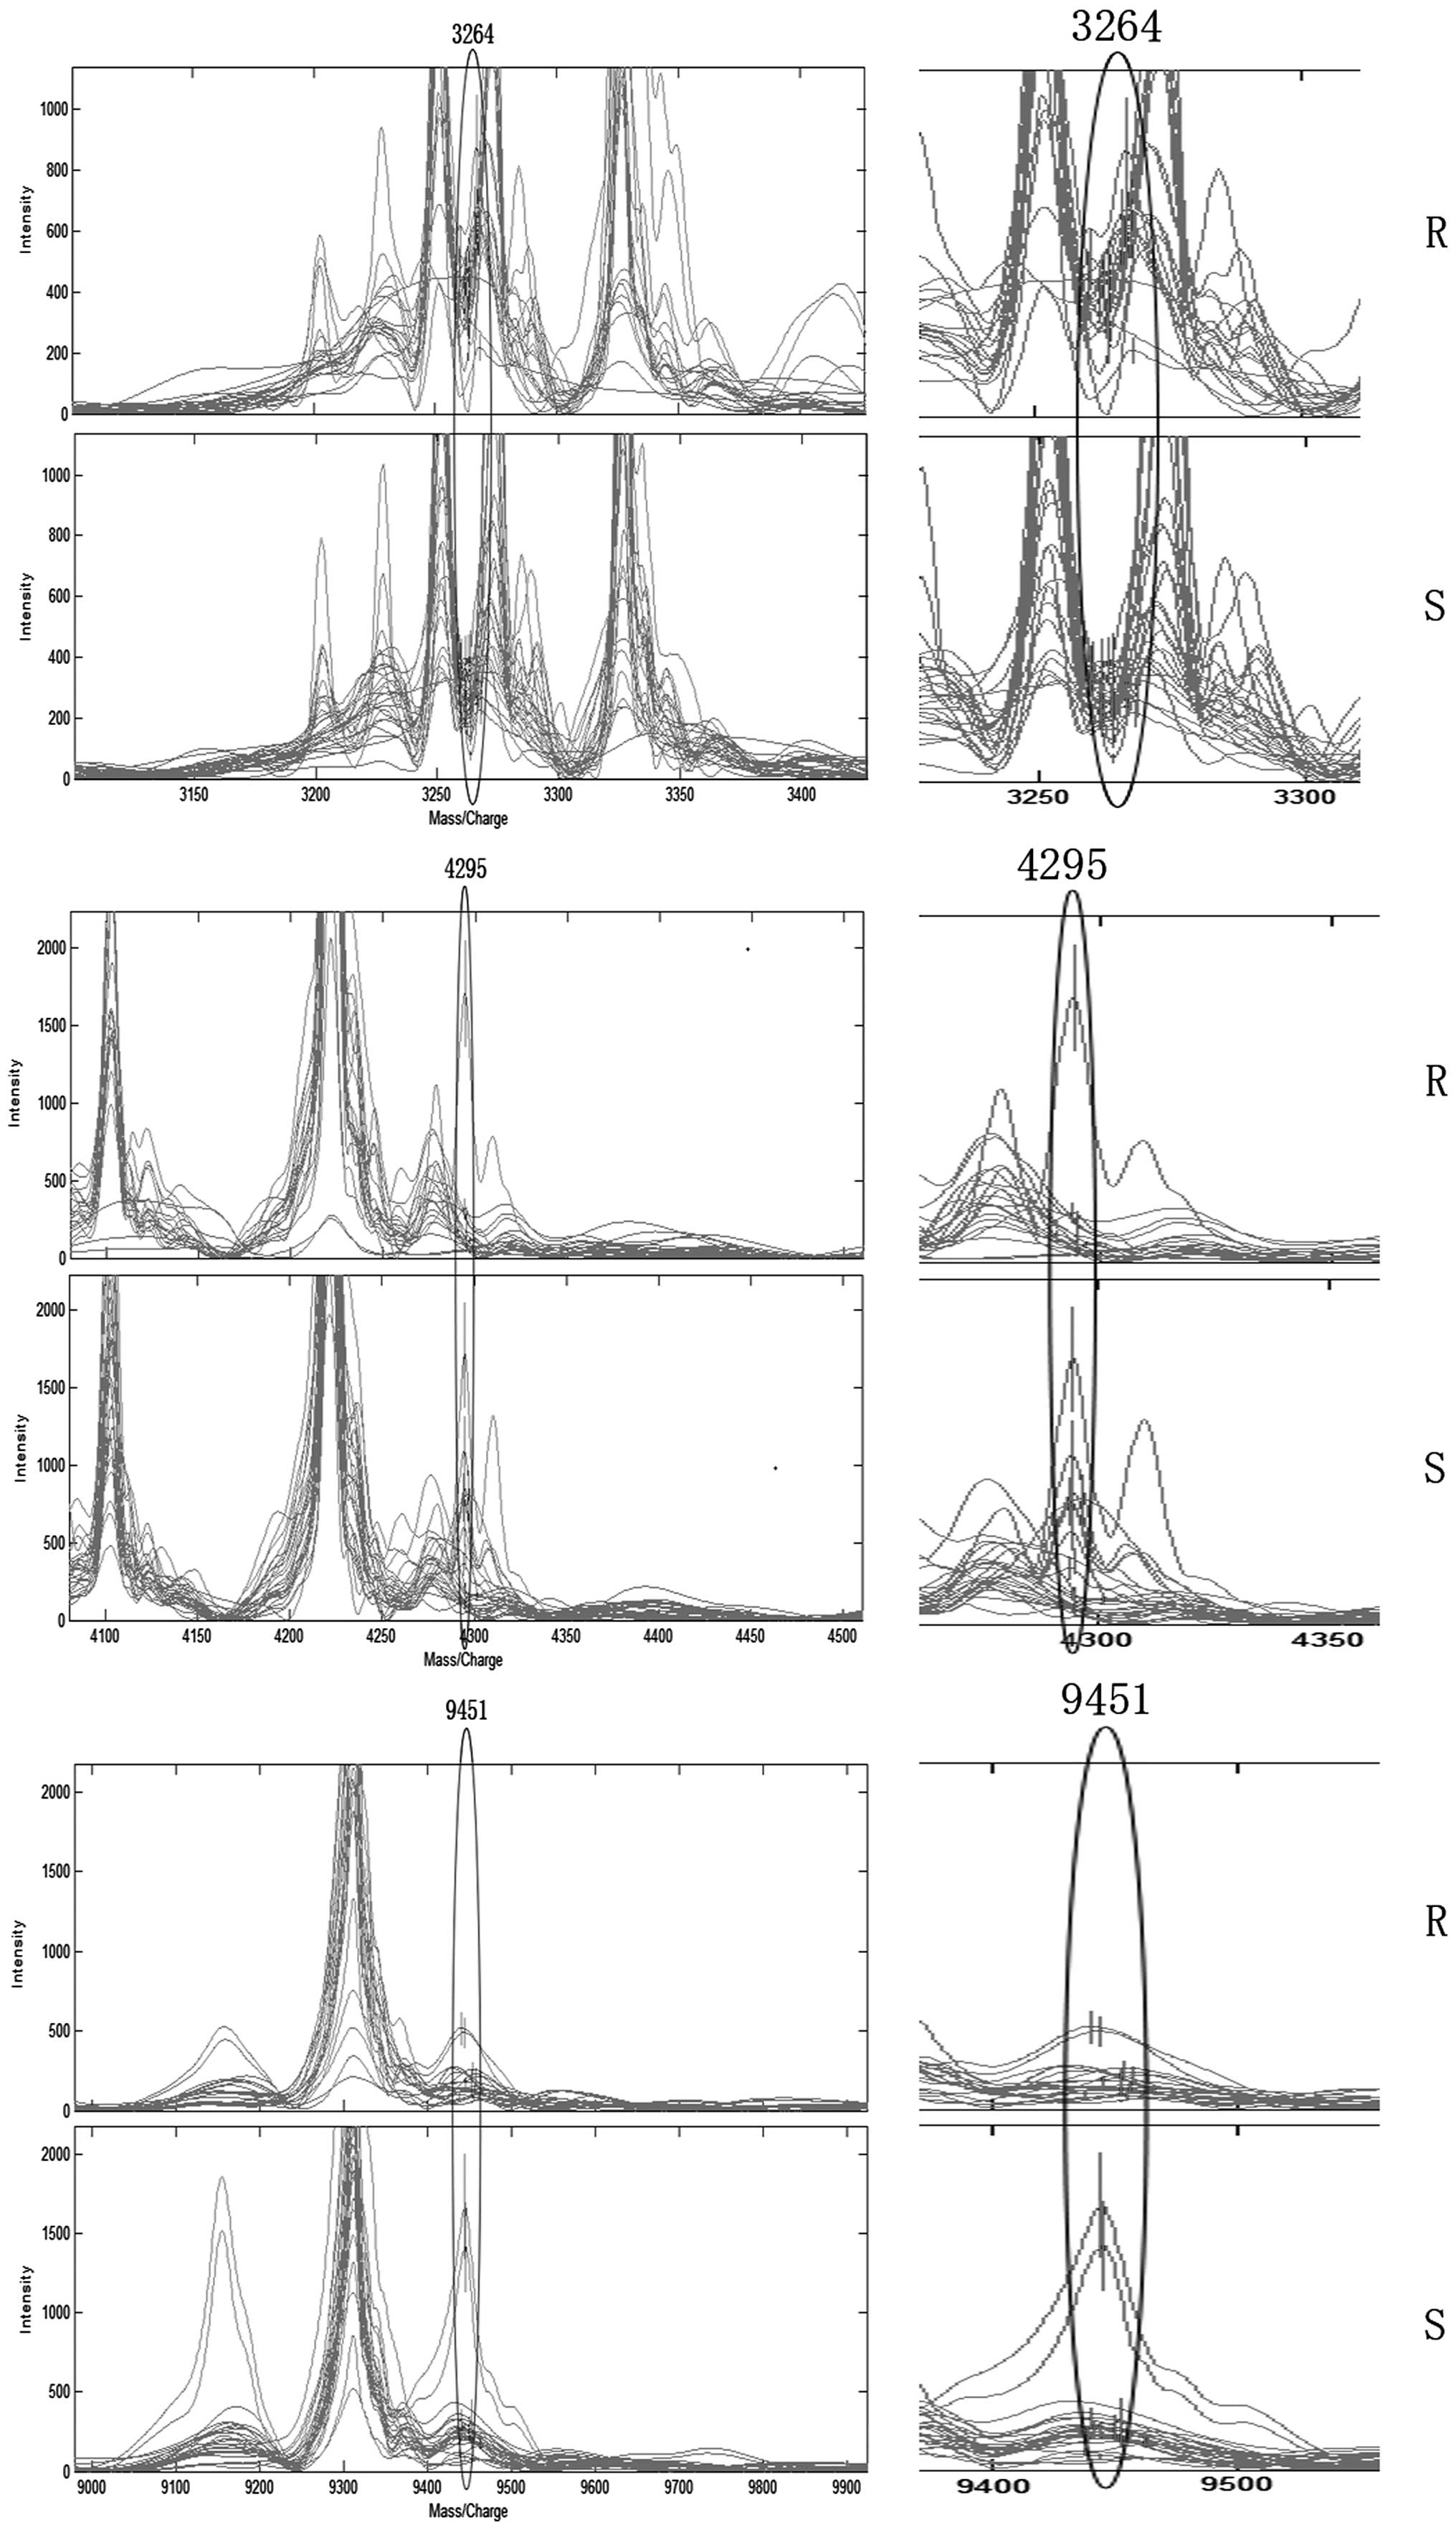
A total of seven mass peaks were identified as
significantly different between the sensitive and resistant groups:
3,264, 9,156, 9,172, 3,964, 9,451, 4,295 and 3,983 Da (Table II). Among them, the peaks at
9,156, 9,172, 3,964, 9,451, 4,295 and 3,983 Da were low in the
resistant group and high in the sensitive group. However, the m/z
peak at 3,264 Da was the only peak that was higher in the EGFR-TKIs
resistant group compared with the EGFR-TKIs sensitive group.
| Table II.Distinct protein peaks between
EGFR-TKIs sensitive group and resistant group. |
Table II.
Distinct protein peaks between
EGFR-TKIs sensitive group and resistant group.
|
|
Relative
intensity |
|
|---|
|
|
|
|
|---|
| Intensity of
protein peak (m/z) | Sensitive group
(n=36, mean ± SD) | Resistant group
(n=25, mean ± SD) | P-value |
|---|
| 3,264 | 273.53±83.13 | 425.52±200.28 | 0.0025 |
| 9,156 | 298.50±421.61 | 141.07±130.07 | 0.0162 |
| 9,172 | 252.60±264.53 | 139.56±123.41 | 0.0206 |
| 3,964 |
1,043.65±839.88 | 516.94±470.90 | 0.0275 |
| 9,451 | 318.10±371.29 | 190.33±121.18 | 0.0426 |
| 4,295 | 390.54±417.55 | 213.61±360.41 | 0.0449 |
| 3,983 | 353.76±437.12 | 242.72±472.91 | 0.0473 |
Construction and validation of the
predictive model
From the seven mass peaks, three were used for the
construction of the SVM model with the highest accuracy. This model
was used as a predictive model and consisted of three potential
biomarkers with a m/z ratio of 3,264, 9,451 and 4,295 Da (Fig. 2). The predictive model was trained
with 46 samples and tested using the remaining 15 samples.
Following the 10-fold cross-validation SVM, the three-peak model
established in the training set was able to distinguish EGFR-TKIs
sensitive patients from EGFR-TKIs resistant patients with a
specificity of 80% and a sensitivity of 80.77%. In the blind test
sets, 9 out of 10 EGFR-TKIs sensitive samples and 4 out 5 EGFR-TKIs
resistant samples were identified correctly with a specificity of
80% and a sensitivity of 90% (Table
III).
| Table III.Predicted results of the model for
discriminating targeted therapy resistance from targeted therapy
sensitivity. |
Table III.
Predicted results of the model for
discriminating targeted therapy resistance from targeted therapy
sensitivity.
|
| Training set
(n=46) | Testing set
(n=15) |
|---|
|
|
|
|
|---|
| Group | S | R | Sum | S | R | Sum |
|---|
| S | 16 | 4 | 20 | 4 | 1 | 5 |
| R | 5 | 21 | 26 | 1 | 9 | 10 |
| Sensitivity, % |
| 80.77 |
|
|
90 |
|
| Specificity, % |
| 80 |
|
|
80 |
|
The ExPASy Bioinformatics Resource Portal was used
to identify candidate proteins for the three peaks. Apelin was
identified as a potential candidate for the protein peak with an
m/z of 3,264 Da, which was the only high peak in the resistant
group. TYRO protein tyrosine kinase-binding protein (TYROBP; 9,450
Da), and big endothelin-1 (big ET-1; 2,487 Da) may be the potential
candidates for the proteins with an m/z of 9,451 and 4,295 Da,
respectively.
Discussion
For the successful clinical development of
individual therapeutic strategies for patients with NSCLC, it is
critical to identify biomarkers that may predict drug resistance in
patients. MALDI-TOF MS, which is a high-throughput proteomic
technique, has been widely used to increase the success of
screening for novel biomarkers of numerous diseases (24,25).
In the present study, the protein fingerprints in blood serum
samples from 36 EGFR-TKIs sensitive patients and 25 EGFR-TKIs
resistant patients were analyzed. The combination of several
biomarkers is considered to be more reliable and powerful for
diagnosis compared with the use of a single marker (18). The present study used the SVM
method to construct a three protein peak model and screened samples
to distinguish between EGFR-TKIs resistant and sensitive patients.
Further analysis revealed apelin, TYROBP and big ET-1 may be the
potential proteins in the predictive model.
Apelin is a 36-amino acid peptide, which has a wide
endogenous expression in various tissues, including the
gastrointestinal tract, lung, heart, liver and bone (26,27).
Apelin has been shown to regulate glucose homeostasis and is
closely associated with obesity (28). A previous study reported that
apelin may act as a potential proangiogenic factor in various
cancers (29). Increased apelin
levels stimulate the microvessel densities and perimeters by
suppressing the proliferation of endothelial cells in NSCLC
(30,31). Furthermore, apelin has been
reported to be overexpressed in NSCLC, and its expression may
influence the clinical outcomes of NSCLC (30). The present study demonstrated that
the expression of apelin, possibly the 3,264 Da protein peak
observed, was significantly increased in the EGFR-TKIs resistant
group compared with the EGFR-TKIs sensitive group. Therefore, it is
possible that high apelin expression may be associated with
EGFR-TKIs resistance by affecting angiogenesis.
TYROBP, also known as DNAX-activation protein 12, is
primarily expressed in macrophages, natural killer cells and
myeloid cells (32). TYROBP has a
preventive function in various diseases due to its ability to
modulate immune cells via the activation and inhibition of immune
signals (33,34). TYROBP has also been reported to
affect cancer metastasis (35). In
a previous study, aberrant expression of TYROBP was observed in
lung cancer (36). Considering the
high expression of TYROBP in the EGFR-TKIs sensitive group, it is
possible that TYROBP may contribute to the EGFR-TKIs sensitivity of
patients with NSCLC.
Big ET-1 is a biological precursor of ET-1. ET-1 has
been determined to have a direct effect on the angiogenesis of
perivascular and endothelial cells, and to be able to indirectly
upregulate the release of vascular endothelial growth factor
(37). ET-1 has also been
identified as a novel regulator of tumor angiogenesis and may be a
potential anti-angiogenic treatment target (38). Furthermore, the overexpression of
plasma big ET-1 and ET-1 levels have been previously detected in
NSCLC (39,40). However, in the present study a high
expression level of big ET-1 was identified in the EGFR-TKIs
sensitive group. Kappers et al (41) previously reported that
administration of the EGFR-TKI sunitinib could significantly
enhance the serum concentration of ET-1 (41). The ET axis (ETA) and the ET
receptor are two distinct receptor subtypes of ET-1, which regulate
the downstream effects. Dysregulation of ETA may promote tumour
development and progression; therefore, ETA-targeting treatment has
been considered as a novel approach for future cancer therapy
(42). High expression levels of
big ET-1 were identified in the sensitive group; therefore, big
ET-1 may regulate ETA activation following EGFR-TKIs treatment of
patients with NSCLC.
In conclusion, combining the expression levels of
these three proteins may be an effective diagnostic method for
EGFR-TKIs resistance. To the best of our knowledge, this study is
the first to investigate the diagnostic performance of
EGFR-TKIs-associated proteins in serum by combining MB-WCX and
MALDI-TOF MS. The predictive model proposed in the present study
may provide an improved understanding of the pathogenesis of NSCLC
and aid in identifying patient-specific treatments using TKIs.
However, despite the high sensitivity and specificity of this
predictive model, the number of specimens analyzed in the present
study was small, which may limit the validity of the results.
Further studies with a larger number of samples are required to
verify the current findings. Related experiments should also be
performed to confirm the prediction function of the three protein
model.
Acknowledgements
The present study was supported by the Hangzhou
Health Science and Technology Plan (grant no. 2012A007) and the
Zhejiang Provincial Natural Science Foundation (grant no.
LY14H160006).
References
|
1
|
Siegel R, Naishadham D and Jemal A: Cancer
statistics, 2012. CA Cancer J Clin. 62:10–29. 2012. View Article : Google Scholar : PubMed/NCBI
|
|
2
|
Mendelsohn J and Baselga J: Status of
epidermal growth factor receptor antagonists in the biology and
treatment of cancer. J Clin Oncol. 21:2787–2799. 2003. View Article : Google Scholar : PubMed/NCBI
|
|
3
|
Fukuoka M, Yano S, Giaccone G, Tamura T,
Nakagawa K, Douillard JY, Nishiwaki Y, Vansteenkiste J, Kudoh S,
Rischin D, et al: Multi-institutional randomized phase II trial of
gefitinib for previously treated patients with advanced
non-small-cell lung cancer (The IDEAL 1 Trial) [corrected]. J Clin
Oncol. 21:2237–2246. 2003. View Article : Google Scholar : PubMed/NCBI
|
|
4
|
Lee DH, Han JY, Lee HG, Lee JJ, Lee EK,
Kim HY, Kim HK, Hong EK and Lee JS: Gefitinib as a first-line
therapy of advanced or metastatic adenocarcinoma of the lung in
never-smokers. Clin Cancer Res. 11:3032–3037. 2005. View Article : Google Scholar : PubMed/NCBI
|
|
5
|
Paez JG, Janne PA, Lee JC, Tracy S,
Greulich H, Gabriel S, Herman P, Kaye FJ, Lindeman N, Boggon TJ, et
al: EGFR mutations in lung cancer: Correlation with clinical
response to gefitinib therapy. Science. 304:1497–1500. 2004.
View Article : Google Scholar : PubMed/NCBI
|
|
6
|
Jackman D, Pao W, Riely GJ, Engelman JA,
Kris MG, Jänne PA, Lynch T, Johnson BE and Miller VA: Clinical
definition of acquired resistance to epidermal growth factor
receptor tyrosine kinase inhibitors in non-small-cell lung cancer.
J Clin Oncol. 28:357–360. 2010. View Article : Google Scholar : PubMed/NCBI
|
|
7
|
Hashida S, Yamamoto H, Shien K, Ohtsuka T,
Suzawa K, Maki Y, Furukawa M, Soh J, Asano H, Tsukuda K, et al:
Hsp90 inhibitor NVP-AUY922 enhances the radiation sensitivity of
lung cancer cell lines with acquired resistance to EGFR-tyrosine
kinase inhibitors. Oncol Rep. 33:1499–1504. 2015.PubMed/NCBI
|
|
8
|
Lin Y, Wang X and Jin H: EGFR-TKI
resistance in NSCLC patients: Mechanisms and strategies. Am J
Cancer Res. 4:411–435. 2014.PubMed/NCBI
|
|
9
|
Chen MC, Chen CH, Wang JC, Tsai AC, Liou
JP, Pan SL and Teng CM: The HDAC inhibitor, MPT0E028, enhances
erlotinib-induced cell death in EGFR-TKI-resistant NSCLC cells.
Cell Death Dis. 4:e8102013. View Article : Google Scholar : PubMed/NCBI
|
|
10
|
Milan E, Lazzari C, Anand S, Floriani I,
Torri V, Sorlini C, Gregorc V and Bachi A: SAA1 is over-expressed
in plasma of non small cell lung cancer patients with poor outcome
after treatment with epidermal growth factor receptor
tyrosine-kinase inhibitors. J Proteomics. 76:91–101. 2012.
View Article : Google Scholar : PubMed/NCBI
|
|
11
|
Yang JJ, Chen HJ, Yan HH, Zhang XC, Zhou
Q, Su J, Wang Z, Xu CR, Huang YS, Wang BC, et al: Clinical modes of
EGFR tyrosine kinase inhibitor failure and subsequent management in
advanced non-small cell lung cancer. Lung Cancer. 79:33–39. 2013.
View Article : Google Scholar : PubMed/NCBI
|
|
12
|
Arcila ME, Oxnard GR, Nafa K, Riely GJ,
Solomon SB, Zakowski MF, Kris MG, Pao W, Miller VA and Ladanyi M:
Rebiopsy of lung cancer patients with acquired resistance to EGFR
inhibitors and enhanced detection of the T790M mutation using a
locked nucleic acid-based assay. Clin Cancer Res. 17:1169–1180.
2011. View Article : Google Scholar : PubMed/NCBI
|
|
13
|
Fukui T, Ohe Y, Tsuta K, Furuta K,
Sakamoto H, Takano T, Nokihara H, Yamamoto N, Sekine I, Kunitoh H,
et al: Prospective study of the accuracy of EGFR mutational
analysis by high-resolution melting analysis in small samples
obtained from patients with non-small cell lung cancer. Clin Cancer
Res. 14:4751–4757. 2008. View Article : Google Scholar : PubMed/NCBI
|
|
14
|
Weber B, Meldgaard P, Hager H, Wu L, Wei
W, Tsai J, Khalil A, Nexo E and Sorensen BS: Detection of EGFR
mutations in plasma and biopsies from non-small cell lung cancer
patients by allele-specific PCR assays. BMC Cancer. 14:2942014.
View Article : Google Scholar : PubMed/NCBI
|
|
15
|
Liu Q, Shi J, Cheng M, Li G, Cao D and
Jiang G: Preparation of graphene-encapsulated magnetic microspheres
for protein/peptide enrichment and MALDI-TOF MS analysis. Chem
Commun (Camb). 48:1874–1876. 2012. View Article : Google Scholar : PubMed/NCBI
|
|
16
|
Mantini D, Petrucci F, Pieragostino D, Del
Boccio P, Sacchetta P, Candiano G, Ghiggeri GM, Lugaresi A,
Federici G, Di Ilio C and Urbani A: A computational platform for
MALDI-TOF mass spectrometry data: Application to serum and plasma
samples. J Proteomics. 73:562–570. 2010. View Article : Google Scholar : PubMed/NCBI
|
|
17
|
Yanagisawa K, Shyr Y, Xu BJ, Massion PP,
Larsen PH, White BC, Roberts JR, Edgerton M, Gonzalez A, Nadaf S,
et al: Proteomic patterns of tumour subsets in non-small-cell lung
cancer. Lancet. 362:433–439. 2003. View Article : Google Scholar : PubMed/NCBI
|
|
18
|
Song QB, Hu WG, Wang P, Yao Y and Zeng HZ:
Identification of serum biomarkers for lung cancer using magnetic
bead-based SELDI-TOF-MS. Acta Pharmacol Sin. 32:1537–1542. 2011.
View Article : Google Scholar : PubMed/NCBI
|
|
19
|
Liu LH, Shan BE, Tian ZQ, Sang MX, Ai J,
Zhang ZF, Meng J, Zhu H and Wang SJ: Potential biomarkers for
esophageal carcinoma detected by matrix-assisted laser
desorption/ionization time-of-flight mass spectrometry. Clin Chem
Lab Med. 48:855–861. 2010. View Article : Google Scholar : PubMed/NCBI
|
|
20
|
de Noo ME, Deelder A, van der Werff M,
Ozalp A, Mertens B and Tollenaar R: MALDI-TOF serum protein
profiling for the detection of breast cancer. Onkologie.
29:501–506. 2006.PubMed/NCBI
|
|
21
|
Mountain CF: Revisions in the
international system for staging lung cancer. Chest. 111:1710–1717.
1997. View Article : Google Scholar : PubMed/NCBI
|
|
22
|
Oken MM, Creech RH, Tormey DC, Horton J,
Davis TE, McFadden ET and Carbone PP: Toxicity and response
criteria of the eastern cooperative oncology group. Am J Clin
Oncol. 5:649–655. 1982. View Article : Google Scholar : PubMed/NCBI
|
|
23
|
Artimo P, Jonnalagedda M, Arnold K,
Baratin D, Csardi G, de Castro E, Duvaud S, Flegel V, Fortier A,
Gasteiger E, et al: ExPASy: SIB bioinformatics resource portal.
Nucleic Acids Res. 40:(Web Server issue). W597–W603. 2012.
View Article : Google Scholar : PubMed/NCBI
|
|
24
|
Fung ET, Wright GL Jr and Dalmasso EA:
Proteomic strategies for biomarker identification: Progress and
challenges. Curr Opin Mol Ther. 2:643–650. 2000.PubMed/NCBI
|
|
25
|
Skytt A, Thysell E, Stattin P, Stenman UH,
Antti H and Wikström P: SELDI-TOF MS versus prostate specific
antigen analysis of prospective plasma samples in a nested
case-control study of prostate cancer. Int J Cancer. 121:615–620.
2007. View Article : Google Scholar : PubMed/NCBI
|
|
26
|
Castan-Laurell I, Dray C, Attané C, Duparc
T, Knauf C and Valet P: Apelin, diabetes, and obesity. Endocrine.
40:1–9. 2011. View Article : Google Scholar : PubMed/NCBI
|
|
27
|
Lee DK, Cheng R, Nguyen T, Fan T,
Kariyawasam AP, Liu Y, Osmond DH, George SR and O'Dowd BF:
Characterization of apelin, the ligand for the APJ receptor. J
Neurochem. 74:34–41. 2000. View Article : Google Scholar : PubMed/NCBI
|
|
28
|
Krist J, Wieder K, Klöting N, Oberbach A,
Kralisch S, Wiesner T, Schön MR, Gärtner D, Dietrich A, Shang E, et
al: Effects of weight loss and exercise on apelin serum
concentrations and adipose tissue expression in human obesity. Obes
Facts. 6:57–69. 2013. View Article : Google Scholar : PubMed/NCBI
|
|
29
|
Sorli SC, Le Gonidec S, Knibiehler B and
Audigier Y: Apelin is a potent activator of tumour neoangiogenesis.
Oncogene. 26:7692–7699. 2007. View Article : Google Scholar : PubMed/NCBI
|
|
30
|
Berta J, Kenessey I, Dobos J, Tovari J,
Klepetko W, Jan Ankersmit H, Hegedus B, Renyi-Vamos F, Varga J,
Lorincz Z, et al: Apelin expression in human non-small cell lung
cancer: Role in angiogenesis and prognosis. J Thorac Oncol.
5:1120–1129. 2010. View Article : Google Scholar : PubMed/NCBI
|
|
31
|
Antushevich H, Pawlina B, Kapica M,
Krawczynska A, Herman AP, Kuwahara A, Kato I and Zabielski R:
Influence of fundectomy and intraperitoneal or intragastric
administration of apelin on apoptosis, mitosis, and DNA repair
enzyme OGG1,2 expression in adult rats gastrointestinal tract and
pancreas. J Physiol Pharmacol. 64:423–428. 2013.PubMed/NCBI
|
|
32
|
Bouchon A, Hernandez-Munain C, Cella M and
Colonna M: A DAP12-mediated pathway regulates expression of CC
chemokine receptor 7 and maturation of human dendritic cells. J Exp
Med. 194:1111–1122. 2001. View Article : Google Scholar : PubMed/NCBI
|
|
33
|
Takaki R, Watson SR and Lanier LL: DAP12:
An adapter protein with dual functionality. Immunol Rev.
214:118–129. 2006. View Article : Google Scholar : PubMed/NCBI
|
|
34
|
Ma J, Jiang T, Tan L and Yu JT: TYROBP in
Alzheimer's disease. Mol Neurobiol. 51:820–826. 2015. View Article : Google Scholar : PubMed/NCBI
|
|
35
|
Sfakianakis S, Bei ES, Zervakis M, Vassou
D and Kafetzopoulos D: On the identification of circulating tumor
cells in breast cancer. IEEE J Biomed Health Inform. 18:773–782.
2014. View Article : Google Scholar : PubMed/NCBI
|
|
36
|
Zhang L, Ma D, Li X, Deng C, Shi Q, You X,
Leng X, Li M, Tang F, Zhang F and Li Y: Gene expression profiles of
peripheral blood mononuclear cells in primary biliary cirrhosis.
Clin Exp Med. 14:409–416. 2014. View Article : Google Scholar : PubMed/NCBI
|
|
37
|
Spinella F, Caprara V, Di Castro V, Rosanò
L, Cianfrocca R, Natali PG and Bagnato A: Endothelin-1 induces the
transactivation of vascular endothelial growth factor receptor-3
and modulates cell migration and vasculogenic mimicry in melanoma
cells. J Mol Med (Berl). 91:395–405. 2013. View Article : Google Scholar : PubMed/NCBI
|
|
38
|
Rosanò L, Spinella F and Bagnato A:
Endothelin 1 in cancer: Biological implications and therapeutic
opportunities. Nat Rev Cancer. 13:637–651. 2013. View Article : Google Scholar : PubMed/NCBI
|
|
39
|
Zuco V, Cassinelli G, Cossa G, Gatti L,
Favini E, Tortoreto M, Cominetti D, Scanziani E, Castiglioni V,
Cincinelli R, et al: Targeting the invasive phenotype of
cisplatin-resistant non-small cell lung cancer cells by a novel
histone deacetylase inhibitor. Biochem Pharmacol. 94:79–90. 2015.
View Article : Google Scholar : PubMed/NCBI
|
|
40
|
Arun C, DeCatris M, Hemingway DM, London
NJ and O'Byrne KJ: Endothelin-1 is a novel prognostic factor in
non-small cell lung cancer. Int J Biol Markers. 19:262–267.
2004.PubMed/NCBI
|
|
41
|
Kappers MH, Smedts FM, Horn T, van Esch
JH, Sleijfer S, Leijten F, Wesseling S, Strevens H, Jan Danser AH
and van den Meiracker AH: The vascular endothelial growth factor
receptor inhibitor sunitinib causes a preeclampsia-like syndrome
with activation of the endothelin system. Hypertension. 58:295–302.
2011. View Article : Google Scholar : PubMed/NCBI
|
|
42
|
Bagnato A, Loizidou M, Pflug BR, Curwen J
and Growcott J: Role of the endothelin axis and its antagonists in
the treatment of cancer. Br J Pharmacol. 163:220–233. 2011.
View Article : Google Scholar : PubMed/NCBI
|