Introduction
Tramadol hydrochloride (TH), an atypical, centrally
acting, opioid analgesic, used in the treatment of moderate to
severe acute and chronic pain, has become the most prescribed
opioid worldwide (1,2). It possesses a weak affinity for the
µ- and δ-opioid receptors, and weaker affinity for the κ-subtype.
It also interferes with the neuronal release and reuptake of
serotonin and norepinephrine, which appears to contribute to the
analgesic effect (3). Tramadol is
extensively metabolized in the liver. The primary metabolites,
O-desmethyltramadol (M1) and N-desmethyltramadol (M2), may be
further metabolized to three additional secondary metabolites,
namely, N, N-didesmethyltramadol (M3), N,N, O-tridesmethyltramadol
(M4) and N,O-didesmethyltramadol (M5). The clinical response to
tramadol is closely correlated with its metabolism. M1 is reported
to be the major active metabolite and it is 200 times more potent
at the µ-receptor than the parent drug, tramadol (4). Despite the long-term use of tramadol,
and lack of characteristic opiate side effects, the knowledge and
prediction of the time-course of its pharmacologic effects are
hampered by the presence of active metabolites and the coexistence
of opioid and nonopioid mechanisms. Furthermore, the adverse
effects of tramadol have been increasingly reported, and data
obtained from postmarketing surveillance, case reports and
laboratory tests has indicated the abuse of tramadol has increased
(5–7). These issues highlight the need of an
appropriate strategy for screening the addictive potential and
neurotoxicity of tramadol in animals and human.
Zebrafish (Danio rerio) have been widely used
as an experimental model in molecular biology and development, and
to investigate the molecular basis of certain human diseases.
Zebrafish represent an established model for studying nociceptive
responses, they not only have the necessary sensory components for
perceiving potentially painful stimuli, but also possess the
biochemical pathways important for transmitting and interpreting
pain in higher vertebrates (8). As
vertebrates, zebrafish are structurally homologous to humans, and
their genes are 70–80% identical to human counterparts (9). It is a valid system to discover and
validate novel pharmacological targets, and to identify novel
drugs, perform toxicological tests, and to analyze the biological
effects of several abused drugs, including cocaine, ethanol and
morphine (10–12). Gonzalez-Nuñez et al
(13) cloned and characterized
four opioid receptors, and five opioid drug precursors in
zebrafish, which are homologous to their mammalian counterparts.
Therefore, zebrafish are likely to be an appropriate experimental
model to analyze the biological effects of abuse and neurotoxicity
of tramadol, however, initially the pharmacokinetic parameters of
tramadol in zebrafish need to be established.
A variety of quantitative bioanalytical methods have
been reported to determine tramadol concentration alone or
combination with its metabolites in various tissues, such as brain
and gut. Methods for estimating the tramadol concentration alone or
in combination with its metabolites have been previously described,
employing high performance liquid chromatography (HPLC) with UV,
fluorescence and diode array detector, gas chromatography (GC) with
flame ionization detection, and mass spectrometry (GC-MS)
detection, liquid chromatography-mass spectrometry (LC-MS),
LC-MS/MS, capillary electrophoresis, thin layer chromatography and
flow injection analysis systems (14–16).
The majority of these previous studies focus their attention
exclusively on tramadol and its active metabolite, M1, in
biological fluids, including saliva, urine, amniotic fluid and
plasma, however, to the best of our knowledge, only two studies
have reported the determination of tramadol and metabolite levels
in the brain tissue of mice and rats by GC-nitrogen-phosphorus
detection (17,18).
Simultaneous quantification of tramadol and its
metabolites has been performed in plasma and/or urine of humans,
horses, dogs, camels, rabbits, mice, amphibians, rats, cats and
donkeys (19–22). The active metabolite M1 in plasma
in various animal species is low, whereas it is high in human
plasma. Tramadol has been previously reported to be metabolized
faster to inactive metabolites in goats, dogs and horses, than in
cats. Furthermore, studies demonstrating the pharmacokinetics of
tramadol in camels, horses and donkeys report high plasma levels of
tramadol, but negligible plasma concentrations of the M1
metabolite, questioning the clinical effectiveness of the drug as
an analgesic in these species (23). Pharmacokinetic studies indicate
interspecies differences in drug metabolism, supporting the fact
that pharmacokinetic studies are necessary for each species, and in
a variety of different tissues. However, very few sensitive methods
are currently established for the detection of tramadol and its
active metabolite in zebrafish, particularly in tissues.
Thus, there is a need to develop rapid, robust and
adequately sensitive methods for simultaneous determination of
tramadol levels and its active metabolites in zebrafish. The
current study aimed to develop rapid electrospray
ionization-quadrupole-time of flight/mass spectrometry
(ESI-Q-TOF/MS) and GC-MS methods to determine the pharmacokinetics
and elimination pattern of tramadol in zebrafish tissues and its
main phase I metabolites following oral or intramuscular (IM)
administration to zebrafish.
Materials and methods
Drugs and chemicals
Tramadol hydrochloride injection (THi) was purchased
from Medochemie Ltd (Limassol, Cyprus), and tramadol hydrochloride
tablets (THt) were from Wellso Pharmaceutical Co., Ltd. (Beijing,
China). Solvents used were HPLC grade and purchased from Tedia
Company, Inc. (Fairfield, OH, USA). Milli-Q water (EMD Millipore,
Billerica, MA, USA) was used throughout. Chemicals were all reagent
grade.
Animals
Zebrafish (Danio rerio) were obtained from
Wei Tong Lihua BioModel Company (Beijing, China) and raised to
maturity in a stock tank without filters at a temperature of 28°C
under cycles of 14 h light and 10 h dark. Their daily care
conformed a guide for the laboratory use of zebrafish (24).
Experimental fish were randomly selected from the
stock tank, and maintained in individual beakers with covers for 2
days. IM administration of THi was performed using a
microinjector and self-made equipment with a superficial hole to
hold the fish. In this equipment, wet absorbent cotton was fixed to
keep the body of the fish wet, above which several rubber bands
were used to strengthen the hold. Sites for IM injection were the
flanks, usually midpoint between the dorsal fin and the lateral
line. A volume of drug or saline was injected into treatment group
or control group, respectively, and no treatment was administered
to the vehicle group. Fish were placed back into their beakers. For
the oral administration of tramadol, zebrafish were pre-exposed for
a certain time to a solution of tramadol, with THt
directly dissolved into the tank. Experiments were performed in
accordance with the guidelines published in the NIH Guide for the
Care and Use of Laboratory Animals.
Preparation of samples for
ESI-Q-TOF/MS and GC-MS
Zebrafish were randomly divided into 3 groups (n=6
per group). Fish were IM-injected with 4 µl saline or THi (10
µg/µl), or received no treatment. Tissue samples from brain, eyes,
gill, heart, liver, gut and muscle (from the tail of fish, far away
from the injection point), were isolated at 0.5 or 1 h after the
treatment, and washed with cold 0.9% saline four times, dried with
tissue paper, weighed and transferred to glass tubes (1 cm I.D. on
ice). The treatment time for every fish was strictly controlled,
from injection to tissue isolation.
Tissue samples with 9-fold (w/v) excess saline were
homogenized using a microhomogenizer at 2,000 rpm/min for 10 sec
and repeated 5 times. A 1 ml aliquot of ethanol was added into the
homogenate. The tubes were sealed and shaken in a reciprocal shaker
for 2 h, following centrifugation at 12,000 × g at room
temperature for 10 min, and the supernatant was transferred to
fresh disposable glass tubes. The ethanol extraction procedure was
repeated four times. Pooled the supernatant together, then were
evaporated under a stream of nitrogen at 40°C, finally the residue
was stored at −20°C prior to analysis. The residue was dissolved in
η-hexane at the same ratio (w/v), vortexed and centrifuged at 200 ×
g for 10 min at 4°C prior to ESI-Q-TOF/MS and GC-MS
analysis.
Pharmacokinetic analysis of tramadol
in zebrafish brain tissue using GC-MS
The fish were randomly divided into two groups, and
received a single IM dose of either 10 or 25 µg/µl THi. Brains
(n=7) were collected prior to drug administration
(pre-injection, time 0), and at 1, 3, 5, 15, 25, 35, 45, 75, 120
and 240 min after a single dose of 10 µg, or at 1, 2, 4, 5, 7, 10,
20, 30, 40, 55, 95, 155, 180 and 300 min after a single injection
of 25 µg. in order to optimize the dose, injection and isolation
time. Brain samples were immediately placed on ice, washed with
0.9% saline (pH 9.0) four times, then the supernatant was discarded
following washing with 0.9% saline and extracted as aforementioned.
A 1 µl aliquot volume of each sample was injected into the GC-MS
system. For quantification, calibration curves were created and
linearity calculated. A standard calibration curve of tramadol
content vs. mean peak area in GC-MS analysis was conducted in the
range of 0–10 µg, by adding 0, 0.5, 5, and 10 µg tramadol into the
brain samples from untreated vehicle control fish and using the
aforementioned extraction procedures.
Identification of tramadol primary
metabolites in brain tissue
Primary metabolites, M1 and M2 were prepared from
tramadol hydrochloride as previously described (25), with certain modifications. Briefly,
218 mg of platinum oxide hydrate was dissolved in 1 ml methanol,
and reduced with hydrogen gas for 5 min. Following centrifugation
at 200 × g for 10 min at 4°C, the precipitated platinum
black catalyst was washed twice with 0.5 ml water. Then tramadol
hydrochloride (20 mg dissolved in 1 ml of distilled water) was
immediately added to the catalyst, and the mixture was stirred for
90 h. The reaction mixture was centrifuged at 200 × g for 10
min at 4°C and the supernatant was removed and the residue was
washed with 1 ml water. The combined aqueous phases were treated
with 0.5 ml 3 mol/l NaOH solution and extracted twice with 2 ml of
η-hexane. The hexane phase was evaporated under a stream of
nitrogen. The resulting compound was used as the desmethyltramadol
reference sample in the GC-MS analysis.
Samples for metabolite analysis were prepared
following IM and bath exposure. Fish received a single IM dose of
either THi (25 µg/µl) or saline, or for bath exposure a
solution of 0.06 mg/ml THt was added to the tank for 1
h. Brain samples (n=12) were obtained at 0.5, 1 and 2 h
after the treatment, which were washed, homogenized and extracted
in alkalic conditions as aforementioned, for the reference
substance.
ESI-Q-TOF/MS
ESI-Q-TOF mass spectra were recorded on a Bruker
Autoflex III TOF/TOF 200 mass spectrometer (Bruker Corporation,
Ettlingen, Germany). The parameters were as follows: Ion mode,
positive; source temperature, 200°C; ion spray voltage, 4.5 kV;
declustering potential, 30 V; and mass range, 75–800
m/z. A 20 µl aliquot of each sample was analyzed by
infusion using a syringe pump for direct injection into ion
sources, at 2 µl/min flow rate. MS/MS parameters were: Collision
energy, 25 V; and collision gas pressure (N2), 4.7 mPa.
GC-MS
Triple-quadrupol Varian mass spectrometer MS 1200
equipped with a CP-3800 gas chromatograph (Agilent Technologies
GmbH, Waldbronn, Germany) was used to detect tramadol and the
metabolites. The analytes were separated on a Varian Factor Four
VF-5 ms capillary column (30 m × 0.25 mm ID, 0.25 µm df; Agilent
Technologies GmbH) with helium 5.0 as the carrier gas (constant
flow, 0.2 ml/min for tramadol detection and 1 ml/min for
desmethyltramadol detection). The front injector temperature was
260°C. The oven temperature initially set at 100°C for 1 min, was
increased to 220°C at 20°C/min, held for 10 min, and then increased
to 300°C at 20°C/min, and finally held for 9 min. Injection was
performed in splitless mode (10:1; 60 sec delay before opening the
splitter). Ionization was performed in electron impact (EI) mode
with electron energy of 70 eV. Analytes were measured in full scan
mode within the mass range, m/z=50−400.
Selected-ion-monitoring (SIM) mode for quantitative analysis from 6
to 40 min was used, m/z 58, 263 for tramadol;
m/z 44, 249 for M2; m/z 58, 121, 249
for M1.
Results
Detection and structural analysis of
tramadol in tissues by ESI-Q-TOF/MS
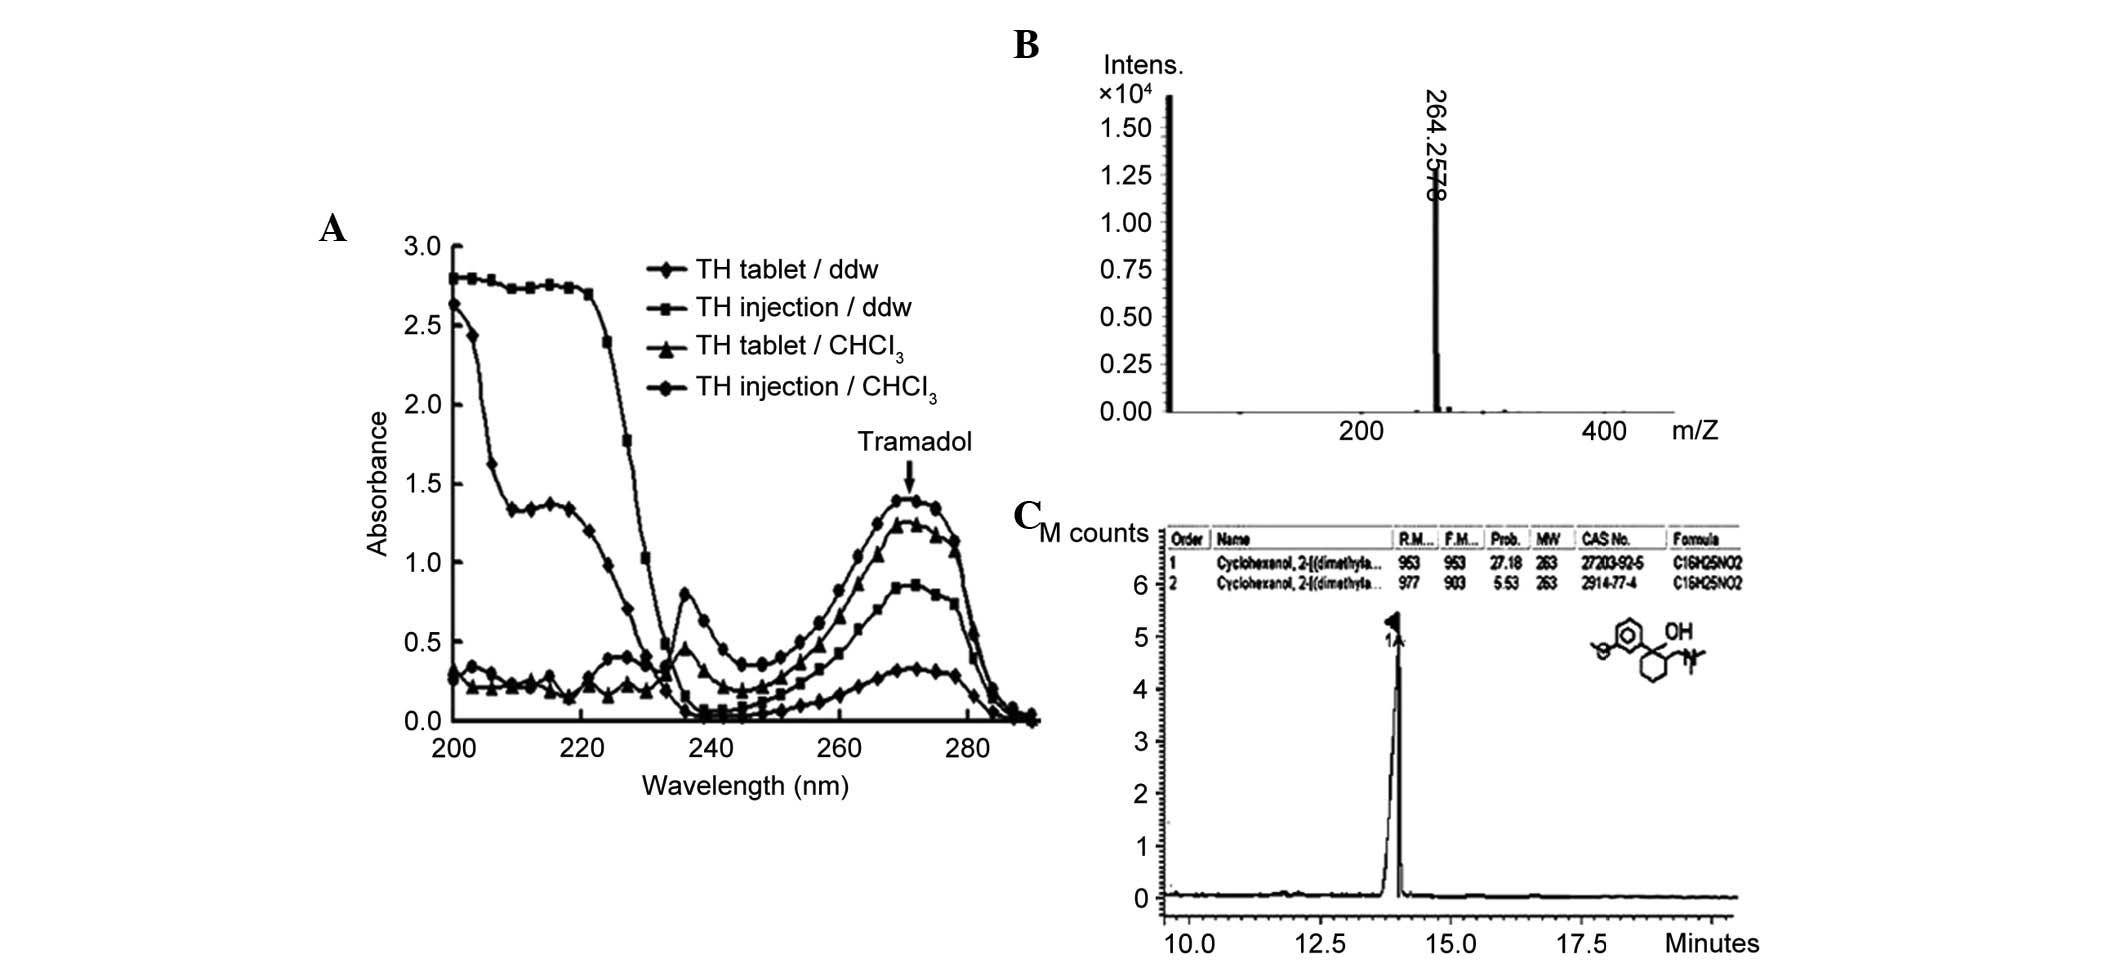
In the current study, two types of tramadol,
injection (THi) and tablets (THt), with the
same main component, were used. The UV absorption spectra of both
types were monitored a single well-defined maximum peak either
dissolved in CHCl3 or water at 271 nm, in the wavelength
range of 200–400 nm with a fixed slit width of 5 nm (Fig. 1A). Furthermore, only a single
molecular ion peak was detected by ESI-Q-TOF/MS or GC-MS, at
m/z 264.2578 (Fig.
1B) and 263 (Fig. 1C),
respectively. No structural differences were observed, and no
interfering absorbance was detected. Therefore, both types were
used as the parallel treatment groups in the subsequent
experiments.
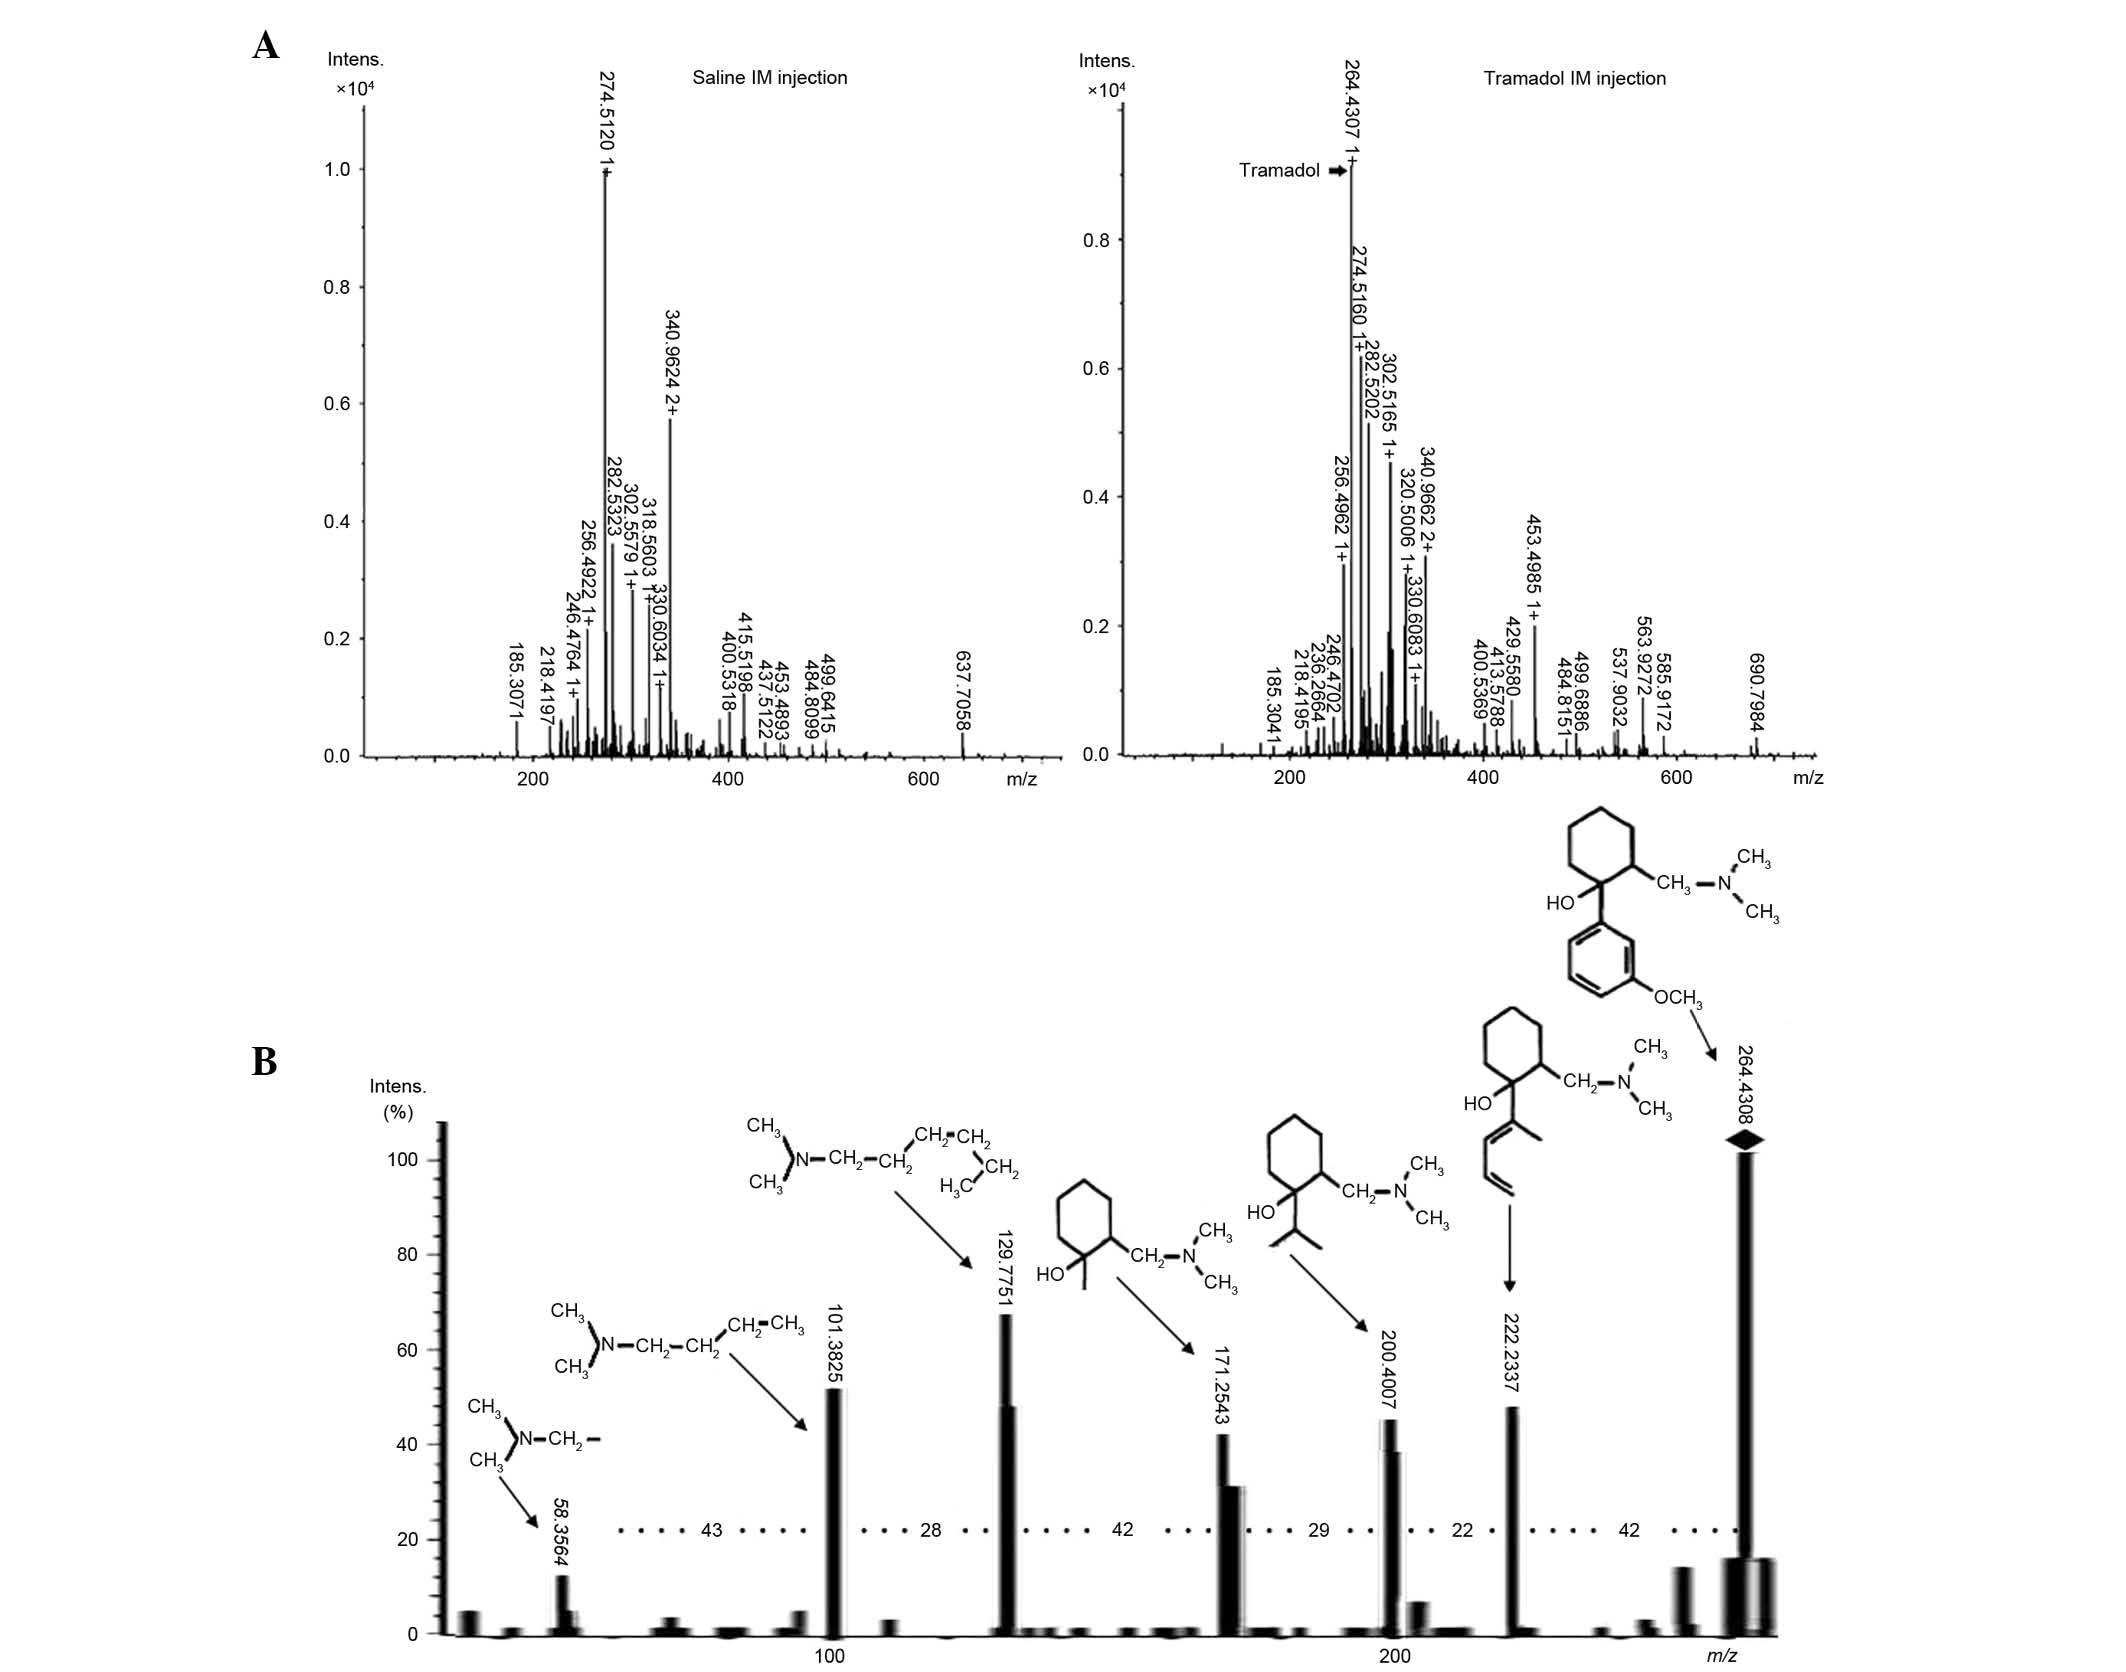
Total mass spectra of the brain tissue samples of
zebrafish are presented in Fig.
2A. By comparing the tramadol group with the untreated group,
an ion peak at m/z 264 in every tissue from tramadol
administration group was easily detected (data not shown). Chosen
parent peaks for further ionization, seven high-resolution fragment
ion peaks were identified, namely at m/z 58.3564,
101.3825, 129.7751, 171.2543, 200.4007, 222.2337 and 264.4308
(Fig. 2B), and the molecular
weight differences between the two adjacent fragments were 43, 28,
42, 29, 22 and 42, respectively. Among them, the peak at
m/z 58.3564 corresponded to
[C3H8N], and on this basis, new chemical
structures were added one by one according to the differences, and
a series of structures were established,
[C6H15N], [C8H19N],
[C10H21NO], [C12H25NO],
[C14H25NO], and finally the structure of
tramadol [C16H25NO2] was obtained.
The details of the whole process of structure analysis are
presented in Table I. Thus,
ESI-Q-TOF/MS is considered to be a rapid and adequately sensitive
method for the detection of tramadol distribution in tissues.
 | Table I.m/z, molecular formula
and chemical structure of fragment ions from tramadol. |
Tramadol distribution in zebrafish
tissues
The compounds of the brain extract in the hexane
fraction, with or without tramadol treatment, were performed to
optimize the analysis conditions. Comparing the chemical
compositions of brain extract from control with tramadol IM
administration, the peaks at m/z 263 were only
detected in the tramadol group, without any interfering peak from
other compounds, within retention time of 13.824 min. It was
exactly the tramadol peak, identified by comparison of its mass
spectra with that from the software library, which was further
confirmed using SIM mode by monitoring for tramadol and
[C3H8N]+ at m/z 263 and 58,
respectively.
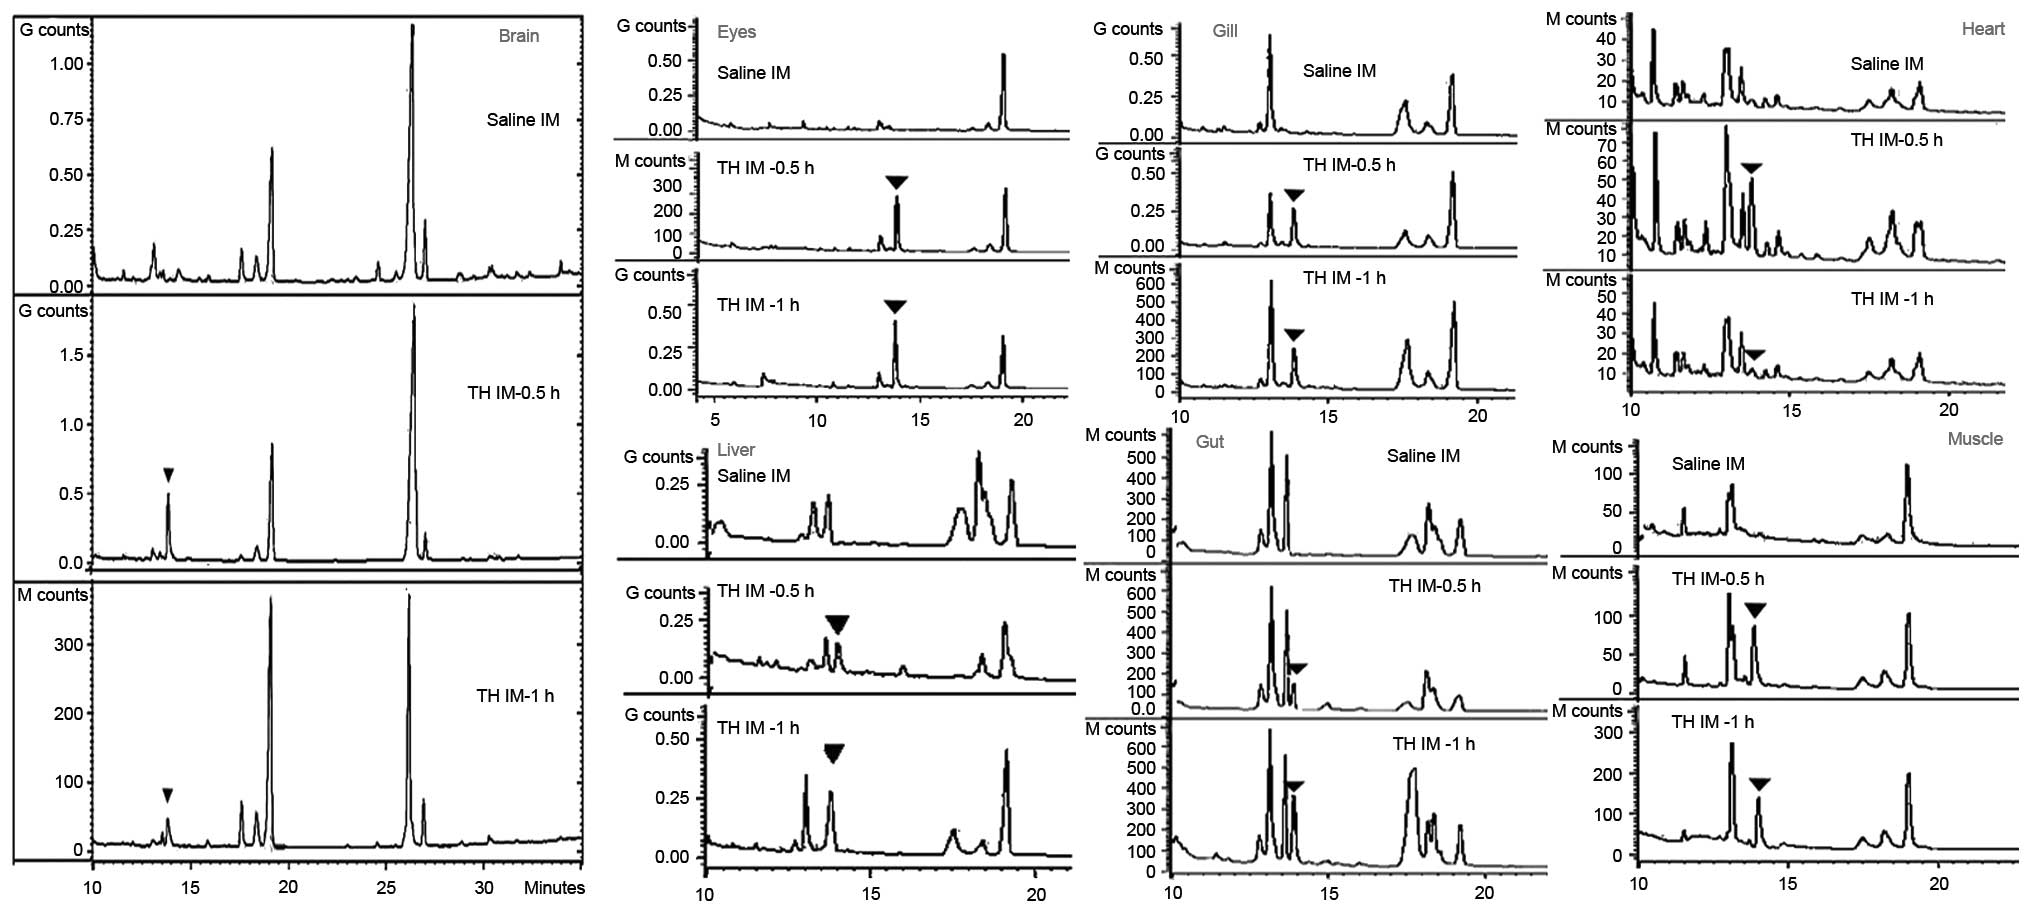
Total ion chromatograms of extracts from brain
tissues, and enlarged portion of ion chromatograms from other six
other tissues are presented in Fig.
3. Using full scan or SIM mode, tramadol peaks were detected in
all tissues from the tramadol administration group, at 0.5 or 1 h
after injection. The results were highly consistent with that of
ESI-Q-TOF/MS. For each tissue, the sample was weighed, prepared by
the same process, and dissolved in η-hexane at the same ratio
(w/v). Therefore, the same tissue type from different treatment
times can be compared. The mean peak area obtained by three
repeated detections was substituted into the formula, namely the
standard calibration curve of tramadol content vs. the mean peak
area: y=0.3669x-0.0184 (R2=0.999, 0≤x≤10 µg) or
y=24.883x-95.96 (R2=0.965, 50≤x≤450 µg). Quantification
of tramadol in tissues was compared, at 0.5 or 1 h after injection.
Quantifying the trend of tramadol in different tissue was
heterogeneous over time. Compared with its quantification at 0.5 h,
tramadol in liver and gut tissues, was observably increased as much
as 56.4 and 742.2 times in the following 0.5 h, respectively. In
eyes, muscle and gill tissues, tramadol was maintained at
relatively stable low levels, with only 1.45-fold increase, and
0.88 or 0.92-fold decrease comparing between 0.5 h and 1 h,
respectively. However, brain and heart tissue experienced a
significant decrease, with 0.096 and 0.01 fold decrease at 1 h
compared with 0.5 h (Fig. 3).
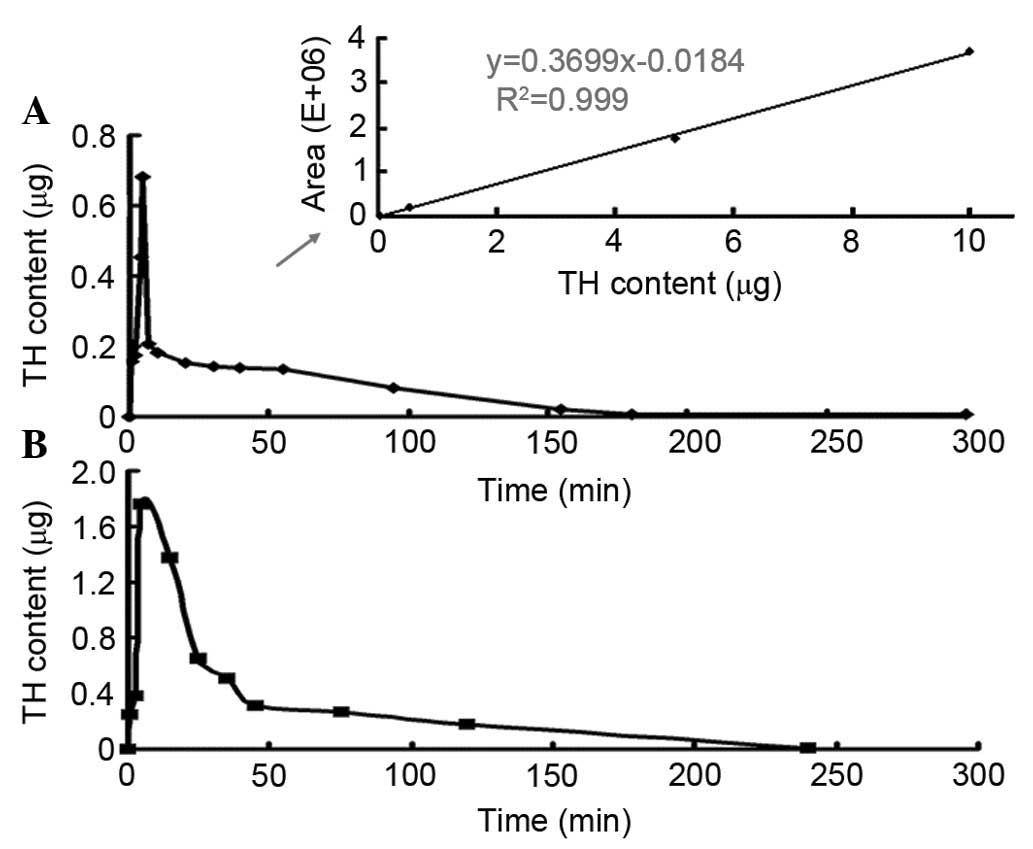
Pharmacokinetics of tramadol in
zebrafish brain
The tramadol content in the brain after IM
administration was presented in Fig.
4. The standard calibration curve in Fig. 4A (indicated by arrow;
y=0.3669x-0.0184; R2=0.999, linear range from 0 to 10
µg), demonstrated a highly linear relationship between the
concentration and its peak area in the GC spectra. A 3-exponential
model best described the brain concentrations of tramadol for the
10 and 25 µg treatments (n=7). With different doses of IM
tramadol administration and detection time, the concentrations in
the brain were similar for injection of 10 (Fig. 4A) and 25 µg (Fig. 4B). The curve indicated an initial
rapid phase, corresponding to the detection of the tramadol within
1 min, and reached peak value at 5 min (Tmax), after a
single dose of 25 and 10 µg IM drug injection. The peak contents of
tramadol were 1.76 (Cmax) and 0.68 µg (Cmax)
for the 25 and 10 µg injections, respectively, and the ratio
between two values was quite similar to that of initial dosage.
Despite similar Tmax, faster drug clearance was observed
with the low-dose group, with the content dropped to initial value
(1.11 µg) by 20 min and was detectable up to 3 h in the low-dose
group, however, it took 80 min to fall to initial value (1.76 µg)
in high-dose groups, and tramadol was detectable up to 4 h after
the treatment.
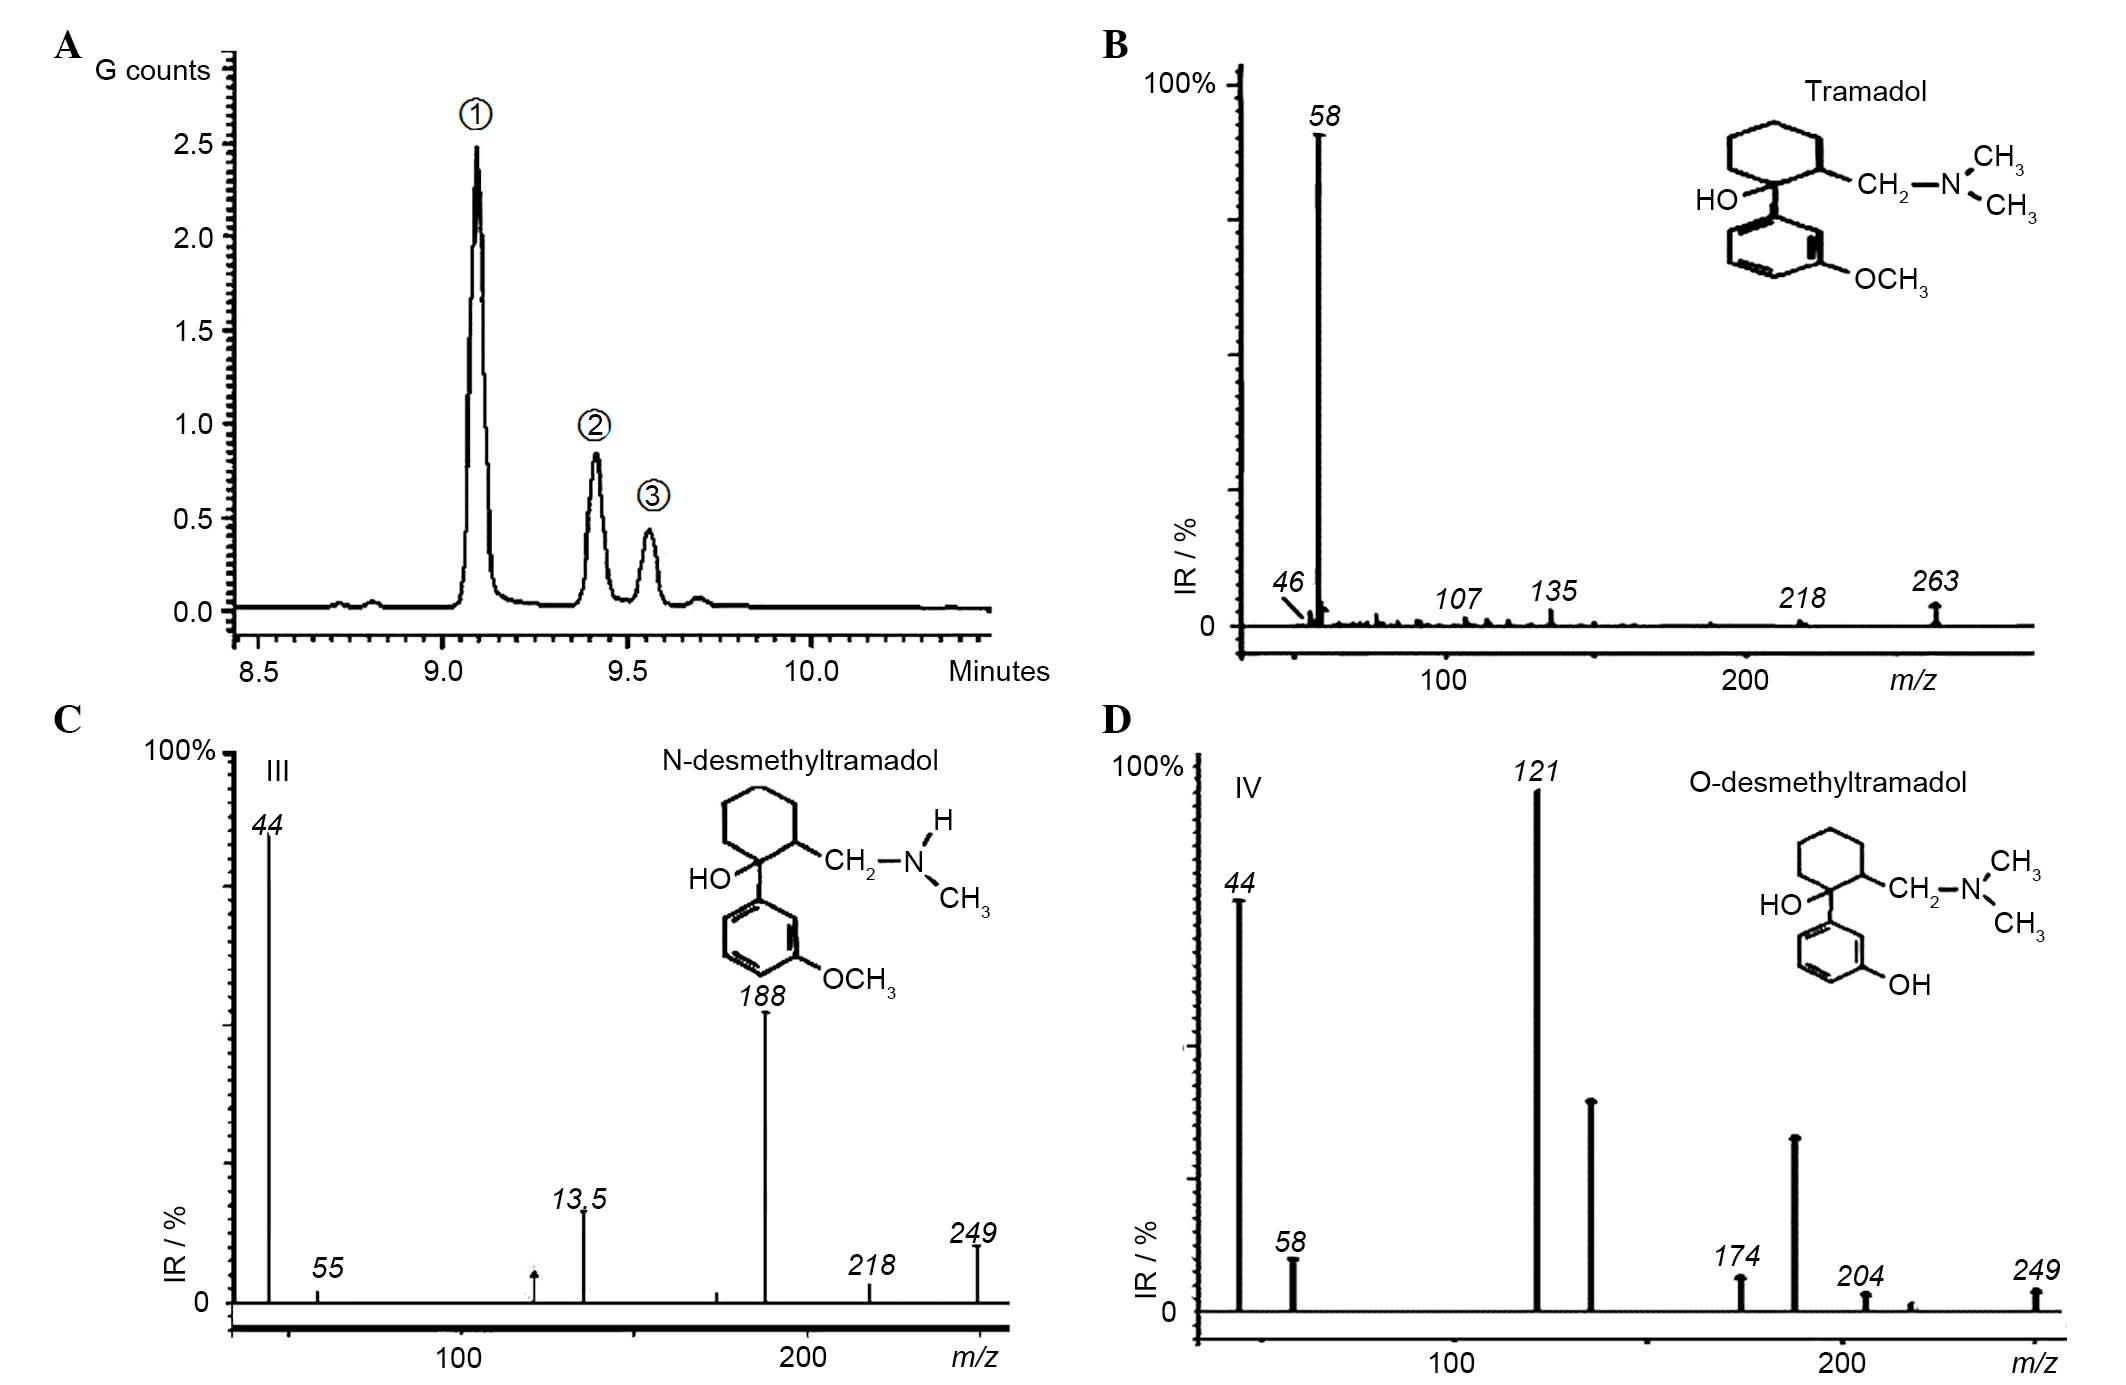
Detection of two primary metabolites,
M1 and M2, in brain tissue
Primary desmethyltramadol reference substances
produced using the previously reported method (25), and were analyzed by GC-MS. Compared
with the aforementioned strategies to detect tramadol alone, the
extraction method and analysis conditions were optimized for
combined determination of tramadol and its primary metabolites. The
total ion chromatogram (Fig. 5A)
and related EI mass spectrograms were obtained (Fig. 5B-D). As presented in Fig. 5A, the three compounds (tramadol, M2
and M1) were separately detected at 9.096, 9.417 and 9.573 min.
Data searching in the library, their EI mass spectra consistent
with those of tramadol, M2 and M1.
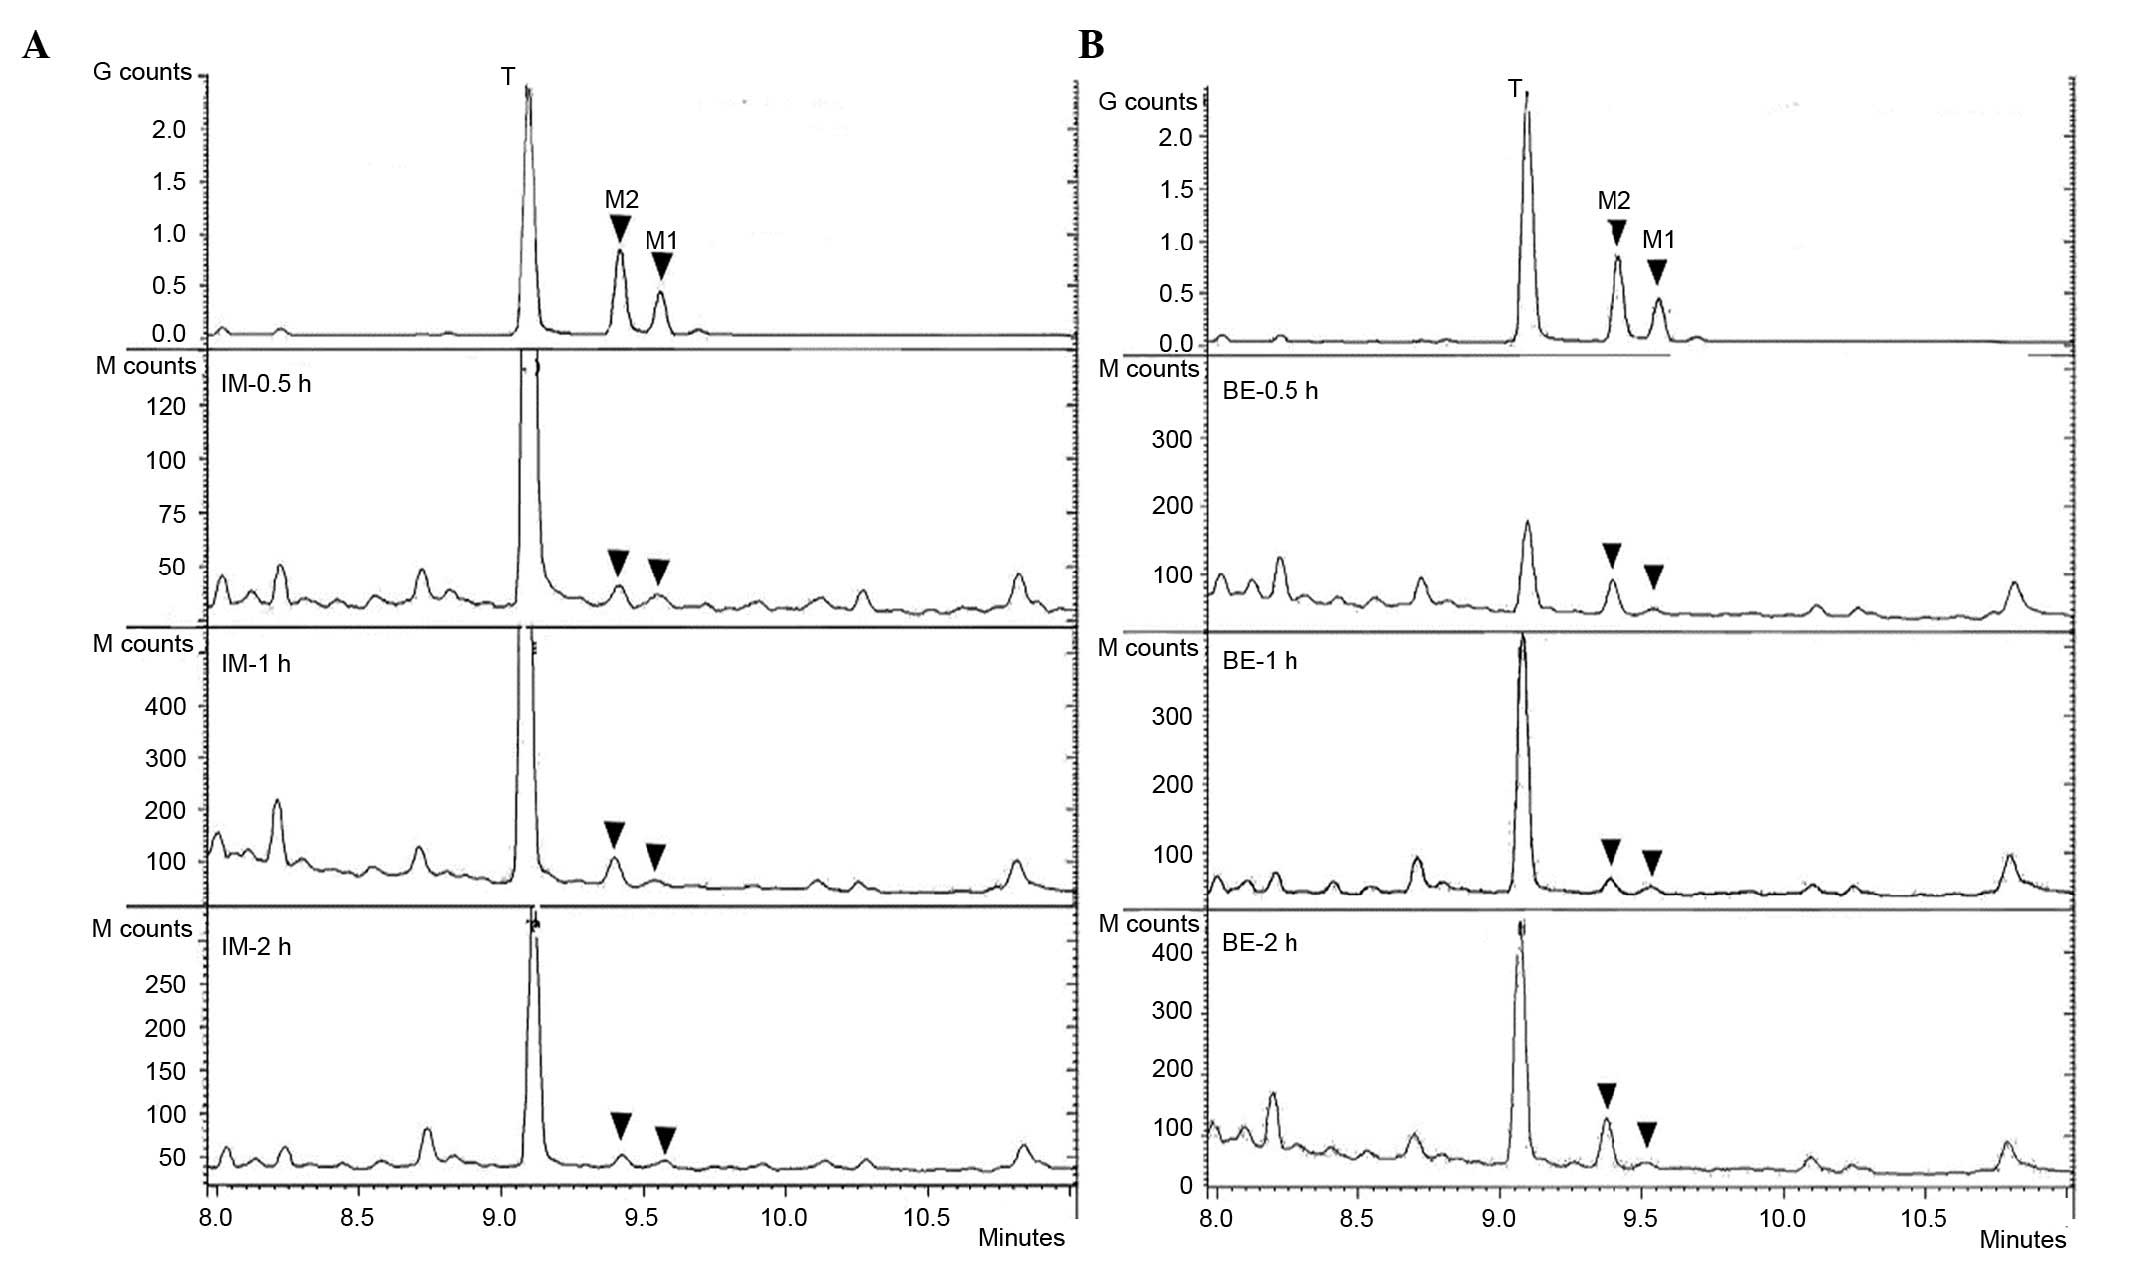
Brain extractions from the IM and bath exposure
treatment groups at 0.5, 1 and 2 h were analyzed under the same
conditions, and magnified chromatograms are presented in Fig. 6. Three novel peaks were present in
all the tramadol treatment groups compared with the control group,
even with different treatment strategies, at different sampling
times, and using different concentrations. The elution time and EI
mass spectra with were consistent with those of the tramadol, M2
and M1 reference samples. Furthermore, distinct changes in
tramadol, M1 and M2 concentrations were observed following the two
different types of administrations. For example, following IM
administration, the concentration of tramadol was very high and
gradually decreased between 0.5 and 2 h. A higher concentration of
M2 was detected at 1 h compared with 0.5 and 2 h IM treatments.
However, in the bath exposure treatment groups, the concentration
of tramadol was higher at 1 h than at 0.5 and 2 h. The
concentration of M2 was variable, with higher values observed at
0.5 and 2 h, and lower at 1 h. Unfortunately, for M1, data analysis
was not always possible due to a very low and variable
concentration. Thus, two primary metabolites M1 and M2 were
detected, however the total amount of M2 was greater than M1, as
the main desmethyl metabolite detected in zebrafish brain.
Discussion
Tramadol is a centrally acting analgesic with
opiate, adrenergic and serotoninergic interactions. The current
study examined the distribution and elimination of tramadol in
zebrafish tissues, the pharmacokinetic profiles and the two major
metabolites of tramadol, M2 and M1, in brain tissue. This was
performed using ESI-Q-TOF/MS and GC-MS, to the best of our
knowledge this is the first report of generally applicable methods
for the determination of tramadol concentration in various tissues,
showed that tramadol distribution and residence in tissues was
rapid separated from other compounds, and further structure
identified by mass spectrometry. However, due to signal
accumulation used to improve the signal-to-noise ratio and the
abundant cluster of ion signals, it remained difficult to quantify
and compare the tramadol concentrations, and to detect the trace
amounts of metabolites by ESI-Q-TOF/MS.
Due to its high resolution, GC-MS has solved the
issues with quantification and identification of minor components
within a mixture. The drug distribution in the present study
demonstrated that, following IM administration, tramadol was
absorbed and distributed to other tissues via the circulatory
system. The drug was eliminated very slowly in the eyes, muscle and
gills, which may maintain the effects of low drug dosage in these
tissues for a long time; however in heart and brain tissue the
tramadol and the metabolites were rapidly eliminated. Finally, in
the liver and gut (tissues involved in drug metabolism and
elimination) the drug concentration was increased over time.
No adverse effects were observed following tramadol
administration in several animal species in previous studies,
however in horses, nausea, confusion, agitation, tremors and
tachycardia were reported (26,27).
In the current study, behavior observations demonstrated that an
increased preference for the oxygen-rich surface water layer in
fish, accompanied by a significant reduction in activity, following
tramadol IM administration or bath exposure. After tramadol IM
administration, fish would gather together at the surface of the
water within 1 min. When the given dosage was increased to 50 µg,
the majority of fish moved to the bottom of the tank and were dead
within 4–5 min. However, a small number of fish slowly recovered
and swam to the water surface layer after ~20 min, whereas, this
abnormal behavior was not observed when the fish were exposed to
pethidine hydrochloride (a more effective analgesic) or in the
saline control group. The time-course of abnormal behavior
following treatment with tramadol was highly similar to the
pharmacokinetic distribution and elimination trends of tramadol in
zebrafish tissues.
The pharmacokinetic profiles and metabolism of
tramadol have been previously reported in humans, mice, camels,
hamsters, rats, guinea-pigs, rabbits and dogs, however, to the best
of our knowledge, this is the first study describing the only
kinetic parameters of tramadol and its N- and O-metabolites in
zebrafish brain tissue. The primary phase I metabolites, namely, M1
and M2, and similar metabolites are produced but in different
amounts. In humans, M1 has been reported to be the major
metabolite, however previous studies demonstrated that M1 was only
marginally produced in equine species, with M2 the major metabolite
produced (22). In the present
study, M2 concentrations in the tissues were higher than M1,
indicating that M2 was the major metabolite produced in brain
tissue, by both routes of administration (IM and BE). Although
relatively low concentrations of M1 were obtained in brain tissue,
the clinical response to tramadol is closely correlated with its
metabolism, because of the different analgesic activity of its
metabolites. M1 is reported to be the main active metabolite that
determines the effectiveness of the drug, because it has an
affinity on µ-opioid receptor 200-fold higher than that of the
parent drug. Another metabolite with a higher affinity than
tramadol for the µ-opioid receptor is M5, however in a previous
study M5 was not detected in brain tissue, and has been
demonstrated to not penetrate the blood-brain barrier (BBB) because
of its high polarity (28).
Zebrafish emerged as a useful model organism to investigate the
effect on drugs on the brain, as its BBB is similar to that of
higher vertebrates (29).
Therefore, in vivo M1 appears to be responsible for the
µ-opioid-derived analgesic effect of tramadol, and zebrafish are
likely to be an appropriate experimental model to analyze the
biological effects of drug abuse and the neurotoxicity of
tramadol.
In conclusion, the present study developed a simple,
cost effective, robust and high throughput analytical method for
simultaneous estimation of the levels of tramadol and its primary
metabolites in zebrafish tissues. The pharmacokinetics and
metabolism data reported in the current study provides information
for the design of future studies involving the use of zebrafish as
a model organism for investigating drug mechanism and
neurotoxicity, and for additional potential screening of
tramadol.
Acknowledgements
This work was financially supported by grants from
the National Natural Scientific Foundation of China (grant nos.
81000769 and 81370048).
References
|
1
|
Grond S and Sablotzki A: Clinical
pharmacology of tramadol. Clin Pharmacokinet. 43:879–923. 2004.
View Article : Google Scholar : PubMed/NCBI
|
|
2
|
Ebrahimzadeh H, Mollazadeh N,
Asgharinezhad AA, Shekari N and Mirbabaei F: Multivariate
optimization of surfactant-assisted directly suspended droplet
microextraction combined with GC for the preconcentration and
determination of tramadol in biological samples. J Sep Sci.
36:3783–3790. 2013. View Article : Google Scholar : PubMed/NCBI
|
|
3
|
El-Sayed AA, Mohamed KM, Nasser AY, Button
J and Holt DW: Simultaneous determination of tramadol,
O-desmethyltramadol and N-desmethyltramadol in human urine by gas
chromatography-mass spectrometry. J Chromatogr B Analyt Technol
Biomed Life Sci. 926:9–15. 2013. View Article : Google Scholar : PubMed/NCBI
|
|
4
|
Ardakani YH, Mehvar R, Foroumadi A and
Rouini MR: Enantioselective determination of tramadol and its main
phase I metabolites in human plasma by high-performance liquid
chromatography. J Chromatogr B Analyt Technol Biomed Life Sci.
864:109–115. 2008. View Article : Google Scholar : PubMed/NCBI
|
|
5
|
Epstein DH, Preston KL and Jasinski DR:
Abuse liability, behavioral pharmacology and physical-dependence
potential of opioids in humans and laboratory animals: Lessons from
tramadol. Biol Psychol. 73:90–99. 2006. View Article : Google Scholar : PubMed/NCBI
|
|
6
|
Ferrari A, Tiraferri I, Palazzoli F and
Licata M: Tramadol abuse in a binge pattern in a young depressed
woman. Eur Addict Res. 20:82–86. 2014. View Article : Google Scholar : PubMed/NCBI
|
|
7
|
Ozok HU, Sagnak L, Ates MA, Karakoyunlu N,
Topaloglu H and Ersoy H: The efficiency of a sedative or analgesic
supplement to periprostatic nerve blockage for pain control during
transrectal ultrasound-guided prostate biopsy-a prospective,
randomized, controlled, double blind study. Arch Med Sci.
6:787–792. 2010. View Article : Google Scholar : PubMed/NCBI
|
|
8
|
Sanchez-Simon FM and Rodriguez RE:
Developmental expression and distribution of opioid receptors in
zebrafish. Neuroscience. 151:129–137. 2008. View Article : Google Scholar : PubMed/NCBI
|
|
9
|
Dooley K and Zon LI: Zebrafish: A model
system for the study of human disease. Curr Opin Genet Dev.
10:252–256. 2000. View Article : Google Scholar : PubMed/NCBI
|
|
10
|
Schenk S and Partridge B: Sensitization
and tolerance in psychostimulant self-administration. Pharmacol
Biochem Behav. 57:543–550. 1997. View Article : Google Scholar : PubMed/NCBI
|
|
11
|
Lockwood B, Bjerke S, Kobayashi K and Guo
S: Acute effects of alcohol on larval zebrafish: A genetic system
for large-scale screening. Pharmacol Biochem Behav. 77:647–654.
2004. View Article : Google Scholar : PubMed/NCBI
|
|
12
|
Zhu W, Li Y, Kream RM and Stefano GB:
Chronic alcohol exposure increases ganglia endogenous morphine
levels. Arch Med Sci. 6:316–320. 2010. View Article : Google Scholar : PubMed/NCBI
|
|
13
|
Gonzalez-Nuñez V, Marrón Fernández de
Velasco E, Arsequell G, Valencia G and Rodríguez RE: Identification
of dynorphin a from zebrafish: A comparative study with mammalian
dynorphin A. Neuroscience. 144:675–684. 2007. View Article : Google Scholar : PubMed/NCBI
|
|
14
|
Sha YF, Shen S and Duan GL: Rapid
determination of tramadol in human plasma by headspace solid-phase
microextraction and capillary gas chromatography-mass spectrometry.
J Pharm Biomed Anal. 37:143–147. 2005. View Article : Google Scholar : PubMed/NCBI
|
|
15
|
Musshoff F, Madea B, Stuber F and Stamer
UM: Enantiomeric determination of tramadol and O-desmethyltramadol
by liquid chromatography- mass spectrometry and application to
postoperative patients receiving tramadol. J Anal Toxicol.
30:463–467. 2006. View Article : Google Scholar : PubMed/NCBI
|
|
16
|
Curticapean A, Muntean D, Curticapean M,
Dogaru M and Vari C: Optimized HPLC method for tramadol and
O-desmethyl tramadol determination in human plasma. J Biochem
Biophys Methods. 70:1304–1312. 2008. View Article : Google Scholar : PubMed/NCBI
|
|
17
|
Tao Q, Stone DJ Jr, Borenstein MR,
Jean-Bart V, Codd EE, Coogan TP, Desai-Krieger D, Liao S and Raffa
RB: Gas chromatographic method using nitrogen-phosphorus detection
for the measurement of tramadol and its O-desmethyl metabolite in
plasma and brain tissue of mice and rats. J Chromatogr B Biomed Sci
Appl. 763:165–171. 2001. View Article : Google Scholar : PubMed/NCBI
|
|
18
|
Tao Q, Stone DJ, Borenstein MR, Codd EE,
Coogan TP, Desai-Krieger D, Liao S and Raffa RB: Differential
tramadol and O-desmethyl metabolite levels in brain vs. plasma of
mice and rats administered tramadol hydrochloride orally. J Clin
Pharm Ther. 27:99–106. 2002. View Article : Google Scholar : PubMed/NCBI
|
|
19
|
Elghazali M, Barezaik IM, Hadi AA Abdel,
Eltayeb FM, Al Masri J and Wasfi IA: The pharmacokinetics,
metabolism and urinary detection time of tramadol in camels. Vet J.
178:272–277. 2008. View Article : Google Scholar : PubMed/NCBI
|
|
20
|
Giorgi M, Del Carlo S, Saccomanni G,
Łebkowska-Wieruszewska B and Kowalski CJ: Pharmacokinetics of
tramadol and its major metabolites following rectal and intravenous
administration in dogs. N Z Vet J. 57:146–152. 2009. View Article : Google Scholar : PubMed/NCBI
|
|
21
|
Vettorato E, Zonca A, Isola M, Villa R,
Gallo M, Ravasio G, Beccaglia M, Montesissa C and Cagnardi P:
Pharmacokinetics and efficacy of intravenous and extradural
tramadol in dogs. Vet J. 183:310–315. 2010. View Article : Google Scholar : PubMed/NCBI
|
|
22
|
Saccomanni G, Del Carlo S, Giorgi M,
Manera C, Saba A and Macchia M: Determination of tramadol and
metabolites by HPLC-FL and HPLC-MS/MS in urine of dogs. J Pharm
Biomed Anal. 53:194–199. 2010. View Article : Google Scholar : PubMed/NCBI
|
|
23
|
Brondani JT, Luna SP, Marcello GC and
Padovani CR: Perioperative administration of vedaprofen, tramadol
or their combination does not interfere with platelet aggregation,
bleeding time and biochemical variables in cats. J Feline Med Surg.
11:503–509. 2009. View Article : Google Scholar : PubMed/NCBI
|
|
24
|
Westerfield M: The Zebrafish BookA guide
for the laboratory use of zebrafish (Danio rerio). 4th. University
of Oregon Press; Eugene, OR: 2007
|
|
25
|
Leis HJ, Fauler G and Windischhofer W:
Synthesis of d1-N-ethyltramadol as an internal standard for the
quantitative determination of tramadol in human plasma by gas
chromatography-mass spectrometry. J Chromatogr B Analyt Technol
Biomed Life Sci. 804:369–374. 2004. View Article : Google Scholar : PubMed/NCBI
|
|
26
|
Ardakani YH and Rouini MR:
Pharmacokinetics of tramadol and its three main metabolites in
healthy male and female volunteers. Biopharm Drug Dispos.
28:527–534. 2007. View
Article : Google Scholar : PubMed/NCBI
|
|
27
|
Shilo Y, Britzi M, Eytan B, Lifschitz T,
Soback S and Steinman A: Pharmacokinetics of tramadol in horses
after intravenous, intramuscular and oral administration. J Vet
Pharmacol Ther. 31:60–65. 2008. View Article : Google Scholar : PubMed/NCBI
|
|
28
|
Gillen C, Haurand M, Kobelt DJ and Wnendt
S: Affinity, potency and efficacy of tramadol and its metabolites
at the cloned human mu-opioid receptor. Naunyn Schmiedebergs Arch
Pharmacol. 362:116–121. 2000. View Article : Google Scholar : PubMed/NCBI
|
|
29
|
Jeong JY, Kwon HB, Ahn JC, Kang D, Kwon
SH, Park JA and Kim KW: Functional and developmental analysis of
the blood-brain barrier in zebrafish. Brain Res Bull. 75:619–628.
2008. View Article : Google Scholar : PubMed/NCBI
|