Introduction
Hepatocellular carcinoma (HCC) is the most common
type of liver cancer. It is the fifth most frequently occurring
cancer worldwide and the third most common cause of
cancer-associated mortality (1).
Numerous advances have been made in the understanding of the
pathogenesis of HCC. Various signal transduction pathways are
implicated in HCC, including the Wnt/β-catenin (2), pRb (3,4),
mitogen-activated protein kinase (5,6) and
Ras signaling pathways (7), and
these are being extensively studied to identify potential
biomarkers.
HCC is predominantly associated with cirrhosis,
which is associated with alcohol, hepatitis B, hepatitis C and
non-alcoholic fatty liver disease. Liang et al (8) conducted a meta-analysis and
demonstrated that primary biliary cirrhosis is associated with a
greater risk of HCC. The regulation/dysregulation of apoptosis of
(pre) neoplastic cells as well as proliferation may be important in
the process of hepatocarcinogenesis (9). Laouirem et al (10) reported that progression from
cirrhosis to cancer is associated with early ubiquitin
post-translational modifications. Inhibition of inflammation and
mitosis may delay the development of HCC from hepatitis
virus-associated cirrhosis (11).
Geranylgeranyl diphosphate synthase 1 may be important during the
development of HCC from cirrhosis and is of clinical significance
for the biological characterization of HCC (12). However, the molecular mechanisms
underlying the progression of cirrhosis to HCC remain to be fully
elucidated.
Gene expression profiling has been widely used to
detect hepatocarcinogenesis and to identify its underlying
molecular mechanisms. Nam et al (13) performed gene expression profiling
to investigate molecular changes from dysplastic nodules to HCC.
Villanueva et al (14)
combined clinical, pathological and gene expression data to predict
recurrence of HCC. Jia et al (15) identified potential biomarkers of
HCC using gene expression profiling.
Reanalyzing existing gene expression data with
bioinformatics tools may provide novel insights into the
pathogenesis of HCC. The present study therefore analyzed gene
expression data of HCC and cirrhosis samples to identify critical
genes involved in the development of cirrhosis to HCC. The findings
of the present study may improve the understanding of the molecular
mechanisms underlying HCC.
Materials and methods
Gene expression data
A total of five gene expression datasets (GSE63898,
GSE17548, GSE14323, GSE60502 and GSE62232) were downloaded from
Gene Expression Omnibus (ncbi.nlm.nih.gov/geo/; Table I). Cirrhosis HCC samples from
GSE14323 were excluded. In addition, nine sets of gene expression
data were collected with HG-U133A whereas others were collected
with HG-U133A_2 from Gene Expression Omnibus (GEO). To reduce
systematic errors, the 9 samples (GSM358103, GSM358104, GSM358105,
GSM358106, GSM358107, GSM358108, GSM358109, GSM358110, GSM358111)
were removed. Finally, 441 HCC and healthy samples were included in
dataset HCC, and 234 cirrhosis samples were included in
dataset C.
 | Table I.Summary of five gene expression
datasets. |
Table I.
Summary of five gene expression
datasets.
| Accession | Sample groups | No. of samples | Platform |
|---|
| GSE63898 | Cirrhosis/HCC | 396 | HG-U219 |
| GSE17548 | Cirrhosis/HCC | 37 | HG-U133_Plus_2 |
| GSE14323 |
Healthy/cirrhosis/HCC/cirrhosisHCC | 124 |
HG-U133A/HG-U133A_2 |
| GSE60502 | Healthy/HCC | 36 | HG-U133A |
| GSE62232 | Healthy/HCC | 91 | HG-U133_Plus_2 |
Pretreatment of raw data was conducted with package
affy (http://www.bioconductor.org/packages/release/bioc/html/affy.html)
(16) and probes were mapped into
genes. Raw data was acquired using four different platforms and a
total of 12,012 common genes were selected for the following
analysis. Normalization was performed using the quantiles method
(16). Gene expression data were
divided into two datasets: HCC (HCC and healthy samples) and C
(cirrhosis samples).
The comparability of the HCC and C
datasets was evaluated by correlations of gene expression levels
and connectivity. A high correlation indicated high comparability.
Connectivity was calculated using the softConnectivity
function from package Weighted Gene Co-expression Network
Analysis (WGCNA; labs.genetics.ucla.edu/horvath/CoexpressionNetwork/Rpackages/WGCNA/)
(17) with 5,000 randomly selected
genes.
Cluster analysis was conducted with hclust
(http://www.r-tutor.com/gpu-computing/clustering/hierarchical-cluster-analysis)
to exclude outliers. Finally, 394 HCC samples and 47 healthy
samples were included in dataset HCC, and 233 cirrhosis
samples were included in dataset C.
Construction of weighted gene co-expression
networks. A weighted gene co-expression network was constructed for
dataset HCC with package WGCNA (2). Cluster analysis was performed with
the flashClust function from package flashClust
(labs.genetics.ucla.edu/horvath/htdocs/CoexpressionNetwork/Rpackages/flashClust/)
and modules were identified with the cutreeHybrid function
from package dynamicTreeCut
(labs.genetics.ucla.edu/horvath/htdocs/CoexpressionNetwork/BranchCutting/).
The preservation of modules in dataset C was examined with
the modulePreservation function from package
WGCNA.
Screening of hub genes
Module Eigengene (ME) was calculated with the
moduleEigengenes function from package WGCNA.
Connectivity between each gene and ME was calculated with
signedKME, which indicated the module membership (MM) of the
genes in the module. Genes with high MM values were regarded as hub
genes.
Functional annotations
Genes with MM >0.6 were regarded as
module-specific genes. All module-specific genes were identified
and functional enrichment analysis was performed with the Database
for Annotation, Visualization and Integration Discovery (david.abcc.ncifcrf.gov/) (18), including Gene Ontology (GO) terms
and Kyoto Encyclopedia of Genes and Genomes (KEGG) pathways
(19). Functional networks were
constructed with the Enrichment Map (20) in Cytoscape (www.cytoscape.org) (21).
Results
HCC and C datasets
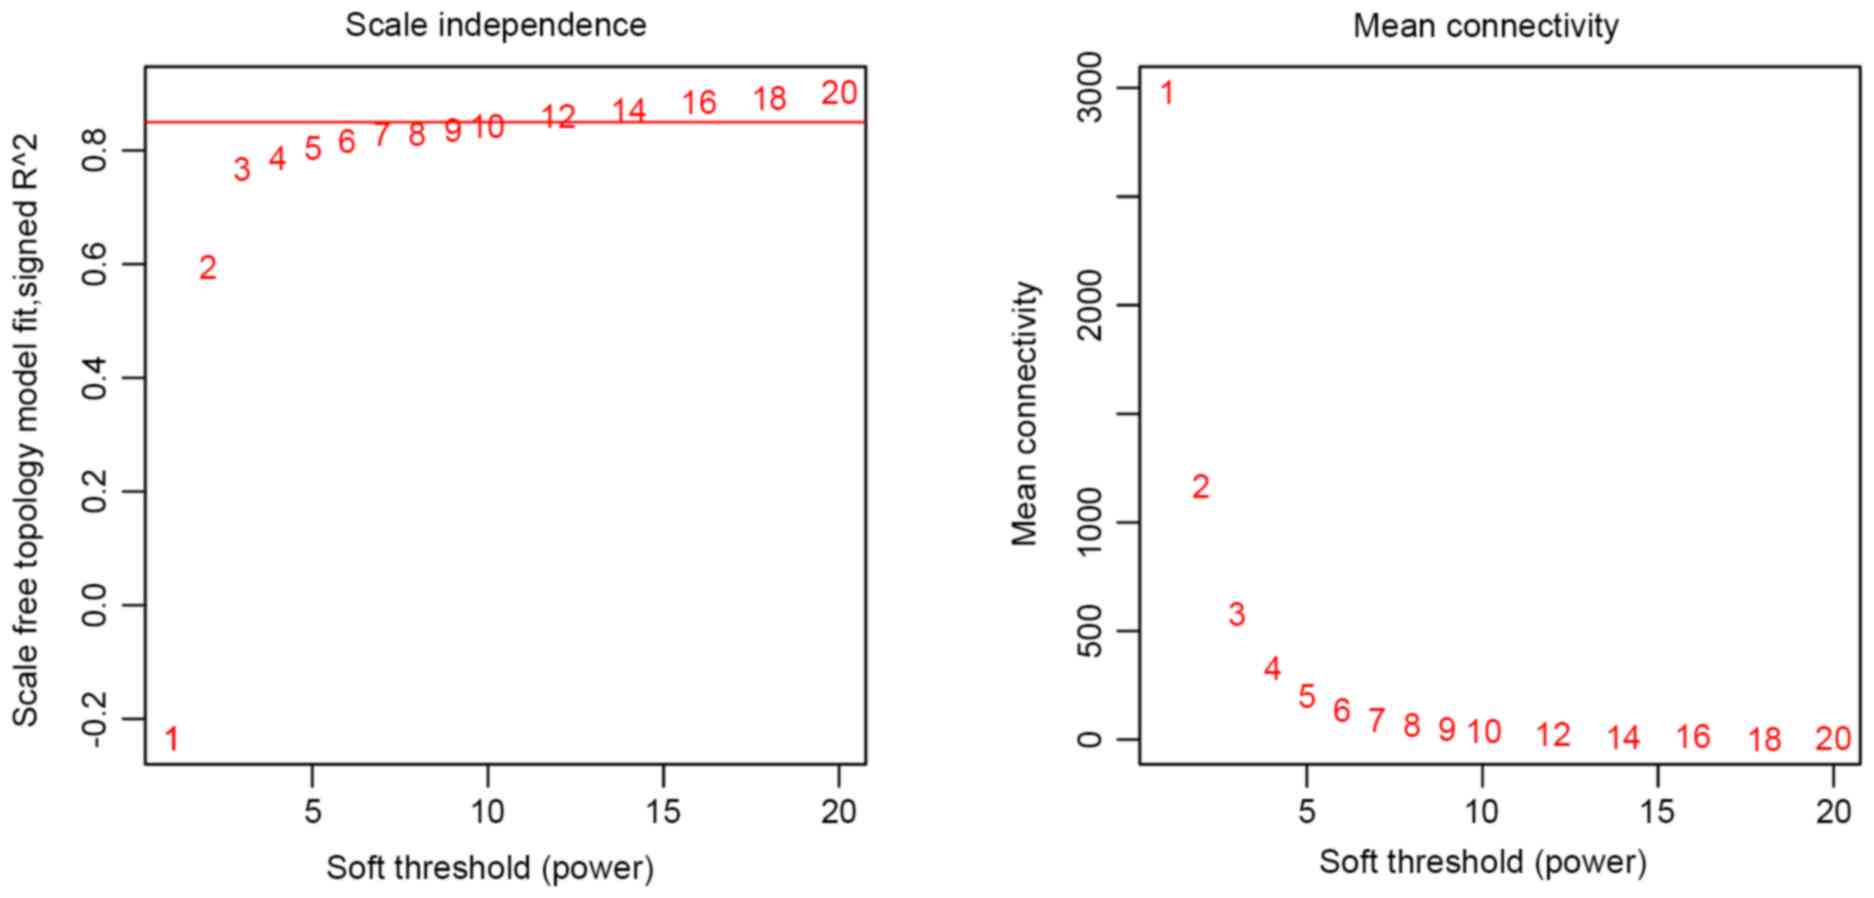
The comparability between the HCC and C datasets was
examined with correlations of gene expression levels and
connectivity. To calculate connectivity, weighted gene
co-expression networks were constructed with 5,000 genes. As
described previously (22) the
optimal soft threshold power was set as 7 (Fig. 1).
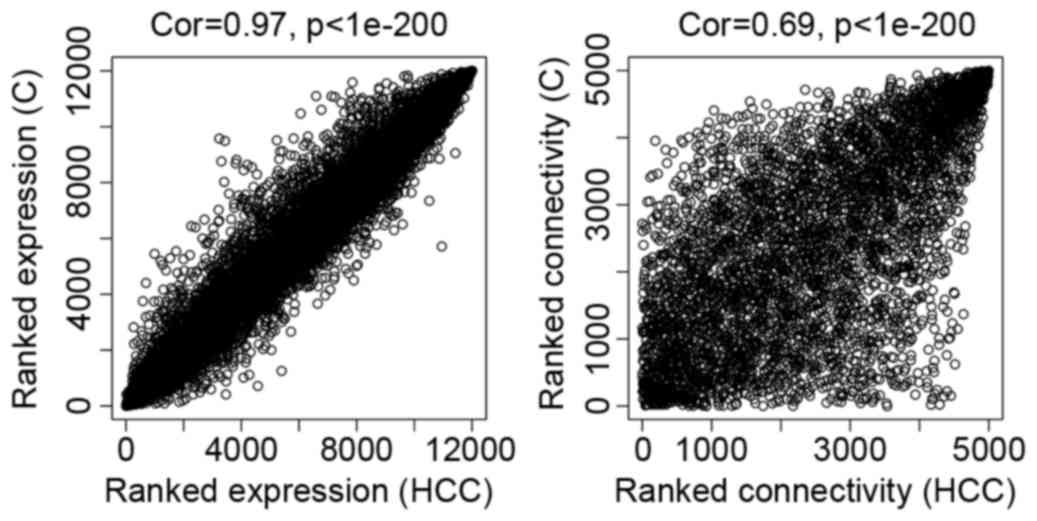
As presented in Fig.
2, the comparability between dataset HCC and dataset
C was good. The correlation of gene expression was 0.97 and
the connectivity value was 0.69.
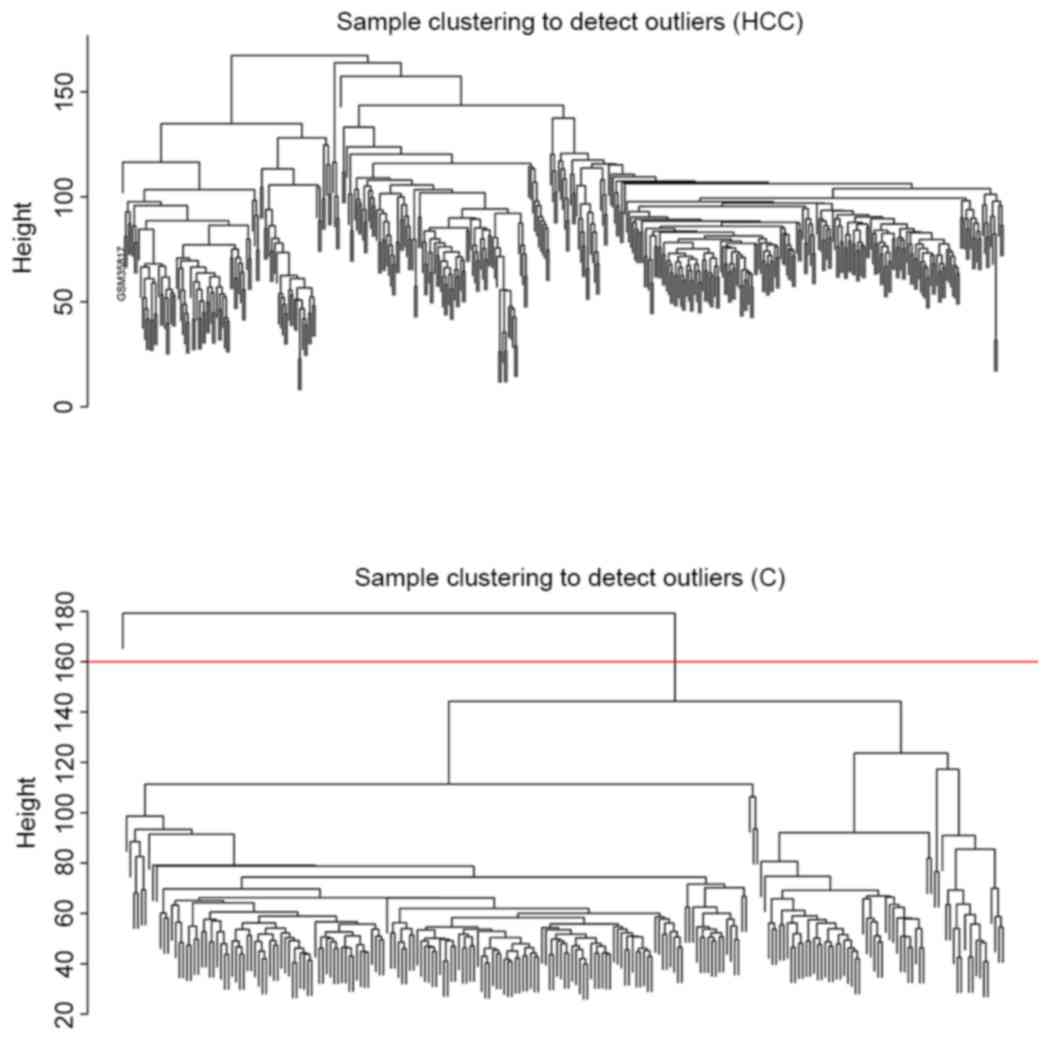
The cluster analysis result presented in Fig. 3 revealed that no outlier sample was
observed in dataset HCC, whereas one outlier sample was
detected in dataset C. Therefore, 394 HCC and 47 healthy
samples were included in dataset HCC and 233 cirrhosis
samples were included in dataset C.
Gene co-expression network and
modules
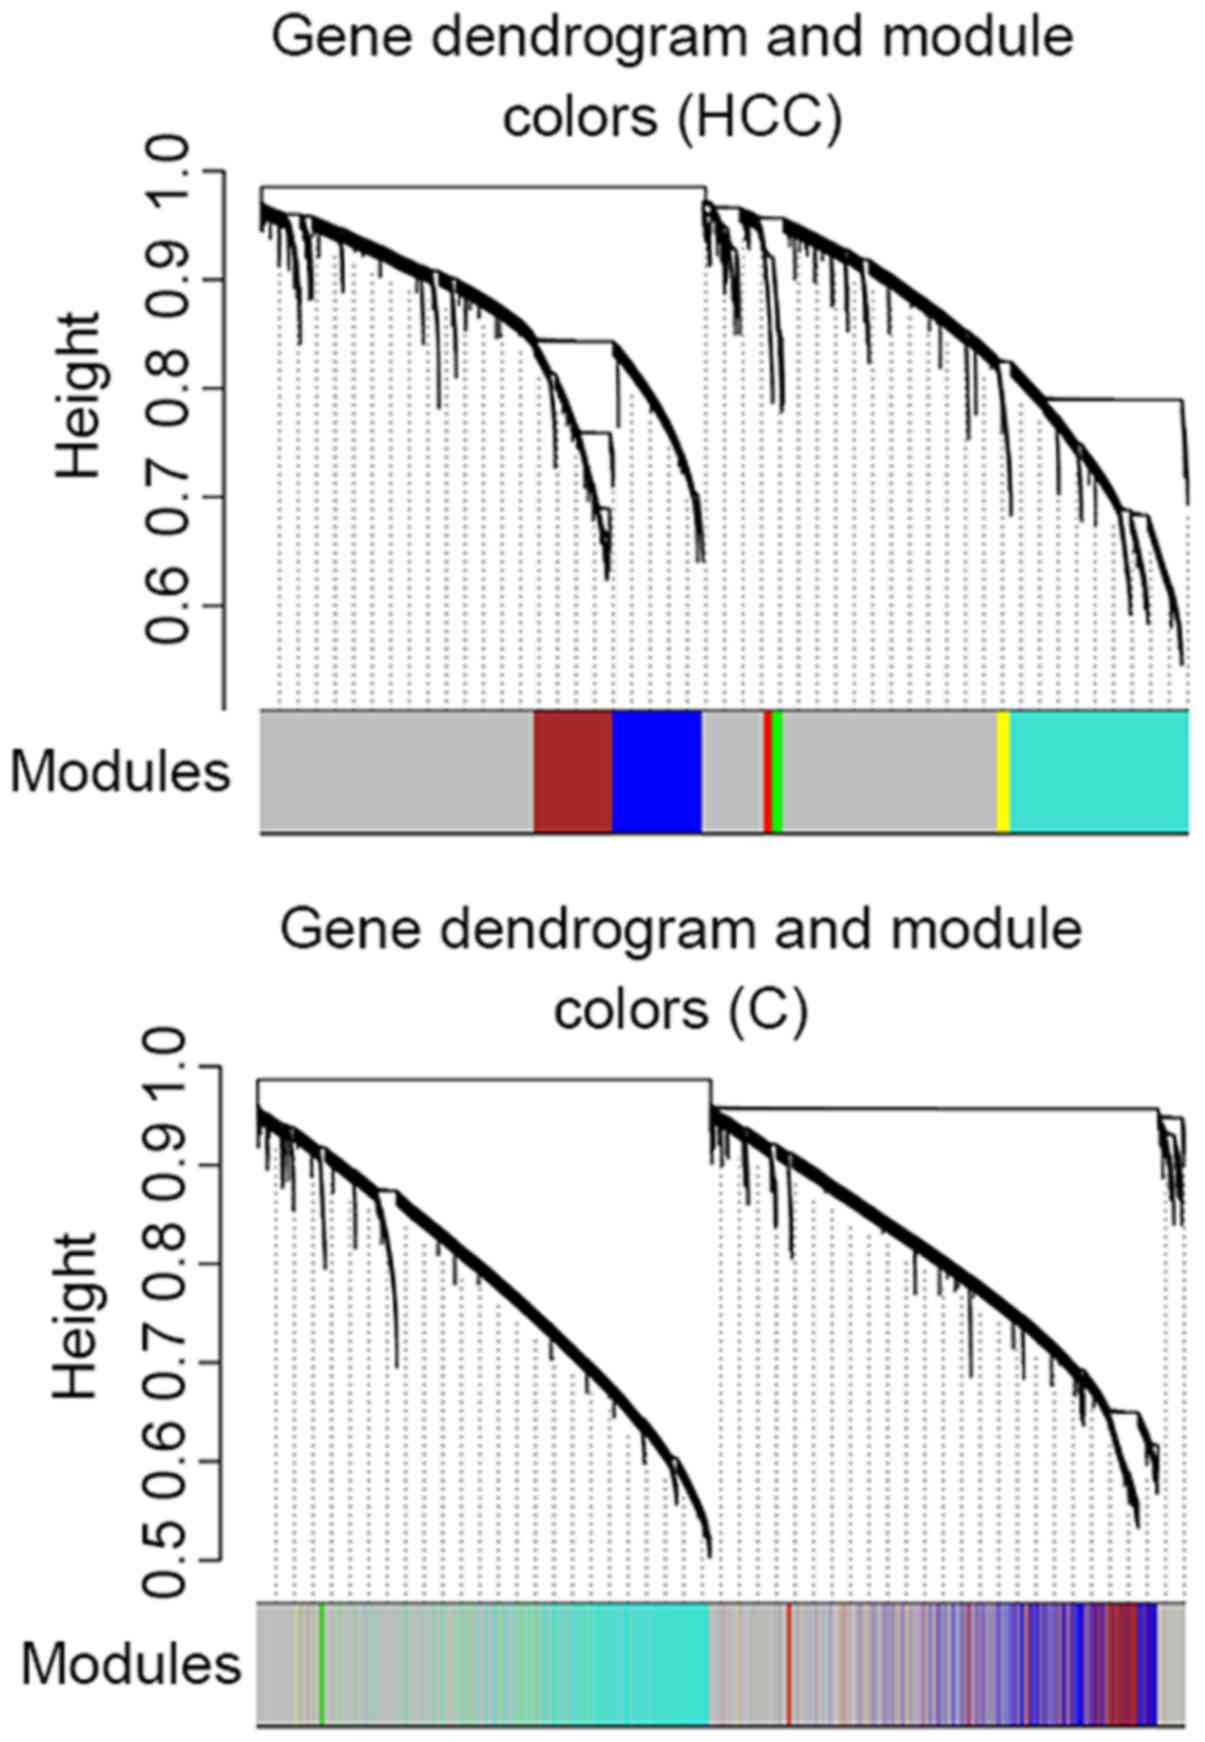
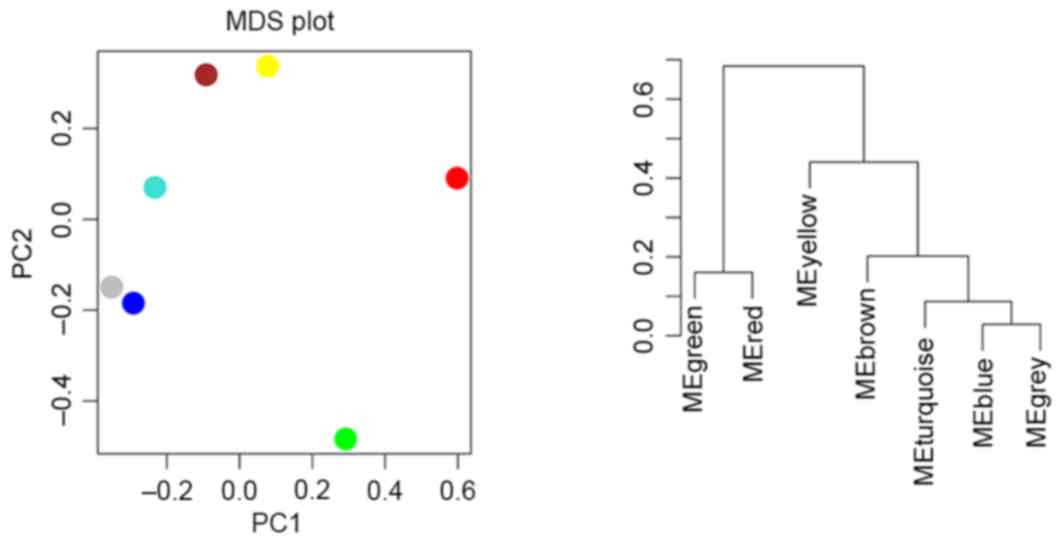
A total of 6 modules were identified in the weighted
gene co-expression network of dataset HCC (blue, brown,
turquoise, green, red and yellow; Fig.
4; Table II). The cluster
analysis result of dataset C revealed that turquoise, red,
blue and green modules demonstrated a high preservation (Fig. 4).
| Table II.Modules identified by weighted gene
co-expression network analysis-based clustering. |
Table II.
Modules identified by weighted gene
co-expression network analysis-based clustering.
| Module | No. of genes |
|---|
| Blue | 3,635 |
| Brown | 2,121 |
| Turquoise | 5,360 |
| Green | 755 |
| Red | 606 |
| Yellow | 1,004 |
The preservation of these modules was examined with
modulePreservation from package WGCNA and the results
are presented in Table III.
Unclassified genes were included in module grey whereas random
genes were included in module gold. Theoretically, the z-score of
conservative module should be greater than that of modules grey and
gold. Modules blue, brown and turquoise demonstrated a greater
preservation compared with module yellow, which exhibited the
lowest preservation.
| Table III.Preservation of modules between the
hepatocellular carcinoma and cirrhosis datasets. |
Table III.
Preservation of modules between the
hepatocellular carcinoma and cirrhosis datasets.
| Module | No. of genes | Z-score |
|---|
| Blue | 400 | 43.785690 |
| Brown | 400 | 42.285353 |
| Turquoise | 400 | 40.996754 |
| Grey | 400 | 22.025369 |
| Green | 139 | 16.709992 |
| Red | 101 | 12.126042 |
| Gold | 100 |
9.438428 |
| Yellow | 168 |
6.539301 |
Clustering of modules
Cluster analysis and principle component analysis
were performed for the modules. As presented in Fig. 5, two clusters were revealed, one
containing modules red and green and the other containing the
remaining 5 modules.
Functional annotations of modules
Significantly over-represented GO terms and KEGG
pathways were assigned for genes with MM >0.6. Functional
annotation networks were constructed with the plug-in
EnrichmentMap of Cytoscape. A node represented a GO term. If
two nodes shared >50% genes, a line connected the two nodes.
Cluster analysis was performed for nodes based on connectivity
using another plug-in, ClusterOne of Cytoscape. A node
cluster should have no less than 10 nodes. The clusters with less
than 10 nodes were labeled artificially according to similarity of
annotations.
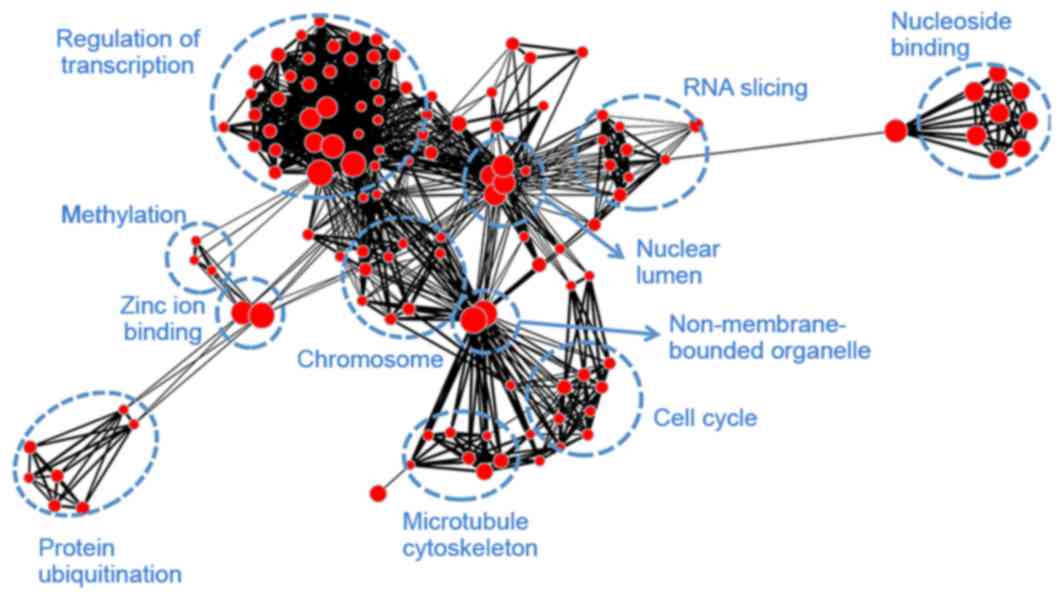
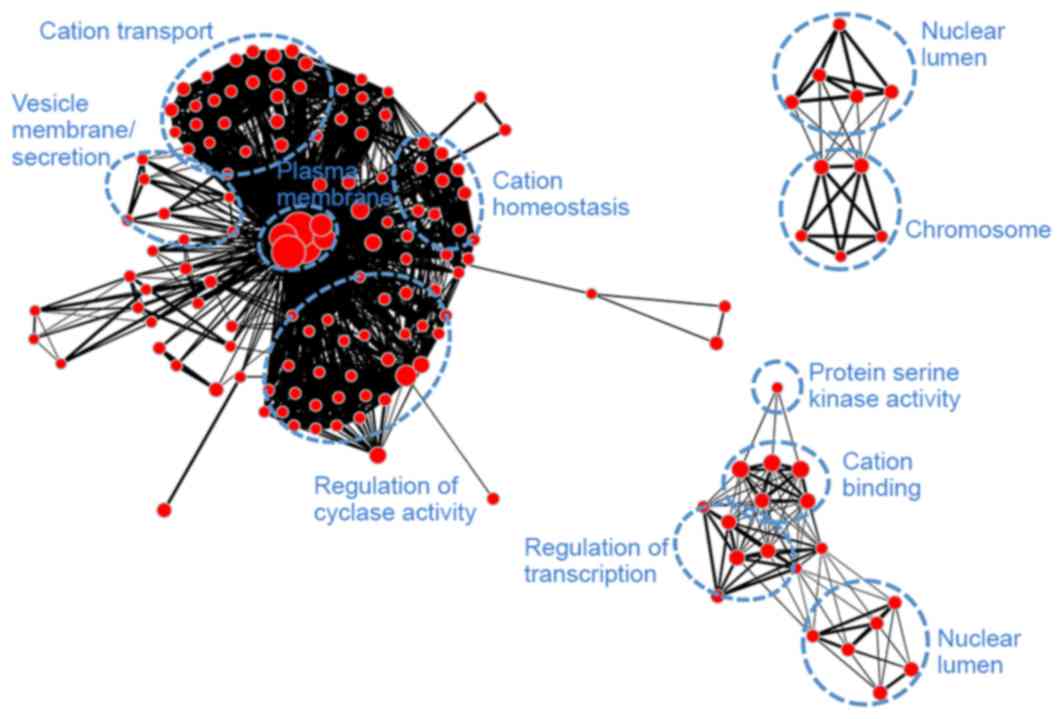
Module blue (Fig.
6) was associated with transcription (regulation of
transcription, RNA slicing and nuclear lumen), mitosis (histone
protein methylation, chromosome organization, cell cycle and
microtubule cytoskeleton), as well as protein ubiquitination and
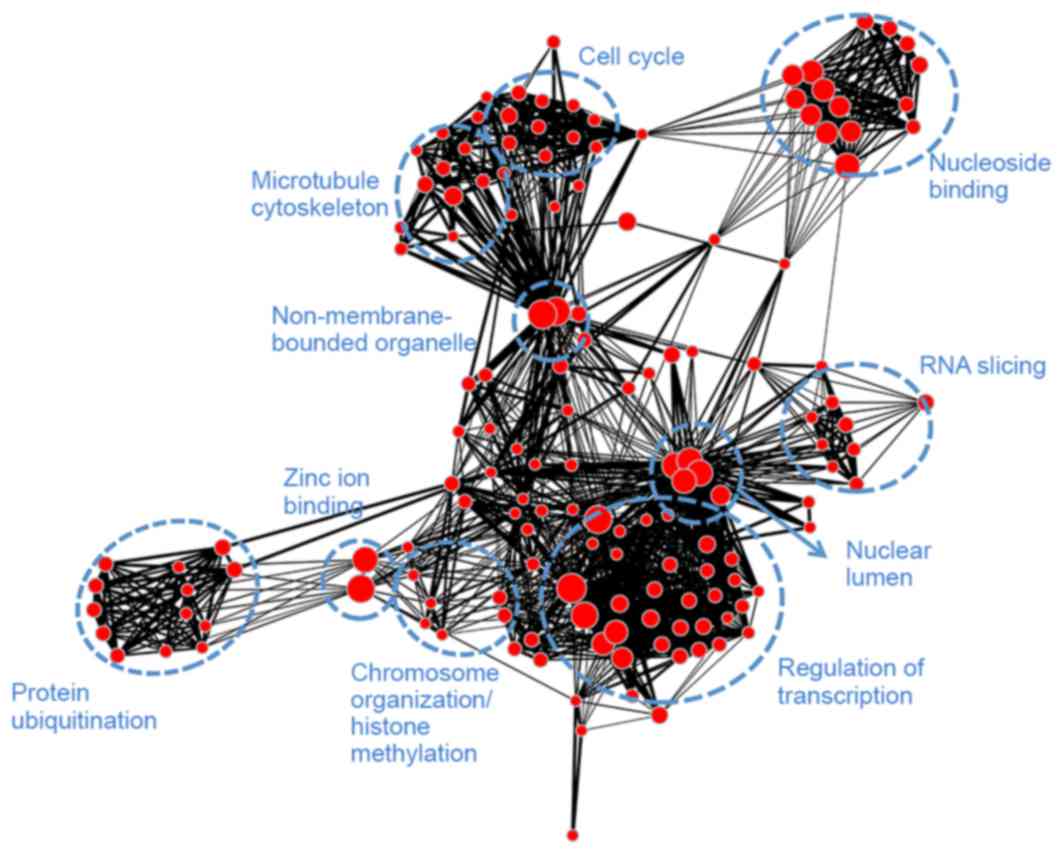
adenosine triphosphate binding. Module brown (Fig. 7) had similar biological functions
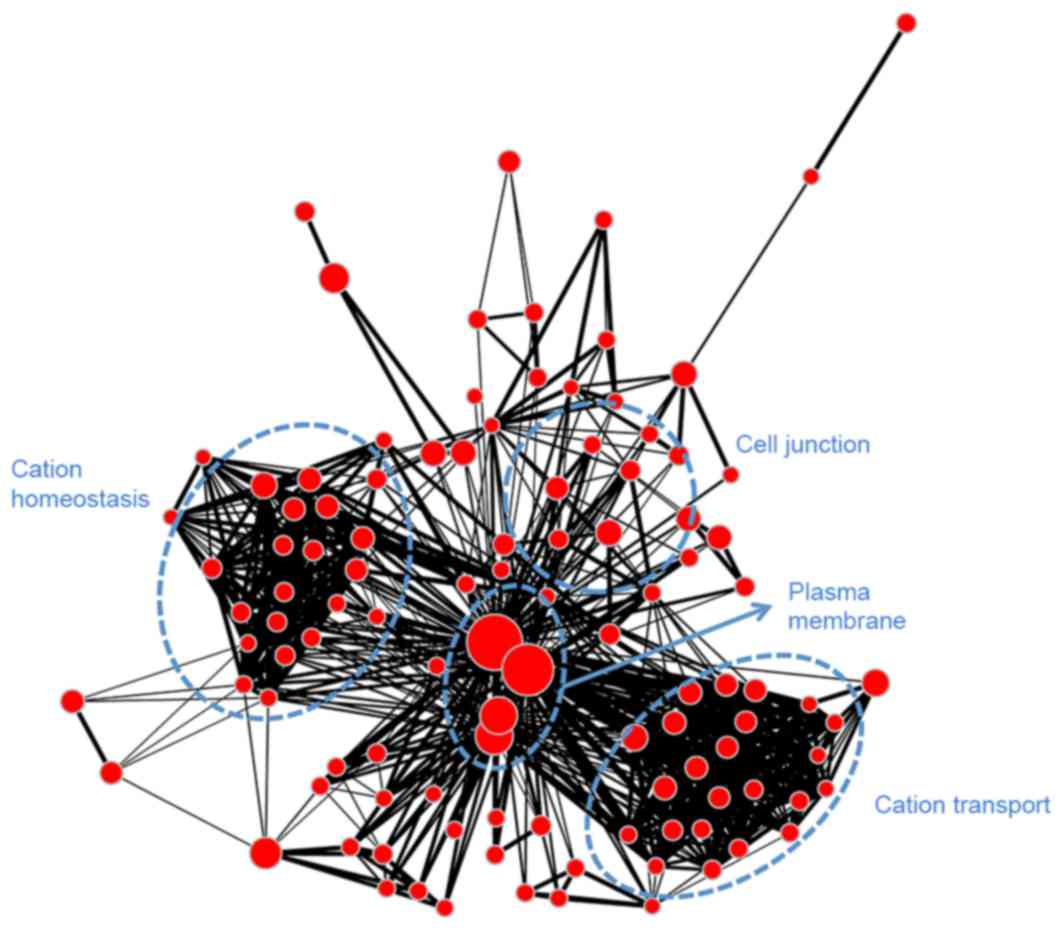
to module blue and was associated with mitosis. Module turquoise
(Fig. 8) was associated with ion
channels, cation transportation and cation homeostasis. Module
yellow (Fig. 9) demonstrated
similarities with module turquoise and was additionally associated
with secretion and regulation of cyclase activity.
Hub genes
The top 10 hub genes of modules were identified for
databases HCC and C (Table IV). The top 20 hub genes of
modules for database HCC are presented in Table V, in which the overlapped hub genes
with database C were marked as bold. The number of
overlapping hub genes may reflect the preservation of the module.
Module yellow demonstrated low preservation and thus these hub
genes may distinguish cirrhosis from HCC. Therefore, functional
annotations were given for these genes (P<0.05; Table VI). Cytokine activity and
cytokine-cytokine receptor interaction were significantly
over-represented in the hub genes. Chemokine (C-C motif) ligand 22
(CCL22), cardiotrophin 1 (CTF1) and interleukin-19 (IL-19) were
three cytokines identified that may be important in the progression
of HCC.
| Table IV.Hub genes identified in
hepatocellular carcinoma and cirrhosis datasets. |
Table IV.
Hub genes identified in
hepatocellular carcinoma and cirrhosis datasets.
| Module | Hub genes |
|---|
| Blue | CUL1, EPN1, LSM14B,
METTL2B, NACA2, PDAP1, POM121, TIGD6, ZNF440, ZNF480 |
| Brown | AFF4, CHM, EXOSC1,
FOXN2, PPP4R2, SLC39A9, SMEK2, THRAP3, WRNIP1, ZNF770 |
| Turquoise | ADRBK1, CXXC1,
DTX2P1-UPK3BP1-PMS2P11, EPOR, GDPD2, KRTAP5-8, PAX8, PNPLA2, PRB1,
WAS |
| Grey | ATG16L1, EPN1,
GPATCH1, MAP2K7, METTL2B, PRDM10, PRMT7, RBBP5, SBNO1, ZNF37A |
| Green | ERN1, FGD2, H2AFJ,
HIPK3, KRTAP1-3, LNPEP, PACS1, PACS2, SH3GLB2, ZSWIM1 |
| Red | ARL15, CBX4, ETV3,
HSD17B1, KCNK3, LIN7A, MAGIX, TMOD3, WHSC1L1, ZKSCAN8 |
| Yellow | C6orf15, CETN1,
FAM155B, GJA8, KCNS1, NTRK3, OR1F1, PLCD1, SLC39A2, TMPRSS15 |
| Table V.Hub genes identified in the
hepatocellular carcinoma dataset. |
Table V.
Hub genes identified in the
hepatocellular carcinoma dataset.
| Module | No. of overlapped
genes | Hub genes |
|---|
| Blue | 9 | ALOX15, AMELX,
CYP2F1, EPN1, HNRNPF, LSM14B, METTL2B, NACA2, PDAP1, POM121,
POMZP3, PRR14L, PRR7, STYK1, TIGD6, ZBTB6, ZFP69B, ZNF440, ZNF480,
ZNF674 |
| Brown | 10 | AFF4, CHM, DDX6,
EXOSC1, FAM204A, FBXO22, FOXN2, MAP3K1, MRPL52, NR2C2, PAFAH1B2,
PPP4R2, QSER1, RARS2, SLC39A9, SMEK2, THRAP3, USP19, WRNIP1,
ZNF770 |
| Turquoise | 10 | ADRBK1, CACNA1G,
CHRNB2, CXXC1, DMWD, DTX2P1-UPK3BP1-PMS2P11, EPOR, GDPD2, GLP1R,
GRIK5, KCNJ5, KIR2DL1, KRTAP5-8, NCR2, PADI1, PAX8, PNPLA2,
PRB1,WAS, WDTC1 |
| Grey | 2 | CEP295, EDC4,
EIF3B, GGA3, GPATCH1, GPATCH2, ILKAP, LSM14B, METTL2B, MSL2, OCRL,
PDAP1, POM121, POMZP3, PRR14L, UBE3B, ZBTB6, ZNF440, ZNF480,
ZNF573 |
| Green | 10 | EFNA2, ELK4, ERN1,
ERVH-6, FGD2, H2AFJ, HIPK3, KIF13A, KRTAP1-3, LATS1, LNPEP, PACS1,
PACS2, PIK3R2, PTPN14, RBFOX1, SH3GLB2, STRN, WNT7B, ZSWIM1 |
| Red | 10 | ARL15, CBX4, ELK4,
ETV3, FGD2, HSD17B1, IL37, KCNK3, KIF13A, LIN7A, MAGIX, MMP28,
MTUS2, NCS1, RASA2, RFX7, TAF13, TMOD3, WHSC1L1, ZKSCAN8 |
| Yellow | 0 | ADAM11, BCL11A,
CCL22, CLDN17, CTF1, CXorf36, EPB42, FRMD1, FSCN3, GAD2, GFRA4,
IL19, KRT2, NTNG1, OR10J1, PP13, PRG3, PSG6, SEZ6L, SMCP |
| Table VI.Functional annotations of hub genes
in module yellow. |
Table VI.
Functional annotations of hub genes
in module yellow.
| Term | P-value
(<0.05) | Genes |
|---|
| GO:0005125~cytokine
activity | 0.011 | CCL22, CTF1,
IL19 |
|
GO:0005576~extracellular region | 0.029 | CCL22, PSG6,
CXORF36, CTF1, IL19, NTNG1, GFRA4 |
| GO:0001775~cell
activation | 0.030 | PRG3, BCL11A,
KRT2 |
| GO:0031225~anchored
to membrane | 0.030 | GAD2, NTNG1,
GFRA4 |
| GO:0048870~cell
motility | 0.034 | CCL22, SMCP,
KRT2 |
|
GO:0051674~localization of cell | 0.034 | CCL22, SMCP,
KRT2 |
|
hsa04060:cytokine-cytokine receptor
interaction | 0.035 | CCL22, CTF1,
IL19 |
Discussion
A total of five gene expression datasets of HCC and
cirrhosis were collected and analyzed in the present study. A
weighted gene co-expression network was used for dataset
HCC, from which 6 modules were identified. Five out of the 6
modules indicated considerable preservation in dataset C and
were revealed to be associated with transcription, mitosis, protein
ubiquitination and cation homeostasis.
The other module may be closely involved in the
progression of HCC. Functional enrichment analysis demonstrated
that module yellow was associated with cation transport, secretion
and regulation of cyclase activity. Hub genes of module yellow were
obtained and revealed to be involved in cytokine-cytokine receptor
interactions and cell motility. It has been suggested that
cytokine-mediated signal transduction may contribute to the
development of HCC. Various critical genes were identified,
including CCL22, CTF1 and IL-19. CCL22 binds to chemokine receptor
type 4 and may be important in the trafficking of activated T
lymphocytes to inflammatory sites and other aspects of activated T
lymphocyte physiology. CCL22 was revealed to enhance tumor
migration and associate with venous infiltration in HCC (23). Yang et al (24) demonstrated that transforming growth
factor-β-miR-34a-CCL22 signaling-induced regulatory T cell
recruitment promotes venous metastases of HCC. Therefore, it may be
regarded as a potential therapeutic target for metastatic HCC
(25). IL-19 is upregulated in
breast cancer and promotes tumor progression (26). Guo et al (27) reported that the copy number of
IL-19 is significantly increased in HCC. Oleksyk et al
(28) reported that polymorphism
of IL-19 may be involved in natural clearance of the hepatitis C
virus in the African-American population. Therefore, it has been
hypothesized that IL-19 may be important in the progression of HCC.
In addition, various hub genes require further research to verify
their roles in the development of HCC. B-cell lymphoma/leukemia 11A
(BCL11A) is a C2H2 type zinc-finger protein that is essential for
normal lymphoid development (29)
and is implicated in lymphoid malignancy (30) as well as non-small cell lung cancer
(31). Claudin (CLDN) 17 is a
member of the claudin family, which is a family of integral
membrane proteins and tight junction strand components. Various
members of the claudin family have been implicated in HCC.
Suppression of CLDN10 may inhibit HCC invasion (32). CLDN10 expression levels are
associated with recurrence of primary HCC (33). CLDN6 and 9 function as additional
co-receptors for hepatitis C virus (34). BCL11A and CLDN17 may be involved in
the progression of HCC.
In conclusion, package WGCNA was used to
analyze HCC and cirrhosis gene expression data. A total of 6 gene
modules were identified, including one module that was closely
associated with HCC. Furthermore, a variety of critical genes were
revealed, further investigation of which may help to advance
understanding of the pathogenesis of HCC.
References
|
1
|
El-Serag HB and Rudolph KL: Hepatocellular
carcinoma: Epidemiology and molecular carcinogenesis.
Gastroenterology. 132:2557–2576. 2007. View Article : Google Scholar : PubMed/NCBI
|
|
2
|
Yamashita T, Budhu A, Forgues M and Wang
XW: Activation of hepatic stem cell marker EpCAM by
Wnt-beta-catenin signaling in hepatocellular carcinoma. Cancer Res.
67:10831–10839. 2007. View Article : Google Scholar : PubMed/NCBI
|
|
3
|
Azechi H, Nishida N, Fukuda Y, Nishimura
T, Minata M, Katsuma H, Kuno M, Ito T, Komeda T, Kita R, et al:
Disruption of the p16/cyclin D1/retinoblastoma protein pathway in
the majority of human hepatocellular carcinomas. Oncology.
60:346–354. 2001. View Article : Google Scholar : PubMed/NCBI
|
|
4
|
Sudo T, Utsunomiya T, Mimori K, Nagahara
H, Ogawa K, Inoue H, Wakiyama S, Fujita H, Shirouzu K and Mori M:
Clinicopathological significance of EZH2 mRNA expression in
patients with hepatocellular carcinoma. Br J Cancer. 92:1754–1758.
2005. View Article : Google Scholar : PubMed/NCBI
|
|
5
|
Schmidt CM, McKillop IH, Cahill PA and
Sitzmann JV: Increased MAPK expression and activity in primary
human hepatocellular carcinoma. Biochem Biophys Res Commun.
236:54–58. 1997. View Article : Google Scholar : PubMed/NCBI
|
|
6
|
Huynh H, Nguyen TT, Chow KH, Tan PH, Soo
KC and Tran E: Over-expression of the mitogen-activated protein
kinase (MAPK) kinase (MEK)-MAPK in hepatocellular carcinoma: Its
role in tumor progression and apoptosis. BMC Gastroenterol.
8:32003.
|
|
7
|
Newell P, Toffanin S, Villanueva A, Chiang
DY, Minguez B, Cabellos L, Savic R, Hoshida Y, Lim KH,
Melgar-Lesmes P, et al: Ras pathway activation in hepatocellular
carcinoma and anti-tumoral effect of combined sorafenib and
rapamycin in vivo. J Hepatol. 51:725–733. 2009. View Article : Google Scholar : PubMed/NCBI
|
|
8
|
Liang Y, Yang Z and Zhong R: Primary
biliary cirrhosis and cancer risk: A systematic review and
meta-analysis. Hepatology. 56:1409–1417. 2012. View Article : Google Scholar : PubMed/NCBI
|
|
9
|
Park YN, Chae KJ, Kim YB, Park C and
Theise N: Apoptosis and proliferation in hepatocarcinogenesis
related to cirrhosis. Cancer. 92:2733–2738. 2001. View Article : Google Scholar : PubMed/NCBI
|
|
10
|
Laouirem S, Le Faouder J, Alexandrov T,
Mestivier D, Léger T, Baudin X, Mebarki M, Paradis V, Camadro JM
and Bedossa P: Progression from cirrhosis to cancer is associated
with early ubiquitin post-translational modifications:
Identification of new biomarkers of cirrhosis at risk of
malignancy. J Pathol. 234:452–463. 2014. View Article : Google Scholar : PubMed/NCBI
|
|
11
|
Arrieta O, Rodriguez-Diaz JL,
Rosas-Camargo V, Morales-Espinosa D, de Leon S Ponce, Kershenobich
D and Leon-Rodriguez E: Colchicine delays the development of
hepatocellular carcinoma in patients with hepatitis virus-related
liver cirrhosis. Cancer. 107:1852–1858. 2006. View Article : Google Scholar : PubMed/NCBI
|
|
12
|
Yu DC, Liu J, Chen J, Shao JJ, Shen X, Xia
HG, Li CJ, Xue B and Ding YT: GGPPS1 predicts the biological
character of hepatocellular carcinoma in patients with cirrhosis.
Bmc Cancer. 14:2482014. View Article : Google Scholar : PubMed/NCBI
|
|
13
|
Nam SW, Park JY, Ramasamy A, Shevade S,
Islam A, Long PM, Park CK, Park SE, Kim SY, Lee SH, et al:
Molecular changes from dysplastic nodule to hepatocellular
carcinoma through gene expression profiling. Hepatology.
42:809–818. 2005. View Article : Google Scholar : PubMed/NCBI
|
|
14
|
Villanueva A, Hoshida Y, Battiston C,
Tovar V, Sia D, Alsinet C, Cornella H, Liberzon A, Kobayashi M,
Kumada H, et al: Combining clinical, pathology, and gene expression
data to predict recurrence of hepatocellular carcinoma.
Gastroenterology. 140:1501–1512.e2. 2011. View Article : Google Scholar : PubMed/NCBI
|
|
15
|
Jia HL, Ye QH, Qin LX, Budhu A, Forgues M,
Chen Y, Liu YK, Sun HC, Wang L, Lu HZ, et al: Gene expression
profiling reveals potential biomarkers of human hepatocellular
carcinoma. Clin Cancer Res. 13:1133–1139. 2007. View Article : Google Scholar : PubMed/NCBI
|
|
16
|
Gautier L, Cope L, Bolstad BM and Irizarry
RA: affy-analysis of Affymetrix GeneChip data at the probe level.
Bioinformatics. 20:307–315. 2004. View Article : Google Scholar : PubMed/NCBI
|
|
17
|
Langfelder P and Horvath S: WGCNA: An R
package for weighted correlation network analysis. Bmc
Bioinformatics. 9:5592008. View Article : Google Scholar : PubMed/NCBI
|
|
18
|
Dennis G, Sherman BT, Hosack DA, Yang J,
Gao W, Lane HC and Lempicki RA: DAVID: Database for annotation,
visualization, and integrated discovery. Genome Biol. 4:P32003.
View Article : Google Scholar : PubMed/NCBI
|
|
19
|
Kanehisa M, Goto S, Sato Y, Furumichi M
and Tanabe M: KEGG for integration and interpretation of
large-scale molecular data sets. Nucleic Acids Res. 40:D109–D114.
2011.PubMed/NCBI
|
|
20
|
Merico D, Isserlin R, Stueker O, Emili A
and Bader GD: Enrichment Map: A network-based method for gene-set
enrichment visualization and interpretation. PloS One.
5:e139842010. View Article : Google Scholar : PubMed/NCBI
|
|
21
|
Shannon P, Markiel A, Ozier O, Baliga NS,
Wang JT, Ramage D, Amin N, Schwikowski B and Ideker T: Cytoscape: A
software environment for integrated models of biomolecular
interaction networks. Genome Res. 13:2498–2504. 2003. View Article : Google Scholar : PubMed/NCBI
|
|
22
|
Zhang B and Horvath S: A general framework
for weighted gene co-expression network analysis. Stat Appl Genet
Mol Biol. 4:Article172005.PubMed/NCBI
|
|
23
|
Yeung OW, Lo CM, Ling CC, Qi X, Geng W, Li
CX, Ng KT, Forbes SJ, Guan XY, Poon RT, et al: Alternatively
activated (M2) macrophages promote tumour growth and invasiveness
in hepatocellular carcinoma. J Hepatol. 62:607–616. 2015.
View Article : Google Scholar : PubMed/NCBI
|
|
24
|
Yang P, Li QJ, Feng Y, Zhang Y, Markowitz
GJ, Ning S, Deng Y, Zhao J, Jiang S, Yuan Y, et al:
TGF-β-miR-34a-CCL22 signaling-induced treg cell recruitment
promotes venous metastases of HBV-positive hepatocellular
carcinoma. Cancer Cell. 22:291–303. 2012. View Article : Google Scholar : PubMed/NCBI
|
|
25
|
Budhu A and Wang XW: Transforming the
microenvironment: A trick of the metastatic cancer cell. Cancer
Cell. 22:279–280. 2012. View Article : Google Scholar : PubMed/NCBI
|
|
26
|
Hsing C-H, Cheng HC, Hsu YH, Chan CH, Yeh
CH, Li CF and Chang MS: Upregulated IL-19 in breast cancer promotes
tumor progression and affects clinical outcome. Clin Cancer Res.
18:713–725. 2012. View Article : Google Scholar : PubMed/NCBI
|
|
27
|
Guo X, Yanna, Ma X, An J, Shang Y, Huang
Q, Yang H, Chen Z and Xing J: A meta-analysis of array-CGH studies
implicates antiviral immunity pathways in the development of
hepatocellular carcinoma. Plos One. 6:e284042011. View Article : Google Scholar : PubMed/NCBI
|
|
28
|
Oleksyk TK, Thio CL, Truelove AL, Goedert
JJ, Donfield SM, Kirk GD, Thomas DL, O'Brien SJ and Smith MW:
Single nucleotide polymorphisms and haplotypes in the IL10 region
associated with HCV clearance. Genes Immun. 6:347–357. 2005.
View Article : Google Scholar : PubMed/NCBI
|
|
29
|
Liu P, Keller JR, Ortiz M, Tessarollo L,
Rachel RA, Nakamura T, Jenkins NA and Copeland NG: Bcl11a is
essential for normal lymphoid development. Nat Immunol. 4:525–532.
2003. View Article : Google Scholar : PubMed/NCBI
|
|
30
|
Satterwhite E, Sonoki T, Willis TG, Harder
L, Nowak R, Arriola EL, Liu H, Price HP, Gesk S, Steinemann D, et
al: The BCL11 gene family: Involvement of BCL11A in lymphoid
malignancies. Blood. 98:3413–3420. 2001. View Article : Google Scholar : PubMed/NCBI
|
|
31
|
Jiang B, Zhang X, Su J, Meng W, Yang XN,
Yang JJ, Zhou Q, Chen ZY, Chen ZH, Xie Z, et al: BCL11A
overexpression predicts survival and relapse in non-small cell lung
cancer and is modulated by microRNA-30a and gene amplification. Mol
Cancer. 12:612013. View Article : Google Scholar : PubMed/NCBI
|
|
32
|
Ip YC, Cheung ST, Lee YT, Ho JC and Fan
ST: Inhibition of hepatocellular carcinoma invasion by suppression
of claudin-10 in HLE cells. Mol Cancer Ther. 6:2858–2867. 2007.
View Article : Google Scholar : PubMed/NCBI
|
|
33
|
Cheung ST, Leung KL, Ip YC, Chen X, Fong
DY, Ng IO, Fan ST and So S: Claudin-10 expression level is
associated with recurrence of primary hepatocellular carcinoma.
Clin Cancer Res. 11:551–556. 2005.PubMed/NCBI
|
|
34
|
Zheng A, Yuan F, Li Y, Zhu F, Hou P, Li J,
Song X, Ding M and Deng H: Claudin-6 and claudin-9 function as
additional coreceptors for hepatitis C virus. J Virol.
81:12465–12471. 2007. View Article : Google Scholar : PubMed/NCBI
|