Introduction
Renal cell carcinoma (RCC) is a common urologic
malignancy, which accounts for 2–3% of adult malignancies, and
clear cell RCC (ccRCC) is the most frequent of all types of RCC,
which accounts for 85–95% of cases (1). The mortality rate of ccRCC is
>90,000/year worldwide, and particularly high in China.
Histological subtype detection shows ccRCC represents ~75–80% of
all cases of RCC (1). Over the
past decade, the incidence of ccRCC has increased significantly
with an mortality rate of ~40% (2). In previous years, studies
investigating the biological mechanisms, which cause ccRCC
carcinogenesis focussed on genomic mutations, expression of
protein-coding genes and epigenetic changes (3). However, there is increasing evidence
suggesting that the microRNAs (miRNAs) are closely associated with
cancer, and that the changes in their expression profiles may be
considered as biomarkers for early detection, accounting for early
diagnosis. Therefore, an improved understanding of miRNAs
associated with the progression of ccRCC may lead to more accurate
prognosis and therapeutic strategies (4).
miRNAs are a class of small noncoding RNAs, which
have been shown to regulate gene expression by binding through
partial sequence homology to the 3′ untranslated region (3′ UTR),
causing target mRNA degradation or translational inhibition
(5). The majority of miRNAs are
transcribed as long monocistronic, bicistronic or polycistronic
primary transcription units (pri-miRNAs) by RNA polymerase II and,
following a series of cellular processing events, mature miRNAs are
synthesized (6). The mature miRNAs
are incorporated into the RNA-induced silencing complex and drives
the selection of mRNAs of interest containing antisense sequences
matching those of the miRNAs (7).
As a result of their gene expression-associated activity, miRNAs
have been identified as key regulators of several biological
processes, including development, differentiation, apoptosis,
proliferation and carcinogenesis (8–10).
miRNAs are found aberrantly expressed or mutated in cancer,
suggesting their role as a novel class of factors involved in
promoting or inhibiting carcinogenesis (11,12).
In several types of cancer, miRNAs show significant differences,
including prostate, lung, breast, colon and kidney malignancies
(13), and evidence supports the
promising use of miRNAs for diagnostic, prognostic and predictive
purposes (14).
Hypoxia is an essential feature of the neoplastic
microenvironment. The oxygen concentration in tumor tissue is
substantially lower, compared with that in the surrounding
non-tumor tissue. For example, in solid tumors of the breast, the
O2 pressure is ~10 mmHg, whereas normal breast tissue
has an O2 pressure of >60 mmHg (15). The regulation of hypoxia in cells
occurs through affecting the expression of certain genes, which are
sensitive to O2 concentration. The molecular mechanisms
responsible for the hypoxic survival of cancer cells remains to be
fully elucidated, and additional information on this process may
lead to novel strategies for pharmacological intervention.
In order to determine the possible role of
hsa-miR-101 in hypoxic gene regulation and to examine this
hypoxically-regulated miRNA, which may promote glycolysis by
inhibiting TP53-induced glycolysis and apoptosis regulator (TIGAR),
the present study examined changes in miRNA expression levels in
response to hypoxia. The results obtained characterized in detail
the hypoxic regulation of hsa-miR-101 and the mechanism underlying
its regulation of TIGAR and promotion of glycolysis. The data also
revealed the association between the level of hsa-miR-101 and the
pathogenesis and prognosis of ccRCC.
Materials and methods
Patients and tissue samples
In total, 15 pairs of ccRCC tumor tissue and normal
tissue samples were collected between July 2012 and May 2013 at the
department of Urological Surgery, First People's Hospital of
Beijing (Beijing, China). All patients who donated tissue were
diagnosed with ccRCC via post-operative pathology. The current
study was approved by the Ethics Committee of Xutong Hospital
(Xutong, China).
Of the 15 tissue samples from the patients with
ccRCC, seven were from men and eight were from women, with a mean
age of 58 years (range, 36–71 years). Of these patients, nine were
in clinical stage I and six were in stage II.
Cell culture and induction of
hypoxia
In the present study, the normal HK-2 epithelial
cell line (frozen in the laboratory) and the ACHN ccRCC cell line
were used, obtained from American Type Culture Collection (ATCC;
Manassas, VA, USA). The cells were grown in Eagle's minimum
essential medium (Life Technologies; Thermo Fisher Scientific,
Inc., Waltham, MA, USA) supplemented with 10% fetal bovine serum,
100 U/ml penicillin and 100 mg/ml streptomycin (Life Technologies;
Thermo Fisher Scientific, Inc.) in a 5% CO2 atmosphere
at 37°C according to standard procedures. Hypoxia exposure was
established by changing the medium, which had been gassed to
equilibrium with 0.1% O2, decreasing CO2 flow
rates to 10 cm3/sec in specifically designed chambers
obtained from Oxold (Adelaide, Australia).
Transfection
To generate transiently-expressing constructs, the
genomic region surrounding the pri-miRNA sequence of hsa-miR-101
was amplified using primers the following primers: Forward
5′-CTCAACTGGTGTCGTGGAGTCGGCAATTCAGTTGAGTTCAGTTAT-3′ and reverse
5′-ACACTCCAGCTGGGTACAGTACTGTGATAA-3’. The thermocycling protocol
was as follows: 95°C for 5 min, then 30 cycles of amplification,
each cycle consisted of 94°C for 30 sec, 55°C for 45 sec, and 72°C
for 1 min. This generated a polymerase chain reaction (PCR) product
of ~500 bp, which was directionally cloned into pLNCX (Clontech
Laboratories, Mountain View, CA, USA) using NotI and
XhoI (Takara Bio, Inc., Shiga, Japan). The ligated construct
was transformed into the DH5α E. coli strain (ATCC) chemically by
preparing endotoxic-free plasmid using Maxipreps (Qiagen, Hildern,
Germany), packed with Lipofectamine 2000 (Thermo Fisher Scientific,
Inc.) and mixed with Phoenix packaging cells (Orbigen, Inc., San
Diego, CA, USA).. Sequencing was performed by Qingkezixi (Chengdu,
China) to confirm the insertion of the target sequence into the
plasmid following the cytomegalovirus promoter. The supernatant was
obtained following centrifugation at 800 × g for 10 min at 4°C was
collected and used to infect the target cells, which were incubated
in a 5% CO2 atmosphere at 37°C, and these cells were
harvested 48 h later, for further analysis.
RNA extraction and cDNA synthesis
Total RNA was extracted from the tissues by
homogenizing 100 mg of the frozen tissue with a homogenizer (Thermo
Fisher Scientific, Inc.), followed by isolation using the mir-VANA
miRNA Isolation kit (Ambion, Austin, TX, USA). For reverse
transcription (RT), 1 µg of the isolated miRNAs were incubated with
RT mixture from Reverse-Transcriptional Fast kit (RiboBio Co.,
Ltd., Guangzhou, China) to simultaneously convert all small RNAs
into detectable cDNAs for PCR analysis.
TaqMan RT-qPCR and quantitative
(q)PCR
The method was optimized for miRNA, and all
reagents, primers and probes were obtained from Applied Biosystems;
Thermo Fisher Scientific, Inc. Human 28S rRNA was used to normalize
all RNA samples. The RT reactions and qPCR analyses were performed
according to the manufacturer's protocols. The previously prepared
cDNA samples were run in duplicate in an Applied Biosystems 9700
thermocycler. The Taqman probe for hsa-miR-101 was
5′-CGGCGGTACAGTACTGTGATAA-3′; miR-93 5′-CGGCGGTGGAGTGTGACAATGG-3′.
The thermocycling conditions were: 95° for 5 min, followed by 35
cycles at 95°C for 10 sec, 55°C for 10 sec and 72°C for 1 min. The
gene expression levels were quantified using the ABI Prism 7900HT
sequence detection system (Applied Biosystems; Thermo Fisher
Scientific, Inc.). Analysis was performed in duplicate, including
controls containing no template. The relative expression was
calculated using the comparative quantification cycle method
(16).
Total RNA was extracted from the cells using TRIzol
reagent (Life Technologies; Thermo Fisher Scientific, Inc.), and a
1 µg from each cell line were used for RT (Life Technologies;
Thermo Fisher Scientific, Inc.) according to the manufacturer's
protocol. Subsequent qPCR was performed in the Bio-Rad CFX qPCR
system (Bio-Rad Laboratories, Inc., Hercules, CA, USA) according to
the manufacturer's protocol. The protocol used was as follows: 98°C
5 min, followed by 40 cycles of 98°C for 10 sec and 60°C for 1 min.
The prediction of potential target for microRNAs was performed by
using TargetScan (www.targetscan.org). The primers used for qPCR were as
follows: TIGAR, forward 5′-GTGAGGACTACGCAGCATCA-3′ and reverse
5′-GCATCAGAACCGTGATATATTCT-3′; β-actin, forward
5′-GCGCGTGCCTTCATCAC-3′ and reverse 5′-TCTGCGCCATAAGGTGGTAG-3′.
Semi-quantitative western blot
analysis
To prepare the total protein samples, the cells were
trypsinized and homogenized on ice in lysis buffer containing 10 mM
Tris-HCl (pH 7.4), 1% Triton X-100, 150 mM NaCl and 100 mM KCl. The
crude lysate was centrifuged at 20,000 × g for 45 min at 4°C and
~200 µl of clear supernatant was collected. A bicinchoninic acid
assay was performed to identify the total protein concentration of
the collected supernatant. A final concentration of 2 µg/µl total
protein was adjusted with the addition of ddH2O and 1X
laemmli buffer and boiled at 98°C for 10 min. To fractionate the
proteins, 4–12% gradient SDS-PAGE gels were used. Immunoblotting
was performed with specific antibodies, including mouse anti-TIGAR
antibody (cat. no. ab64622; 1:1,000; Abcam, Cambridge, UK),
anti-β-actin antibody (cat. no. ab8226; 1:1,000; Abcam, Cambridge,
UK) at 4°C overnight. The PVDF membranes were then incubated with
goat anti-mouse horseradish peroxidase-labeled secondary antibody
(cat. no ab97040; 1:5,000; Abcam, Cambridge, UK) incubated at room
temperature.
Cell proliferation assay
Cell proliferation was detected using 3-(4,
5-dimethylthazol-2-yl)-2, 5-diphenyltetrazolium bromide (MTT). The
cells were seeded into 24-well plates (1.2×10⁴
cells/well) and allowed to attach overnight in a 5% CO2
atmosphere at 37°C. After 24, 48, 72 and 96 h, cell viability was
assessed using an MTT assay. The absorbance at 490 nM (A490) of
each well was read on a spectrophotometer. Three independent
experiments were performed in quadruplicate.
Metabolite determination
To measure the levels of fructose
(Fru)-2,6-P2, the treated cells were homogenized in
homogenizing buffer (100 mM NaOH and 0.1% Triton X-100), following
which the crude lysate was heated to 80°C for 10 min and
centrifuged at 20,000 × g for 10 min at 4°C. The supernatant was
transferred to a fresh 1.5 ml tube. Fru-2,6-P2 was
identified in the supernatants by its ability to activate
pyrophosphate-dependent phosphofructokinase-1 from potato tubers,
as described previously (17).
Standard enzymatic methods for measuring lactate
spectrophotometrically in the neutralized perchloric extracts were
performed according to the protocol described previously (18).
Statistical analysis
All statistical analyses were performed using SPSS
13.0 software (SPSS Inc., Chicago, IL, USA). The differences
between the tumor and adjacent noncancerous tissues were assessed
using the paired samples t-test. The differences between the
tissues of patients with ccRCC were assessed using an independent
samples t-test or non-parametric test. The clinical
correlation analysis was performed using the variance test or
Kruskal-Wallis test. P<0.05 was considered to indicate a
statistically significant difference.
Results
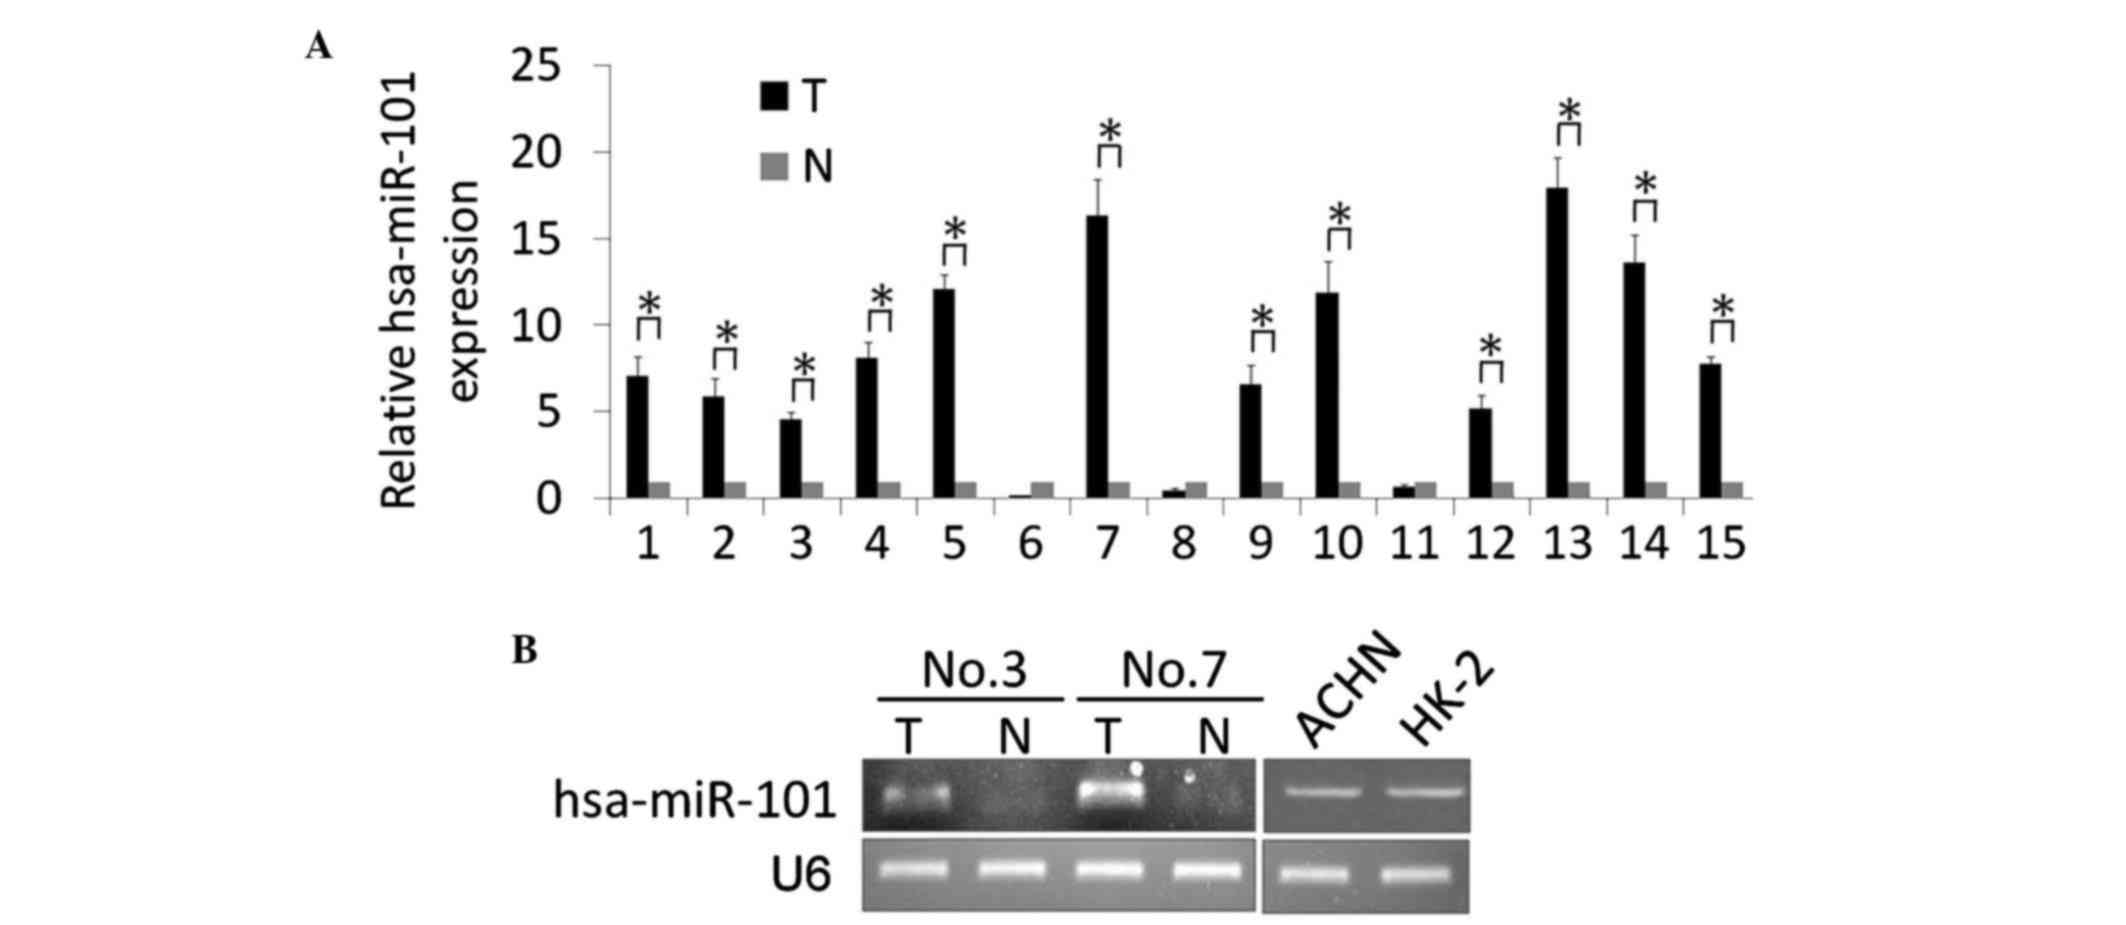
hsa-miR-101 is significantly
downregulated in human ccRCC tissues
In the present study, a stem-loop RT-qPCR assay was
performed to identify the expression level of hss-miR-101 in 15
pairs of matched ccRCC and noncancerous kidney tissue samples. As
shown in Fig. 1A, significantly
upregulated expression levels of hsa-miR-101 were detected in the
ccRCC tissues, compared with the noncancerous tissue. The
expression levels of hsa-miR-101 in 12 ccRCC tissue samples were
upregulated between 4.6- and 17.9-fold, whereas the levels in three
ccRCC tissue samples were downregulated between 0.2- and 0.7-fold.
Two pairs of the matched ccRCC and noncancerous tissue samples, and
the normal HK-2 epithelial cell line and ACHN ccRCC cell line were
used for further conventional RT-qPCR analyses, and the results
were analyzed by gel electrophoresis. The results showed that the
expression of hsa-miR-101 was upregulated in the ccRCC tissues
(Fig. 1B). Of note, no significant
differences were found in the expression of hsa-miR-101 in the ACHN
cells, compared with the HK-2 cells, indicating the induction of
hsa-miR-101 by other factors.
Confirmation of the hypoxic
upregulation of hsa-miR-101 in ccRCC cells using RT-qPCR
analysis
The present study hypothesized that hsa-miR-101 is
involved in the hypoxic response, and this was investigated by
examining the level of hsa-miR-101 following hypoxic exposure. The
time course of the induction of hsa-miR-101 by hypoxia was
examined. The ACHN and HK-2 cells were cultured in hypoxia (1%
O2) for 1, 3, 6, 12, 24 and 48 h. The expression of
hsa-miR-101 was analyzed using TaqMan RT-qPCR analysis. Following
incubation for 6 h, the upregulation of hsa-miR-101 by hypoxia was
detected and showed a progressive increase in expression (Fig. 2A). Following hypoxia exposure for
12 h, the upregulation of hsa-miR-101 was significant (ACHN,
4.19±0.17; HK-2, 2.67±0.35; P<0.001) and was maximal at the 48 h
time point (ACHN, 5.79±0.21; HK-2, 3.43±0.25; P<0.001). As a
negative control, the expression of hsa-miR-93, which is not
affected by hypoxic incubation (19), was completely unaffected (data not
shown). To investigate the oxygen-dependent regulation of
hsa-miR-101, a range of oxygen concentrations (0.1, 1, 3, 5 and 21%
oxygen) were used for cell maintenance. The induction of
hsa-miR-101 was most marked at 1% oxygen, with more modest
regulation at 0.1, 3 and 5% oxygen, following hypoxic exposure for
24 h (Fig. 2B). No detectable
change in the expression of hsa-miR-93 was observed following
hypoxia exposure.
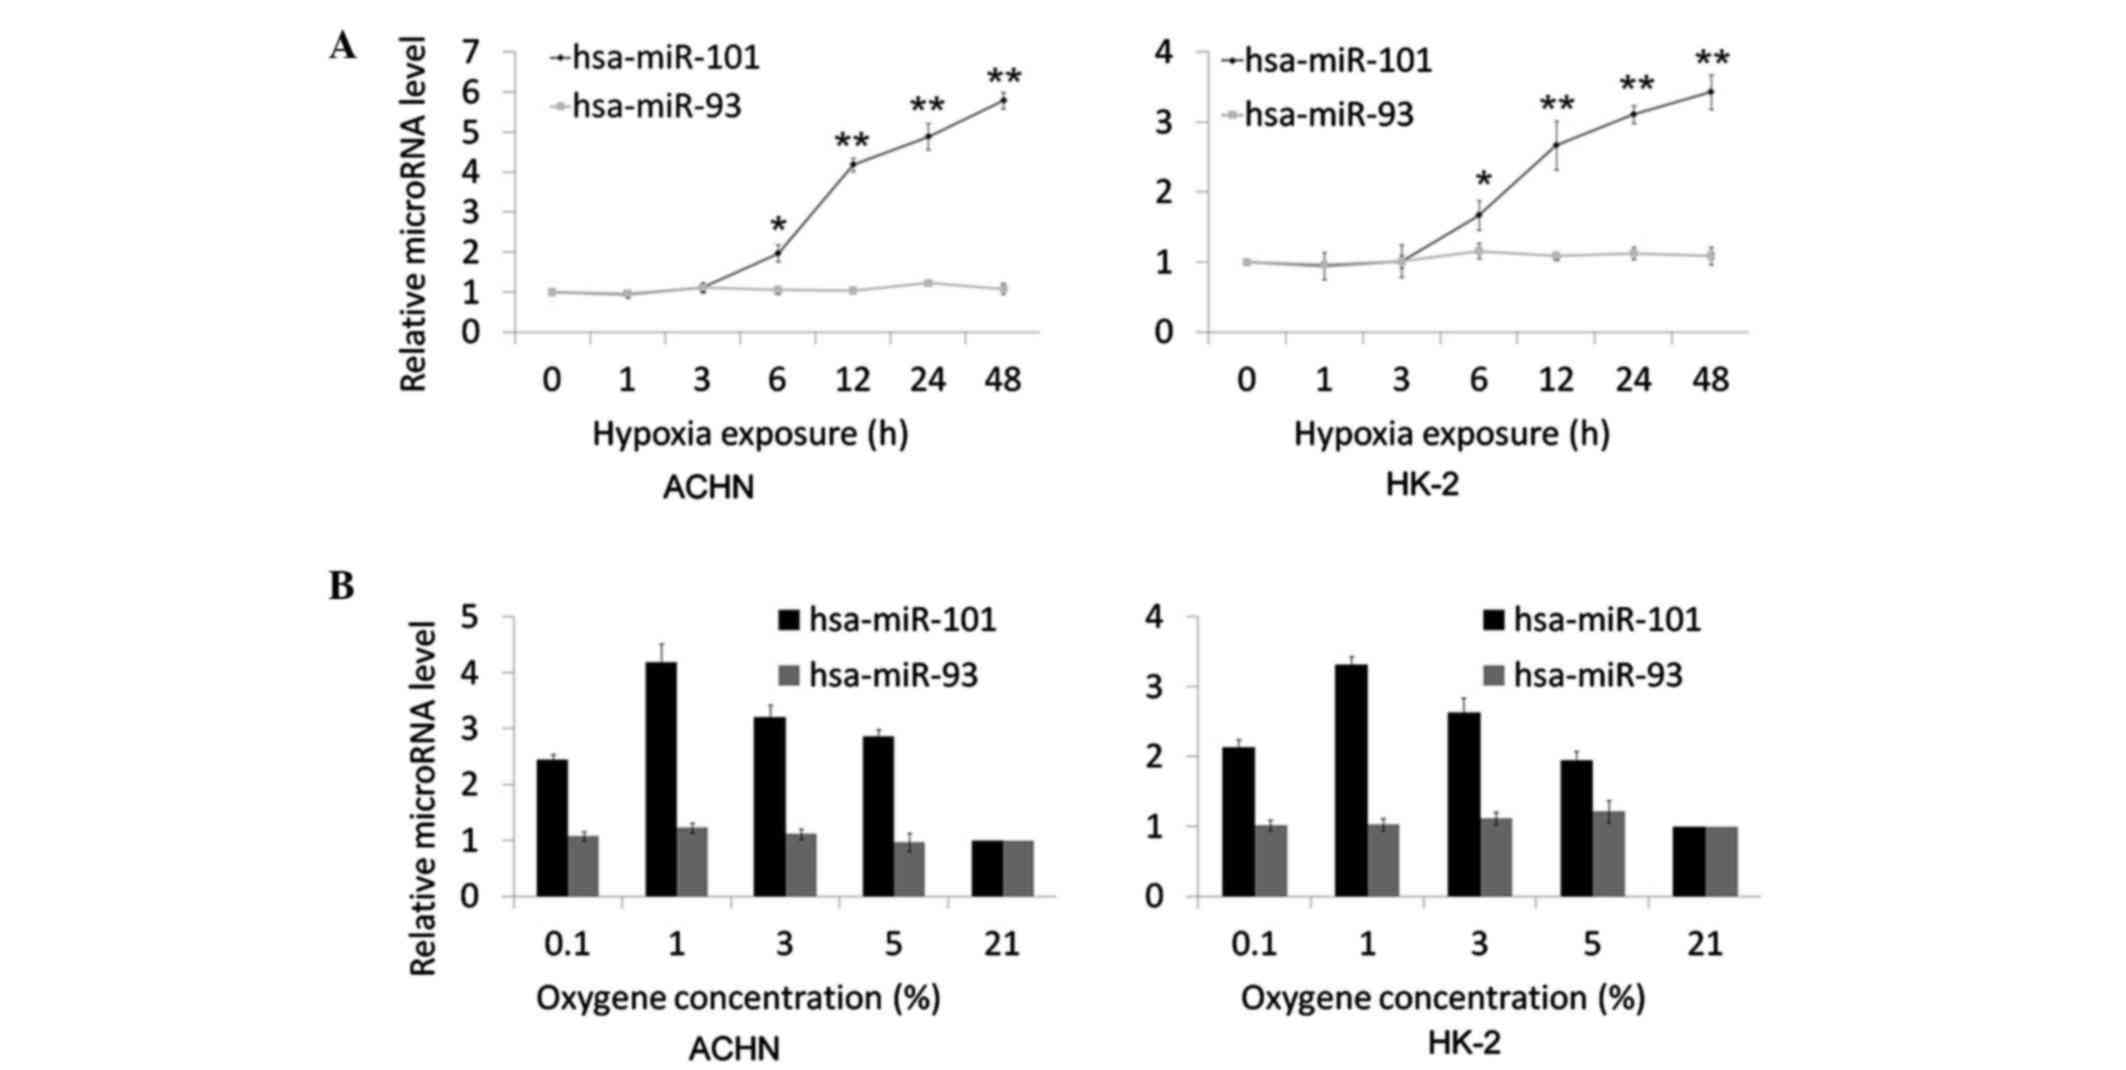 | Figure 2.Time course and oxygen sensitivity of
hsa-miR-101 following the induction of hypoxia. (A) AHCN and HK-2
cells were exposed to 1% oxygen for 0, 1, 3, 6, 12, 24 and 48 h.
All time points were performed in triplicate. (B) AHCN and HK-2
cells were exposed for 16 h to oxygen concentrations of 0.1, 1, 3,
5 and 21%. All concentrations were performed in triplicate.
hsa-miR-93 was considered a negative control, which is not affected
by hypoxia. The expression levels of hsa-miR-101 and hsa-miR-93
were measured using reverse transcription-quantitative polymerase
chain reaction analysis. The data are expressed as the mean fold
difference in microRNA levels between the treated and untreated
samples. *P<0.05 and **P<0.01. miR, microRNA. |
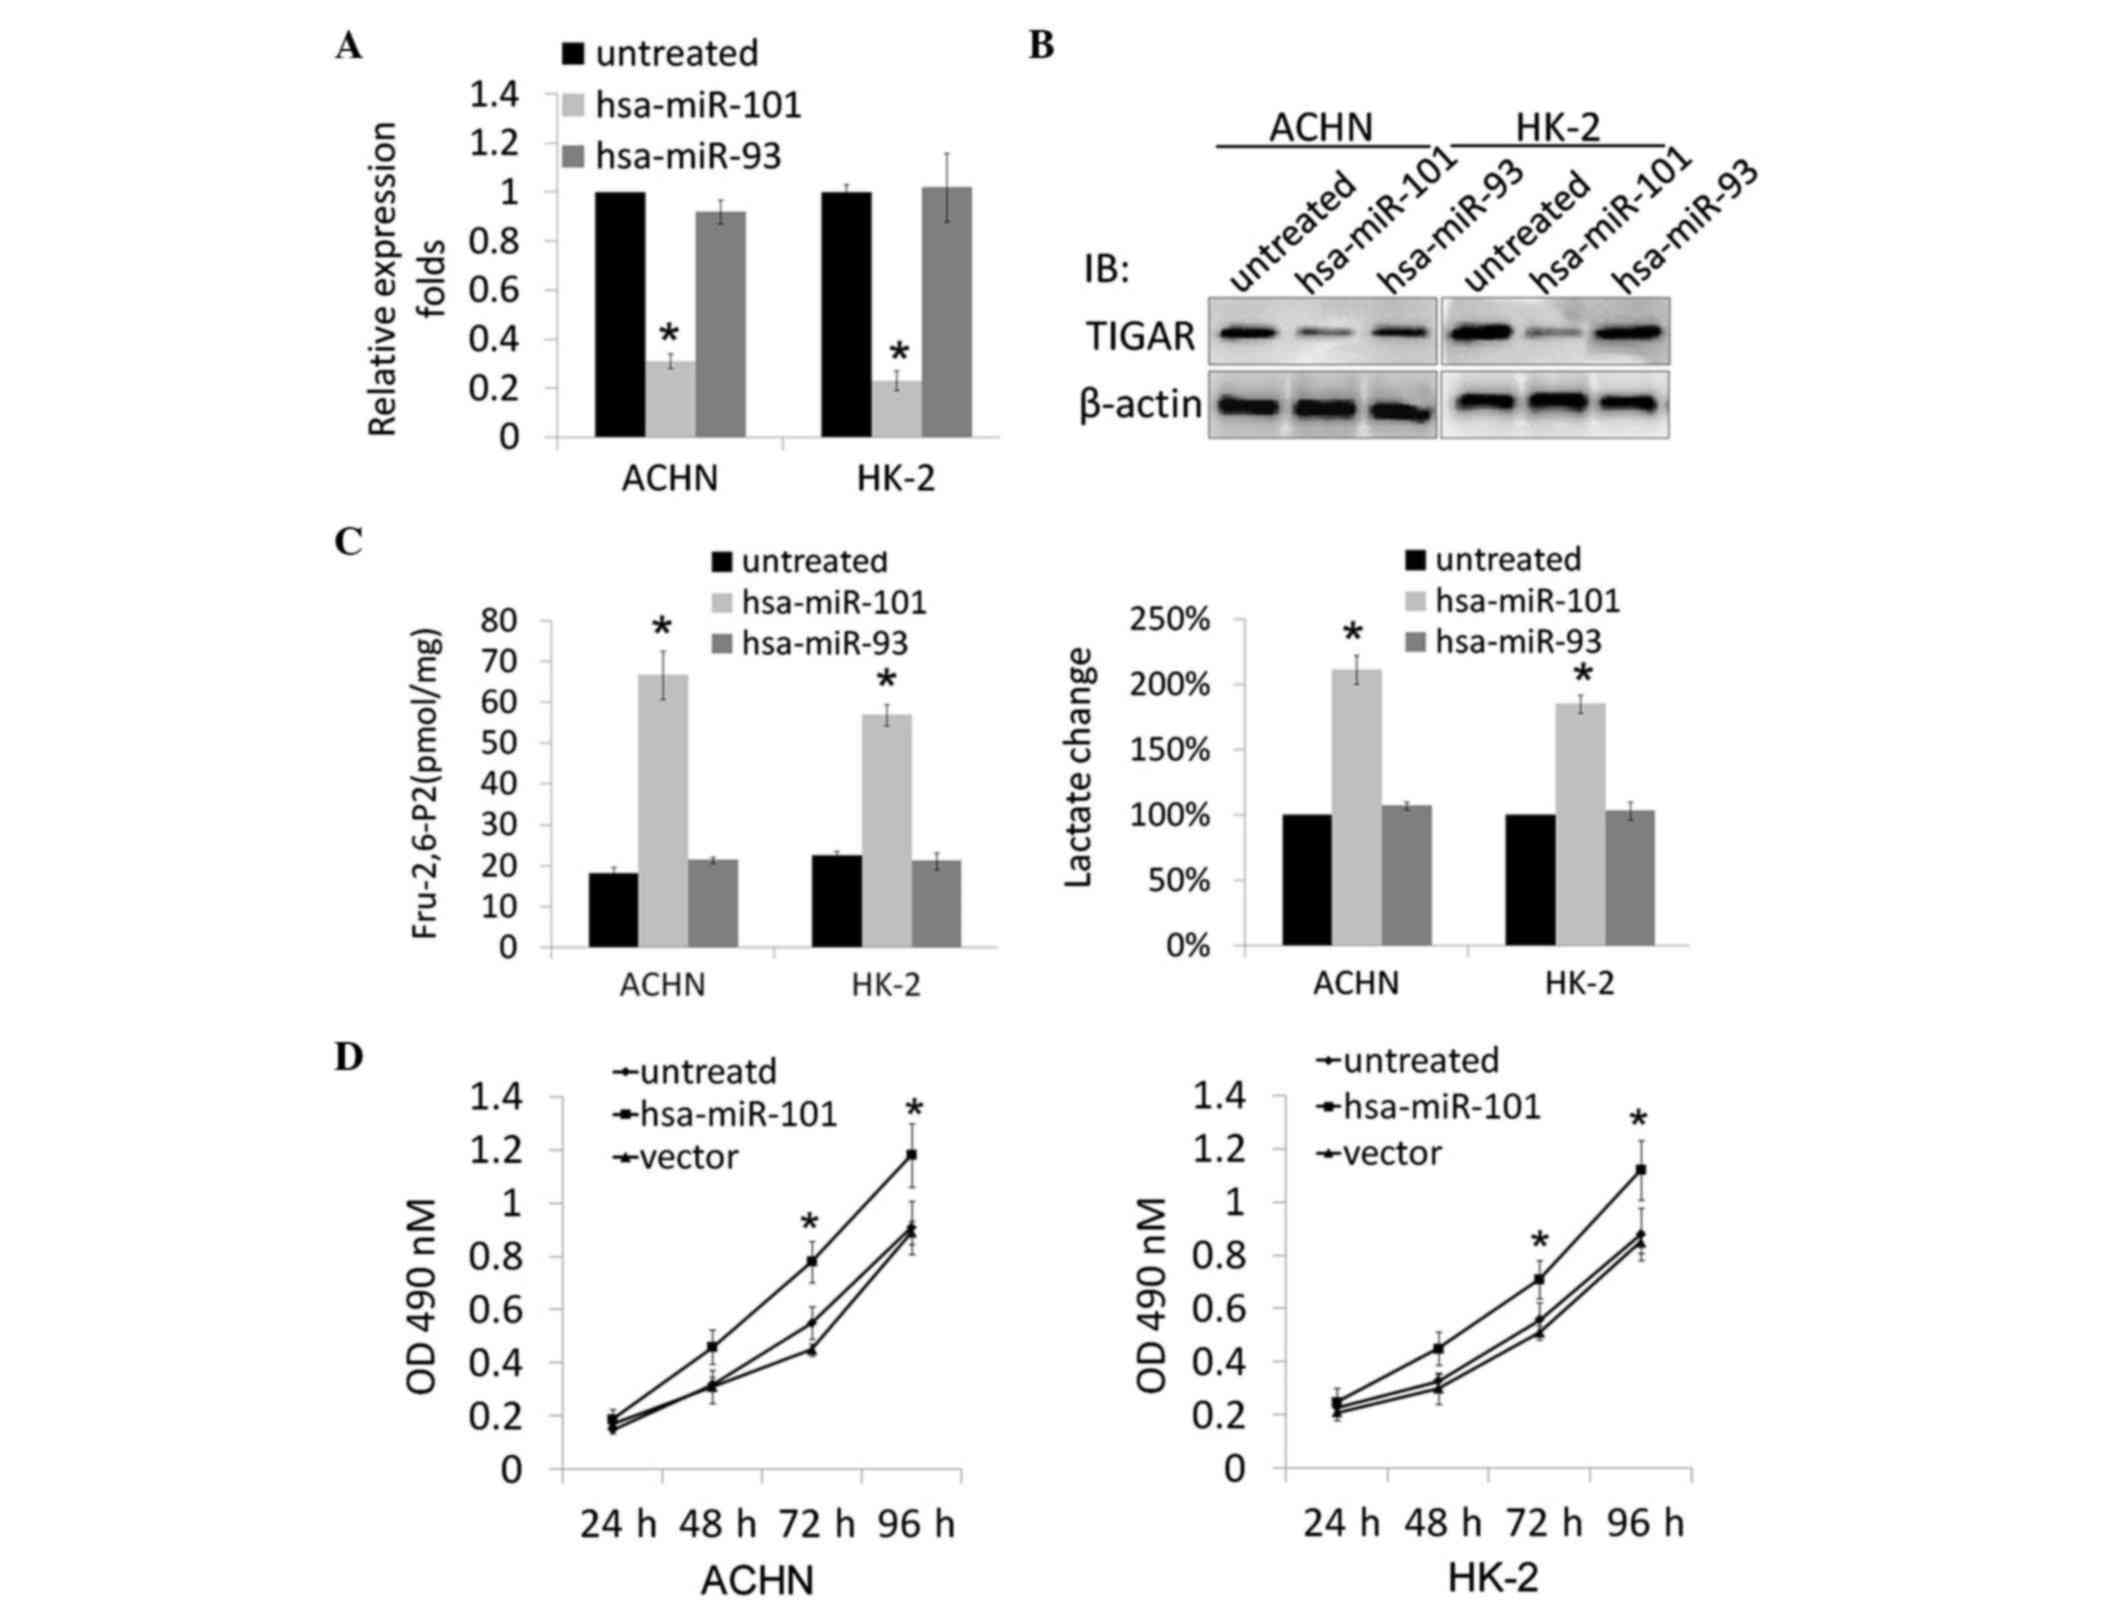
Overexpression of hsa-miR-101 knocks
down the expression of TIGAR, and affects kidney cell metabolism
and growth rate
According to the stem-loop character of hsa-miR-101
and cross-species comparison, computational algorithms have been
developed. TargetScan was used to generate a potential miRNA with a
high probability of binding to the 3′UTR of TIGAR. To further
confirm the predicted result, a hsa-miR-101-expressing plasmid was
constructed and transfected into ACHN and HK-2 cells. Total RNA was
extracted from the stably transfected cells, and RT-qPCR analysis
was performed. The data showed that the overexpression of
hsa-miR-101 reduced the expression of TIGAR at the mRNA and protein
levels (Fig. 3A and B).
TIGAR is important as a regulator of oxidative
stress, therefore, the present study next examined the biological
consequences of the specific knockdown of TIGAR by hsa-miR-101 in
ACHN and HK-2 cells. Metabolic parameters associated with the
function of TIGAR were determined, and the levels of Fru-2,
6-P2 and lactate were significantly increased in the
hsa-miR-101-overexpressing cells following transfection (Fig. 3C). The present study also evaluated
the effects of the overexpression of hsa-miR-101 on the growth rate
of the transfected ACHN and HK-2 cells. As shown in Fig. 3D, the ACHN/hsa-miR-101 and
HK-2/hsa-miR-101 cell lines had significantly increased cell
viability, compared with the mock-transfected ACHN and HK-2 cells
(P<0.05).
Discussion
Increasing reports have shown the close association
between disturbances in the expression levels of miRNAs and the
carcinogenic process (20–22). These miRNAs, the mutation or
misexpression of which correlate with various types of human
cancer, are referred to as oncomiRs (11). They can be involved in tumor
suppression or formation.
The expression pattern of miRNAs may be altered
during the progressive development of ccRCC. Gowrishankar et
al (23) examined the
differences in expression levels of >700 human miRNAs in a
series of 94 ccRCC samples, and found that the accumulation of
miR-21-5p and miR-142-3p were reduced. The overexpression of these
miRNAs leads to proliferation and decreased cell death, suggesting
their role as oncogenes. Previously, Cheng et al (24) showed that miR-34a and miR-224 were
upregulated and had an anti-apoptotic effect in ccRCC. This
suggests that these miRNAs may be involved in tumor
suppression.
The effects of TIGAR on cell proliferation and
glycolysis are considered to be cell- and context-dependent.
Following moderate levels of stress, TIGAR is induced for repairing
DNA damage and inhibiting glycolysis. Peña-Rico et al
(25) showed that the silencing of
TIGAR in glioblastoma cell lines causes higher levels of
Fru-2,6-P2 in cells, consequently increasing glycolysis
and leading to the accumulation of reactive oxygen species, which
promotes cell death. In tumor tissues, TIGAR has been found to be
markedly downregulated (26),
which is predominantly caused by p53 dysfunction. However, the
mechanism underlying the downregulation of TIGAR in tumors with
functioning p53 remains to be elucidated, however, it is
hypothesized to be involved with miRNAs.
The aim of the present study was to evaluate whether
there is an association between hypoxia exposure and altered
expression patterns of hsa-miR-101 in ccRCC. The results showed
that hsa-miR-101 was frequently downregulated in human ccRCC
tissues, compared with corresponding noncancerous kidney tissues,
which is consistent with the results of Wotschofsky et al
(27). In addition, hsa-miR-101
has been reported to be upregulated in HepG2 cells (28) and periodontal ligament cells
(29), indicating its close
association with different types of tumors. However, the mechanism
causing the upregulation of hsa-miR-101 and the effect of the
higher level of this miRNA remains to be elucidated.
Due to the close association between the induction
of miRNA with hypoxia, the present study investigated whether
hsa-miR-101 is induced by hypoxia. The resulting data showed that
hsa-miR-101 was induced by hypoxia in vitro. Consistent with
previous results, hsa-miR-93 showed no responsiveness to hypoxia
in vitro. The effects of alterations in the levels of
hsa-miR-101 remain to be fully elucidated. Resultant modifications
in target gene expression are possible, however, the relative
effects on transcription, mRNA post-transcriptional regulation and
translation remain to be elucidated. The computational prediction
of mRNA targets for hsa-miR-101 binding and action generates a
number of potential targeted mRNA sequences (www.MicroRNAs.org/microRNAs/home.do and www.targetscan.org). As TIGAR mRNA showed the highest
binding affinity, it was selected for further experiments. The data
obtained showed that the overexpression of hsa-miR-101 decreased
the mRNA and protein levels of TIGAR, causing the stimulation of
glycolysis and proliferation. The correlation between the levels of
hsa-miR-101 and ccRCC was founs to be marked. This may be due to
the direct effect of hsa-miR-101 on tumor biology through its
induction by tumor hypoxia. Of note, as a feature of a solid
tumors, hypoxia induces hsa-miR-101 to target TIGAR, causing
changes in metabolism. This indicates one mechanism involved in the
regulation responses of miRNAs to microenvironmental factors.
The results of the present study showed that a
significantly high proportion of hsa-miR-101 is overexpressed in
human tumor tissues, and the alteration of this miRNA is caused by
hypoxia in vitro and in vivo. By regulating its
target gene, TIGAR, the overexpression of hsa-miR-101 stimulates
glycolysis and increases proliferation. In conclusion, the present
study may provide a novel therapeutic target site for ccRCC through
targeting hsa-miR-101.
Acknowledgements
The authors would like to thank Dr Ziyi Zhao
(Sichuan University, Chengdu, China) for their English editing, Dr
Changjin Chen (Sichuan University, Chengdu, China) for his
technical support and Miss Jiao Lv (Sichuan University, Chengdu,
China) for her technical assistance.
References
|
1
|
Jemal A, Siegel R, Ward E, Murray T, Xu J,
Smigal C and Thun MJ: Cancer statistics, 2006. CA Cancer J Clin.
65:106–130. 2006. View Article : Google Scholar
|
|
2
|
Gottardo F, Liu CG, Ferracin M, Calin GA,
Fassan M, Bassi P, Seviquani C, Byrne D, Negrini M, Pagano F, et
al: Micro-RNA profiling in kidney and bladder cancers. Urol Oncol.
25:387–392. 2007. View Article : Google Scholar : PubMed/NCBI
|
|
3
|
Brugarolas J: Molecular genetics of
clear-cell renal cell carcinoma. J Clin Oncol. 32:1986–1976. 2014.
View Article : Google Scholar
|
|
4
|
Cummins JM and Velculescu VE: Implications
of micro-RNA profiling for cancer diagnosis. Oncogene.
25:6220–6227. 2006. View Article : Google Scholar : PubMed/NCBI
|
|
5
|
Garzon R, Pichiorri F, Palumbo T,
Visentini M, Ageilan R, Cimmino A, Wang H, Sun H, Volinia S, Alder
H, et al: MicroRNA gene expression during retinoic acid-induced
differentiation of human acute promyelocytic leukemia. Oncogene.
26:4148–4157. 2007. View Article : Google Scholar : PubMed/NCBI
|
|
6
|
Siomi H and Siomi MC: On the road to
reading the RNA-interference code. Nature. 457:396–404. 2009.
View Article : Google Scholar : PubMed/NCBI
|
|
7
|
Cullen BR: Transcription and processing of
human microRNA precursors. Mol Cell. 16:861–865. 2004. View Article : Google Scholar : PubMed/NCBI
|
|
8
|
Bhaskaran M and Mohan M: MicroRNAs:
History, biogenesis, and their evolving role in animal development
and disease. Vet Pathol. 51:759–774. 2014. View Article : Google Scholar : PubMed/NCBI
|
|
9
|
Beroli G, Cava C and Castiglioni I:
MicroRNAs: New biomarkers for diagnosis, prognosis, therapy
prediction and therapeutic tools for breast cancer. Theranostics.
5:1122–1143. 2015. View Article : Google Scholar : PubMed/NCBI
|
|
10
|
Su Z, Yang Z, Xu Y, Chen Y and Yu Q:
MicroRNAs in apoptosis, autophagy and necroptosis. Oncotarge.
6:8474–8490. 2015. View Article : Google Scholar
|
|
11
|
Esquela-Kerscher A and Slack FJ:
Oncomirs-microRNAs with a role in cancer. Nat Rev Cancer.
6:259–269. 2006. View
Article : Google Scholar : PubMed/NCBI
|
|
12
|
Fulci V, Chiaretti S, Goldoni M, Azzalin
G, Carucci N, Tavolaro S, Castellano L, Magrelli A, Citarella F,
Messina M, et al: Quantitative technologies establish a novel
microRNA profile of chronic lymphocytic leukemia. Blood.
109:4944–4951. 2007. View Article : Google Scholar : PubMed/NCBI
|
|
13
|
Volinia S, Calin GA, Liu CG, Ambs S,
Cimmino A, Petrocca F, Visone R, Iorio M, Roldo C, Ferracin M, et
al: A microRNA expression signature of human solid tumors defines
cancer gene targets. Proc Natl Acad Sci USA. 103:2257–2261. 2006.
View Article : Google Scholar : PubMed/NCBI
|
|
14
|
Lu J, Getz G, Miska EA, Alvarez-Saavedra
E, Lamb J, Peck D, Sweet-Cordero A, Ebert BL, Mak RH, Ferrando AA,
et al: MicroRNA expression profiles classify human cancers. Nature.
435:834–838. 2005. View Article : Google Scholar : PubMed/NCBI
|
|
15
|
Vaupel P, Mayer A and Höckel M: Tumor
hypoxia and malignant progression. Methods Enzymol. 381:335–354.
2004. View Article : Google Scholar : PubMed/NCBI
|
|
16
|
Livak KJ and Schmittgen TD: Analysis of
relative gene expression data using real-time quantitative PCR and
the 2(−Delta Delta C(T)) method. Methods. 25:402–408. 2001.
View Article : Google Scholar : PubMed/NCBI
|
|
17
|
Van Schaftingen E, Lederer B, Bartrons R
and Hers HG: A kinetic study of pyrophosphate: Fructose-6-phosphate
phosphotransferase from potato tubers. Application to a microassay
of fructose 2,6-bisphosphate. Eur J Biochem. 129:191–195. 1982.
View Article : Google Scholar : PubMed/NCBI
|
|
18
|
Gutmann I and Wahlefeld AW: Methods of
Enzymatic Analysis. Bergmeyer H.U.: Academic Press; London: 2nd.
v3. pp. 1464–1468. 1974
|
|
19
|
Camps C, Buffa FM, Colella S, Moore J,
Sotiriou C, Sheldon H, Harris AL, Gleadle JM and Ragoussis J:
hsa-miR-210 is induced by hypoxia and is an independent prognostic
factor in breast cancer. Clin Cancer Res. 14:1340–1348. 2008.
View Article : Google Scholar : PubMed/NCBI
|
|
20
|
Hung CH, Chiu YC, Chen CH and Hu TH:
MicroRNAs in hepatocellular carcinoma: Carcinogenesis, progression,
and therapeutic target. Biomed Res Int. 4864072014.PubMed/NCBI
|
|
21
|
Lan H, Lu H, Wang X and Jin H: MicroRNAs
as potential biomarkers in cancer: Opportunities and challenges.
Biomed Res Int. 1250942015.PubMed/NCBI
|
|
22
|
Tan G, Tang X and Tang F: The role of
microRNAs in nasopharyngeal carcinoma. Tumor Biol. 36:69–79. 2015.
View Article : Google Scholar
|
|
23
|
Gowrishankar B, Ibragimova I, Zhou Y,
Slifker M, Devarajan K, Alsaleem T, Uzzo R and Cairns P: MicroRNA
expression signatures of stage, grade, and progression in clear
cell RCC. Cancer Biol Ther. 15:329–341. 2014. View Article : Google Scholar : PubMed/NCBI
|
|
24
|
Cheng T, Wang L, Li Y, Huang C, Zeng L and
Yang J: Differential microRNA expression in renal cell carcinoma.
Oncol Lett. 6:769–776. 2013.PubMed/NCBI
|
|
25
|
Peña-Rico MA, Calvo-Vidal MN,
Villalonga-Planells R, Martínez-Soler F, Giménez-Bonafé P,
Navarro-Sabaté À, Tortosa A, Bartrons R and Manzano A: TP53 induced
glycolysis and apoptosis regulator (TIGAR) knockdown results in
radiosensitization of glioma cells. Radiother Oncol. 101:132–139.
2011. View Article : Google Scholar : PubMed/NCBI
|
|
26
|
Bensaad K, Tsuruta A, Selak MA, Vidal MN,
Nakano K, Bartrons R, Gottlieb E and Vousden KH: TIGAR, a
p53-inducible regulator of glycolysis and apoptosis. Cell.
126:107–120. 2006. View Article : Google Scholar : PubMed/NCBI
|
|
27
|
Wotschofsky Z, Liep J, Meyer HA, Jung M,
Wagner I, Disch AC, Schaser KD, Melcher I, Kilic E, Busch J, et al:
Identification of metastamirs as metastasis-associated microRNAs in
clear cell renal cell carcinomas. Int J Biol Sci. 8:1363–1374.
2012. View Article : Google Scholar : PubMed/NCBI
|
|
28
|
Li C, Li C, Yue J, Huang X, Chen M, Gao J
and Wu B: miR-21 and miR-101 regulate PLAP-1 expression in
periodontal ligament cells. Mol Med Rep. 5:1340–1346.
2012.PubMed/NCBI
|
|
29
|
Chiang CW, Huang Y, Leong KW, Chen LC,
Chen HC, Chen SJ and Chou CK: PKCalpha mediated induction of
miR-101 in human hepatoma HepG2 cells. J Biomed Sci. 17:352010.
View Article : Google Scholar : PubMed/NCBI
|