Introduction
The skin is the body's first line of defense,
providing protection from dehydration, injury, and infection. It
comprises the epidermis and its adjoining structures, including the
hair follicle (HF) and its associated sebaceous gland; together
comprising the pilosebaceous unit. Hair follicles are self-renewing
structures that continuously generate new epithelial cells to
replenish the skin and pilosebaceous unit in response to injury
(1). Skin homeostasis and wound
repair requires the presence of epithelial stem cells as the
primary source for regenerative cells. Multipotent stem cells that
reside within the epidermis and in the bulge region of HFs
(2) can give rise to a variety of
cell types, including those forming HFs, interfollicular epidermis,
and associated epithelial glands (3). Alterations in either proliferation or
differentiation have the potential to disrupt normal skin
homeostasis.
Certain disorders of the skin, such as cancer,
chronic wounds, skin atrophy, skin fragility, hirsutism, and
alopecia, can be, fundamentally, viewed as disorders of skin stem
cells (4). It has been
hypothesized that tumor formation is the result of inappropriate
activation of signaling pathways activating these stem cells or
their immediate multipotent progeny (5). Consistent with this view is the
observation that several types of skin cancers can be derived from
HFs, based on observations of histological presentation and the
presence of specific molecular markers common to HFs and skin
neoplasias (6). Understanding the
molecular mechanisms by which proliferation and differentiation are
regulated in skin appendages may provide a useful insight into the
molecular basis of disease, and may also identify potential targets
for treatment intervention.
Previous findings suggest that a significant subset
of basal cell carcinomas (BCCs) are directly HF-derived (7–9). The
stem cells of the HF bulge region and adjacent cells are a
potential primary source of BCCs derived from HFs (8,10).
In some regard, HFs and BCCs can be defined as ‘ordered’ and
‘disordered’ skin appendage growths, respectively. The primary
mechanism, by which most BCCs develop, a constitutive activation of
the Hedgehog pathway, is a principal regulatory mechanism in HF
development (11). As such, all
BCCs, HF-derived or not, may express similar key growth mechanisms
to those involved in HF growth and cycling.
An important property that is shared by BCCs and HFs
is the ability of cells to repeatedly proliferate, a mechanism that
is responsible for maintaining a tumor mass or normal hair fiber
production, respectively. If BCCs utilize HF growth mechanisms,
growth factors and regulatory networks fundamental to HF growth
would also likely be key mediators of BCC growth and may have the
capacity to induce BCC growth and invasion. Several specific
molecular mechanisms involved in this process of self-renewal,
including the sonic hedgehog (Shh), Notch and Wingless-related
integration site (Wnt) signaling pathways, have been found to be
active in normal HFs and in BCCs (12–16).
However, the roles of these signaling pathways in BCC growth,
particularly Notch signaling, remain poorly understood.
The present study examined the potential molecular
relationships between nodular BCCs and HFs using microarray
profiling, reverse transcription-quantitative polymerase chain
reaction (RT-qPCR), and immunohistochemistry. It was anticipated
that BCCs and HFs would both exhibit activation of common signaling
pathways involved in skin appendage formation (genes and networks
commonly involved in ordered skin appendage growth). Specific
molecular pathway components that code for ‘hair follicleness’ were
also anticipated to be missing or over-represented in BCCs
(candidate genes that regulate the networks important in ordered
appendage growth that have failed in disordered BCC development).
By distinguishing between common pathways and unique pathway
components expressed in each type of skin appendage, the aim of the
present study was to characterize those components important for
BCC growth (genes and networks differentially represented in BCCs
not commonly found in healthy skin epithelium or hair follicle
appendages) and phenotype presentation, and to identify specific
components important for appropriately regulated HF formation.
Materials and methods
Basal cell carcinomas, hair follicles,
non-follicular tissues, and clinical information
All the samples were provided through the Department
of Surgery and the Department of Dermatology and Skin Science,
University of British Columbia, with approval from the University
Clinical Research Ethics Board. Samples of human HFs were collected
from scalp biopsies of normal individuals undergoing cosmetic
procedures, while nodular BCCs and normal skin were obtained from
patients undergoing surgical resection. All the nodular BCC samples
and normal skin epithelium were taken from the facial area of
donors. Only tissue from patients that had not been treated with
preoperative chemotherapy or other therapeutic approaches was
selected for analysis. BCC morphological subtypes were described
and clinically classified during Mohs surgery and initial diagnoses
were subsequently confirmed by formalin-fixed, paraffin-embedded
histological assessment of the tumors.
Hair follicles (n=10-20/subject) were microdissected
to remove the sebaceous gland and upper HF infundibulum and the
lower one third, including the hair bulb. The dermal sheath was
also removed, leaving the inner and outer root sheaths, including
the bulge region, for analysis. Normal skin samples were
microdissected to isolate skin epithelium from the dermal
component. Samples collected for microarray/qPCR were immediately
stored in an RNA stabilization reagent (Qiagen Inc., Toronto, ON,
Canada).
RNA isolation
Total RNA was isolated from microdissected tissue or
cultured cells with an RNeasy Fibrous Tissue Midi kit (Qiagen Inc.)
according to the manufacturer's protocols. The quantity and quality
of the RNA was measured using the Agilent 2100 bioanalyzer and RNA
6000 NANO kit (Agilent Technologies, Inc., Santa Clara, CA, USA),
and the quantity was measured with a NanoDrop ND-100
spectrophotometer (Thermo Fisher Scientific, Inc., Wilmington, DE,
USA).
Microarray production
Human Operon v.2.1 (21K) glass arrays were produced
(based on human 70mers from Eurofins MWG Operon Inc., Huntsville,
AL, USA) by the Microarray Facility of the Prostate Centre at
Vancouver General Hospital (Vancouver, BC, Canada) (17,18).
RNAs were amplified using the SenseAmp Plus kit (Genisphere LLC,
Hatfield, PA, USA). The 260/280 absorbance ratio was used to
determine the appropriate amount of sense RNA for labeling. Total
RNA from test samples and universal human reference RNA (Agilent
Technologies, Inc.) were respectively labeled with cyanine (Cy) 5
and Cy3, using the 3DNA array detection 350 kit (Genisphere LLC)
and cohybridized to cDNA microarrays. Following overnight
hybridization and washing, the arrays were imaged using a ScanArray
Express scanner (PerkinElmer, Inc., Waltham, MA, USA).
Microarray data processing and
analysis
Arrays were scanned at excitation wavelengths of 532
and 635 nm to detect the Cy3 and Cy5 dyes, respectively. Image
analysis and quantification were conducted with Imagene 6.0
commercial software (BioDiscovery Inc, El Segundo, CA, USA). The
raw signal and background medians were used as the input for the
Genespring 7.2 program (Agilent Technologies, Inc.). GeneSpring
allows normalization and multiple filter comparisons of data from
different experiments, thus generating restriction lists and the
functional classification of differentially expressed genes. Raw
data were background corrected and normalized using ‘per chip and
per spot normalization’, which is an intensity-dependent
normalization (non-linear or LOWESS normalization) (19). The expression of each gene is
reported as the ratio of the value obtained for each sample
relative to the universal reference RNA. Data were subsequently
filtered using the raw signal strength value of both channels.
Measurements with higher signal strength value are relatively more
precise than measurements with lower signal strength. Genes that
did not reach this value were discarded (100 out of 65,536). A
condition tree was generated using hierarchical clustering of
unfiltered data from each sample based on the similarity of their
expression data. Similarity was measured using Pearson's
correlation, and distances between clusters were calculated via
average linkage (Fig. 1). The raw
data from the arrays have been entered into the publicly accessible
Gene Expression Omnibus (GEO) database in MIAME compliant format
(http://www.ncbi.nlm.nih.gov/geo/). The
raw data sets are encompassed by a series record number
(GSE12542).
Analysis of gene expression
differences and similarities
The comparison analyses were conducted by the
‘significance analysis of microarrays’ (SAM) method (20). Gene expression associated with
nodular BCCs (n=8 subjects) and HF root sheaths (n=7 subjects) was
first evaluated and contrasted (Tables
IA and B, and II). The
differences analysis between BCCs and HF root sheaths was conducted
by the SAM method with a cut-off q-value of 14% and a 2-fold
cut-off (Table IA and B). The
2-fold cut-off was employed to reduce the incidence of
false-positive results, which can occur when using t-tests
(replicates can have similar results by chance), but the
probability of which is decreased at higher fold changes.
Subsequently, as a prelude to defining the degree of similarity in
gene expression between BCCs and HF root sheaths, the cut-off
q-value was set to be >40% and the fold change <1.5 (Table II). The cut-off level of <1.5
helped to reduce the selection of genes that were not necessarily
regulated, but had a sizable error between their replicate values.
A comparison analysis between HF root sheaths and skin (n=8
subjects) was conducted by the SAM method (data not shown). SAM was
also used to identify genes differentially regulated between BCC
and the normal skin samples as demonstrated in a previous study
(21).
 | Table I.Gene transcripts. |
Table I.
Gene transcripts.
| A, Top 20 gene
transcripts with the highest magnitude fold-change in gene
expression upregulation in nodular basal cell carcinomas vs. hair
shafts, sorted by the false discovery rate (q-value) |
|---|
|
|---|
| Gene product
description | Gene name | GenBank accession
number | Fold-change | q-value (%) |
|---|
| Dipeptidylpeptidase
IV (CD26, adenosine | DPP4 | NM_001935 | 11.13121 | 0 |
| Rag D protein
deaminase complexing protein 2) | RAGD | AL137502 | 8.835887 | 0 |
| DKFZP564O0463
protein |
DKFZP564O0463 | AK001693 | 2.87002 | 0 |
| Propionyl coenzyme
A carboxylase, β polypeptide | PCCB | NM_000532 | 37.27286 | 0.326689 |
| DEAD/H
(Asp-Glu-Ala-Asp/His) box polypeptide, Y chromosome | DBY | NM_004660 | 18.25926 | 0.326689 |
| Ras homolog gene
family, member A | ARHA | NM_001664 | 7.591441 | 0.326689 |
| Ubiquitin-like
3 | UBL3 | NM_007106 | 7.215993 | 0.326689 |
| Baculoviral IAP
repeat-containing 3 | BIRC3 | AF070674 | 7.08567 | 0.326689 |
| Small nuclear
ribonucleoprotein polypeptide E | SNRPE | NM_003094 | 5.495296 | 0.326689 |
| Splicing factor,
arginine/serine-rich 10 (transformer 2 homolog, Drosophila) | SFRS10 | NM_004593 | 5.367942 | 0.326689 |
| Proteasome
(prosome, macropain) 26S subunit, non-ATPase, 5 | PSMD5 | BC014478 | 4.612349 | 0.326689 |
| Ubiquitously
transcribed tetratricopeptide repeat gene, X chromosome | UTX | NM_021140 | 4.392788 | 0.326689 |
| Methionyl
aminopeptidase 2 | METAP2 | NM_006838 | 4.388392 | 0.326689 |
| Actin related
protein 2/3 complex, subunit 5 (16 kDa) | ARPC5 | NM_005717 | 3.719303 | 0.326689 |
| Sin3-associated
polypeptide, 18 kDa | SAP18 | NM_005870 | 2.477771 | 0.326689 |
| F-box and
leucine-rich repeat protein 3A | FBXL3A | NM_012158 | 6.425926 | 0.523782 |
|
β-2-microglobulin | B2M | AK026463 | 5.708535 | 0.523782 |
| A disintegrin and
metalloproteinase domain 9 (meltrin γ) | ADAM9 | NM_003816 | 4.995793 | 0.523782 |
| Lactate
dehydrogenase A | LDHA | NM_005566 | 4.698842 | 0.523782 |
| Protein kinase C,
ζ | PRKCZ | NM_002744 | 4.646151 | 0.523782 |
|
| B, Top 20 gene
transcripts with the highest magnitude fold-change in gene
expression downregulation in nodular basal cell carcinomas vs. hair
shaft, sorted by the false discovery rate (q-value) |
|
| Gene product
description | Gene name | GenBank accession
number | Fold-change | q-value (%) |
|
| Keratin-associated
protein 4.14 | KAP4.14 | NM_033059 | 0.014887 | 0 |
| Keratin-associated
protein 4.10 | KAP4.10 | NM_033060 | 0.018098 | 0 |
| Keratin-associated
protein 3.2 |
KRTAP3.2 | NM_031959 | 0.026814 | 0 |
| Keratin-associated
protein 4.8 |
KRTAP4.8 | AJ406940 | 0.055245 | 0 |
| Chromosome 20 open
reading frame 28 |
C20orf28 | NM_015417 | 0.061437 | 0 |
| Lymphotoxin α (TNF
superfamily, member 1) | LTA | NM_000595 | 0.079272 | 0 |
| Desmoplakin (DPI,
DPII) | DSP | NM_004415 | 0.087855 | 0 |
| Suppressor of Ty 5
homolog (S. cerevisiae) | SUPT5H | NM_003169 | 0.089178 | 0 |
| Neuronal protein
17.3 | P17.3 | NM_019056 | 0.095102 | 0 |
| Leucine zipper
protein 1 | LUZP1 | BC002428 | 0.097131 | 0 |
| Breast carcinoma
amplified sequence 1 | BCAS1 | NM_003657 | 0.097779 | 0 |
| Ubiquitin fusion
degradation 1-like | UFD1L | NM_005659 | 0.098738 | 0 |
| D component of
complement (adipsin) | DF | NM_001928 | 0.11378 | 0 |
| Ribosomal protein
S8 | RPS8 | AK023362 | 0.138395 | 0 |
| LIM and
cysteine-rich domains 1 | LMCD1 | NM_014583 | 0.149755 | 0 |
| Glutamate receptor,
metabotropic 2 | GRM2 | NM_000839 | 0.153922 | 0 |
| Ephrin-B2 | EFNB2 | NM_004093 | 0.157336 | 0 |
| Ribosomal protein
L38 | RPL38 | NM_000999 | 0.157418 | 0 |
| Loss of
heterozygosity, 12, chromosomal region 1 |
LOH12CR1 | NM_058169 | 0.169164 | 0 |
| Table II.Top 20 gene transcripts with the
fold-change most consistently close to 0 between nodular basal cell
carcinomas and hair shafts, sorted by the false discovery rate
(q-value). |
Table II.
Top 20 gene transcripts with the
fold-change most consistently close to 0 between nodular basal cell
carcinomas and hair shafts, sorted by the false discovery rate
(q-value).
| Gene product
description | Gene name | GenBank accession
number | Fold-change | q-value (%) |
|---|
| Proteasome
(prosome, macropain) subunit, α type, 4 | PSMA4 | AK055714 | 1.001521 | 38.71807 |
| Calcium channel,
voltage-dependent, β 1 subunit | CACNB1 | M92303 | 1.001613 | 38.71807 |
| Leucine-zipper-like
transcriptional regulator, 1 | LZTR1 | NM_006767 | 1.001924 | 38.71807 |
| F-box only protein
21 | FBXO21 | NM_033624 | 1.002044 | 38.71807 |
| Carnitine
deficiency-associated gene expressed in ventricle 1 | CDV-1 | NM_014055 | 1.002094 | 38.71807 |
| Neurofibromin 1
(neurofibromatosis, von Recklinghausen disease, Watson
disease) | NF1 | NM_000267 | 1.002262 | 38.71807 |
| Suppression of
tumorigenicity 14 (colon carcinoma, matriptase, epithin) | ST14 | NM_021978 | 1.002397 | 38.71807 |
| Ecotropic viral
integration site 5 | EVI5 | AF008915 | 1.002636 | 38.71807 |
| Otoraplin | OTOR | NM_020157 | 1.00287 | 38.71807 |
| HEMK homolog
7kb | HEMK | NM_016173 | 1.002877 | 38.71807 |
| Complement
component 9 | C9 | NM_001737 | 1.003119 | 38.71807 |
| RAB11A, member RAS
oncogene family | RAB11A | NM_004663 | 1.003131 | 38.71807 |
| ß-actin | ACTB | NA | 0.999976 | 48.18056 |
| Homeobox A6 | HOXA6 | NM_024014 | 0.99973 | 48.18056 |
| Pituitary
tumor-transforming 1 interacting protein | PTTG1IP | NM_004339 | 0.99972 | 48.18056 |
| Peroxisome
biogenesis factor 10 | PEX10 | NM_002617 | 0.999621 | 48.18056 |
| Bombesin-like
receptor 3 | BRS3 | NM_001727 | 0.999605 | 48.18056 |
| Doublesex and mab-3
related transcription factor 2 | DMRT2 | NM_006557 | 0.999424 | 48.18056 |
| High-mobility group
(nonhistone chromosomal) protein 4-like | HMG4L | AL049709 | 0.998903 | 48.18056 |
|
Microfibril-associated glycoprotein-2 | MAGP2 | NM_003480 | 0.99872 | 48.18056 |
Gene ontology analysis
Functional classification of genes was performed
using DAVID software 6.70 (22,23),
based on the Gene Ontology (GO) database (www.geneontology.org), to allow the identification of
‘enriched’ or ‘depleted’ gene function categories in assigned
biological processes, molecular functions, and cellular components
(24,25). This program was used to identify
genes belonging to different GO categories (derived from Tables I and II). Benjamini-corrected P<0.05 was
used as the cut-off for determination of significant gene
enrichment in each defined category. P≤0.05 indicated that the
applied genes listed were specifically associated (enriched) in a
category, as opposed to random chance, and were selected. For
25–40% of the genes defined, no GO annotation was given and their
function was unknown. Ontological analyses were performed at
biological process category level 3. The number of genes identified
in major categories were normalized by the number of genes
annotated in each list and were expressed as percentages (Tables III and IV).
| Table III.Most commonly identified categories
with differences in GO categorization analysis between nodular
basal cell carcinomas and hair shafts at GO level 3. |
Table III.
Most commonly identified categories
with differences in GO categorization analysis between nodular
basal cell carcinomas and hair shafts at GO level 3.
| GO category | Number of genes in
category | Percentage of total
genes in gene set | P-value | Benjamini |
|---|
| Regulation of
cellular process | 966 | 24.8 | 3.50E-13 | 2.90E-10 |
| Negative regulation
of cellular process | 297 | 7.6 | 5.20E-12 | 1.50E-09 |
| Negative regulation
of biological process | 308 | 7.9 | 4.30E-12 | 1.80E-09 |
| System
development | 417 | 10.7 | 1.00E-09 | 2.10E-07 |
| Regulation of
programmed cell death | 147 | 3.8 | 3.30E-07 | 5.60E-05 |
| Positive regulation
of cellular process | 243 | 6.2 | 5.20E-07 | 6.30E-05 |
| Positive regulation
of biological process | 266 | 6.8 | 5.00E-07 | 7.00E-05 |
| Biopolymer
metabolic process | 1090 | 27.9 | 8.30E-07 | 7.80E-05 |
| Organ
development | 301 | 7.7 | 8.00E-07 | 8.40E-05 |
| Anatomical
structure morphogenesis | 269 | 6.9 | 1.30E-06 | 1.10E-04 |
| Cell death | 206 | 5.3 | 1.70E-06 | 1.30E-04 |
| Cell cycle
process | 187 | 4.8 | 2.70E-06 | 1.90E-04 |
| Organ
morphogenesis | 114 | 2.9 | 3.40E-06 | 2.20E-04 |
| Regulation of
metabolic process | 628 | 16.1 | 6.60E-06 | 4.00E-04 |
| Regulation of cell
cycle | 137 | 3.5 | 9.80E-06 | 5.50E-04 |
| Regulation of
cellular metabolic process | 604 | 15.5 | 2.00E-05 | 1.00E-03 |
| Regulation of gene
expression | 582 | 14.9 | 2.10E-05 | 1.00E-03 |
| Cell
differentiation | 399 | 10.2 | 4.20E-05 | 2.00E-03 |
| Regulation of
protein metabolic process | 85 | 2.2 | 4.90E-05 | 2.20E-03 |
| Regulation of cell
proliferation | 126 | 3.2 | 7.80E-05 | 3.30E-03 |
| Table IV.Most commonly identified categories
with similarities in GO categorization between nodular basal cell
carcinomas and hair shafts at GO level 3. |
Table IV.
Most commonly identified categories
with similarities in GO categorization between nodular basal cell
carcinomas and hair shafts at GO level 3.
| GO category | Number of genes in
category | Percentage of total
genes in gene set | P-value | Benjamini |
|---|
| Cellular catabolic
process | 317 | 6.5 | 1.50E-05 | 1.70E-02 |
| Cellular nitrogen
compound metabolic process | 1015 | 20.7 | 6.40E-05 | 3.40E-02 |
| Cellular
macromolecule metabolic process | 1412 | 28.8 | 8.20E-05 | 2.90E-02 |
| Regulation of
localization | 194 | 4 | 1.70E-04 | 4.50E-02 |
| Sterol metabolic
process | 43 | 0.9 | 2.30E-04 | 4.90E-02 |
| Regulation of cell
motion | 72 | 1.5 | 2.40E-04 | 4.20E-02 |
| Nucleobase,
nucleoside, nucleotide and nucleic acid metabolic process | 938 | 19.1 | 3.10E-04 | 4.70E-02 |
| Regulation of cell
migration | 63 | 1.3 | 6.20E-04 | 8.00E-02 |
| Regulation of
multicellular organismal process | 279 | 5.7 | 8.70E-04 | 1.00E-01 |
| Regulation of
locomotion | 69 | 1.4 | 1.10E-03 | 1.10E-01 |
| Regulation of cell
communication | 304 | 6.2 | 1.60E-03 | 1.50E-01 |
| Lipid
transport | 54 | 1.1 | 1.60E-03 | 1.40E-01 |
| Response to organic
nitrogen | 28 | 0.6 | 1.70E-03 | 1.30E-01 |
| Cellular amino acid
and derivative metabolic process | 114 | 2.3 | 2.10E-03 | 1.50E-01 |
| Positive regulation
of cellular process | 518 | 10.5 | 2.20E-03 | 1.40E-01 |
| Regulation of
myeloid cell differentiation | 30 | 0.6 | 2.20E-03 | 1.40E-01 |
| Microtubule
organizing center organization | 18 | 0.4 | 2.40E-03 | 1.40E-01 |
| Positive regulation
of biological process | 566 | 11.5 | 2.50E-03 | 1.40E-01 |
| Regulation of
cellular component organization | 143 | 2.9 | 2.80E-03 | 1.50E-01 |
| Peptide metabolic
process | 24 | 0.5 | 3.00E-03 | 1.50E-01 |
RT-qPCR
Total RNA from each sample (1 µg) was
reverse-transcribed into first-strand cDNA according to the
protocol of the Superscript III first-strand cDNA synthesis system
(Invitrogen; Thermo Fisher Scientific, Inc., Waltham, MA, USA). The
primers used for SYBR Green qPCR were designed using the Prime Time
qPCR Primer Design Software (Integrated DNA Technologies, Inc.,
Coralville, IA, USA; Table V) and
tested with the intron-spanning assay. Assays are defined as
intron-spanning if at least one exon/exon border is either directly
covered by one primer or contained between the primer binding
sites. Compared to the median spanned intron size (2.1 kb), the
median Real Time ready assay amplicon size (75 bp) is approximately
30-times shorter. In conjunction with a short amplification time,
this size difference can be exploited to gain specificity for
mRNA-derived cDNA template vs. template-derived from residual
genomic DNA. qPCR was performed using the Applied Biosystems
StepOnePlus Real-Time PCR System (Applied Biosystems; Thermo Fisher
Scientific, Inc.) according to the manufacturer's protocol. The
thermal cycling conditions consisted of 2 min at 50°C and 2 min at
95°C, followed by 40 cycles of 95°C for 15 sec and 60°C for 1 min.
Data were analyzed by the comparative threshold cycle method
(26) with normalization to human
glyceraldehyde-3-phosphate dehydrogenase (GAPDH). Changes in gene
expression following treatments were recorded as fold differences
from values in untreated controls.
| Table V.Primer sequences for defined
genes. |
Table V.
Primer sequences for defined
genes.
| Gene name | Genbank accession
no. | Forward primer
(5′-3′) | Reverse primer
(5′-3′) | Amplicon size |
|---|
| NOTCH1 | NM_017617 |
GAGGCGTGGCAGACTATGC |
CTTGTACTCCGTCAGCGTGA | 140 |
| NOTCH2 | NM_024408 |
TATTGATGACTGCCCTAACCACA |
ATAGCCTCCATTGCGGTTGG | 187 |
| NOTCH4 | NM_004557 |
GGGTGAGACGTGCCAGTTTC |
CTGGGTGTCAATGGAGAGGGA | 126 |
| DTX1 | NM_004416 |
GGTGTGGGAGTGTCTGAATGA |
CCTGGCGAAACTGGTGCAT | 176 |
| DTX2 | NM_020892 |
GCAAGCCTTTCAGATTTGCCC |
GCTGGCACAAACTGTCCCTT | 121 |
| LNX1 | NM_032622 |
TTGGCTCAGTCCTGCTAACTA |
GGAAGGCACCTTTACAGAGTTCT | 80 |
| DVL2 | NM_004422 |
GAGGAAGAGACTCCCTACCTG |
CGGGCGTTGTCATCTGAAAT | 167 |
| NUMB | NM_001005743 |
CTACCTTCCAAGGGACCGAGT |
AGCCCGGACGTTTTTAGACAC | 131 |
| JAG1 | NM_000214 |
TCGGGTCAGTTCGAGTTGGA |
AGGCACACTTTGAAGTATGTGTC | 143 |
| JAG2 | NM_002226 |
AGCTGGACGCCAATGAGTG |
GTCGTTGACGTTGATATGGCA | 131 |
| LFNG | NM_001040167 |
GGGTCAGCGAGAACAAGGTG |
GATCCGCTCAGCCGTATTCAT | 140 |
| KRT17 | NM_000422 |
GGTGGGTGGTGAGATCAATGT |
CGCGGTTCAGTTCCTCTGTC | 158 |
| HES1 | NM_005524 |
ATGGAGAAAAATTCCTCGTCCC |
TTCAGAGCATCCAAAATCAGTGT | 182 |
| HES7 | NM_032580 |
CGGGATCGAGCTGAGAATAGG |
GCGAACTCCAATATCTCCGCTT | 176 |
| HR | NM_018411 |
AGGAGGCCATGCTTACCCAT |
CACTATGCTCAGGCATCAGGG | 84 |
| RBPSUHL | NM_014276 |
CAGTGCCTCCCAATCCTTTGA |
CCTCCCCTCAGAATGGTGGT | 139 |
| DAAM1 | NM_014992 |
GGTGGACGAGGTATTTCATTCAT |
TCTGAAGCGCAAAGTTGCTATC | 100 |
| MAPK8 | NM_002750 |
AGCAAGCGTGACAACAATTTTT |
GAAATGGTCGGCTTAGCTTCT | 175 |
| GLI1 | NM_005269 |
GGCACCATGAGCCCATCTC |
ATCACCTTCCAAGGGTTCCTC | 216 |
| GLI2 | NM_005270 |
CCCACTCCAACGAGAAACCC |
GGACCGTTTTCACATGCTTCC | 96 |
| RAC1 | NM_198829 |
ATCCGCAAACAGATGTGTTCT |
CGCACCTCAGGATACCACT | 91 |
| ROCK2 | NM_004850 |
TTGGTTCGTCACAAGGCATC |
AGGGGCTATTGGCAAAGGC | 130 |
| FASL | NM_000639 |
AAAGGAGCTGAGGAAAGTGG |
CATAGGTGTCTTCCCATTCCAG | 80 |
Immunohistochemistry
Protein expression coded by Notch homolog 1
(NOTCH1), Jagged 2 (JAG2), Disheveled 2 (DVL2), and Hairy and
Enhancer of Split 7 (HES7) was assessed by immunohistochemistry on
formalin-fixed, paraffin-embedded biopsies (tissues from 4
individuals per group). Biopsy samples were incubated at room
temperature for 1 h with the following primary antibodies:
Anti-NOTCH1 (cat. no. ab526271; dilution, 100; Abcam, Cambridge,
MA, USA), anti-JAG2 (cat. no. ab60041; dilution, 1:50; Abcam),
anti-DVL2 (cat no. sc-13974, dilution, 1:100; Santa Cruz
Biotechnology, Inc., Dallas, TX, USA) and anti-HES7 (cat. no.
ARP37926_P05; dilution, 1:100; Aviva Systems Biology Co., San
Diego, CA, USA). Following incubation, Tris-buffered saline (0.05
mol/l; Dako North America, Inc.) was used to wash the membranes.
The antibody expression was then characterized using the Universal
Dako Cytomation Labeled Streptavidin-Biotin kit (Dako North
America, Inc., Carpinteria, CA, USA), according to the
manufacturer's instructions, with 3,3′-diaminobenzidine as the
development substrate. For the negative controls, the primary
antibody was replaced with mouse immunoglobulin G at the
appropriate dilution. The sections were counterstained with Harris'
hematoxylin at room temperature for 30 sec and mounted in Permount
(Thermo Fisher Scientific, Inc.). Five visual fields were randomly
selected per tissue section for assessment at 400x magnification
using a standard pathology microscope (BX40; Olympus Corporation,
Richmond Hill, ON, Canada).
Human root sheath cell (HRSC) and BCC
cell culture and treatment
HF units were obtained by removing the fat layer;
hair bulb and dermal sheath were subsequently removed to expose the
outer and inner root sheaths of the HFs. Each tissue was then
treated with TrypLE Express (Invitrogen; Thermo Fisher Scientific,
Inc.) for 15 min to dissociate the HF keratinocytes [termed ‘human
root sheath cells’ (HRSCs)] into a single-cell suspension for
culturing. Following digestion, the cells from groups of five HFs
were combined and cultured in BioCoat collagen-I coated 24-well
plates (BD Biosciences, Franklin Lakes, NJ, USA) in 50% Defined
Keratinocyte-serum free medium (Invitrogen; Thermo Fisher
Scientific, Inc.) combined with 50% EpiLife (Invitrogen; Thermo
Fisher Scientific, Inc.) with a Human Keratinocyte Growth
Supplement (HKGS) kit (Invitrogen; Thermo Fisher Scientific, Inc.).
Colonies of HRSCs formed in ~1 week, during which fresh media were
added every 2 days to replenish the culture, and the cells were
passaged into T25 collagen-I-coated flasks (BD Biosciences). Human
BCCs were isolated from nodular BCC samples and cultured in base
medium M154 (Invitrogen; Thermo Fisher Scientific, Inc.) with HKGS,
as described (27).
Each time the culture reached 90% confluence, HRSCs
or BCCs were passaged into a T25 flask. At the end of passage 3,
HRSCs or BCCs were transferred to BioCoat collagen-I-coated 6-well
plates (Corning Incorporated, Corning, NY, USA) with a density of
60,000 cells/ml per well for one day. The next day, the media
specific for HRSCs or BCCs were replenished and the cells were
incubated with 4 mM recombinant JAG1 or scrambled JAG1 (both from
AnaSpec Inc., Fremont, CA, USA) for 3 days. At the end of
treatment, the cells were collected for further investigations.
Western blot analysis
Following treatment, the cells were washed twice
with ice-cold phosphate-buffered saline and lysed in an ice-cold 1X
radioimmunoprecipitation assay buffer [10 mmol/l Tris-HCl (pH 8.0),
140 mmol/l NaCl, 1 mmol/l ethylenediaminetetraacetic acid (pH 8.0),
0.5 mmol/l ethylene glycol-bis (β-aminoethyl
ether)-N,N,N',N'-tetraacetic acid, 1% Triton X-100, 0.1% sodium
dodecyl sulfate (SDS), 0.1% sodium deoxycholate] containing
protease inhibitors (Sigma-Aldrich; Merck Millipore, Darmstadt,
Germany). The extract was centrifuged at 16,400 × g for 15 min at
4°C to remove cellular debris, and protein concentrations were
determined by Bradford assay (Bio-Rad Laboratories, Inc., Hercules,
CA, USA). Protein samples (20 µg) were then separated by 10%
SDS-polyacrylamide gel electrophoresis and transferred onto
polyvinylidene fluoride membranes (Bio-Rad Laboratories, Inc.). The
membranes were blocked at room temperature for 1 h in Tris-buffered
saline containing 0.01% Tween 20 with 5% non-fat dried milk, and
incubated overnight at 4°C with anti-Fas ligand (cat. no. ab68338;
dilution, 1:1,000; Abcam) or anti-caspase-8 (cat. no. 9746S;
dilution, 1:1,000; Cell Signaling Technology, Inc., Danvers, MA,
USA). The membranes were washed, and incubated with
1:15,000-diluted IRDye 680LT anti-rabbit (cat. no. P/N 925-68021)
or IRDye 800CW anti-mouse (cat. no. P/N 925–32210) secondary
antibodies (LI-COR Biosciences, Lincoln, NE, USA) for 1 h at room
temperature. Signals were detected with the Odyssey infrared
imaging system (LI-COR Biosciences). Antiserum to total β-actin
(cat. no. sc-1616; dilution, 1:5,000; Santa Cruz Biotechnology,
Inc.) was used as the internal control. Scion Image Analysis
software (version 4.0.3.2; Scion Co., Frederick, MD, USA) was used
to determine protein density levels.
Flow cytometric analysis
Apoptosis of JAG1-treated HRSCs and BCCs was
quantified using an Annexin V-Propidium Iodide Apoptosis Detection
Kit (cat. no. 88-8005-72; eBioscience, Inc., San Diego, CA, USA)
according to the manufacturer's instructions. The samples were
analyzed following appropriate fluorescence compensation and gating
strategies with a FACSCanto-II flow cytometer (BD Biosciences), and
analyzed using FlowJo software (version 9.0; FlowJo, LLC, Ashland,
OR, USA).
Statistical analysis
Data were presented as the mean ± standard deviation
from at least three sets of experiments (each from a separate
subject). qPCR samples were assayed in triplicate for each
experiment. Data were analyzed by one-way analysis of variance,
followed by Tukey's multiple comparison tests if the overall
P-values were significant, using the computer software PRISM
(version 6.0c; GraphPad Software, Inc., San Diego, CA). P<0.05
was considered to indicate a statistically significant
difference.
Results
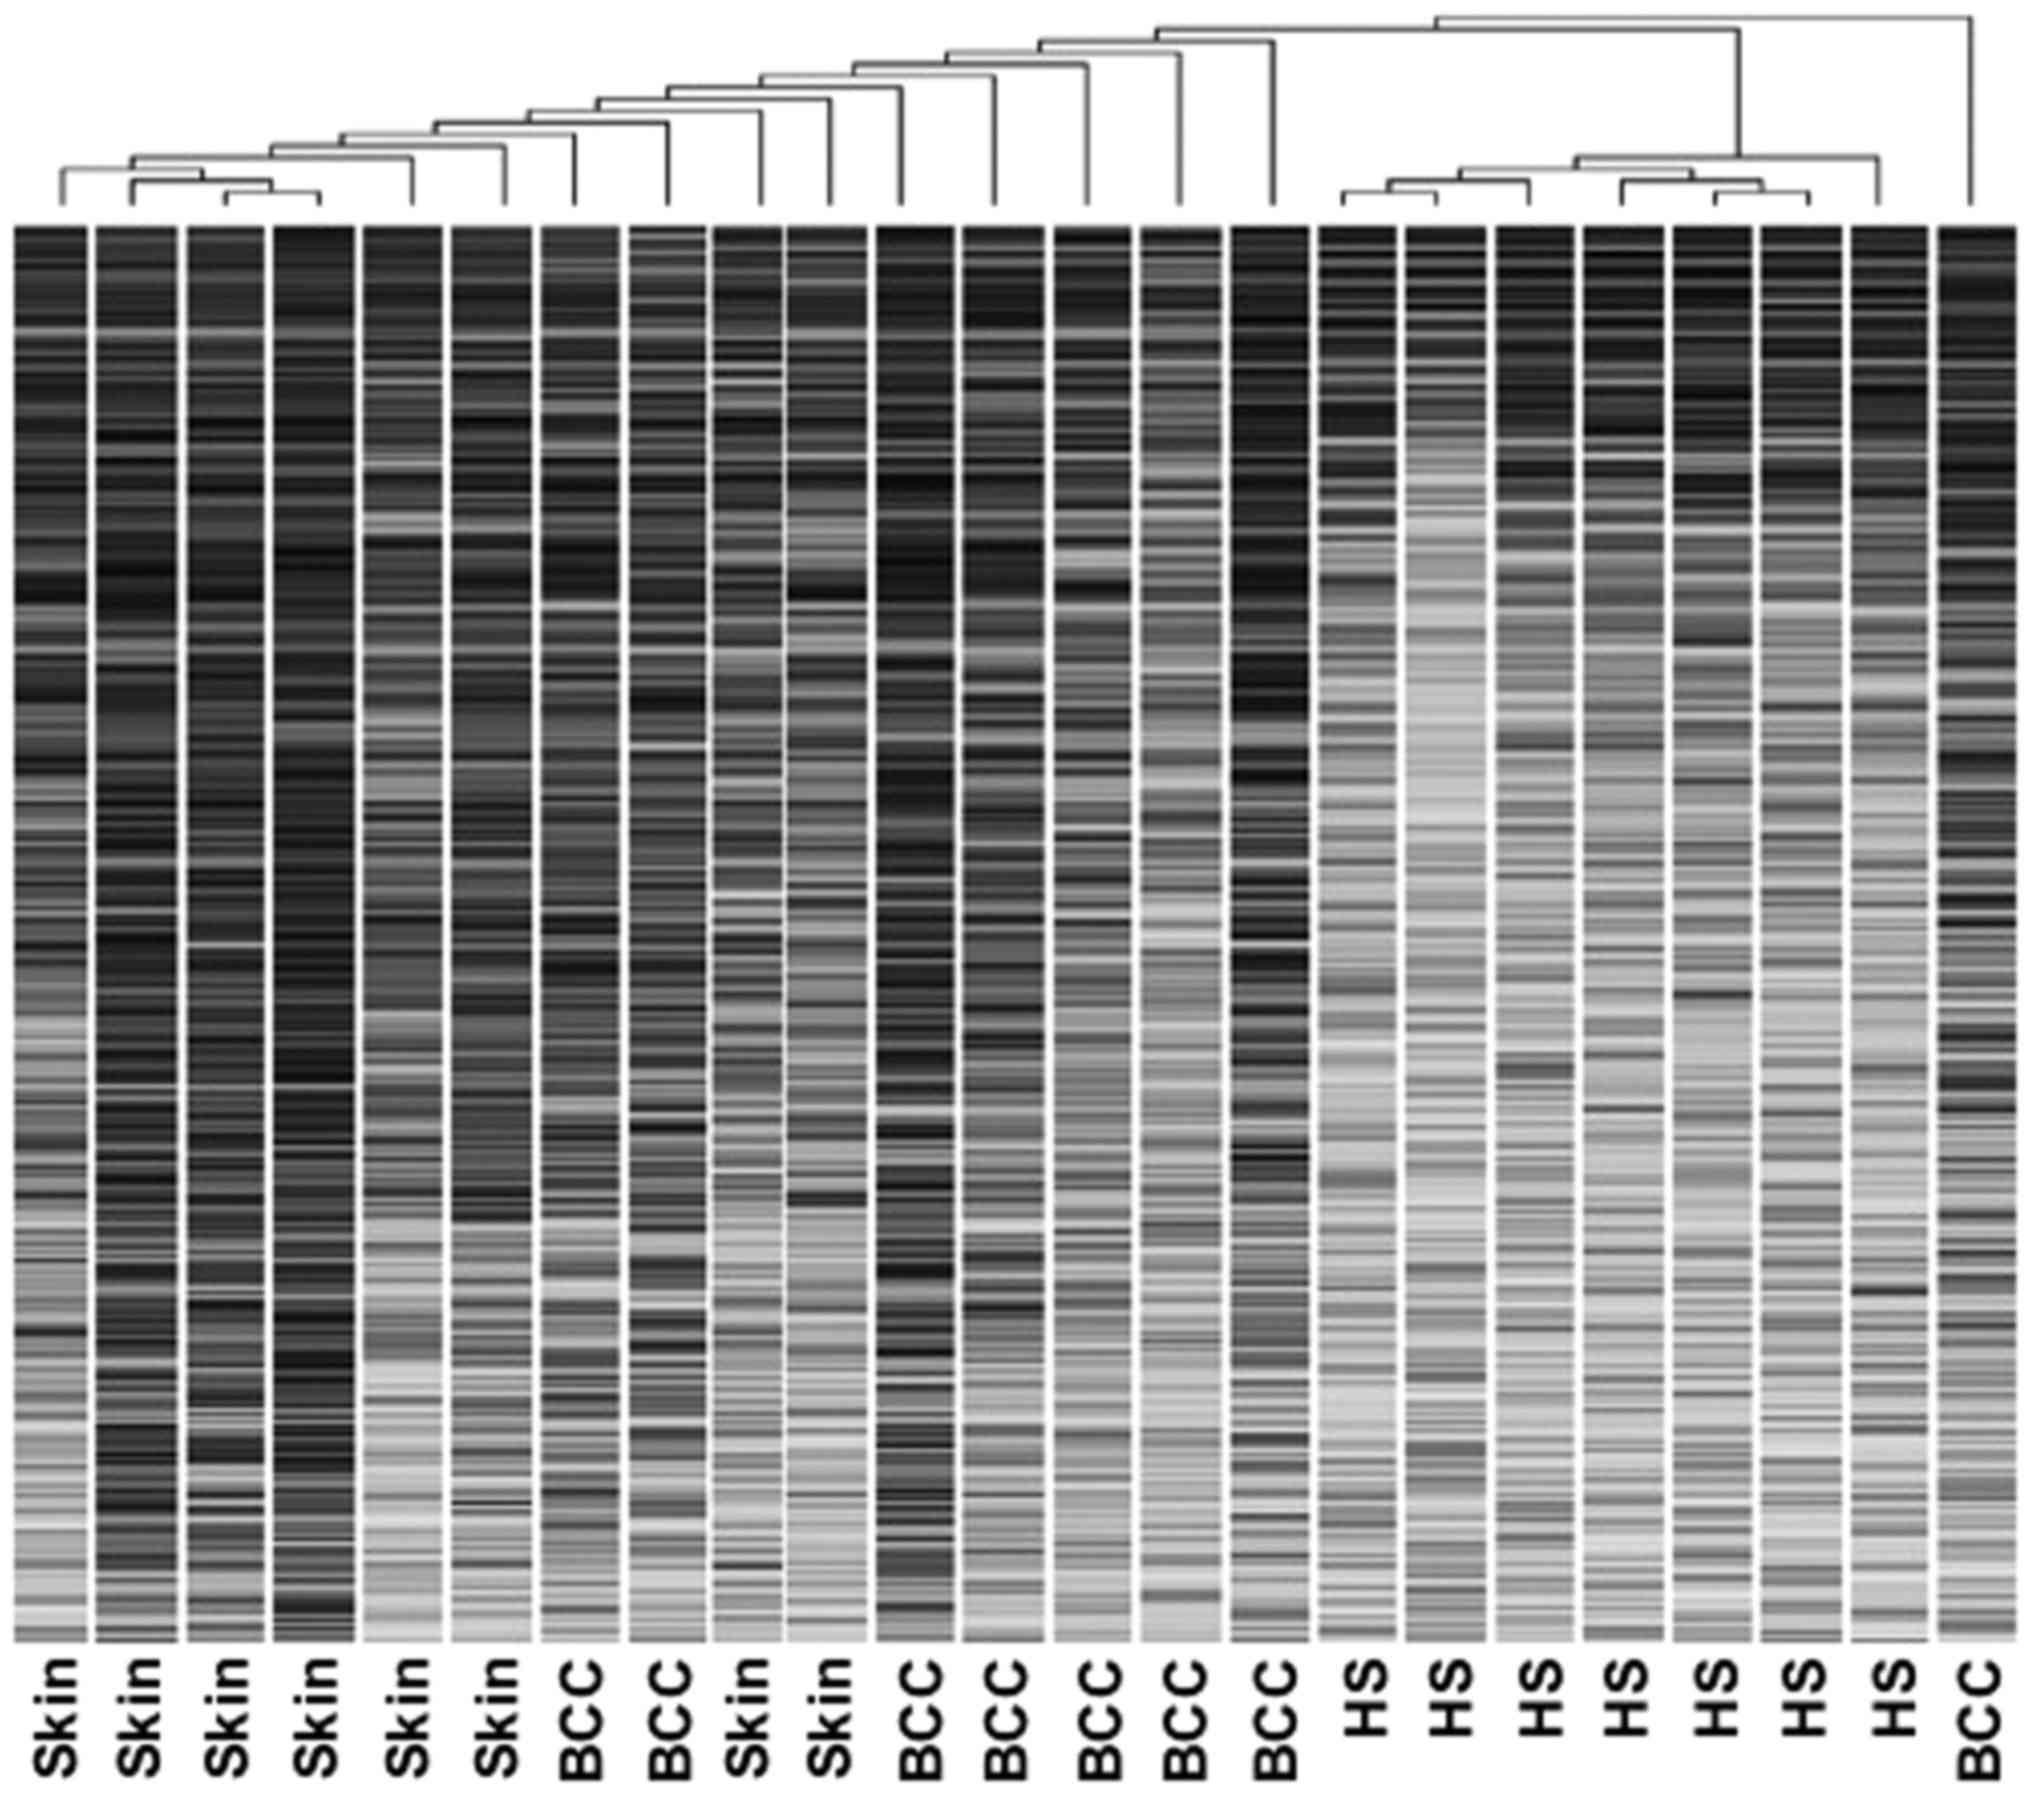
Comparison of sample expression
profiles by hierarchical clustering
Unsupervised hierarchical clustering analysis
(average linkage method) was applied to the unfiltered datasets
from BCCs and normal skin samples from patients undergoing surgical
resection, and HF root sheaths from normal individuals undergoing
cosmetic procedures. This produced a dendrogram with well-defined
cluster groups of cases (Fig. 1).
The HF root sheath data were clearly separated from BCC and normal
skin data sets with distinct gene expression profiles, but
exhibited close similarity within the group. Normal skin samples
also yielded relatively distinctive expression profiles. Compared
with the HF root sheath and normal skin, BCCs were less readily
identified by computer analysis as a distinct entity. Overall, the
segregation of data at the molecular level was consistent with the
histological distinction of BCCs, HF root sheaths, and normal skin
(Fig. 1).
Analysis of gene expression
differences and similarities between basal cell carcinoma and hair
follicle root sheaths
Gene expression associated with HF root sheaths and
BCCs was evaluated, and the two data sets were directly compared.
The results indicated that 4329 genes were differentially expressed
in BCCs compared with the HF root sheaths with statistical
significance (P<0.05). Of these, 3562 genes were upregulated and
767 were downregulated in BCCs compared with the HF root sheaths.
Tables IA and B show the top 20
genes exhibiting the highest magnitude of fold-change, with those
upregulated in Table IA and those
downregulated in Table IB. In
addition, the top 20 genes with the fold-change most consistently
close to 0 (no change) are listed in Table II.
Similarities and differences in Gene
Ontology categorization analysis between basal cell carcinoma and
hair follicle root sheaths
Tables I and
II were functionally annotated
using GO terms, providing a controlled vocabulary to describe
genes/gene product attributes to evaluate the potential
significance in gene expression functions. The 20 most commonly
identified, statistically significant, GO term results (adjusted
P<0.05) for genes significantly differentially or similarly
expressed in BCCs compared with the HF root sheaths are listed in
Tables III and IV, respectively.
The GO analysis revealed that the differentially
expressed genes (Table I) and
similarly expressed genes (Table
II) in BCCs and HF root sheaths were significantly enriched in
the designated functional category of ‘developmental process’. For
example, significantly differently expressed genes were enriched in
‘embryonic morphogenesis development’, a subcategory of
‘developmental process’. Two-hundred and ninety-seven significantly
similarly expressed genes were observed to be associated with
‘regulation of multicellular organismal process’ and 518 similarly
expressed genes were associated with ‘positive regulation of
cellular process’, which are also subcategories under
‘developmental process’ and ‘multicellular organismal
development’.
Enrichment in several gene function categories was
commonly identified within significantly differentially expressed
genes, including ‘cell cycle phase’, ‘cell cycle process’, ‘cell
death’, ‘cell differentiation’, ‘cell maturation’, ‘G1/S transition
of mitotic cell cycle’, ‘cell motility’ and ‘cell-cell signaling’,
under the primary category of ‘cellular process’ (Table III). In addition, gene enrichment
of some subcategories under the term of ‘regulation of cellular
process’ was observed, including ‘regulation of cell cycle’,
‘regulation of cell proliferation’, ‘regulation of gene
expression’, ‘epigenetic’, ‘regulation of signal transduction’,
‘regulation of transcription’ and ‘regulation of translation’
(Table III).
In parallel, of the genes similarly expressed in
BCCs and HF root sheaths, numerous genes with a similar expression
were observed in gene function subcategories of the term ‘cellular
process’, including ‘positive regulation of cellular process’,
‘regulation of cell communication’, ‘regulation of multicellular
organismal process’, ‘regulation of cell migration’ and ‘regulation
of localization’ (Table IV).
Subcategories such as ‘cellular amino acid and derivative metabolic
process’, ‘nucleobase, nucleoside, nucleotide and nucleic acid
metabolic process’ and ‘sterol metabolic process’, were also found
enriched with similarly expressed genes within the category
‘metabolic process’ (Table IV).
The GO analysis also indicated that a number of genes, both
similarly and differentially expressed between BCCs and HF root
sheaths, are involved in categories under the term of ‘positive
regulation of cellular process’. The data suggest patterns of gene
activity consistent with skin appendages, though with significant
distinctions in individual expression of genes between BCCs and
HFs.
Biological network and pathway
analysis of basal cell carcinoma and hair shafts
To assess which signaling pathways were affected
during early gene regulation, the genes in Tables I and II were classified and grouped into
pathways, based on pathway information imported from the Kyoto
Encyclopedia of Genes and Genomes (KEGG; http://www.genome.jp/kegg/). Pathways that may be
involved in both hair morphogenesis and tumorigenesis were the
primary focus, based on published knowledge: The Shh, Notch, and
Wnt signaling pathways. Based on the gene set that included genes
differentially expressed between the HF root sheaths and nodular
BCCs (Table I), 6 genes involved
in the Shh signaling pathway were identified, 23 genes in the Wnt
signaling pathway, and 4 genes in the Notch signaling pathway.
Genes with similar trends of expression in BCCs and HF root sheaths
were also analyzed (Table II): 11
genes were involved in the Shh signaling pathway, 37 genes in the
Wnt signaling pathway and 9 genes were identified in the Notch
signaling pathway. The identified pathway-specific genes in the
corresponding pathway maps derived from the KEGG database are
presented in Fig. 2. Since Notch
signaling i) promotes HF differentiation into sebaceous gland and
interfollicular epidermal lineages, ii) is known to act as an
epidermal tumor suppressor, and iii) genes in this pathway
exhibited the most extreme changes in expression/inhibition by
microarray, the present study subsequently focused on the Notch
signaling pathway.
 | Figure 2.Notch gene signaling pathway
interactions. The Notch signaling pathway network was significantly
differentially activated in hair follicle root sheaths compared
with basal cell carcinomas. Genes and gene sets identified as
significantly differentially expressed by microarray are presented
with a dark background. JAG, jagged; LFNG, LFNG O-fucosylpeptide
3-beta-N-acetylglucosaminyltransferase; TACE, tumor necrosis
factor-ACa disintegrin and metalloproteinase metalloprotease
converting enzyme; DVL2, dishevelled2; NUMB, NUMB endocytic adaptor
protein; PSEN, presenilin; NCSTN, nicastrin; APH,
acylaminoacyl-peptide hydrolase; MAPK, mitogen-activated protein
kinase; NCID, Notch intracellular cytoplasmic domain; MAML,
mastermind-like protein; HAT, histone acetyltransferase; SKIP,
Ski-interacting protein; RBP-J, Recombining binding protein
suppressor of Hairless; SMRT, Silencing Mediator for Retinoic acid
and Thyroid hormone receptor; CtBP, C-terminal binding protein;
CIR, CBF1 interacting corepressor; HDAC, histone deacetylase; HES,
hairy and enhancer of split. |
Validation of the expression of
selected genes
Having completed the microarray analysis of BCCs and
HFs, 22 genes with known functional significance associated with
Notch signaling were selected for evaluation by RT-qPCR (Table VI). Differential Shh pathway gene
expression (GLI1, GLI2) was also reconfirmed to validate the study.
Although the magnitude of change in expression defined by qPCR was
different from that observed by microarray, the trends, whether for
increased or decreased gene expression, were generally consistent
with microarray data (Table
VI).
| Table VI.Selected gene validation results by
RT-qPCR with corresponding microarray results for comparison. |
Table VI.
Selected gene validation results by
RT-qPCR with corresponding microarray results for comparison.
|
| Hair follicle vs.
skin | Basal cell
carcinomas vs. skin |
|---|
|
|
|
|
|---|
|
| Microarray | RT-qPCR | Microarray | RT-qPCR |
|---|
|
|
|
|
|
|
|---|
| Gene name | Fold change | q-value | Fold change | P-value | Fold change | q-value | Fold change | P-value |
|---|
| NOTCH1 | 4.07350142 | 8.64548474 | 89.7796173 | 3.0878E-08 | 2.25963492 | 55.1681869 | 3.2667374 | 0.01731453 |
| NOTCH2 | 0.49022594 | 0.39254973 | 94.051046 | 2.4841E-06 | 0.46324991 | 2.15276566 | 0.87297527 | 0.84563107 |
| NOTCH4 | 2.69005573 | 0.24322855 | 19.2601231 | 0.00128485 | 1.71844966 | 55.1681869 | 2.67459359 | 0.14313619 |
| DTX1 | 1.17722862 | 48.8237978 | 16.3788042 | 0.03308844 | 2.4295169 | 55.1681869 | 0.28089744 | 0.22707567 |
| DTX2 | 0.99256711 | 40.6530129 | 18.9813992 | 0.00157923 | 0.47607531 | 4.07129257 | 0.43629239 | 0.08540183 |
| LNX1 | – | – | 198.293295 | 3.6156E-08 | 1.72295346 | 55.1681869 | 2.072439 | 0.28247621 |
| DVL2 | 13.8816522 | 3.95106797 | 16.104213 | 0.00293444 | 1.55096741 | 55.1681869 | 2.94822536 | 0.03581873 |
| NUMB | 3.28845002 | 0.48722077 | 182.325561 | 4.9233E-06 | 1.30366339 | 55.1681869 | 1.33412783 | 0.63444821 |
| JAG1 | 0.34149885 | 0.18592759 | 365.28094 | 2.3222E-08 | 1.63466178 | 55.1681869 | 1.83632659 | 0.35967923 |
| JAG2 | 1.5839265 | 41.2725397 | 179.447584 | 8.3358E-05 | 1.33391274 | 55.1681869 | 0.31170539 | 0.23588105 |
| LFNG | 2.07190237 | 6.92879545 | 1889.72022 | 4.5482E-05 | 2.33909215 | 55.1681869 | 1.52408184 | 0.61264104 |
| KRT17 | 3.021 | 0.00846 | 27272.867 | 2.2916E-09 | 7.21676553 | 55.1681869 | 51.4001016 | 0.00100685 |
| HES1 | – | – | 1067.11032 | 1.053E-15 | 0.76047244 | 67.4104045 | 2.91116399 | 0.0400455 |
| HES7 | 1.19000588 | 48.8237978 | 3262.24091 | 1.5035E-08 | 4.16958086 | 29.7263863 | 0.29241452 | 0.13032618 |
| HR | 2.16394516 | 2.23319493 | 226.55094 | 1.0638E-09 | 1.09510072 | 58.338051 | 1.19521471 | 0.76942586 |
| RBPSUHL | 3.11300222 | 41.2725397 | 255.196596 | 7.7485E-10 | 1.22074356 | 55.1681869 | 0.16526889 | 0.06136225 |
| DAAM1 | 0.20611879 | 0.21537795 | 574.06641 | 1.5066E-07 | 0.54865054 | 18.0863137 | 1.63754261 | 0.55059198 |
| MAPK8 | 1.5501382 | 42.0929177 | 199.824645 | 1.1302E-06 | 0.85527761 | 67.7038487 | 0.96727335 | 0.97161104 |
| GLI1 | – | – | 52.4313289 | 0.00072822 | – | – | 1.87408166 | 0.51779197 |
| GLI2 | 2.52604018 | 22.3203103 | 319.860846 | 8.9511E-07 | 2.00283366 | 55.1681869 | 12.2544249 | 0.00422916 |
| RAC1 | 0.26859543 | 1.21189849 | 535.384925 | 2.0661E-11 | 0.65505096 | 61.6040693 | 1.31400567 | 0.66627414 |
| ROCK2 | 0.18494564 | 2.62913482 | 575.373988 | 8.4351E-07 | 0.82910219 | 67.7038487 | 1.38128144 | 0.6297566 |
NOTCH1, JAG2, DVL2 and HES7 protein expression in
the pathology specimens from BCC patients, scalp/terminal HF
biopsies or non-scalp skin (non-follicular epithelium) from normal
patients was defined using immunohistochemical analysis. All of the
primary antibodies exhibited greater intensity of labeling in
terminal HFs compared with nodular BCCs and non-scalp skin when
tissues were processed in parallel (Fig. 3). A weak expression of NOTCH1 was
observed in non-follicular epithelium (Fig. 3A). By contrast, there was a strong
NOTCH1 presence in the outer root sheath (ORS) layer of HFs
(Fig. 3B). NOTCH1 showed a more
limited expression in the tumor mass compared with the peritumoral
stroma in BCCs (Fig. 3C and D).
JAG2 had a limited distribution in the inter-follicular epidermis
(Fig. 3E), but exhibited a strong
expression in HFs, including the ORS and inner root sheath (IRS;
Fig. 3F). JAG2 was expressed more
weakly in the BCC mass than in the peritumoral stroma (Fig. 3G and H). Compared with the
inter-follicular epidermis (Fig.
3I), DVL2 was strongly expressed in the ORS of HFs (Fig. 3J). BCC tumor cells demonstrated a
strong immunoreactivity to DVL2 (Fig.
3K and L). The basal layer of epidermis (Fig. 3M) and the ORS of HFs (Fig. 3N) were strongly positive for HES7.
The peritumoral stroma of BCCs also exhibited a stronger expression
of HES7 than the BCC mass (Fig. 3O and
P). A stronger expression of NOTCH1, JAG2, DVL2 and HES7 was
observed in the surface layer of the tumor structure (Fig. 3C, G, K and O) than in the internal
tumor mass (Fig. 3D, H, L, P). The
immunohistochemistry results were consistent with the microarray
and qPCR findings.
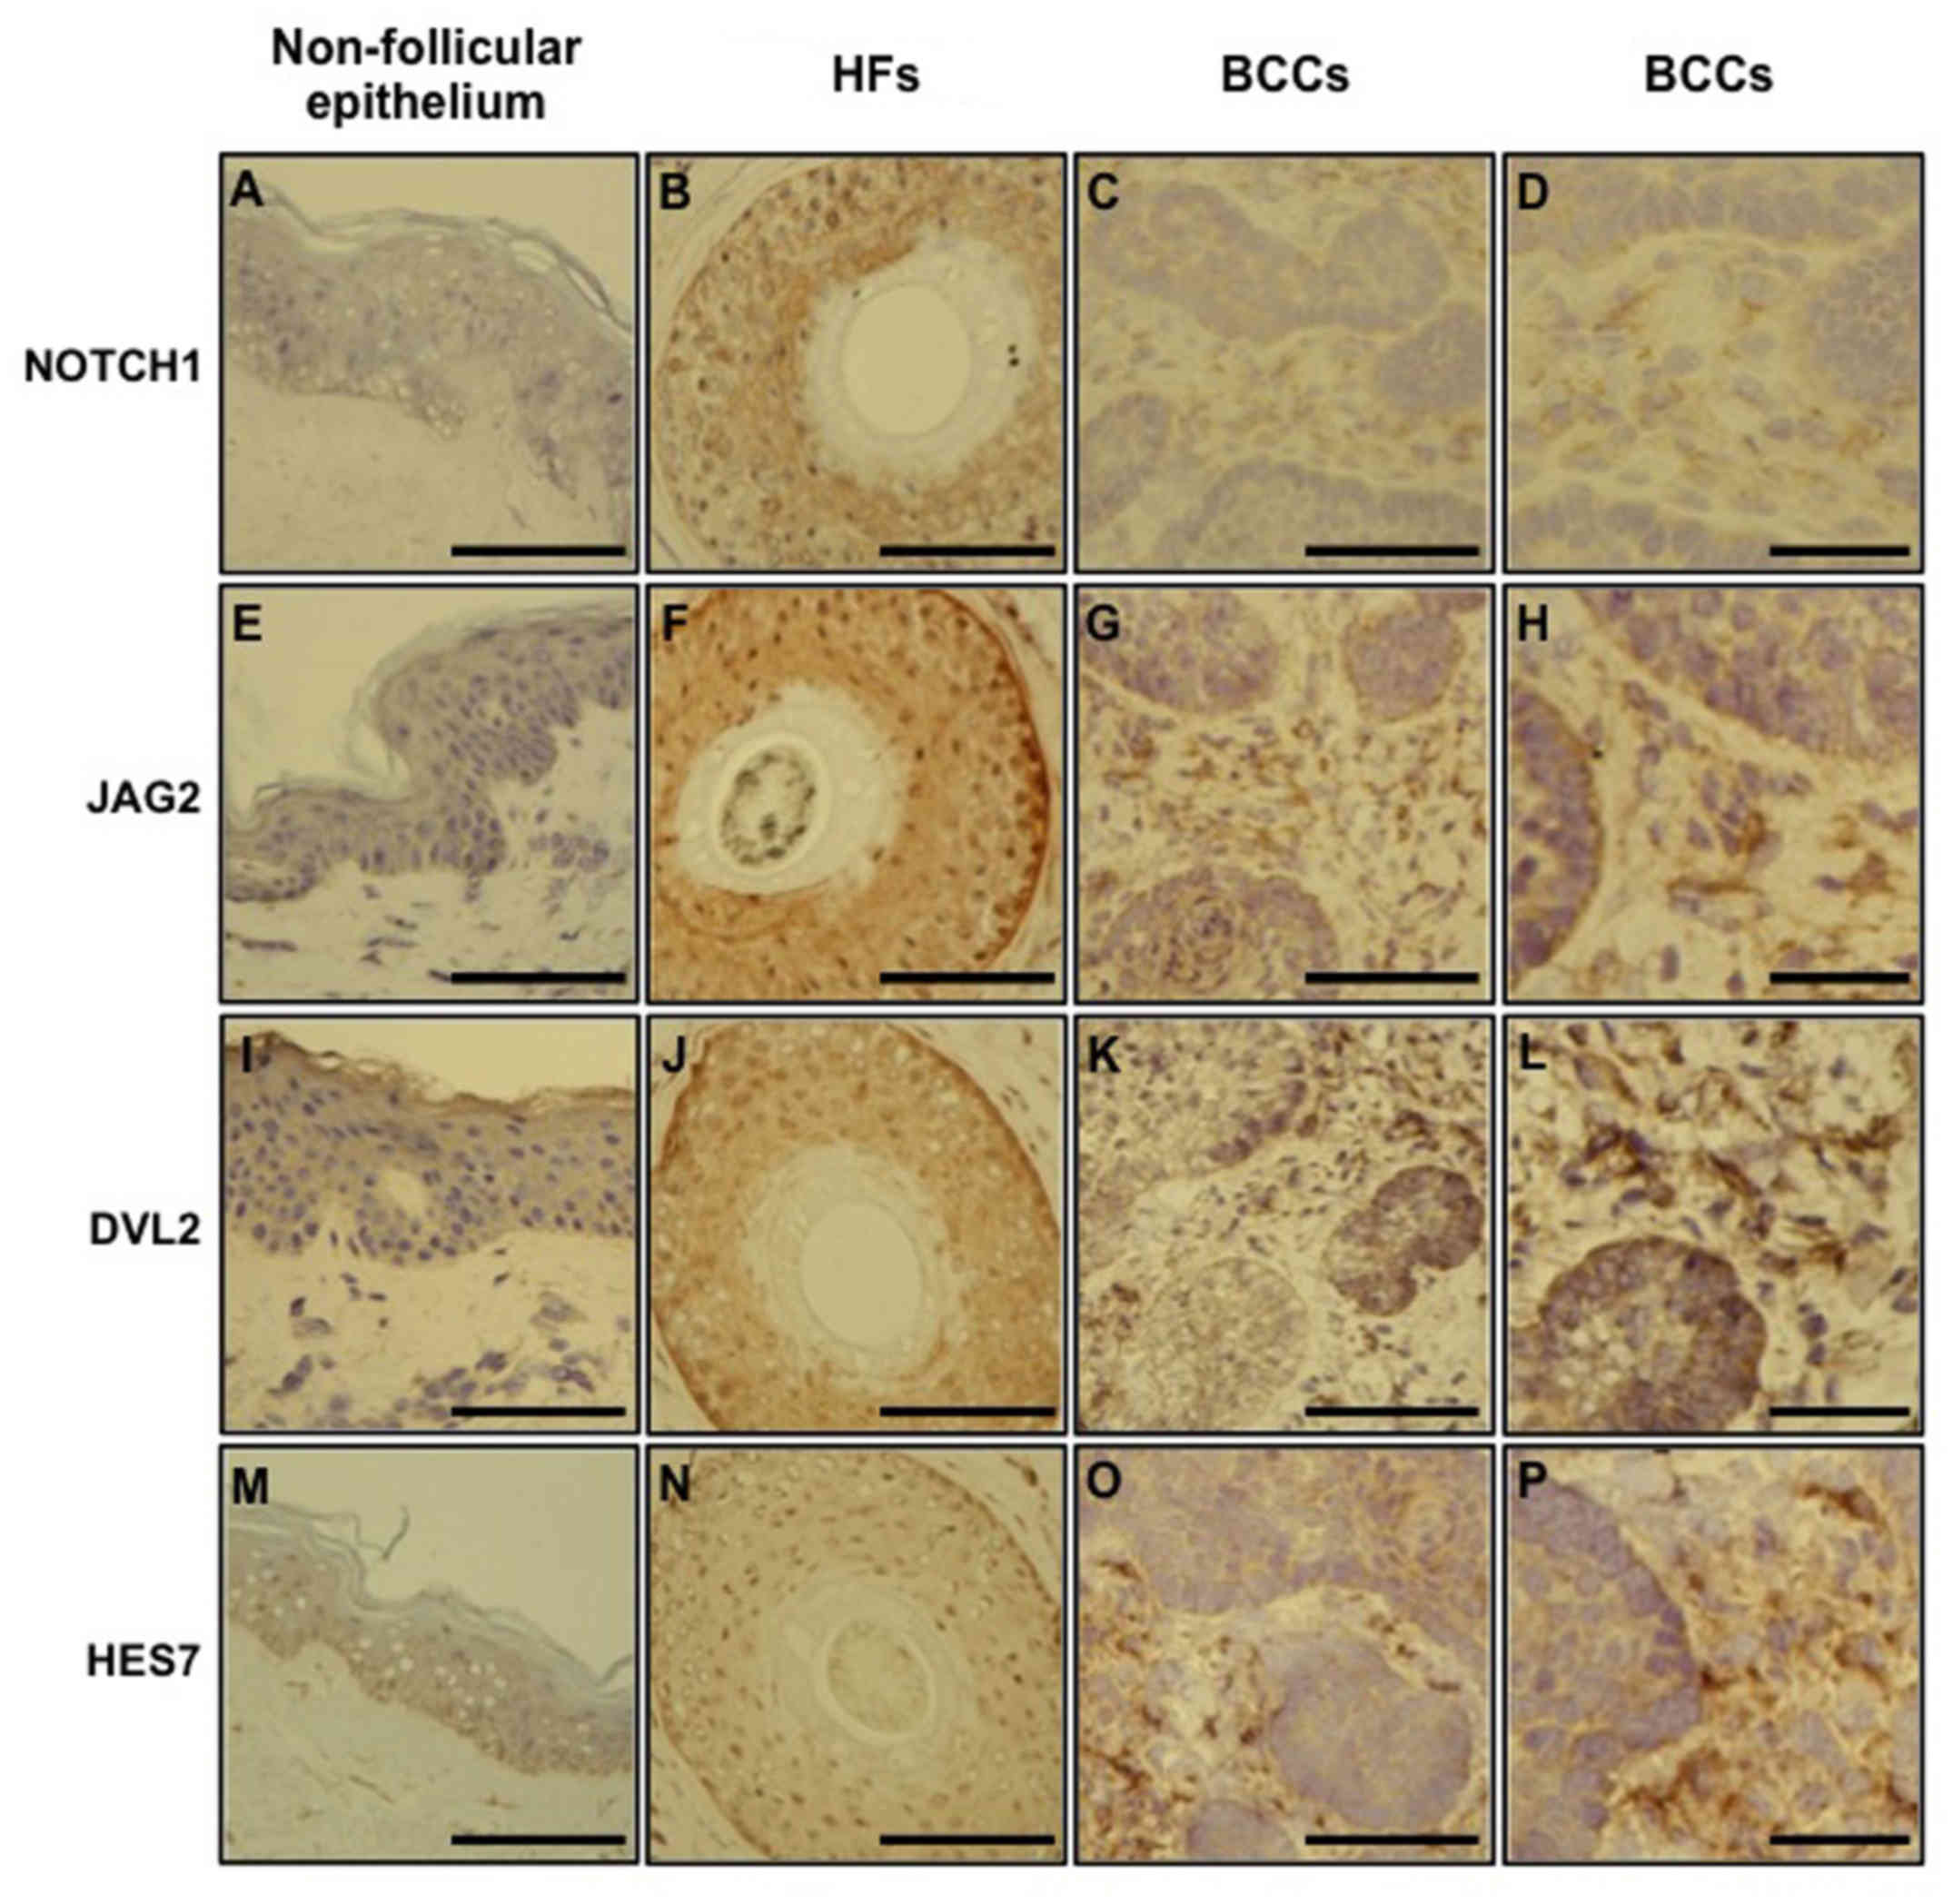 | Figure 3.NOTCH1, JAG2, DVL2 and HES7
expression in the normal non-follicular epithelium, hair follicle
root sheaths and basal cell carcinomas. Immunohistology was
conducted to define the expression of NOTCH1, JAG2, DVL2 and HES7
in pathology specimens of normal non-scalp skin, normal
scalp/terminal HF biopsies, and BCCs. All of the primary antibodies
exhibited a greater intensity of labeling in terminal HFs compared
with nodular BCCs and non-scalp skin when tissues were processed in
parallel. Scale bar, 100 µm (except D, H, L and P, where the scale
bar is 40 µm). JAG2, Jagged2; DVL2, Dishevelled2; HES7, hairy and
enhancer of split 7; HF, hair follicle; BCCs, basal cell
carcinomas. |
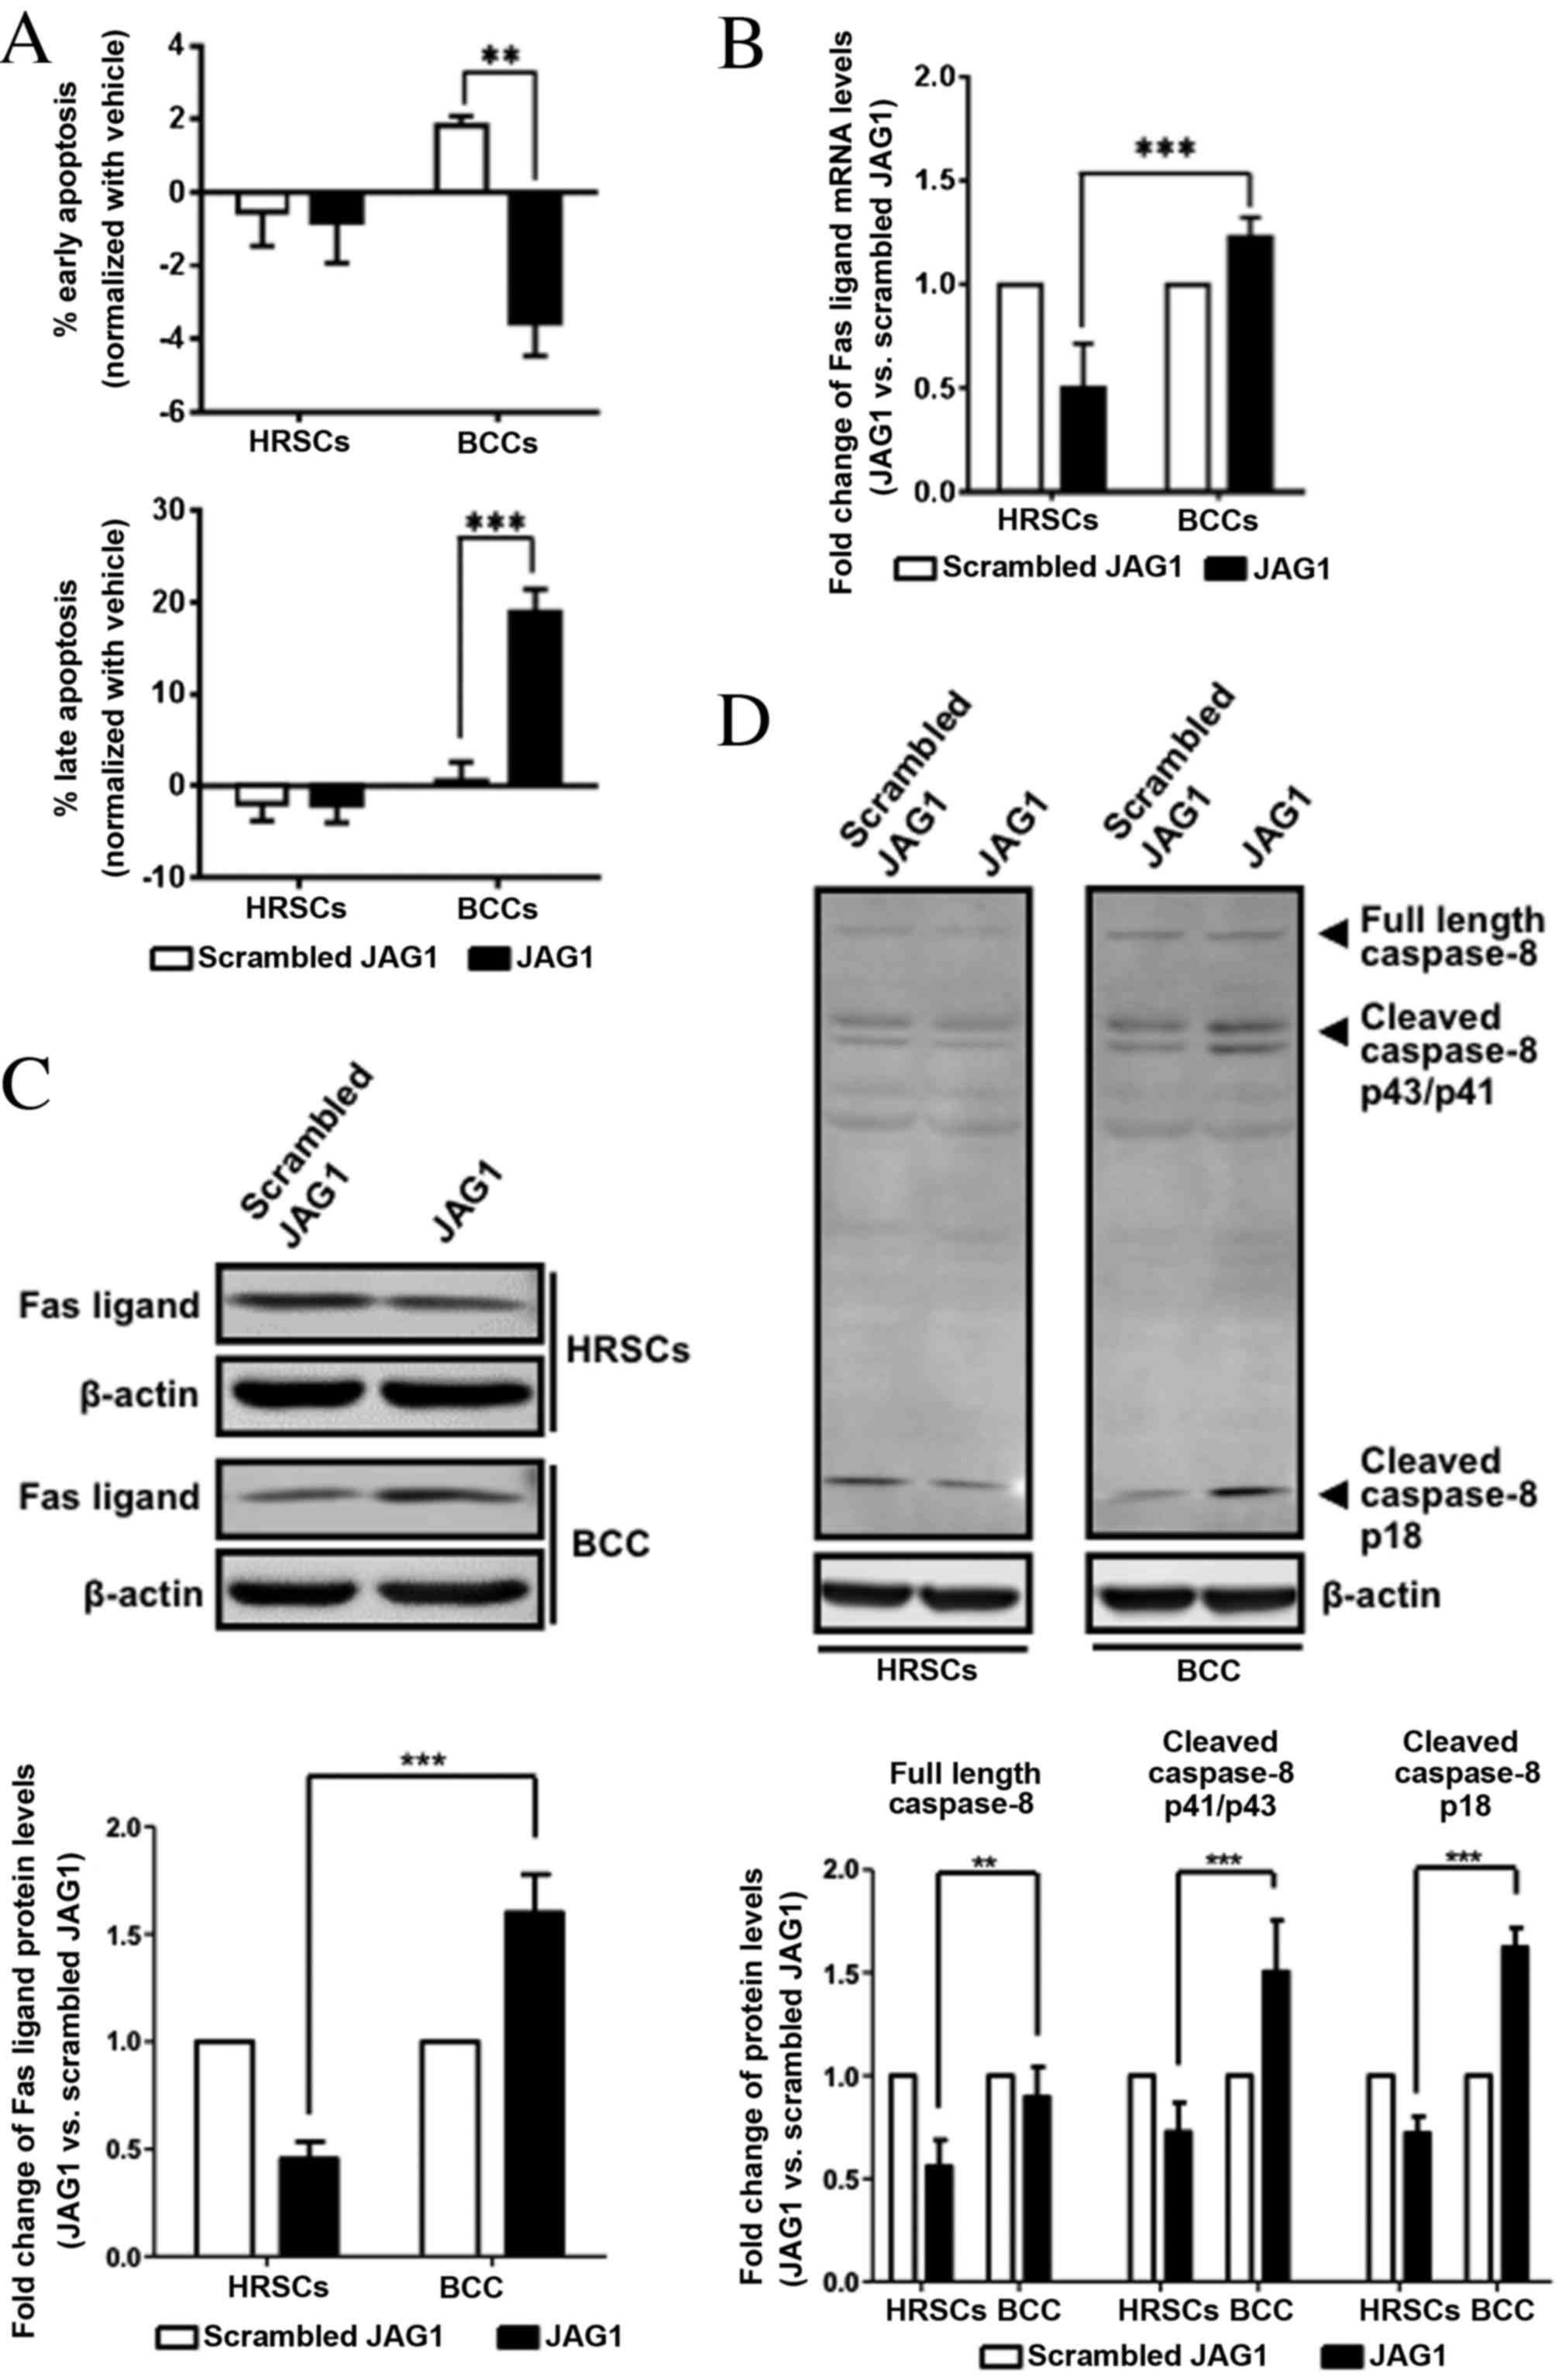
JAG1 treatment induced apoptosis of
BCC cells via Fas ligand
Since JAG1 can activate NOTCH1 (28), BCC cell apoptosis was examined in
cells induced with recombinant JAG1. A significantly higher
percentage of late apoptotic cells was found in JAG1-treated BCC
cell cultures compared with cells treated with scrambled JAG1 (0.5
vs. 18.95% Annexin V+PI+ cells, P=0.0004; Fig. 4A bottom channel). By contrast, JAG1
treatment did not induce late apoptosis in HRSCs (P>0.05;
Fig. 4A bottom channel). To
identify the specific pathway involved in JAG1-induced apoptosis, a
human apoptosis PCR array was performed on treated cells, which
revealed that Fas ligand mRNA expression was significantly
increased in JAG1-treated BCCs, while the level of Fas mRNA did not
change (data not shown).
qPCR specific for the Fas ligand gene was used to
further confirm PCR array data (Fig.
4B). Fas ligand mRNA expression was downregulated in HRSCs
following JAG1 treatment compared with the cells treated with
scrambled JAG1, and was upregulated in BCCs following JAG1
treatment compared with the cells treated with scrambled JAG1
(Fig. 4B). A statistically
significant difference in expression following JAG1 treatment was
observed between the two cell types (0.50-fold in HRSCs vs.
1.23-fold in BCCs, P=0.0003; Fig.
4B). Differences in Fas ligand protein expression levels
(Fig. 4C) followed the same
pattern as the corresponding mRNA expression levels (Fig. 4B).
Caspase-8, is a downstream target of Fas ligand
signaling and an initiator for the extrinsic apoptotic pathway
(29). JAG1 treatment slightly
decreased the protein expression levels of cleaved caspase-8 in
HRSCs, but induced a significant increase in cleaved caspase-8 in
BCCs (Fig. 4D), suggesting the
caspase-dependent pathway was involved in BCC cell apoptosis
induced by JAG1.
Discussion
The present study considered the potential
relationships between HFs and BCCs, with reference to the
similarities/differences in signaling pathway activation. Gene
functions and the specific involvement of the Notch and Shh
signaling pathways were surveyed to define how these regulatory
pathways may control HF and BCC growth (30). Defining gene expression patterns
and pathways in BCCs that are distinct from HF growth and cycling
may lead to a better understanding of the abnormal proliferation
that these cells undergo in the development of skin cancer.
Genes similarly expressed in HFs and BCCs were found
under the same functional GO categories, including ‘positive
regulation of cellular process’ and ‘regulation of multicellular
organismal process’. This suggested that common regulatory genes
may be important for the morphogenesis of both skin appendages. By
contrast, a number of genes were uniquely expressed in HFs or BCCs
only. These genes may serve as stage-specific signatures of
appendage formation, either for maintaining and regenerating normal
HFs, or for the formation of tumor masses. Commonly and
differentially expressed genes related to morphogenesis are
consistent with our hypothesis that BCC tumors may follow an
abnormal appendage development process that exhibits elements of
consistent order, morphogenesis and patterning as observed in
HFs.
Shh signaling is required for the proliferation and
normal cycling of HF epithelium. Modifications of Shh signaling can
lead to tumor development in tissues of different origins (13). Hyperactivation of the Shh signaling
pathway is found in several HF derived tumors and in BCCs (31,32).
Overexpression of GLI1 and GLI2 products are also
common features of BCCs, and suggests increased Shh signaling
(31,33). Consistent with previous findings
(31,33), the expression of GLI1 and
GLI2 was enhanced in BCCs and HF root sheaths, compared with
normal skin. However, the HF root sheaths exhibited significantly
higher expression levels of GLI1 and GLI2 compared
with BCCs. Shh signaling pathway genes may influence the same
progenitor cells in BCCs and HFs, but the different gene activation
levels in the two tissue types may contribute to the divergent
patterns of growth.
Differential expression of the Notch signaling
pathway was also revealed in BCCs and HFs compared with each other
and with normal skin. The Notch pathway, with its family of four
mammalian Notch receptors and their numerous ligands of the Delta,
Jagged, and Serrate groups, is important for cell fate
determination and organogenesis during embryonic development
(34,35). Studies on embryonic mice and rats
have demonstrated that the Notch/recombining binding protein
suppressor of hairless (RBP-J) signaling pathway promotes epidermal
differentiation (12) and
cutaneous appendage patterning (36). Aberrant Notch signaling has been
linked to a wide variety of tumors, but Notch can either suppress
or promote tumors depending on the cell type and context (37,38).
Jayaraman et al (14)
demonstrated that NOTCH1 and NOTCH2 were
significantly mutated in BCCs. The present study indicated that
selected Notch pathway genes were differentially activated and
inhibited in BCCs, which may be due to positive feedback, and
reciprocal negative feedback, from differences in Delta and Notch
cell surface expression, or the irregular activation of downstream
Notch signaling pathway genes.
Examination of downstream components of the Notch
pathway revealed more interesting results: The transcription factor
RBP-J and downstream target genes of the Hes and Deltex families,
exhibited a high expression in hair shafts compared with BCCs and
normal skin. By contrast, two genes that affect the co-repression
of RBP-J, CTBP1 and CREBBP, were observed to have a
significantly lower expression in HFs compared with BCCs (data not
shown). Deletion of RBP-J from follicular stem cells results in an
aberrant cell fate switch that leads to the establishment of
epidermal progenitors and basal cells (39). This result, therefore, demonstrated
that the Notch/RBP-J signaling pathway is strongly activated in
HFs. Since the Notch signaling pathway promotes a stem cell
phenotype in skin (36), the
degree of Notch signaling pathway activation may be important for
HF stem cell proliferation and differentiation. The high level of
Notch/RBP-J signaling pathway activation may be required for the
formation and maintenance of follicles.
The present study suggests a lack of downstream gene
expression in the Notch/RBP-J signaling pathway in BCCs. This may
allow basal cells to escape from the normal regulation of
proliferation that is normally found in the absence of Notch
signaling, as observed in mammary epithelium cell lineages
(40). Loss of RBP-J action in
BCCs may promote cells towards a more stem, or progenitor,
cell-like status, enabling basal cell tumor growth. Notch signaling
via Notch receptor intracellular domain translocation into the
nucleus, and subsequent binding to the transcription factor RBP-J,
may be an important stage in the regulation of BCC development. As
such, RBP-J signaling may be a focus for the development of new BCC
therapies, as has been suggested for other types of cancer
(41–44).
Fas ligand is a type II transmembrane protein that
can induce apoptosis upon binding to Fas. Compared with normal
skin, Fas ligand mRNA expression levels have previously been
demonstrated to be lower in BCC specimens and immunostainings were
weak or undetected (45). The
present findings have shown that activation of the Notch signaling
pathway by adding exogenous JAG1 into BCC cell culture resulted in
increased Fas ligand mRNA and protein expression. This further
activated downstream caspase-8 to initiate BCC cell apoptosis.
However, some tumors can decrease Fas expression to resist Fas
ligand-mediated T-cell cytotoxicity, and simultaneously upregulate
the expression of Fas ligand to induce apoptosis in Fas-expressing
T cells (46). BCCs strongly
express Fas ligand, which may help prevent attack from surrounding
immune effector cells, while also lacking Fas, potentially to make
the tumor cells resistant to apoptosis (47). Further investigation is required to
characterize the exact role of elevated Fas ligand expression
induced by Notch signaling activation by in vivo
experiments.
Notch signaling pathway genes are important in HF
formation and BCC neoplasia. Hair follicles can develop from skin
stem cells or their progeny, in a patterning program that is
controlled by multiple signaling pathways, function processes and
other components. Skin stem cells that are regulated by multiple
signaling pathways, normal function processes and normal
components, may allow BCCs to develop through abnormal activation
order, irregular cell cycle timing and aberrant activation of
multiple signaling pathways.
In summary, the present study suggests that
controlling the Notch/RBP-J signaling pathway may stop the
dysregulation of cell proliferation and differentiation to BCC skin
cancer. The degree of Notch signaling pathway activation may also
be important in HF formation. Elements of the Notch pathway are
potentially worthwhile targets for future treatment of BCCs and, as
a corollary, in HF engineering.
Acknowledgements
The present study was financially supported by the
Canadian Dermatology Foundation and the Canadian Institutes of
Health Research (CIHR; grant nos. MUS-94025 and MSH-95328). We
would like to thank the staff of the Microarray Facility of The
Prostate Centre at Vancouver General Hospital for their technical
assistance and advice. We would also like to extend thanks to Drs.
H. Lui and S. Le Bihan for their assistance and advice.
Glossary
Abbreviations
Abbreviations:
|
BCCs
|
basal cell carcinomas
|
|
HFs
|
hair follicles
|
|
JAG1
|
Jagged1
|
|
GEO
|
Gene Expression Omnibus
|
|
GO
|
Gene Ontology
|
|
GAPDH
|
glyceraldehyde-3-phosphate
dehydrogenase
|
|
NOTCH
|
Notch homolog 1
|
|
JAG2
|
Jagged 2
|
|
DVL2
|
Disheveled 2
|
|
HES7
|
Hairy and Enhancer of Split 7
|
|
HRSC
|
human root sheath cell
|
|
HKGS
|
Human Keratinocyte Growth
Supplement
|
|
ORS
|
outer root sheath
|
|
IRS
|
inner root sheath
|
References
|
1
|
Tiede S and Paus R: Lhx2-decisive role in
epithelial stem cell maintenance, or just the ‘tip of the iceberg’?
Bioessays. 28:1157–1160. 2006. View Article : Google Scholar : PubMed/NCBI
|
|
2
|
Alonso L and Fuchs E: Stem cells of the
skin epithelium. Proc Natl Acad Sci USA. 100:(Suppl 1) 11830–11835.
2003. View Article : Google Scholar
|
|
3
|
Honeycutt KA, Koster MI and Roop DR: Genes
involved in stem cell fate decisions and commitment to
differentiation play a role in skin disease. J Investig Dermatol
Symp Proc. 9:261–268. 2004. View Article : Google Scholar : PubMed/NCBI
|
|
4
|
Najafzadeh N, Esmaeilzade B and Dastan
Imcheh M: Hair follicle stem cells: In vitro and in vivo neural
differentiation. World J Stem Cells. 7:866–872. 2015. View Article : Google Scholar : PubMed/NCBI
|
|
5
|
Burkert J, Wright NA and Alison MR: Stem
cells and cancer: An intimate relationship. J Pathol. 209:287–297.
2006. View Article : Google Scholar : PubMed/NCBI
|
|
6
|
Jahoda C and Reynolds A: Skin stem cells-a
hairy issue. Nat Med. 6:1095–1097. 2000. View Article : Google Scholar : PubMed/NCBI
|
|
7
|
Crowson AN: Basal cell carcinoma: Biology,
morphology and clinical implications. Mod Pathol. 19:(Suppl 2)
S127–S147. 2006. View Article : Google Scholar
|
|
8
|
Grachtchouk M, Pero J, Yang SH, Ermilov
AN, Michael LE, Wang A, Wilbert D, Patel RM, Ferris J, Diener J, et
al: Basal cell carcinomas in mice arise from hair follicle stem
cells and multiple epithelial progenitor populations. J Clin
Invest. 121:1768–1781. 2011. View
Article : Google Scholar : PubMed/NCBI
|
|
9
|
Lopez-Takegami JC, Wolter M, Löser C,
Maiweg C, Jones M, Metze D and Böer-Auer A: Classification of cysts
with follicular germinative differentiation. J Cutan Pathol.
43:191–199. 2016. View Article : Google Scholar : PubMed/NCBI
|
|
10
|
Peterson SC, Eberl M, Vagnozzi AN, Belkadi
A, Veniaminova NA, Verhaegen ME, Bichakjian CK, Ward NL, Dlugosz AA
and Wong SY: Basal cell carcinoma preferentially arises from stem
cells within hair follicle and mechanosensory niches. Cell Stem
Cell. 16:400–412. 2015. View Article : Google Scholar : PubMed/NCBI
|
|
11
|
Hutchin ME, Kariapper MS, Grachtchouk M,
Wang A, Wei L, Cummings D, Liu J, Michael LE, Glick A and Dlugosz
AA: Sustained Hedgehog signaling is required for basal cell
carcinoma proliferation and survival: Conditional skin
tumorigenesis recapitulates the hair growth cycle. Genes Dev.
19:214–223. 2005. View Article : Google Scholar : PubMed/NCBI
|
|
12
|
Thélu J, Viallet JP and Dhouailly D:
Differential expression pattern of the three Fringe genes is
associated with epidermal differentiation. J Invest Dermatol.
111:903–906. 1998. View Article : Google Scholar : PubMed/NCBI
|
|
13
|
McMahon AP, Ingham PW and Tabin CJ:
Developmental roles and clinical significance of hedgehog
signaling. Curr Top Dev Biol. 53:1–114. 2003. View Article : Google Scholar : PubMed/NCBI
|
|
14
|
Jayaraman SS, Rayhan DJ, Hazany S and
Kolodney MS: Mutational landscape of basal cell carcinomas by
whole-exome sequencing. J Invest Dermatol. 134:213–220. 2014.
View Article : Google Scholar : PubMed/NCBI
|
|
15
|
Wuest M, Dummer R and Urosevic M:
Induction of the members of Notch pathway in superficial basal cell
carcinomas treated with imiquimod. Arch Dermatol Res. 299:493–498.
2007. View Article : Google Scholar : PubMed/NCBI
|
|
16
|
Rishikaysh P, Dev K, Diaz D, Qureshi WM,
Filip S and Mokry J: Signaling involved in hair follicle
morphogenesis and development. Int J Mol Sci. 15:1647–1670. 2014.
View Article : Google Scholar : PubMed/NCBI
|
|
17
|
Lyons P: Advances in spotted microarray
resources for expression profiling. Brief Funct Genomic Proteomic.
2:21–30. 2003. View Article : Google Scholar : PubMed/NCBI
|
|
18
|
Nelson CC, Hoffart D, Gleave ME and Rennie
PS: Application of gene microarrays in the study of prostate
cancer. Methods Mol Med. 81:299–320. 2003.PubMed/NCBI
|
|
19
|
Mungamuri SK, Yang X, Thor AD and
Somasundaram K: Survival signaling by Notch1: Mammalian target of
rapamycin (mTOR)-dependent inhibition of p53. Cancer Res.
66:4715–4724. 2006. View Article : Google Scholar : PubMed/NCBI
|
|
20
|
Tusher VG, Tibshirani R and Chu G:
Significance analysis of microarrays applied to the ionizing
radiation response. Proc Natl Acad Sci USA. 98:5116–5121. 2001.
View Article : Google Scholar : PubMed/NCBI
|
|
21
|
Rizzo P, Miao H, D'Souza G, Osipo C, Song
LL, Yun J, Zhao H, Mascarenhas J, Wyatt D, Antico G, et al:
Cross-talk between notch and the estrogen receptor in breast cancer
suggests novel therapeutic approaches. Cancer Res. 68:5226–5235.
2008. View Article : Google Scholar : PubMed/NCBI
|
|
22
|
da W Huang, Sherman BT and Lempicki RA:
Bioinformatics enrichment tools: Paths toward the comprehensive
functional analysis of large gene lists. Nucleic Acids Res.
37:1–13. 2009. View Article : Google Scholar : PubMed/NCBI
|
|
23
|
Huang DW, Sherman BT and Lempicki RA:
Systematic and integrative analysis of large gene lists using DAVID
bioinformatics resources. Nat. Protocols. 4:44–57. 2009. View Article : Google Scholar : PubMed/NCBI
|
|
24
|
Harris MA, Clark J, Ireland A, Lomax J,
Ashburner M, Foulger R, Eilbeck K, Lewis S, Marshall B, Mungall C,
et al: The Gene Ontology (GO) database and informatics resource.
Nucleic Acids Res. 32:D258–D261. 2004. View Article : Google Scholar : PubMed/NCBI
|
|
25
|
da W Huang, Sherman BT, Tan Q, Collins JR,
Alvord WG, Roayaei J, Stephens R, Baseler MW, Lane HC and Lempicki
RA: The DAVID gene functional classification tool: A novel
biological module-centric algorithm to functionally analyze large
gene lists. Genome Biol. 8:R1832007. View Article : Google Scholar : PubMed/NCBI
|
|
26
|
Livak KJ and Schmittgen TD: Analysis of
relative gene expression data using real-time quantitative PCR and
the 2(−Delta Delta C (T)) Method. Methods. 25:402–408. 2001.
View Article : Google Scholar : PubMed/NCBI
|
|
27
|
Lo BK, Yu M, Zloty D, Cowan B, Shapiro J
and McElwee KJ: CXCR3/ligands are significantly involved in the
tumorigenesis of basal cell carcinomas. Am J Pathol. 176:2435–2446.
2010. View Article : Google Scholar : PubMed/NCBI
|
|
28
|
Rooman I, De Medts N, Baeyens L, Lardon J,
De Breuck S, Heimberg H and Bouwens L: Expression of the Notch
signaling pathway and effect on exocrine cell proliferation in
adult rat pancreas. Am J Pathol. 169:1206–1214. 2006. View Article : Google Scholar : PubMed/NCBI
|
|
29
|
Holtzman MJ, Green JM, Jayaraman S and
Arch RH: Regulation of T cell apoptosis. Apoptosis. 5:459–471.
2000. View Article : Google Scholar : PubMed/NCBI
|
|
30
|
Katoh M and Katoh M: Notch ligand, JAG1,
is evolutionarily conserved target of canonical WNT signaling
pathway in progenitor cells. Int J Mol Med. 17:681–685.
2006.PubMed/NCBI
|
|
31
|
Dahmane N, Lee J, Robins P, Heller P and i
Altaba A Ruiz: Activation of the transcription factor Gli1 and the
Sonic hedgehog signalling pathway in skin tumours. Nature.
389:876–881. 1997. View
Article : Google Scholar : PubMed/NCBI
|
|
32
|
Oro AE, Higgins KM, Hu Z, Bonifas JM,
Epstein EH Jr and Scott MP: Basal cell carcinomas in mice
overexpressing sonic hedgehog. Science. 276:817–821. 1997.
View Article : Google Scholar : PubMed/NCBI
|
|
33
|
Grachtchouk M, Mo R, Yu S, Zhang X, Sasaki
H, Hui CC and Dlugosz AA: Basal cell carcinomas in mice
overexpressing Gli2 in skin. Nat Genet. 24:216–217. 2000.
View Article : Google Scholar : PubMed/NCBI
|
|
34
|
Artavanis-Tsakonas S, Rand MD and Lake RJ:
Notch signaling: Cell fate control and signal integration in
development. Science. 284:770–776. 1999. View Article : Google Scholar : PubMed/NCBI
|
|
35
|
Ayaz F and Osborne BA: Non-canonical notch
signaling in cancer and immunity. Front Oncol. 4:3452014.
View Article : Google Scholar : PubMed/NCBI
|
|
36
|
Lowell S, Jones P, Le Roux I, Dunne J and
Watt FM: Stimulation of human epidermal differentiation by
delta-notch signalling at the boundaries of stem-cell clusters.
Curr Biol. 10:491–500. 2000. View Article : Google Scholar : PubMed/NCBI
|
|
37
|
Chappell WH, Green TD, Spengeman JD,
McCubrey JA, Akula SM and Bertrand FE: Increased protein expression
of the PTEN tumor suppressor in the presence of constitutively
active Notch-1. Cell Cycle. 4:1389–1395. 2005. View Article : Google Scholar : PubMed/NCBI
|
|
38
|
Nicolas M, Wolfer A, Raj K, Kummer JA,
Mill P, van Noort M, Hui CC, Clevers H, Dotto GP and Radtke F:
Notch1 functions as a tumor suppressor in mouse skin. Nat Genet.
33:416–421. 2003. View
Article : Google Scholar : PubMed/NCBI
|
|
39
|
Yamamoto N, Tanigaki K, Han H, Hiai H and
Honjo T: Notch/RBP-J signaling regulates epidermis/hair fate
determination of hair follicular stem cells. Curr Biol. 13:333–338.
2003. View Article : Google Scholar : PubMed/NCBI
|
|
40
|
Buono KD, Robinson GW, Martin C, Shi S,
Stanley P, Tanigaki K, Honjo T and Hennighausen L: The canonical
Notch/RBP-J signaling pathway controls the balance of cell lineages
in mammary epithelium during pregnancy. Dev Biol. 293:565–580.
2006. View Article : Google Scholar : PubMed/NCBI
|
|
41
|
Garber K: Notch emerges as new cancer drug
target. J Natl Cancer Inst. 99:1284–1285. 2007. View Article : Google Scholar : PubMed/NCBI
|
|
42
|
Purow B: Notch inhibition as a promising
new approach to cancer therapy. Adv Exp Med Biol. 727:305–319.
2012. View Article : Google Scholar : PubMed/NCBI
|
|
43
|
Yabuuchi S, Pai SG, Campbell NR, De Wilde
RF, De Oliveira E, Korangath P, Streppel MM, Rasheed ZA, Hidalgo M,
Maitra A and Rajeshkumar NV: Notch signaling pathway targeted
therapy suppresses tumor progression and metastatic spread in
pancreatic cancer. Cancer Lett. 335:41–51. 2013. View Article : Google Scholar : PubMed/NCBI
|
|
44
|
Yan B, Liu L, Zhao Y, Xiu LJ, Sun DZ, Liu
X, Lu Y, Shi J, Zhang YC, Li YJ, et al: Xiaotan Sanjie decoction
attenuates tumor angiogenesis by manipulating Notch-1-regulated
proliferation of gastric cancer stem-like cells. World J
Gastroenterol. 20:13105–13118. 2014. View Article : Google Scholar : PubMed/NCBI
|
|
45
|
Wang XY, Zhang R and Lian S: Aberrant
expression of Fas and FasL pro-apoptotic proteins in basal cell and
squamous cell carcinomas. Clin Exp Dermatol. 36:69–76. 2011.
View Article : Google Scholar : PubMed/NCBI
|
|
46
|
Satchell AC, Barnetson RS and Halliday GM:
Increased Fas ligand expression by T cells and tumour cells in the
progression of actinic keratosis to squamous cell carcinoma. Br J
Dermatol. 151:42–49. 2004. View Article : Google Scholar : PubMed/NCBI
|
|
47
|
Erb P, Ji J, Wernli M, Kump E, Glaser A
and Buchner SA: Role of apoptosis in basal cell and squamous cell
carcinoma formation. Immunol Lett. 100:68–72. 2005. View Article : Google Scholar : PubMed/NCBI
|