Introduction
Patients with traumatic spinal cord injuries (TSCI)
endure low health-associated quality of life and high healthcare
costs. They also have a higher mortality rate compared with the
general population. In 2012, the estimated incidence of acute
spinal cord injury in the United States was 54 cases per 1 million
(1). The biological processes of
TSCI involve a diverse group of cells and molecules from the
nervous, immune and vascular systems. For instance, connexin 43
functions as a mediator of central nervous system inflammation and
chronic pain following spinal cord injury (2), altered expression of E2F-associated
phosphoprotein regulates reactive astrogliosis and neuronal
apoptosis (3) and ginsenoside Rb1
upregulates the expression of Bcl-xL and vascular endothelial
growth factor at 7 days after spinal cord injury (4). Investigation of gene changes has
contributed to the understanding of the molecular mechanisms of
TSCI.
Gene expression profiling by microarray has been
used to uncover molecular variations in spinal cord repair and
degeneration (5–7). In 2014, using microarray analysis,
Shin et al (8) identified
that numerous inflammation-associated genes were upregulated in the
lumbar spinal cord at 1 and 3 weeks after traumatic injury, and
locomotor function was improved in part by treadmill locomotor
training (TMT). However, the molecular mechanisms of TSCI remain to
be elucidated and regulatory factors associated with TSCI,
including transcription factors (TFs), have not been investigated
to the best of the authors' knowledge.
The present study used the microarray data obtained
by Shin et al (8) and
screened differentially expressed genes (DEGs) common to the 1 and
3 week injury samples, and then analyzed the functions and
interactions of DEGs. Additionally, TFs in DEGs were identified to
reveal the regulatory associations of DEGs. These results may
provide novel information to aid the understanding of the molecular
mechanisms of TSCI.
Materials and methods
Affymetrix microarray data
The raw gene expression profile data GSE52763
(8) were obtained from the public
database Gene Expression Omnibus (GEO; http://www.ncbi.nlm.nih.gov/geo/), which is based on
the platform of GPL1355 (Rat230_2) Affymetrix Rat Genome 230 2.0
Array. The dataset contained eight rat lumbar spinal cord samples
obtained from rats 1 (n=4) and 3 (n=4) weeks following contusive
spinal cord injury at the T9 level (designated as 1 week injury and
3 weeks injury samples), three lumbar spinal cord samples obtained
from rats 1 week following sham laminectomy (designated as sham
samples), four lumbar spinal cord samples obtained at 3 weeks
following contusive spinal cord injury with treadmill training
(designated as 3 weeks injury + TMT samples), and three lumbar
spinal cord samples from rats which underwent a sham laminectomy
followed by 2 weeks of treadmill training (designated as sham + TMT
samples). All of the samples were taken from adult (8 weeks) female
Sprague-Dawley rats (250–300 g). Only 1 week injury, 3 weeks injury
and sham samples were used for analysis in the present study.
CEL files were downloaded and the gene expression
data of all samples were preprocessed through background
correction, quantile normalization and probe summarization using
the Robust Microarray Analysis algorithm of the affy package of
Bioconductor (http://www.bioconductor.org/packages/release/bioc/html/)
(9).
DEGs screening
The linear models for the microarray data package of
Bioconductor (10) was used to
identify DEGs between 1 week and 3 weeks injury samples and sham
samples. The P-value for each gene was calculated by t-test and
only the genes with P-value <0.05 and fold change ≥1.5 were
selected as DEGs. Subsequently, the DEGs common to the 1 and 3 week
injury samples were screened for subsequent analyses.
Enrichment analysis
Gene Ontology (GO) functional and Kyoto Encyclopedia
of Genes and Genomes (KEGG) pathway enrichment analyses for DEGs
were conducted using the Database for Annotation, Visualization and
Integrated Discovery (http://david.abcc.ncifcrf.gov) database, which
provides a set of functional annotation tools to aid investigators
in comprehending the biological importance underlying numerous
genes (11). P<0.05 and gene
count ≥2 were set as the cut-off criteria.
Co-expression analysis
The Pearson correlation coefficient was calculated
to analyze the co-expression associations between DEGs (11). The co-expression pairs with a
Pearson correlation coefficient >0.9 were screened out, and the
co-expression network was visualized using Cytoscape [http://cytoscape.org; (12)].
Subsequently, GO functional enrichment analysis in
biological process was performed using the plug-in Bingo (13) in Cytoscape. P<0.05 was set as
the cut-off criterion. Additionally, the Search Tool for the
Retrieval of Interacting Genes/Proteins (http://string-db.org) database was used to analyze the
protein-protein interactions (PPIs) of co-expressed genes, and the
PPI network was visualized by Cytoscape.
Identification of TFs from DEGs
TFs in the DEGs common to the 1 and 3 week injury
samples were identified using the Animal Transcription Factor
Database [AnimalTFDB; http://www.bioguo.org/AnimalTFDB/species_index.php;
(14)].
Results
Identification of DEGs
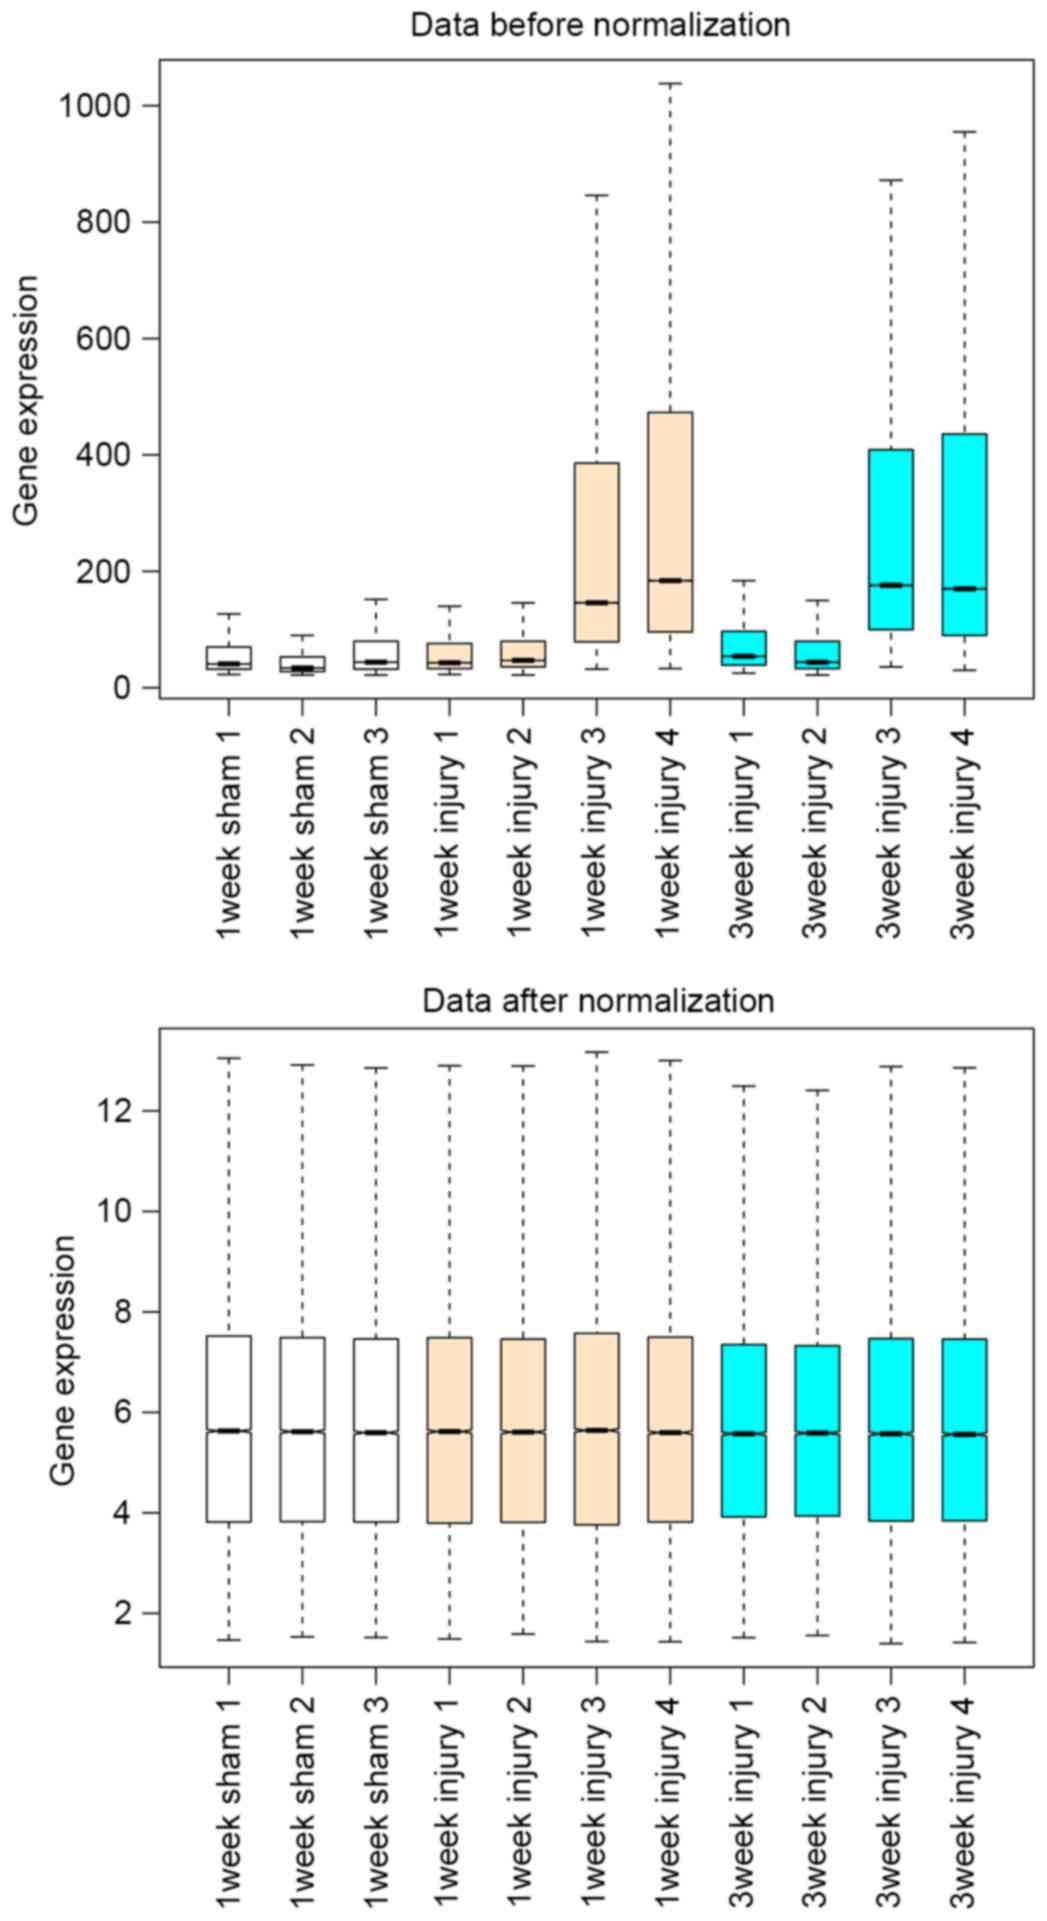
Based on the normalization of the microarray data,
the boxplot of preprocessed data displayed that medians of each
sample data were almost on a line, indicating that the data after
preprocessing met the standard for further analyses (Fig. 1).
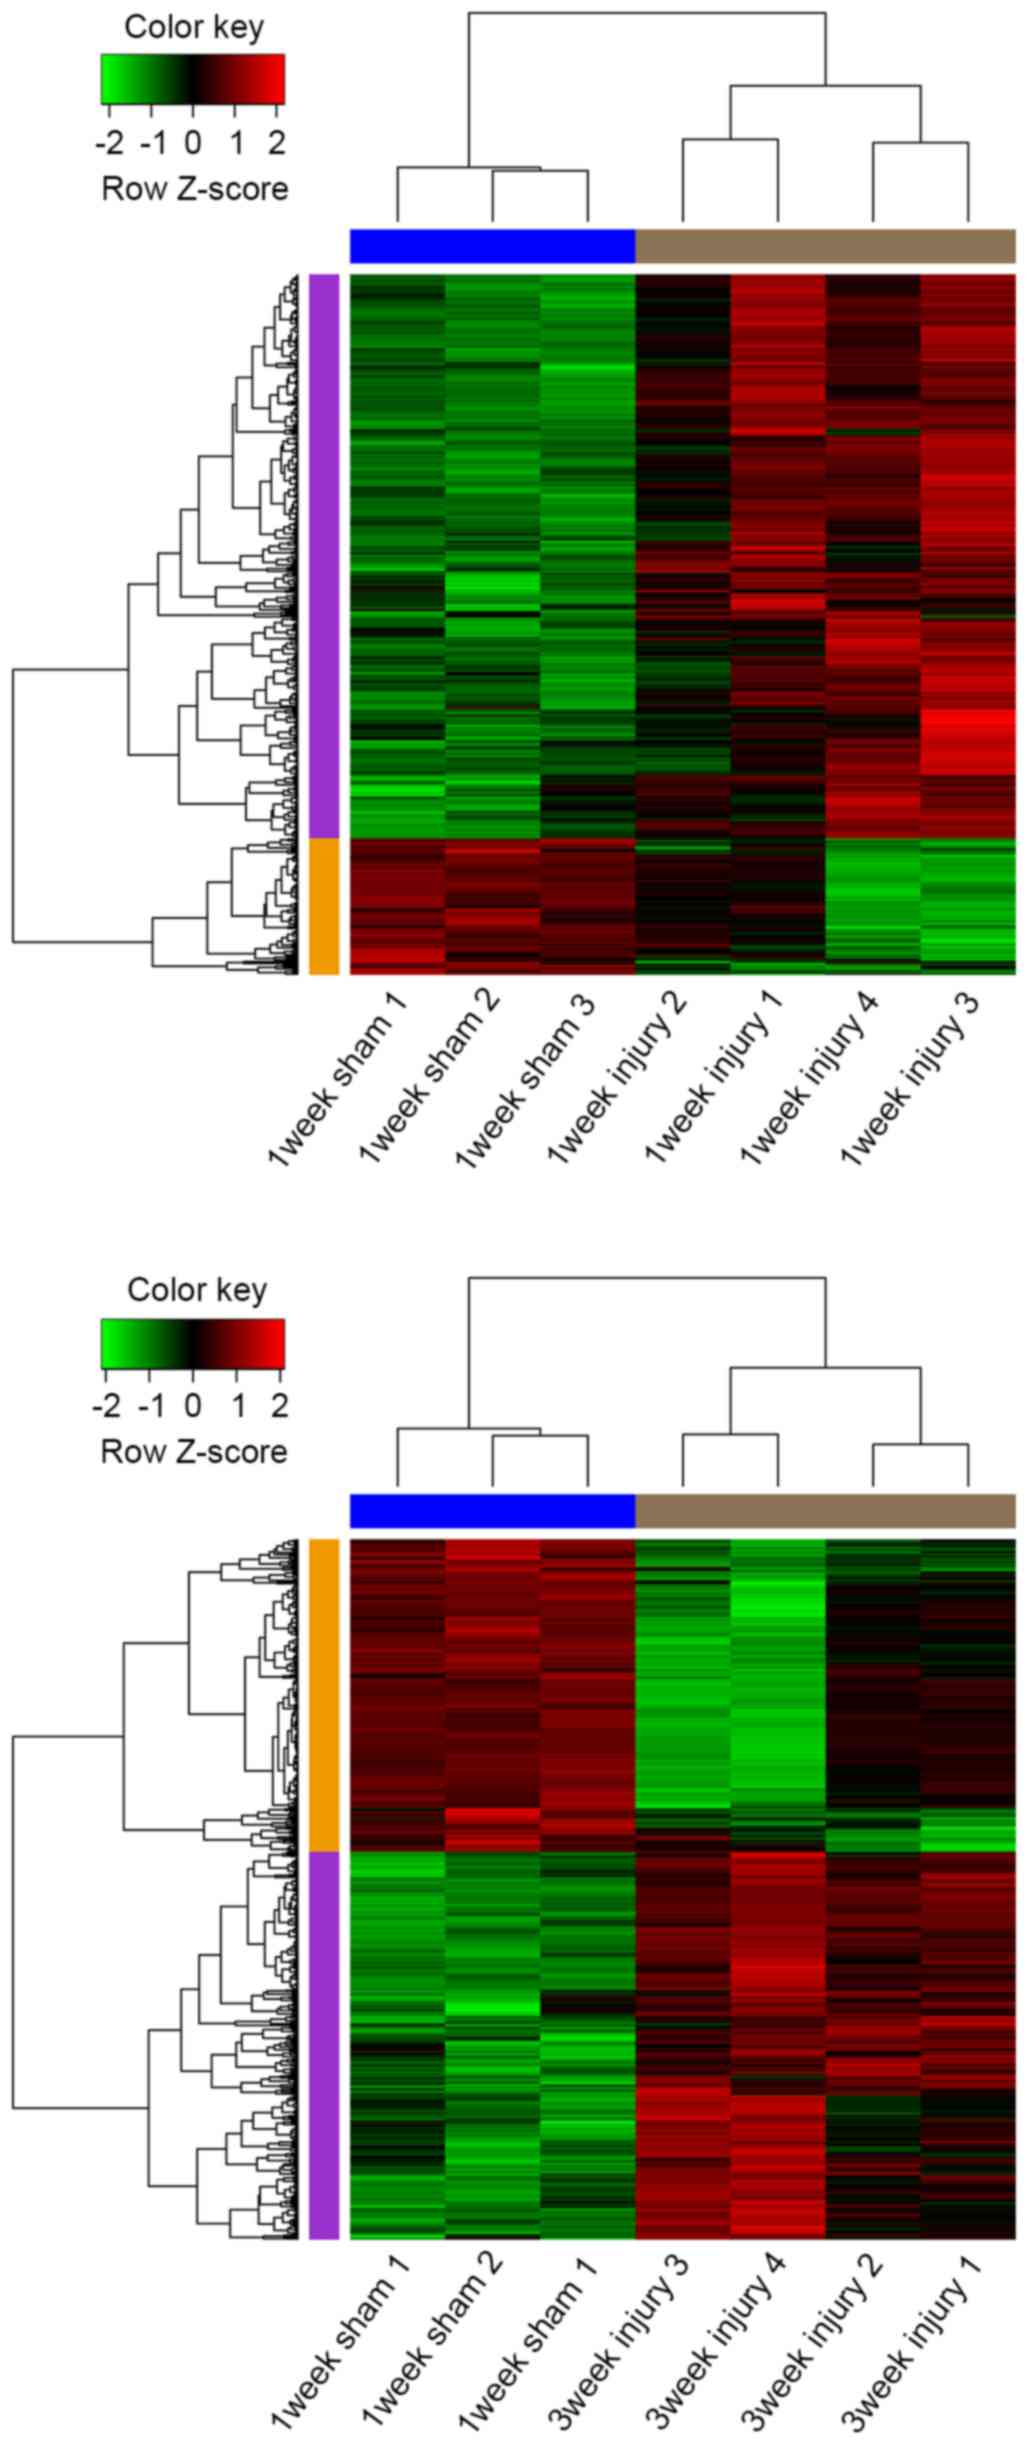
In total, 322 upregulated and 78 downregulated DEGs
were screened between 1 week injury and sham samples, in addition
to 354 upregulated and 285 downregulated ones between 3 week injury
and sham samples. Among them, 234 upregulated and 51 downregulated
DEGs were common to the 1 and 3 week injury samples. The
hierarchical cluster analysis of the data demonstrated that the
DEGs can be used to accurately distinguish 1 and 3 week injury
samples from sham samples (Fig.
2).
GO functional and KEGG pathway
enrichment analyses
To identify the functions of DEGs common to the 1
and 3 week injury samples, GO functional and KEGG pathway
enrichment analyses were performed. According to GO functional
enrichment analysis, the upregulated DEGs were significantly
enriched in several GO terms concerning immunity, including immune
response [e.g. integrin subunit α L (Itgal), similar to
guanylate binding protein family, member 6 and C-C motif chemokine
ligand 2 (Ccl2)], defence response (e.g. TNF α induced
protein 8 like 2, apolipoprotein B MRNA editing enzyme catalytic
subunit 1 and Ccl2) and cell activation (e.g. exonuclease 1,
Intercellular Adhesion Molecule 1 and pleckstrin; Table I). The downregulated DEGs were
highly enriched in female gonad development [e.g. Pgr,
vascular endothelial growth factor A (Vegfa) and BCL2 like
1], neuron projection [e.g. ATPase plasma membrane Ca2+
transporting 2, dynamin 3 (Dnm3) and glutamate metabotropic
receptor 7 (Grm7)] and gated channel activity [e.g.
γ-aminobutyric acid type A receptor α3 subunit (Gabra3),
Grm7 and calcium voltage-gated channel auxiliary subunit β4;
Table II].
 | Table I.Top five enriched GO terms with the
highest P-value in biological process, cellular component and
molecular function for the up-regulated differentially expressed
genes common to the 1 week and 3 weeks injury samples. |
Table I.
Top five enriched GO terms with the
highest P-value in biological process, cellular component and
molecular function for the up-regulated differentially expressed
genes common to the 1 week and 3 weeks injury samples.
| Category | Term | Count | P-value | Genes |
|---|
| BP | GO:0006955-immune
response | 37 | 3.71E-22 | Tnfaip8L2,
Itgal, Loc685067, Ccl2, Apobec1, C3, Endou, Tlr2, Rsad2, Tlr7,
C1Qc, Btk, Gch1, Klhl6, Fcgr1A, Cfh, Fcer1G, Inpp5D, Fcgr3A, Exo1,
Ptpn6, Icam1, Ptprc, Tnfsf4, Rt1-Ce12, Myo1F, Vav1, Psmb8, Psmb9,
C1Qa, C1Qb, Cd86, Cybb, Fcgr2B, Cd300A, Cxcl16, Gbp2 |
|
| GO:0006952-defense
response | 29 | 8.07E-15 | Tnfaip8L2,
Apobec1, Ccl2, C3, Tlr2, Rsad2, Itgb2, Tlr7, C1Qc, Btk, Gch1,
Casp4, Hmox1, Cybb, Fcgr1A, Cfh, Pycard, Fcer1G, Ptpn6, Ptprc,
Tnfsf4, Pdpn, Hck, Myo1F, C1Qa, C1Qb, Cd86, Fcgr2B, Cxcl16 |
|
| GO:0002252-immune
effector process | 18 | 3.17E-14 | Exo1, Ptprc,
Ptpn6, Icam1, Apobec1, C3, Myo1F, Rsad2, Tlr7, C1Qc, Btk, C1Qa,
C1Qb, Fcgr2B, Fcgr1A, Cfh, Fcer1G, Inpp5D |
|
| GO:0001775-cell
activation | 21 | 4.15E-12 | Exo1, Icam1,
Ptprc, Itgal, Tnfsf4, Plek, Aif1, Tlr2, Myo1F, Itgb2, Tlr7, Vav1,
Itgam, Timp1, Btk, Cd48, Cd86, Fcgr2B, Fcer1G, Fcgr3A,
Blnk |
|
|
GO:0045321-leukocyte activation | 19 | 3.69E-11 | Exo1, Icam1,
Ptprc, Itgal, Tnfsf4, Aif1, Tlr2, Myo1F, Itgb2, Tlr7, Vav1, Itgam,
Btk, Cd48, Cd86, Fcgr2B, Fcer1G, Fcgr3A, Blnk |
| CC | GO:0009897-external
side of plasma membrane | 13 | 5.95E-07 | Cd48, Icam1,
Itgal, Ptprc, Cd86, Emr1, Fcgr2B, Fcgr1A, Tlr2, Fcer1G, Cd22,
Clec7A, Itgam |
|
| GO:0009986-cell
surface | 16 | 1.03E-05 | Icam1, Ptprc,
Itgal, Tnfsf4, Tlr2, Itgb2, Cd53, Itgam, Cd48, Cd86, Fcgr2B, Emr1,
Fcgr1A, Cd22, Fcer1G, Clec7A |
|
| GO:0044459-plasma
membrane part | 33 | 7.58E-05 | Itgal, Gna15,
Aif1, Tlr2, Rsad2, Itgb2, Abca1, Itgam, Cd48, P2Ry6, Laptm5,
Fcgr1A, Hmox1, Cd22, Fcer1G, Gpnmb, Ptpn6, Icam1, Ptprc, Plek,
Rt1-Ce12, Pdpn, Anxa1, Axl, Stom, Cd86, Cybb, Gngt2, Emr1, Fcgr2B,
Clec7A, Cp, Gbp2 |
|
| GO:0005886-plasma
membrane | 47 | 2.18E-04 | Itgal, Gna15,
Aif1, Ifitm3, Tlr2, Rsad2, Itgb2, Abca1, Itgam, Slc7A7, Cd48,
P2Ry6, Laptm5, Mall, Fcgr1A, Hmox1, Cfh, Fcer1G, Cd22, Pik3Ap1,
Inpp5D, Fcgr3A, Gpnmb, Csf1R, Blnk, Ptprc, Ptpn6, Icam1, F10, Plek,
Rt1-Ce12, Pdpn, Anxa1, Axl, Clic1, Stom, Cd86, Cybb, Gngt2, Gpr34,
Fcgr2B, Emr1, Cd300A, Clec7A, Pcyox1, Cp, Gbp2 |
|
|
GO:0005576-extracellular region | 30 | 3.59E-04 | Fmod, Ccl2,
Spock3, C3, Tnc, C1Qc, Timp1, Lgals3Bp, Glipr1, Fcn1, Cfh, Pycard,
Ptn, Casp1, Tfpi2, Matn2, Icam1, Ctsz, F10, Tnfsf4, Lgals3, Plek,
Anxa1, C1Qa, C1Qb, Grn, Cxcl16, Cp, Pcyox1, Pros1 |
| MF |
GO:0030246-carbohydrate binding | 19 | 8.31E-08 | Ptprc, Ccl2,
Lgals3, Spock3, Endou, Hexb, Tlr2, Itgam, Tnfaip6, Pygl, Fcn1, Cfh,
Grifin, Clec4A1, Ptn, Clec4A3, Clec7A, Gpnmb, Cd302 |
|
|
GO:0030247-polysaccharide binding | 11 | 1.06E-06 | Tnfaip6, Ptprc,
Ccl2, Spock3, Endou, Cfh, Tlr2, Ptn, Clec7A, Gpnmb, Itgam |
|
| GO:0001871-pattern
binding | 11 | 1.06E-06 | Tnfaip6, Ptprc,
Ccl2, Spock3, Endou, Cfh, Tlr2, Ptn, Clec7A, Gpnmb, Itgam |
|
|
GO:0019865-immunoglobulin binding | 5 | 8.51E-06 | Lgals3, Fcgr2B,
Fcgr1A, Fcer1G, Fcgr3A |
|
|
GO:0005539-glycosaminoglycan binding | 9 | 2.63E-05 | Tnfaip6, Ptprc,
Ccl2, Spock3, Cfh, Tlr2, Ptn, Gpnmb, Itgam |
| Table II.Top five enriched GO terms with the
highest P-value in biological process, cellular component and
molecular function for the downregulated differentially expressed
genes common to the 1 week injury and 3 week injury samples. |
Table II.
Top five enriched GO terms with the
highest P-value in biological process, cellular component and
molecular function for the downregulated differentially expressed
genes common to the 1 week injury and 3 week injury samples.
| Category | Term | Count | P-value | Genes |
|---|
| BP | GO:0008585-female
gonad development | 5 | 7.32E-05 | Pgr, Vegfa,
Bcl2L1, Pcyt1B, Vgf |
|
|
GO:0046545-development of primary female
sexual characteristics | 5 | 9.52E-05 | Pgr, Vegfa,
Bcl2L1, Pcyt1B, Vgf |
|
|
GO:0022602-ovulation cycle process | 5 | 1.05E-04 | Pgr, Vegfa,
Bcl2L1, Pcyt1B, Vgf |
|
| GO:0046660-female
sex differentiation | 5 | 1.28E-04 | Pgr, Vegfa,
Bcl2L1, Pcyt1B, Vgf |
|
|
GO:0042698-ovulation cycle | 5 | 1.46E-04 | Pgr, Vegfa,
Bcl2L1, Pcyt1B, Vgf |
| CC | GO:0043005-neuron
projection | 8 | 6.07E-04 | Pgr, Atp2B2,
Dnm3, Grm7, Dicer1, Slc18A3, Vgf, Pex5L |
|
|
GO:0045202-synapse | 7 | 1.68E-03 | Dnm3, Clstn2,
Gabra4, Gabra3, Grm7, Rps6Kb1, Rph3A |
|
| GO:0044456-synapse
part | 6 | 1.80E-03 | Dnm3, Clstn2,
Gabra4, Gabra3, Grm7, Rph3A |
|
|
GO:0030425-dendrite | 5 | 8.17E-03 | Atp2B2, Dnm3,
Grm7, Dicer1, Pex5L |
|
| GO:0005886-plasma
membrane | 16 | 9.36E-03 | Cadm3, Clstn2,
Gabra4, Gabra3, Trhr, Rps6Kb1, Bcl2L1, Cacnb4, Rph3A, Slc9A3R2,
P2Rx5, Atp2B2, Mast1, Grm7, Rasgrp1, Slc6A5 |
| MF | GO:0022836-gated
channel activity | 5 | 1.32E-02 | P2Rx5, Gabra4,
Gabra3, Grm7, Cacnb4 |
|
|
GO:0005230-extracellular ligand-gated ion
channel activity | 3 | 2.14E-02 | P2Rx5, Gabra4,
Gabra3 |
|
| GO:0005216-ion
channel activity | 5 | 2.74E-02 | P2Rx5, Gabra4,
Gabra3, Grm7, Cacnb4 |
|
|
GO:0022838-substrate specific channel
activity | 5 | 3.00E-02 | P2Rx5, Gabra4,
Gabra3, Grm7, Cacnb4 |
|
| GO:0046983-protein
dimerization activity | 6 | 3.33E-02 | Zbtb7B, Cadm3,
Grm7, Trhr, Vegfa, Bcl2L1 |
Meanwhile, a set of upregulated DEGs were markedly
enriched in certain pathways, including natural killer cell
mediated cytotoxicity [e.g. Ras-related C3 botulinum toxin
substrate 2 (Rac2) and TYRO protein tyrosine kinase binding
protein (Tyrobp)] and the B cell receptor signaling pathway
[e.g. fc fragment of IgG receptor IIb (Fcgr2B) and
Rac2). Several downregulated DEGs were significantly
enriched in the pathways of steroid biosynthesis (cytochrome P450
family 51, transmembrane 7 superfamily member 2 and lanosterol
synthase) and neuroactive ligand-receptor interaction (e.g.
Gabra3 and Grm7; Table
III).
| Table III.Top five enriched pathways for the
upregulated differentially expressed genes and two enriched
pathways for the downregulated differentially expressed genes
common to the 1 week injury and 3 week injury samples. |
Table III.
Top five enriched pathways for the
upregulated differentially expressed genes and two enriched
pathways for the downregulated differentially expressed genes
common to the 1 week injury and 3 week injury samples.
| Category | Term | Count | P-value | Genes |
|---|
| Upregulated | rno04650:Natural
killer cell mediated cytotoxicity | 11 | 9.78E-07 | Cd48, Itgal,
Ptpn6, Icam1, Fcgr2B, Rac2, Fcer1G, Itgb2, Fcgr3A, Vav1,
Tyrobp |
|
| rno04662:B cell
receptor signaling pathway | 9 | 7.93E-06 | Ptpn6, Fcgr2B,
Rac2, Cd22, Pik3Ap1, Inpp5D, Vav1, Btk, Blnk |
|
| rno04666:Fc γ
R-mediated phagocytosis | 8 | 2.01E-04 | Arpc1B, Ptprc,
Fcgr2B, Rac2, Hck, Fcgr1A, Inpp5D, Vav1 |
|
| rno05322:Systemic
lupus erythematosus | 8 | 2.32E-04 | C1Qa, C1Qb,
Cd86, Fcgr2B, C3, Fcgr1A, Fcgr3A, C1Qc |
|
| rno04610:Complement
and coagulation cascades | 7 | 3.92E-04 | C1Qa, C1Qb, F10,
C3, Cfh, Pros1, C1Qc |
| Downregulated | rno00100:Steroid
biosynthesis | 3 | 1.94E-03 | Cyp51, Tm7Sf2,
Lss |
|
|
rno04080:Neuroactive ligand-receptor
interaction | 5 | 1.77E-02 | P2Rx5, Gabra4,
Gabra3, Grm7, Trhr |
Analysis of co-expressed genes
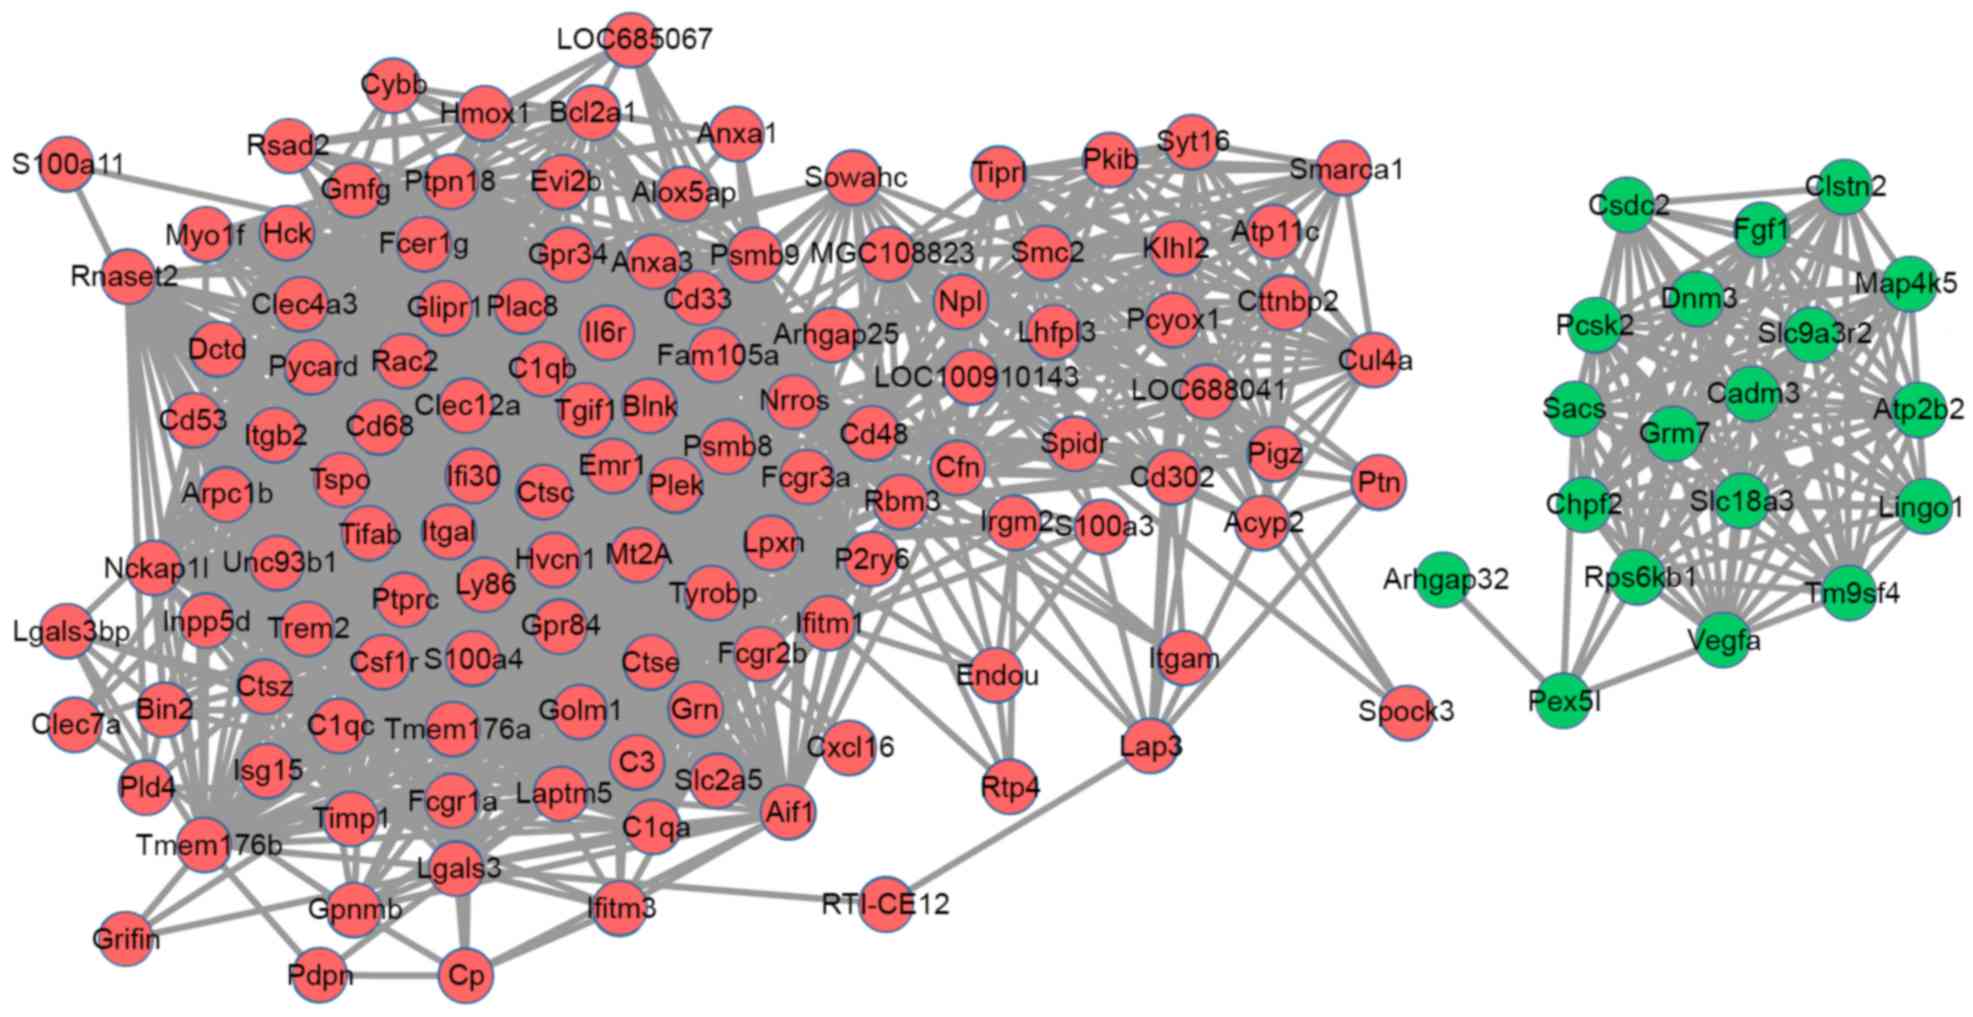
Gene co-expression analysis is a powerful method to
predict the function of genes and/or to identify genes that are
functionally associated with query genes. Based on the cut-off
criterion of Pearson correlation coefficient >0.9, 1894
co-expression pairs in 139 DEGs were obtained (Fig. 3). Notably, the majority of
co-expressed genes were upregulated DEGs.
According to GO functional enrichment analysis, the
upregulated co-expressed genes [e.g. Rac2, fc fragment of
IgG receptor Ia and including TGFB induced factor homeobox 1
(Tgif1)] were significantly enriched in a series of GO
terms, including biological regulation and response to stimulus.
The downregulated co-expressed genes were markedly enriched in
certain GO terms, including anatomical structure development (e.g.
Dnm3 and Vegfa) and intracellular signal transduction
(e.g. mitogen-activated protein kinase kinase kinase kinase 5 and
Grm7) (Table IV).
| Table IV.Top five enriched GO terms with the
highest P-value in biological process for the co-expressed up- and
downregulated genes. |
Table IV.
Top five enriched GO terms with the
highest P-value in biological process for the co-expressed up- and
downregulated genes.
| Category | Term | Count | P-value | Genes |
|---|
| Co-expressed
upregulated genes |
GO:0065007-biological regulation | 44 | 2.39E-02 | S100A4, Tspo,
Spock3, C3, Aif1, Rbm3, Unc93B1, Rsad2, Itgb2, Cd53, C1Qc, Tiprl,
Timp1, Cd48, P2Ry6, Rac2, Fcgr1A, Hmox1, Pycard, Cfh, Ptn, Fcer1G,
Inpp5D, Csf1R, Ptprc, Pigz, Plek, Pdpn, Bcl2A1, Anxa1, Pkib, Il6R,
Anxa3, Psmb8, Arhgap25, Psmb9, C1Qa, C1Qb, Arpc1B, Grn, Cxcl16,
Tgif1, Cp, Smarca1 |
|
|
GO:0050789-regulation of biological
process | 43 | 1.12E-02 | S100A4, Tspo,
Spock3, C3, Aif1, Rbm3, Unc93B1, Rsad2, Itgb2, Cd53, C1Qc, Tiprl,
Timp1, Cd48, P2Ry6, Rac2, Fcgr1A, Hmox1, Pycard, Cfh, Ptn, Fcer1G,
Inpp5D, Csf1R, Ptprc, Pigz, Plek, Pdpn, Bcl2A1, Anxa1, Pkib, Il6R,
Anxa3, Psmb8, Arhgap25, Psmb9, C1Qa, C1Qb, Arpc1B, Grn, Cxcl16,
Tgif1, Smarca1 |
|
| GO:0050896-response
to stimulus | 41 | 8.03E-04 | Itgal, Tspo,
Rtp4, Ifitm1, C3, Aif1, Rbm3, Ifitm3, Endou, Rsad2, Itgb2, C1Qc,
Itgam, Tiprl, Timp1, Cd48, Rac2, Alox5Ap, Fcgr1A, Hmox1, Pycard,
Cfh, Ptn, Fcer1G, Inpp5D, Fcgr3A, Ptprc, Plek, Rt1-Ce12, Pdpn, Hck,
Anxa1, Il6R, Anxa3, C1Qa, C1Qb, Cybb, Cxcl16, Tgif1, Ctsc,
Cp |
|
| GO:0048518-positive
regulation of biological process | 33 | 3.61E-07 | S100A4, Tspo,
C3, Aif1, Rbm3, Unc93B1, Itgb2, C1Qc, P2Ry6, Rac2, Fcgr1A, Hmox1,
Pycard, Cfh, Ptn, Fcer1G, Inpp5D, Csf1R, Ptprc, Pigz, Plek, Pdpn,
Anxa1, Il6R, Anxa3, Psmb8, Psmb9, C1Qa, C1Qb, Cxcl16, Grn, Tgif1,
Smarca1 |
|
| GO:0002376-immune
system process | 28 | 6.07E-15 | Itgal, Aif1, C3,
Endou, Unc93B1, Rsad2, Itgb2, C1Qc, Itgam, Cd48, Fcgr1A, Cfh,
Fcer1G, Inpp5D, Fcgr3A, Blnk, Ptprc, Plek, Rt1-Ce12, Bcl2A1, Anxa3,
Psmb8, Psmb9, C1Qa, C1Qb, Cybb, Cxcl16, Ctse |
| Co-expressed
downregulated genes |
GO:0048856-anatomical structure
development | 8 | 4.26E-02 | Pcsk2, Lingo1,
Atp2B2, Dnm3, Vegfa, Rps6Kb1, Fgf1, Slc9A3R2 |
|
| GO:0007399-nervous
system | 6 | 4.26E-02 | Pcsk2, Lingo1,
Atp2B2, Dnm3, Vegfa, Fgf1 |
|
|
GO:0035556-intracellular signal
transduction | 5 | 4.26E-02 | Lingo1, Map4K5,
Grm7, Rps6Kb1, Fgf1 |
|
| GO:0023014-signal
transmission via phosphorylation event | 4 | 3.54E-02 | Lingo1, Map4K5,
Rps6Kb1, Fgf1 |
|
|
GO:0007243-intracellular protein kinase
cascade | 4 | 3.54E-02 | Lingo1, Map4K5,
Rps6Kb1, Fgf1 |
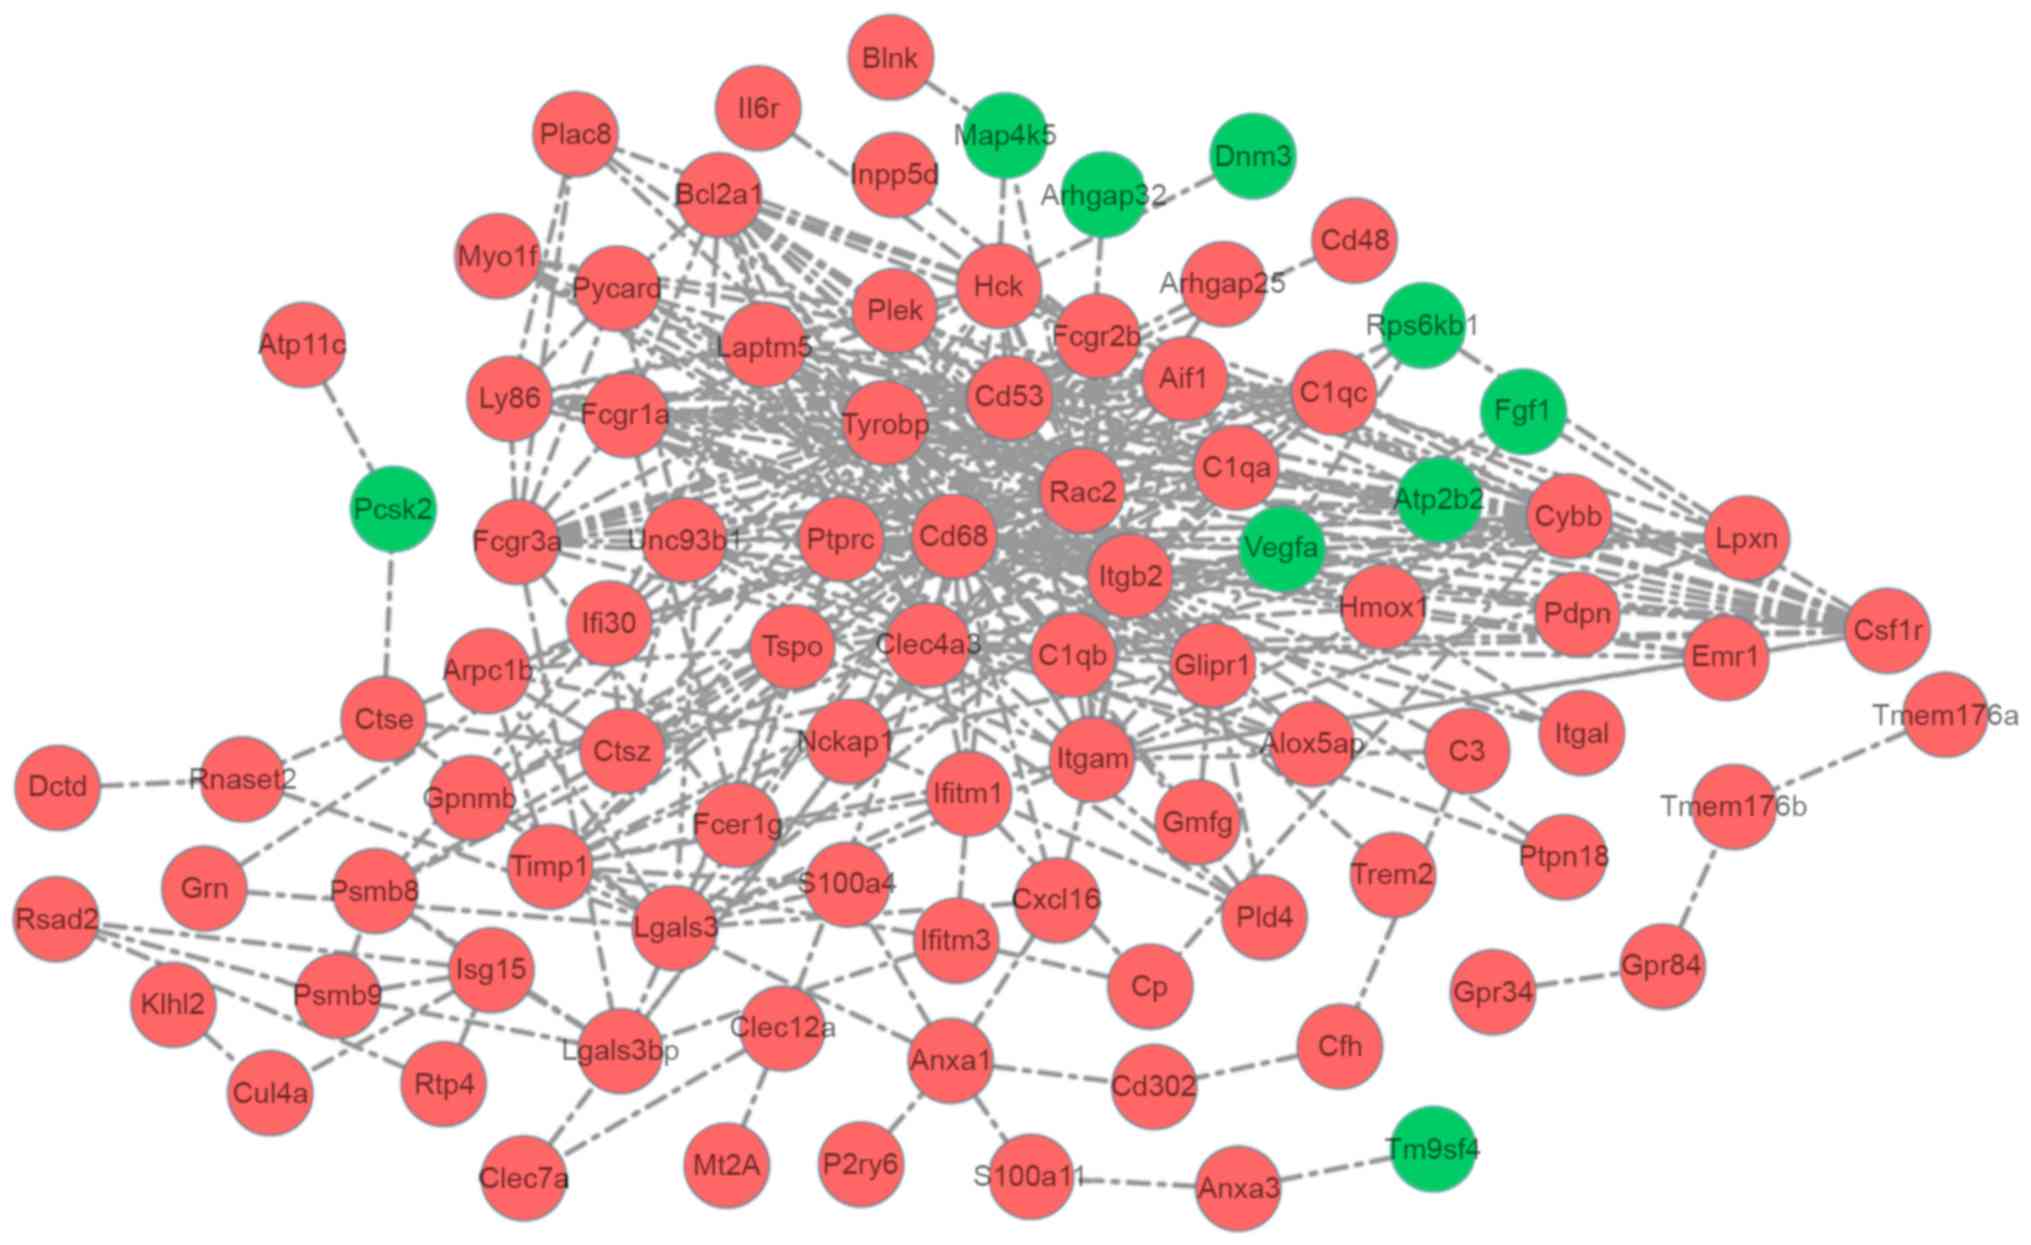
The PPI network was composed of 92 co-expressed
genes (83 upregulated and 9 downregulated) and 351 interactions.
The connectivity degree of six genes was more than 20 and they were
Tyrobp (degree=35), CD68 molecule (Cd68; degree=34),
Rac2 (degree=29), integrin subunit β2; (degree=28), CD53
molecule (degree=25), C-type lectin domain family 4 member A
(degree=22). Tyrobp interacted with multiple genes,
including Cd68 and Rac2 (Fig. 4).
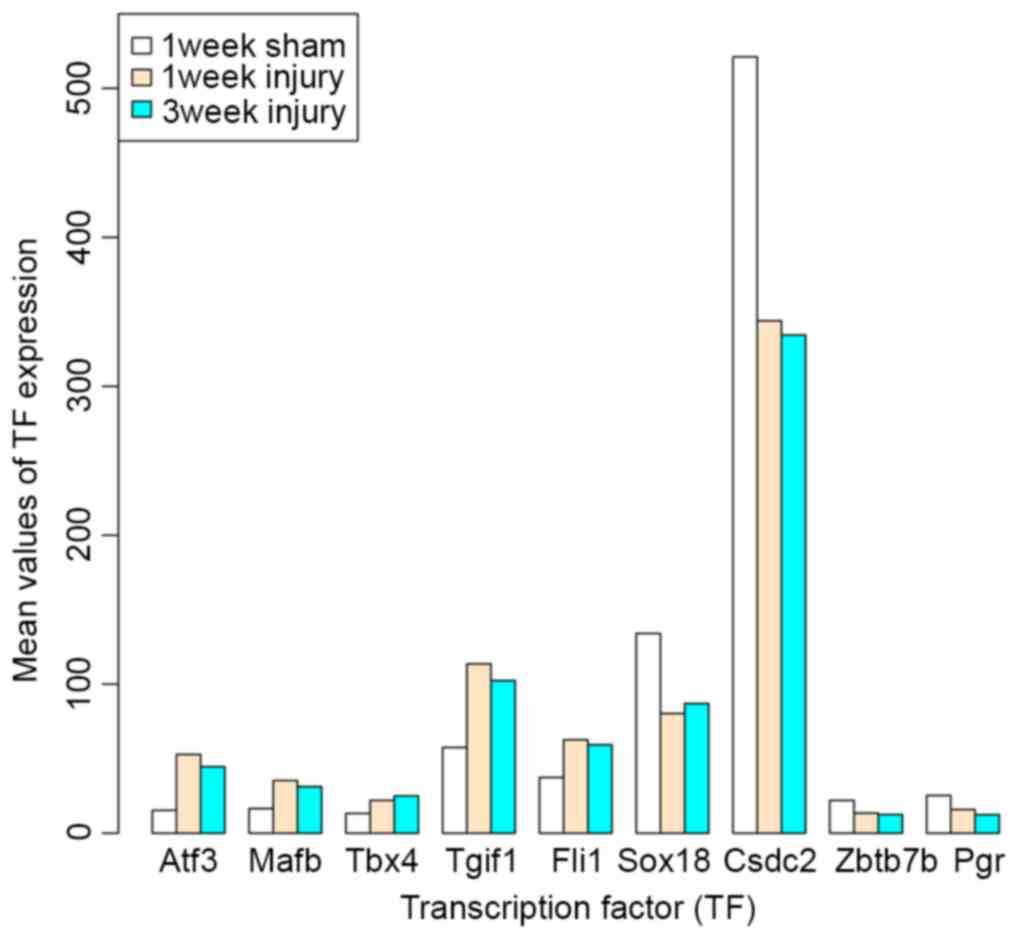
Analysis of TFs
Based on the AnimalTFDB database, a total of 9 TFs
were identified from the DEGs common to the 1 and 3 week injury
samples, including cold shock domain containing C2, Pgr,
zinc finger and BTB domain containing 7B, SRY-box 18, activating TF
3 (Atf3), MAF BZIP TF B (Mafb), Tgif1, Fli-1
proto-oncogene, ETS TF (Fli1) and T-box 4 (Tbx4).
Among them, Atf3, Mafb, Tbx4, Tgif1 and
Fli1 were all upregulated in 1 and 3 week injury samples,
compared with sham samples, while the others were downregulated
(Fig. 5).
Discussion
In the present study, 234 upregulated and 51
downregulated DEGs were common to the 1 week and 3 week injury
samples, compared with the sham samples. Among them, 139 genes had
co-expression associations and the majority of them were
upregulated genes. The upregulated co-expressed genes were
predominantly enriched in several GO terms of biological
regulation, including Tgif1 and Rac2.
Tgif1 was identified as a TF in the present
study. It belongs to the three-amino acid loop extension superclass
of atypical homeodomains (15).
Studies (16–18) have showed that Tgif1 exerts
crucial functions in the nervous system. Additionally, a previous
study (19) identified TGIF1 as a
novel regulator of macrophage activation in immune response. In the
present study, Tgif1 had a co-expression associations with
Rac2 and Tyrobp, the two of which had a higher degree
in the PPI network. Rac2 encodes a member of the Ras
superfamily of small guanosine triphosphate (GTP)-metabolizing
proteins, and it modulates diverse processes, including secretion,
cell polarization and phagocytosis (20). In the present study, Rac2
was identified to be significantly enriched in several pathways,
including natural killer cell-mediated cytotoxicity. Natural killer
cells participate in immune processes after spinal cord injury
(21) and there is evidence that
suppression of Rac activity in the injured spinal cord enhances
cell survival (22). It has been
demonstrated that the expression of Rac2 is activated in
inflammatory responses (23).
Furthermore, Ras GTPases exert critical functions in multiple
procedures during axonogenesis in injured spinal cords (24). Tyrobp is a transmembrane signaling
polypeptide which has an immunoreceptor tyrosine-based activation
motif and it serves a role in signal transduction, brain
myelination, and inflammation (25,26).
In the current study, Tyrobp was enriched in natural killer
cell mediated cytotoxicity, interacted with Rac2 in the PPI
network and co-expressed with Tgif1. Together, Tgif1,
Rac2 and Tyrobp may play pivotal roles in TSCI.
Among the downregulated genes, Pgr,
identified as a TF, was highly enriched in female gonad development
and the ovulation cycle process. In axonal regeneration, gonadal
steroids function as promoting factors (27). Estrogens have direct
neuroprotective effects, including modification of humoral immune
responses, and gestagens can prevent neuronal death and promote the
growth of nervous cells and the formation of new synapses (28). A previous study (29) confirmed that progesterone provides
neuroprotection to the injured central and peripheral nervous
system in the injured spinal cord. Therefore, Pgr may serve
a key role in the regulation of nervous regeneration in spinal cord
injuries.
In conclusion, 234 upregulated and 51 downregulated
DEGs were differentially expressed in 1 and 3 week injury samples.
Among them, the upregulated genes Rac2 and Tyrobp,
which are associated with natural killer cell-mediated
cytotoxicity, may have crucial functions in TSCI. Tgif1 and
Pgr may exert a regulatory function in TSCI. These
observations require experimental validation, however they are
expected to aid the elucidation of the molecular mechanisms in
TSCI.
References
|
1
|
Jain NB, Ayers GD, Peterson EN, Harris MB,
Morse L, O'Connor KC and Garshick E: Traumatic spinal cord injury
in the United States, 1993–2012. Jama. 313:2236–2243. 2015.
View Article : Google Scholar : PubMed/NCBI
|
|
2
|
Chen MJ, Kress B, Han X, Moll K, Peng W,
Ji RR and Nedergaard M: Astrocytic CX43 hemichannels and gap
junctions play a crucial role in development of chronic neuropathic
pain following spinal cord injury. Glia. 60:1660–1670. 2012.
View Article : Google Scholar : PubMed/NCBI
|
|
3
|
Chen M, Ni Y, Liu Y, Xia X, Cao J, Wang C,
Mao X, Zhang W, Chen C, Chen X and Wang Y: Spatiotemporal
expression of EAPP modulates neuronal apoptosis and reactive
astrogliosis after spinal cord injury. J Cell Biochem.
116:1381–1390. 2015. View Article : Google Scholar : PubMed/NCBI
|
|
4
|
Zhu P, Hata R, Nakata K, Cao F, Samukawa
K, Fujita H and Sakanaka M: Intravenous infusion of ginsenoside Rb1
ameliorates compressive spinal cord injury through upregulation of
Bcl-xL and VEGF. Int J Neurol Neurother. 2:12015. View Article : Google Scholar : PubMed/NCBI
|
|
5
|
De Biase A, Knoblach SM, Di Giovanni S,
Fan C, Molon A, Hoffman EP and Faden AI: Gene expression profiling
of experimental traumatic spinal cord injury as a function of
distance from impact site and injury severity. Physiol Genom.
22:368–381. 2005. View Article : Google Scholar
|
|
6
|
Byrnes KR, Garay J, Di Giovanni S, De
Biase A, Knoblach SM, Hoffman EP, Movsesyan V and Faden AI:
Expression of two temporally distinct microglia-related gene
clusters after spinal cord injury. Glia. 53:420–433. 2006.
View Article : Google Scholar : PubMed/NCBI
|
|
7
|
Sharp J, Frame J, Siegenthaler M, Nistor G
and Keirstead HS: Human embryonic stem cell-derived oligodendrocyte
progenitor cell transplants improve recovery after cervical spinal
cord injury. Stem Cells. 28:152–163. 2010.PubMed/NCBI
|
|
8
|
Shin HY, Kim H, Kwon MJ, Hwang DH, Lee K
and Kim BG: Molecular and cellular changes in the lumbar spinal
cord following thoracic injury: Regulation by treadmill locomotor
training. PLoS One. 9:e882152014. View Article : Google Scholar : PubMed/NCBI
|
|
9
|
Gautier L, Cope L, Bolstad BM and Irizarry
RA: Affy-analysis of Affymetrix GeneChip data at the probe level.
Bioinformatics. 20:307–315. 2004. View Article : Google Scholar : PubMed/NCBI
|
|
10
|
Smyth GK: Limma: Linear models for
microarray dataBioinformatics and computational biology solutions
using R and Bioconductor. Springer; pp. 397–420. 2005, View Article : Google Scholar
|
|
11
|
Obayashi T and Kinoshita K: Rank of
correlation coefficient as a comparable measure for biological
significance of gene coexpression. DNA Res. 16:249–260. 2009.
View Article : Google Scholar : PubMed/NCBI
|
|
12
|
Kohl M, Wiese S and Warscheid B:
Cytoscape: Software for visualization and analysis of biological
networksData Mining in Proteomics. Springer; pp. 291–303. 2011
|
|
13
|
Maere S, Heymans K and Kuiper M: BiNGO: A
Cytoscape plugin to assess overrepresentation of gene ontology
categories in biological networks. Bioinformatics. 21:3448–3449.
2005. View Article : Google Scholar : PubMed/NCBI
|
|
14
|
Zhang HM, Liu T, Liu CJ, Song S, Zhang X,
Liu W, Jia H, Xue Y and Guo AY: Animal TFDB 2.0: A resource for
expression, prediction and functional study of animal transcription
factors. Nucleic Acids Res. 43(Database Issue): D76–D81. 2015.
View Article : Google Scholar : PubMed/NCBI
|
|
15
|
Yang Y, Hwang CK, D'Souza UM, Lee SH, Junn
E and Mouradian MM: Three-amino acid extension loop homeodomain
proteins Meis2 and TGIF differentially regulate transcription. J
Biol Chem. 275:20734–20741. 2000. View Article : Google Scholar : PubMed/NCBI
|
|
16
|
Huang J, Wah IY, Pooh RK and Choy KW:
Molecular genetics in fetal neurology. Semin Fetal Neonatal Med.
17:341–346. 2012. View Article : Google Scholar : PubMed/NCBI
|
|
17
|
Kerr TC, Cuykendall TN, Luettjohann LC and
Houston DW: Maternal Tgif1 regulates nodal gene expression in
Xenopus. Dev Dyn. 237:2862–2873. 2008. View Article : Google Scholar : PubMed/NCBI
|
|
18
|
Sha L, Kitchen R, Porteous D, Blackwood D,
Muir W and Pickard B: SOX11 target genes: Implications for
neurogenesis and neuropsychiatric illness. Acta Neuropsychiatrica.
24:16–25. 2012. View Article : Google Scholar : PubMed/NCBI
|
|
19
|
Ramsey SA, Klemm SL, Zak DE, Kennedy KA,
Thorsson V, Li B, Gilchrist M, Gold ES, Johnson CD, Litvak V, et
al: Uncovering a macrophage transcriptional program by integrating
evidence from motif scanning and expression dynamics. PLoS Comput
Biol. 21:e10000212008. View Article : Google Scholar
|
|
20
|
Didsbury J, Weber RF, Bokoch GM, Evans T
and Snyderman R: Rac, a novel ras-related family of proteins that
are botulinum toxin substrates. J Biol Chem. 264:16378–16382.
1989.PubMed/NCBI
|
|
21
|
Iversen PO, Hjeltnes N, Holm B, Flatebo T,
Strom-Gundersen I, Ronning W, Stanghelle J and Benestad HB:
Depressed immunity and impaired proliferation of hematopoietic
progenitor cells in patients with complete spinal cord injury.
Blood. 96:2081–2083. 2000.PubMed/NCBI
|
|
22
|
Numano F, Inoue A, Enomoto M, Shinomiya K,
Okawa A and Okabe S: Critical involvement of Rho GTPase activity in
the efficient transplantation of neural stem cells into the injured
spinal cord. Mol Brain. 2:372009. View Article : Google Scholar : PubMed/NCBI
|
|
23
|
Tian Y and Autieri MV: Cytokine expression
and AIF-1-mediated activation of Rac2 in vascular smooth muscle
cells: A role for Rac2 in VSMC activation. Am J Physiol Cell
Physiol. 292:C841–C849. 2007. View Article : Google Scholar : PubMed/NCBI
|
|
24
|
Hall A and Lalli G: Rho and Ras GTPases in
axon growth, guidance, and branching. Cold Spring Harb Perspect
Biol. 2:a0018182010. View Article : Google Scholar : PubMed/NCBI
|
|
25
|
Lanier LL, Corliss BC, Wu J, Leong C and
Phillips JH: Immunoreceptor DAP12 bearing a tyrosine-based
activation motif is involved in activating NK cells. Nature.
391:703–707. 1998. View
Article : Google Scholar : PubMed/NCBI
|
|
26
|
Gingras MC, Lapillonne H and Margolin JF:
TREM-1, MDL-1 and DAP12 expression is associated with a mature
stage of myeloid development. Mol Immunol. 38:817–824. 2002.
View Article : Google Scholar : PubMed/NCBI
|
|
27
|
Jones KJ: Gonadal steroids as promoting
factors in axonal regeneration. Brain Res Bull. 30:491–498. 1993.
View Article : Google Scholar : PubMed/NCBI
|
|
28
|
Pakulski C: Neuroprotective properties of
sex hormones. Anestezjol Intens Ter. 43:113–118. 2011.(In Polish).
PubMed/NCBI
|
|
29
|
Gonzalez SL, Labombarda F, González
Deniselle MC, Guennoun R, Schumacher M and De Nicola AF:
Progesterone up-regulates neuronal brain-derived neurotrophic
factor expression in the injured spinal cord. Neuroscience.
125:605–614. 2004. View Article : Google Scholar : PubMed/NCBI
|