Introduction
Strokes are reported to be the third leading cause
of mortality following cancer and heart disease, and the most
common cause of adult disability in developed countries (1). It is estimated that 85% of strokes
can be ascribed to atherosclerotic disease, and 10% are
specifically associated with carotid atheroma (2,3).
Several factors have been identified to predispose to carotid
atherosclerosis, including male gender, advancing age,
hypercholesterolemia, systolic hypertension and obesity (4). However, these classic characteristics
are generally poor at predicting the risk of thromboembolism, which
may lead to 80% needlessly exposed to the surgical risks of carotid
endarterectomy (5). Thus, it is
important to investigate markers with improved ability in
predicting the formation of carotid atheroma plaques.
With the emergence and improvement of gene
microarray technology, global mRNA expression has been investigated
for screening mRNA populations, which are differentially regulated
in varied disease processes, and to provide clues to the underlying
molecular pathology. In terms of carotid atheroma, a microarray
study by Ayari and Bricca (6) was
performed in patients with significant carotid stenosis, and used
for comparing gene expression between carotid plaque and intact
arterial tissues. Expression profiling provides substantial
valuable information, although the previous study focused on the
gene expression of CD163 and HO-1 only, which suggested more
pronounced induction of atheromatous plaque formation with these
two genes. The deep mining of this set of data is urgently required
as it is likely to assist in screening potential gene markers of
carotid atheroma plaque formation.
In the present study the genome-wide expression
profile of human carotid atheroma were analyzed comprehensively
using high-throughput bioinformatics methods. Differentially
expressed genes (DEGs) were identified in the carotid atheroma
plaque and compared with the macroscopically intact carotid tissue
adjacent to the atheroma plaque. Functional annotation and pathway
enrichment were then performed, followed by the construction of
protein-protein interaction (PPI) networks, analysis of key nodes
and prediction of transcription factors (TFs). The aim of the
present study was to examine potential gene markers for predicting
the formation of carotid atheroma plaques.
Materials and methods
Data source
The GSE43292 gene expression profile and its
corresponding platform annotation files were downloaded from the
Gene Expression Omnibus (GEO) database (http://www.ncbi.nlm.nih.gov/geo/) (7). This data set was submitted by Ayari
and Bricca (6) on 4th January
2013, last updated on 21st May 2015 and stockpiled on the GPL6244
platform (HuGene-1_0-st) Affymetrix Human Gene 1.0 ST Array
[transcript (gene) version]). This gene expression data consisted
of 32 paired samples of carotid atheroma plaque and macroscopically
intact tissue adjacent to the atheroma plaque. Each paired sample
was collected from sections obtained through carotid endarterectomy
in one hypertensive patient. Specifically, the samples of the
atheroma plaque were at stage IV or above according to the Stary
classification (8), and contained
the core and shoulders of the plaque, whereas the other group of
samples were distant macroscopically intact tissue at stages I and
II.
Data preprocessing
For the optimal mining of essential information from
the gene expression profile, the raw level data were first
preprocessed using the Robust Multi-array Average method in the
Bioconductor oligo package (version 2.1; http://www.bioconductor.org), which is based on the
Bioconductor principles of reproducibility, transparency and
efficiency of development (9). The
probe ID for each gene was then converted to a gene symbol using
the hugene10sttranscriptcluster.db, org.Hs.eg.db and annotate
package in Biocondctuor (http://www.bioconductor.org/). For gene symbols
corresponding to multiple probes IDs, the mean of these probes was
calculated as the representative expression level of this gene.
Screening for DEGs
To identify the DEGs between the carotid atheroma
plaque and macroscopically intact carotid tissue samples, a paired
t-test in the Linear Models for Microarray Data (LIMMA) package of
R/Bioconductor software was performed for analyzing data from the
gene expression experiments (10).
The Benjamini-Hochberg methods (11) were further used to correct the
P-value, and a false discovery rate of the P-value (FDP) was
calculated (12). FDP<0.05
accompanied with |log2 fold-change (FC)| ≥0.58 were
considered the thresholds for the identification of DEGs, which
were grouped as upregulated and downregulated genes.
Functional annotation and pathway
enrichment
The Database for Annotation Visualization and
Integrated Discovery (DAVID; http://david.abcc.ncifcrf.gov) is primarily used for
functional annotation and classification. This tool was designed to
systematically extract biological meanings from a large gene or
protein list through a novel agglomeration algorithm (13). To investigate the potential
functions of the DEGs screened out above, DAVID was used to map the
upregulated and downregulated genes to Gene Ontology (GO) terms and
the Kyoto Encyclopedia of Genes and Genomes (KEGG) pathways,
respectively. The GO is determined using the Gene Ontology
Consortium (http://www.geneontology.org) and widely used to
produce a dynamic and controlled vocabulary for all eukaryotes with
accumulation and alterations in gene and protein roles in cells
(14). To describe gene product
attributes, GO provides three structured networks of defined terms,
including cellular compartment (CC), biological process (BP) and
molecular function (MF). By contrast, the KEGG pathway database
(http://www.genome.ad.jp/kegg) contains
information on how molecules or genes are networked, which is
essentially a combined map of ~120 existing pathway maps (15). In the present study, GO terms with
a threshold of P<0.05, and KEGG pathways with a threshold of
P<0.05 and enriched gene count ≥3 were selected.
Construction of the PPI network
PPIs are considered to be important for
understanding the potential functions of a certain protein, and the
Search Tool for the Retrieval of Interacting Genes (STRING;
http://string-db.org/) is designed to provide
such a global perspective based on criteria, including experimental
evidence, neighborhood, gene fusion, co-occurrence, co-expression,
existing databases and text-mining (16) In the present study, PPI pairs were
predicted using STRING, and those with high confidence (PPI score
>0.07) were selected for construction of the PPI network. The
PPI network was visualized using Cytoscape 2.8 (http://cytoscape.org/) (17), followed by module analyses using
ClusterONE with the threshold of <4e-4. The genes in the
significant modules were further mapped to KEGG pathways for
functional analysis.
Functional analysis for key nodes in
the PPI network
Functional analyses were performed for key nodes in
the PPI network constructed above. GenCLiP 2.0 is a web-based
text-mining server, which can be used for the analysis of human
genes with enriched keywords and molecular interactions (http://ci.smu.edu.cn/GenCLiP2.0/confirm_keywords.php).
The Gene Cluster with Literature Profiles module in GenCLiP can
annotate the input genes by generating statistically
over-represented keywords based on the occurrence frequencies of
free terms in gene-based literature. In addition, Agilent
Literature Search software is a meta-search tool for automatically
querying multiple text-based search engines to identify and extract
associations among genes/proteins of interest (http://www.agilent.com/labs/research/litsearch.html).
In the present study, the potential functions of key nodes in the
PPI network were predicted using the Gene Cluster with Literature
Profiles module with a threshold of P≤0.05 and Hit ≥6, and their
associations with the formation of atheroma plaques were identified
using Agilent Literature Search software with the key word
‘atheroma plaque’.
Prediction of TFs
iRegulon, as a Cytoscape plugin, was developed to
reverse-engineer the transcriptional regulatory network underlying
a co-expressed gene set using cis-regulatory sequence analysis and
integrating databases of TFs, including Transfac, Jaspar, Encode,
Swissregulon and Homer (18). By
setting the minimum identity between orthologous genes as 0.05 and
the maximum false discovery rate on motif similarity as 0.001,
iRegulon was used to predict TFs targeting to genes in the modules
identified above with a normalized enrichment score >5.
Results
Data processing and DEG screening
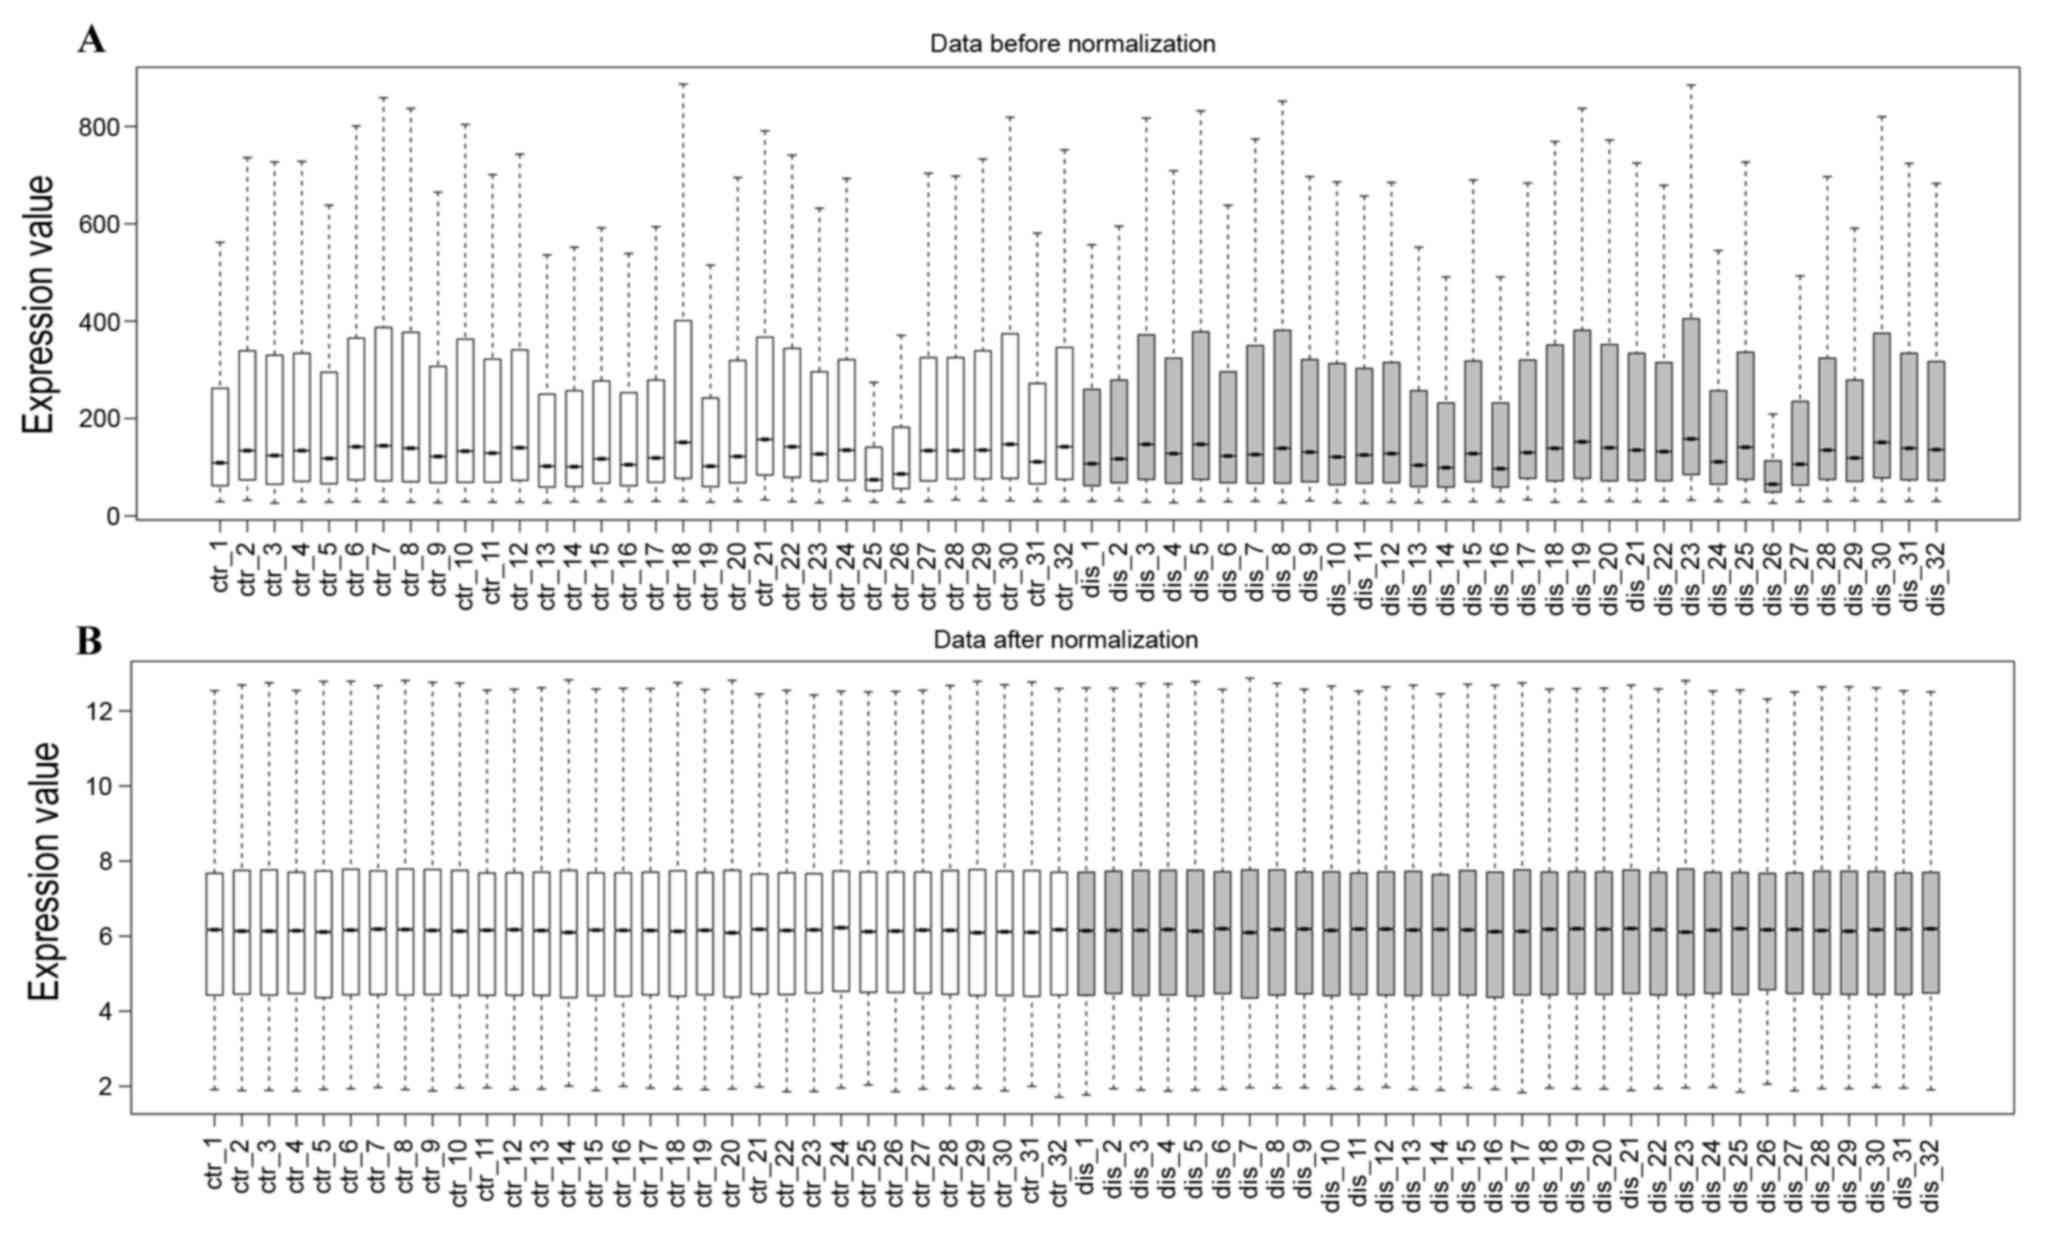
The profile normalization is shown in Fig. 1A and B. The median base-line level
in the box plot indicates well-effected normalization. With the
criteria of FDP<0.05 and |log2 FC| ≥0.58, a total of 886 DEGs
were finally screened out from the carotid atheroma plaque samples,
when compared with those of the macroscopically intact carotid
tissue, including 513 upregulated genes and 373 downregulated
genes.
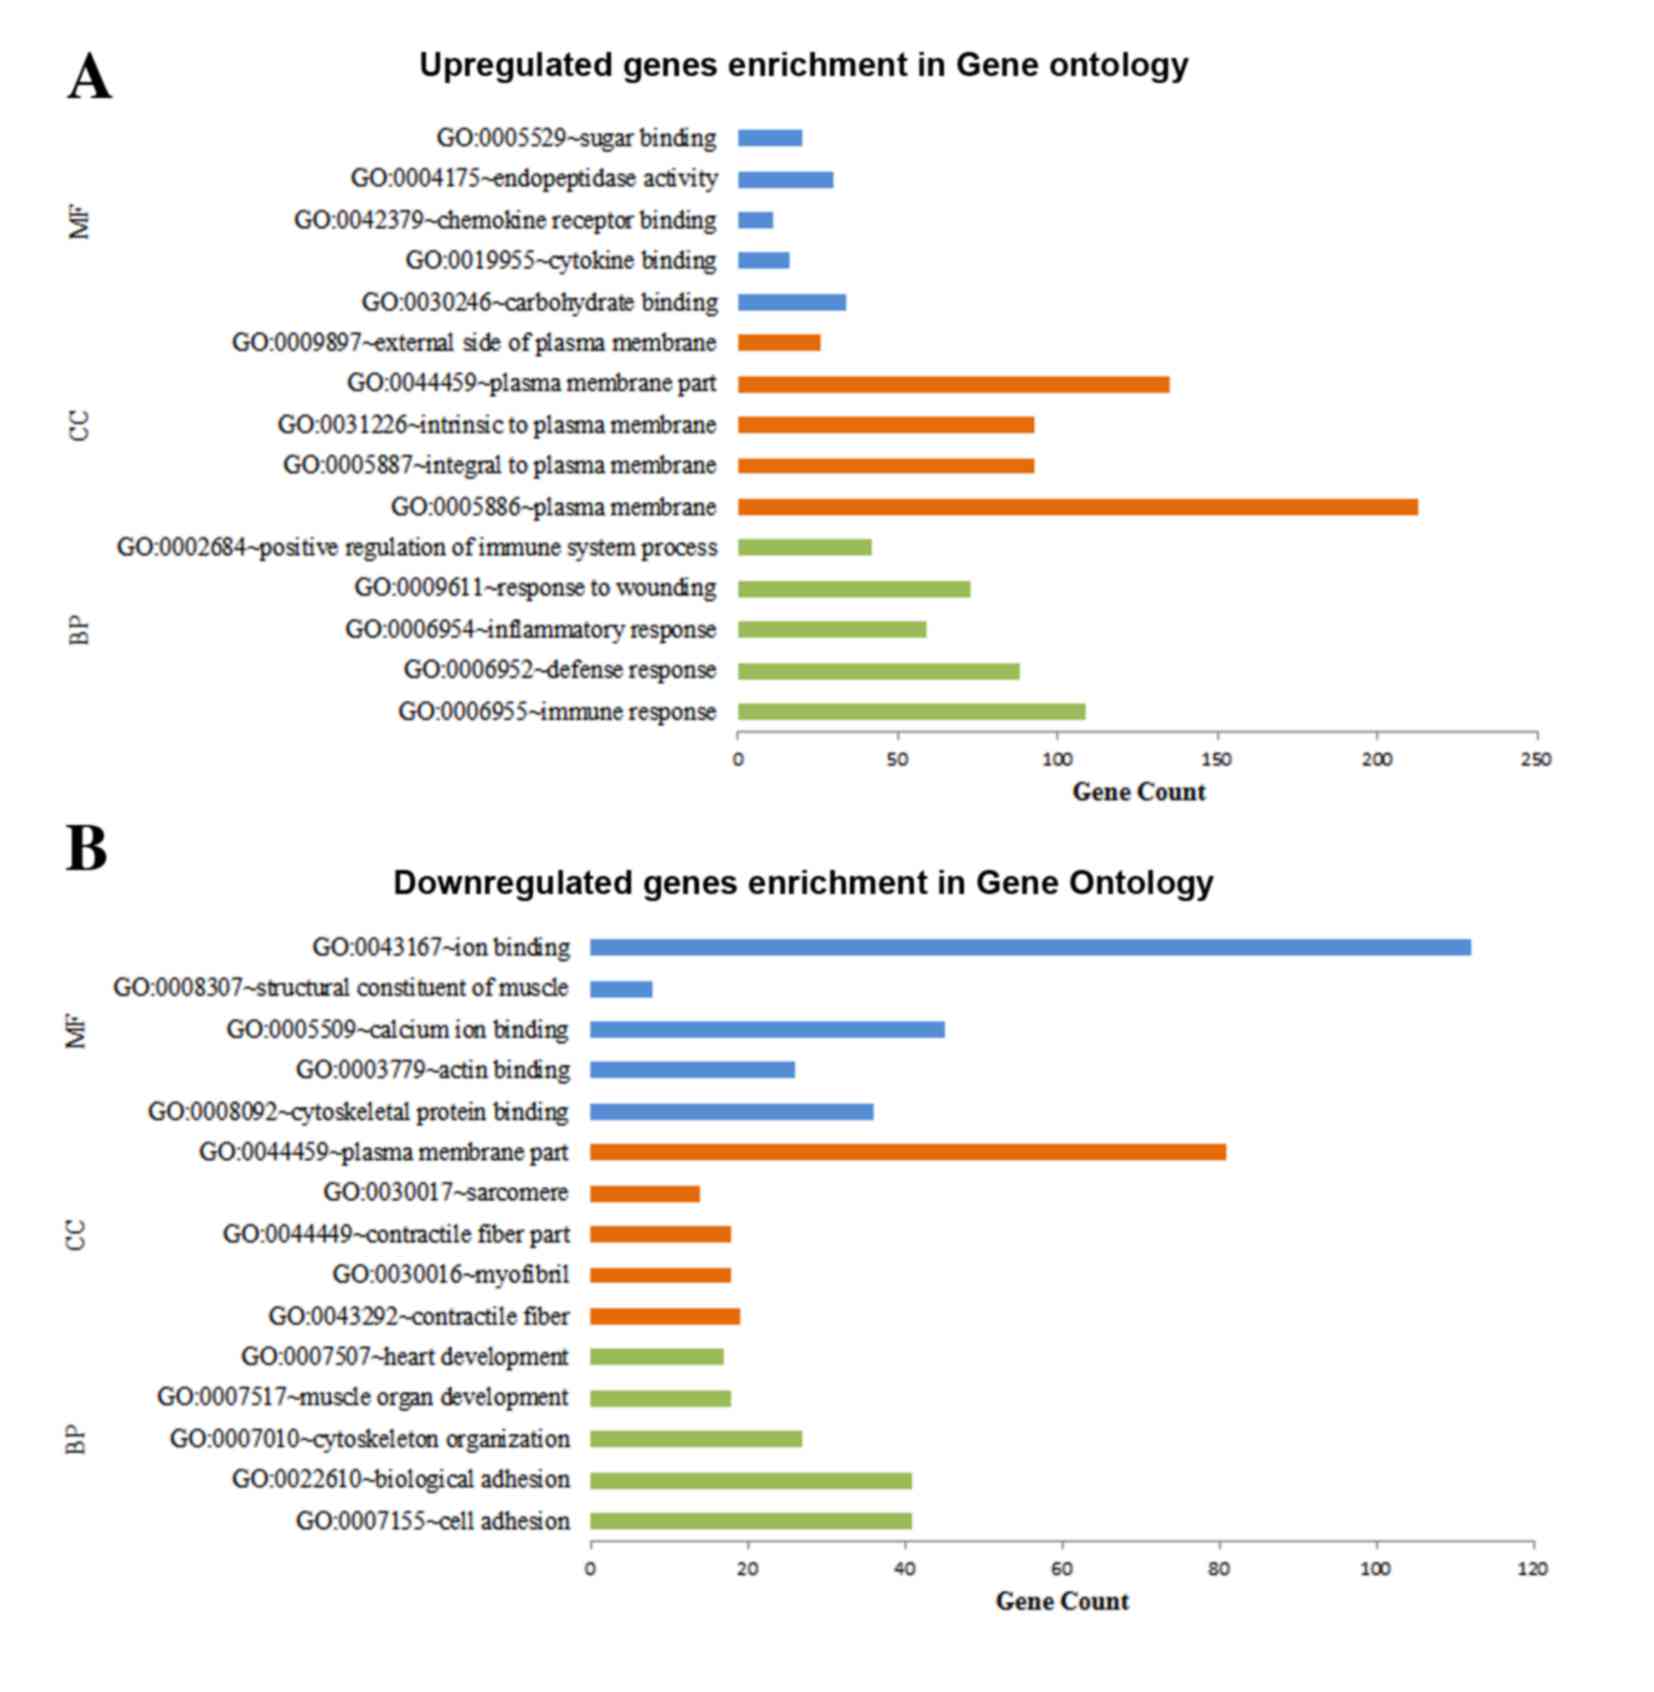
Functional enrichment of DEGs
DAVID was used for predicting the potential
functions of the DEGs by mapping the upregulated and downregulated
genes to GO terms and the KEGG database, respectively. The top five
significant GO terms of the MF, CC and BP categories enriched by
the upregulated and downregulated genes, respectively, are shown in
Fig. 2. The results demonstrated
that the upregulated genes were predominantly associated with MFs,
including carbohydrate binding, CCs, including plasma membrane and
BPs, including immune response (Fig.
2A), whereas the downregulated genes were predominantly
involved in MFs, including ion binding, CCs, including plasma
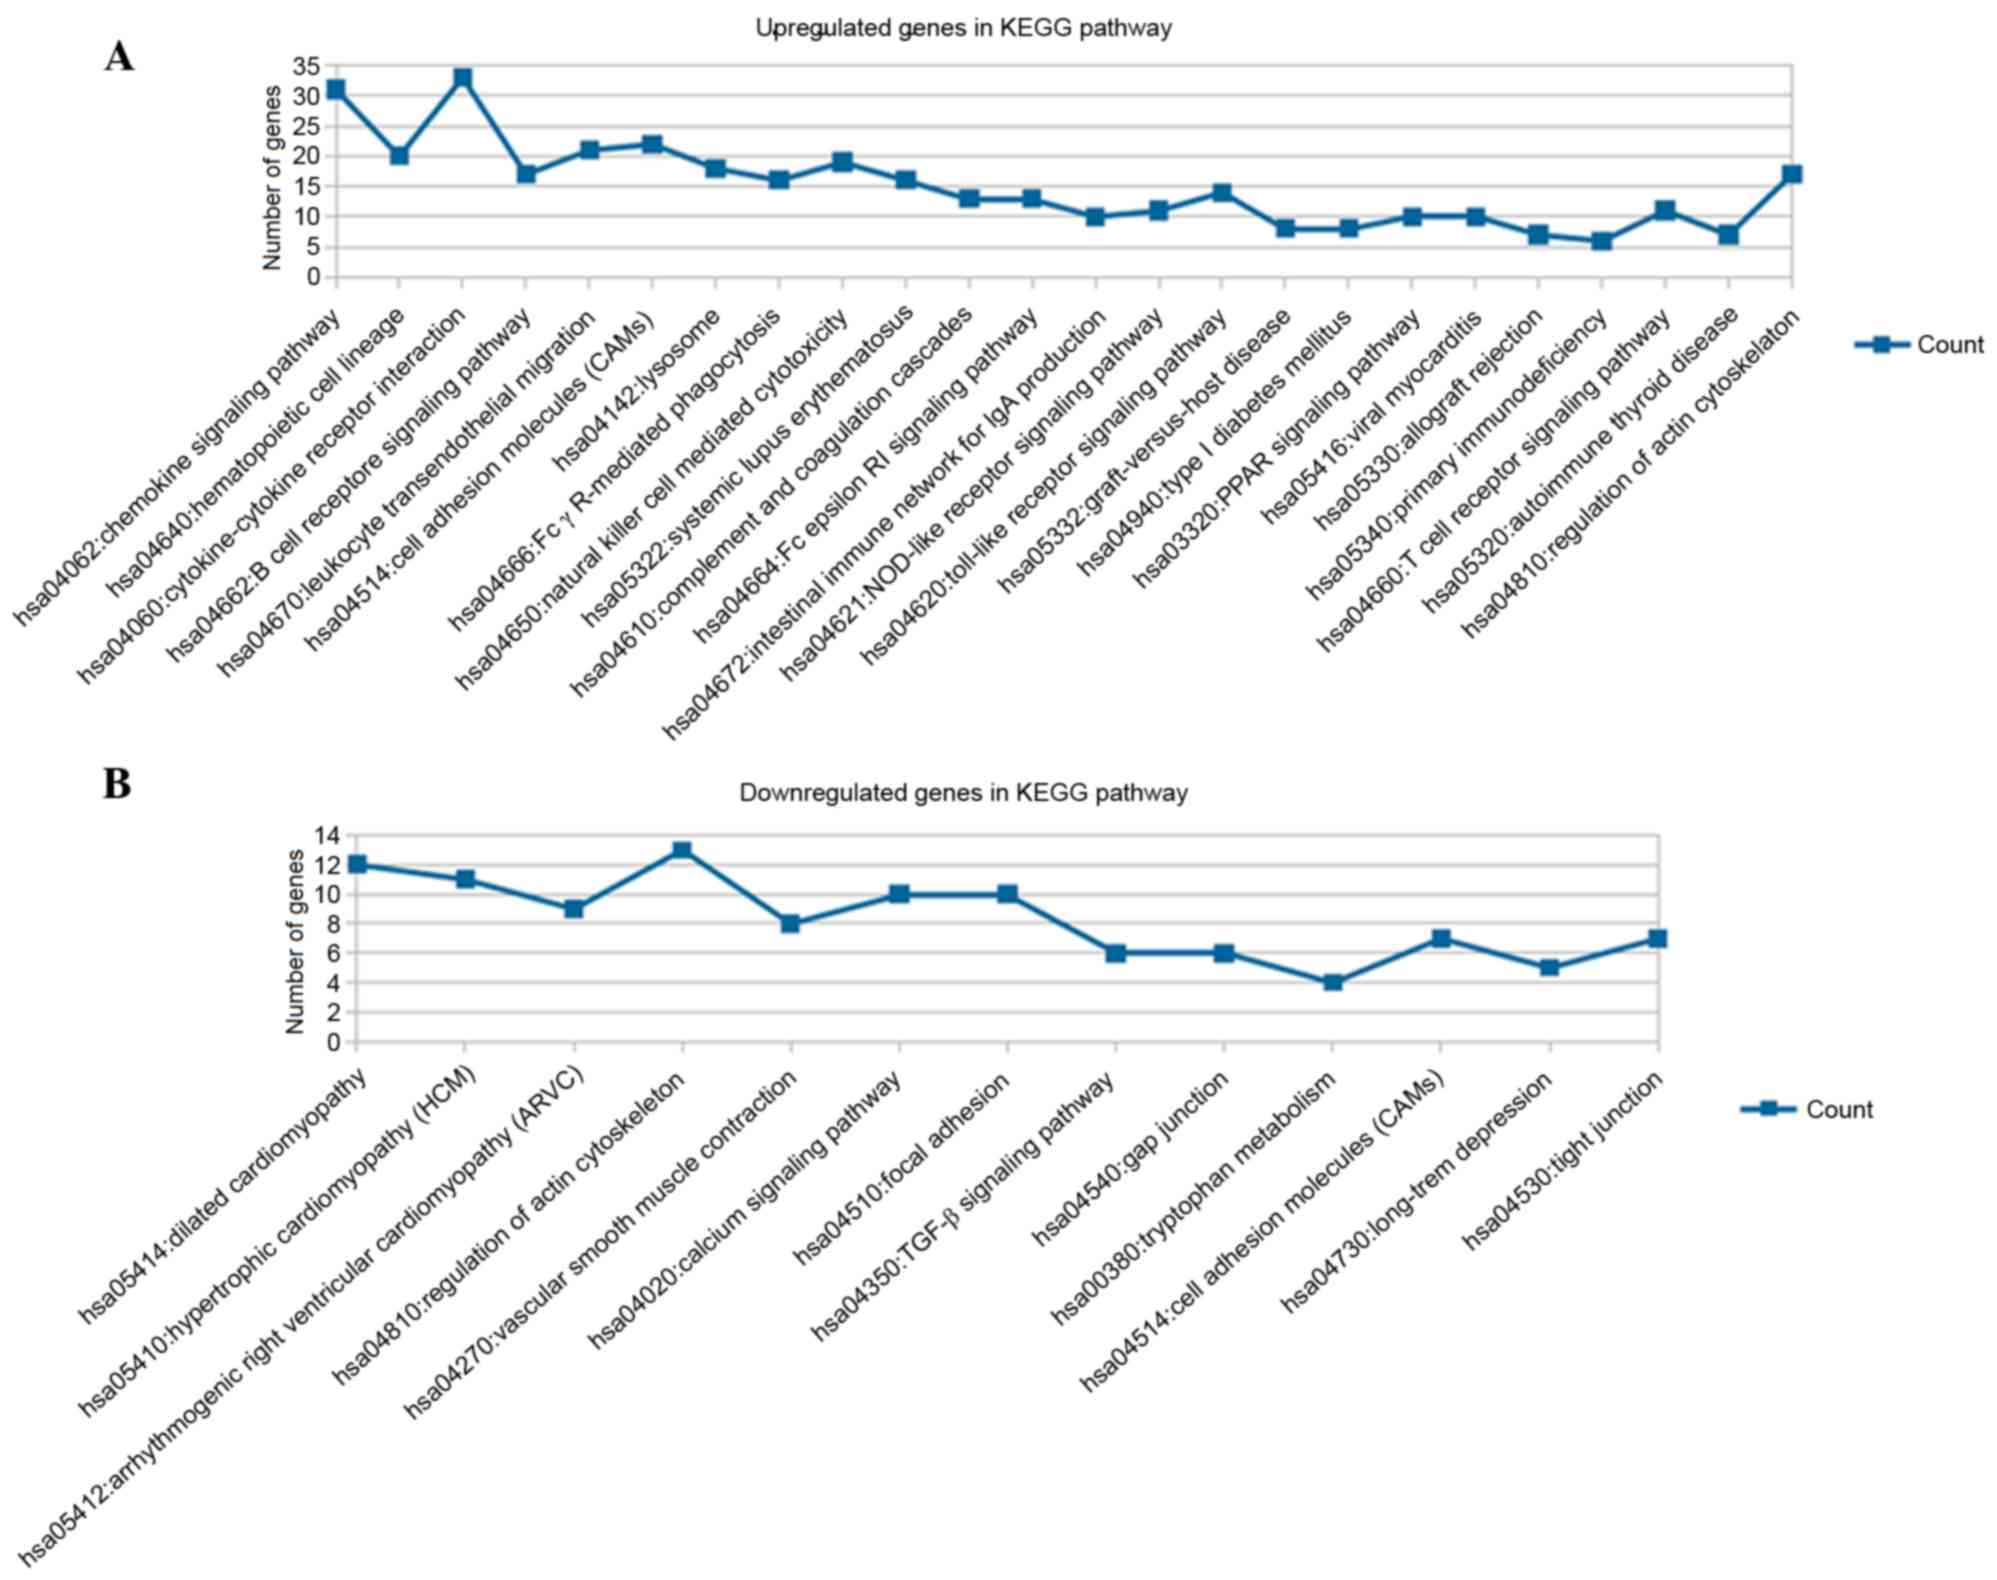
membrane part and BPs, including cell adhesion (Fig. 2B). The results for the KEGG pathway
enrichment are shown in Fig. 3,
which indicated that the upregulated genes were significantly
enriched in 24 pathways, including the chemokine signaling pathway
and cytokine-cytokine receptor interaction (Fig. 3A); whereas the downregulated genes
were predominantly involved in 13 pathways, including dilated
cardiomyopathy and regulation of actin cytoskeleton (Fig. 3B).
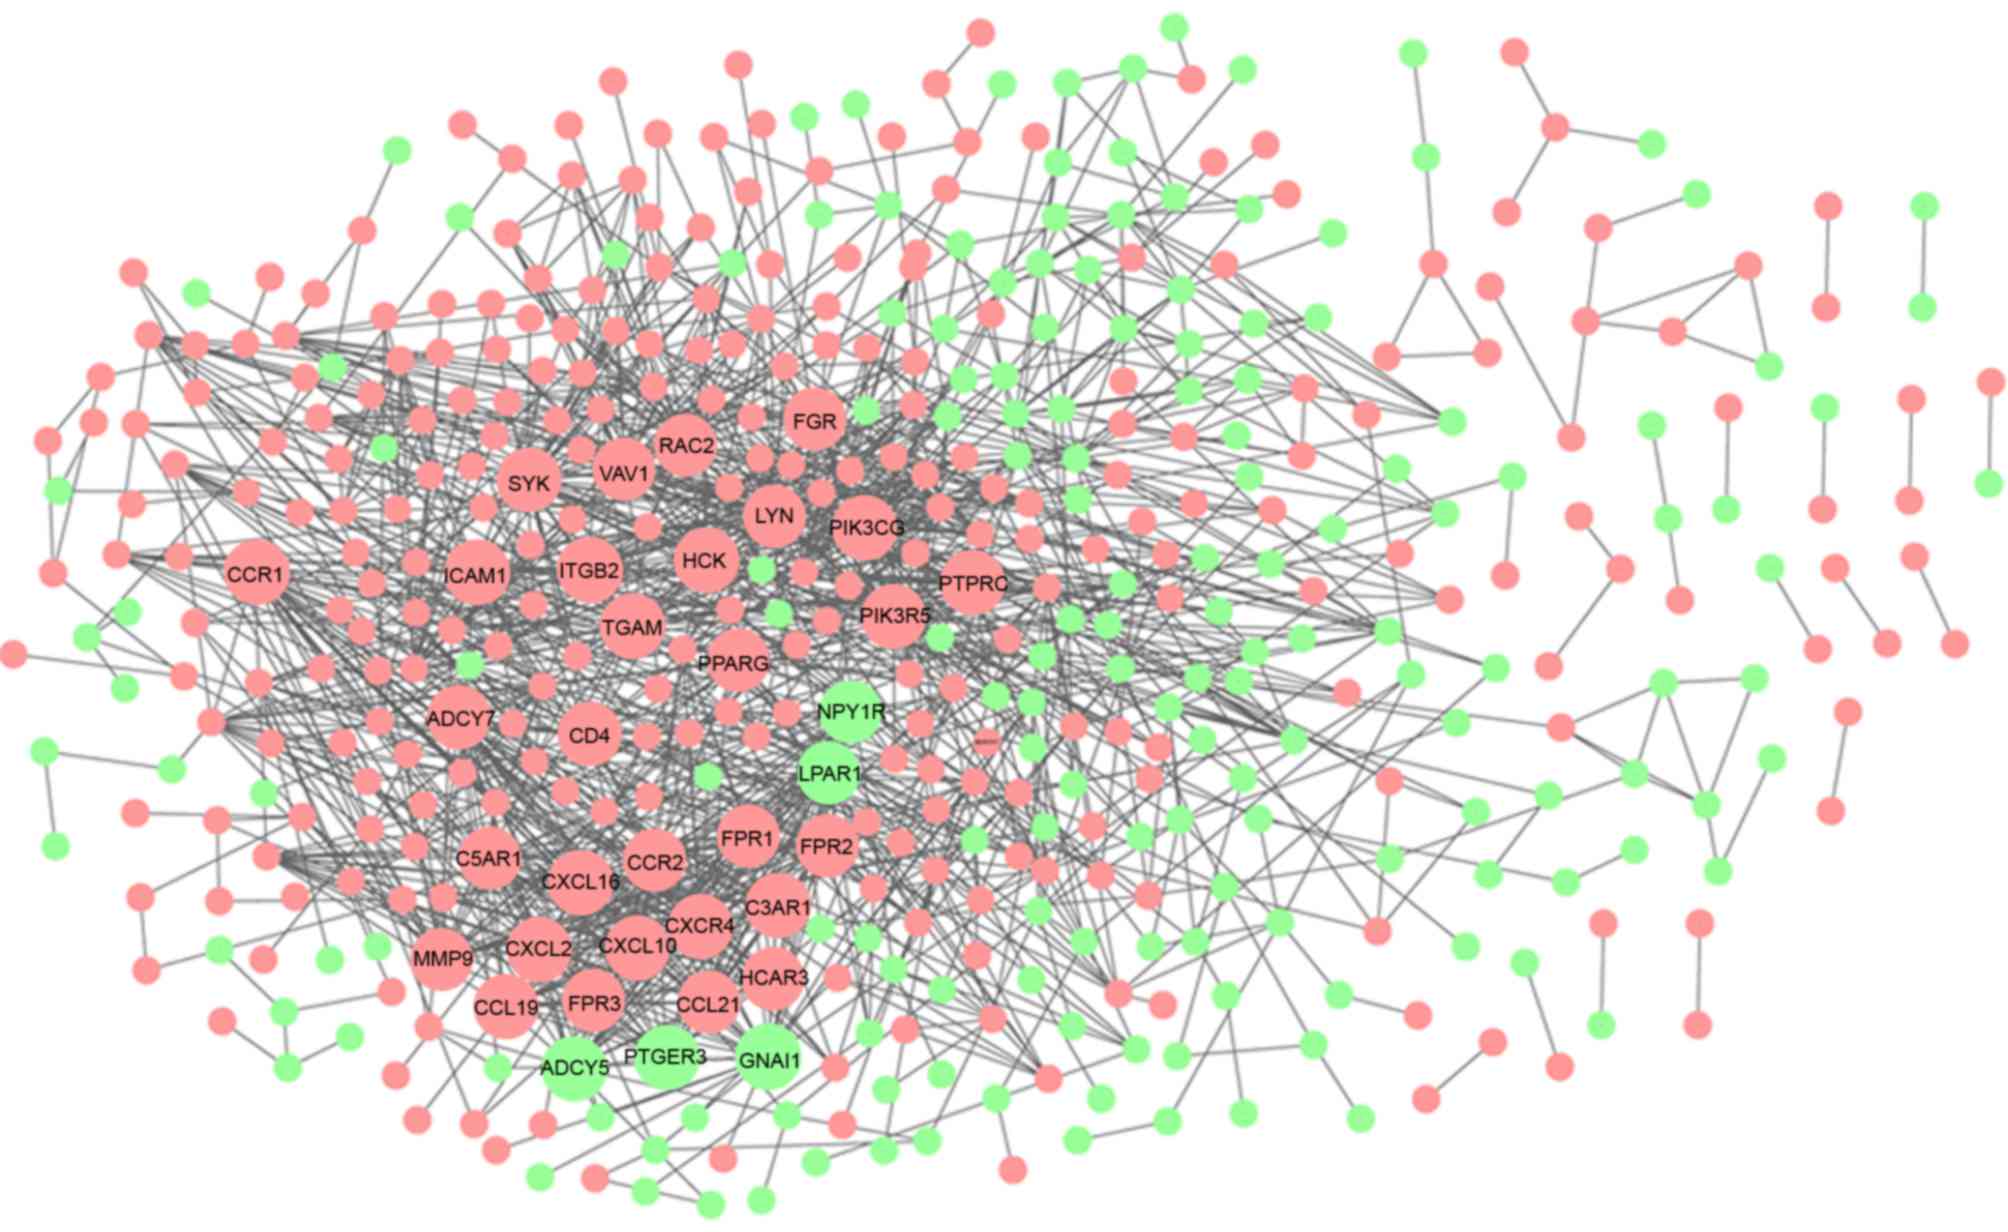
Construction of PPI network and
functional analysis for key genes
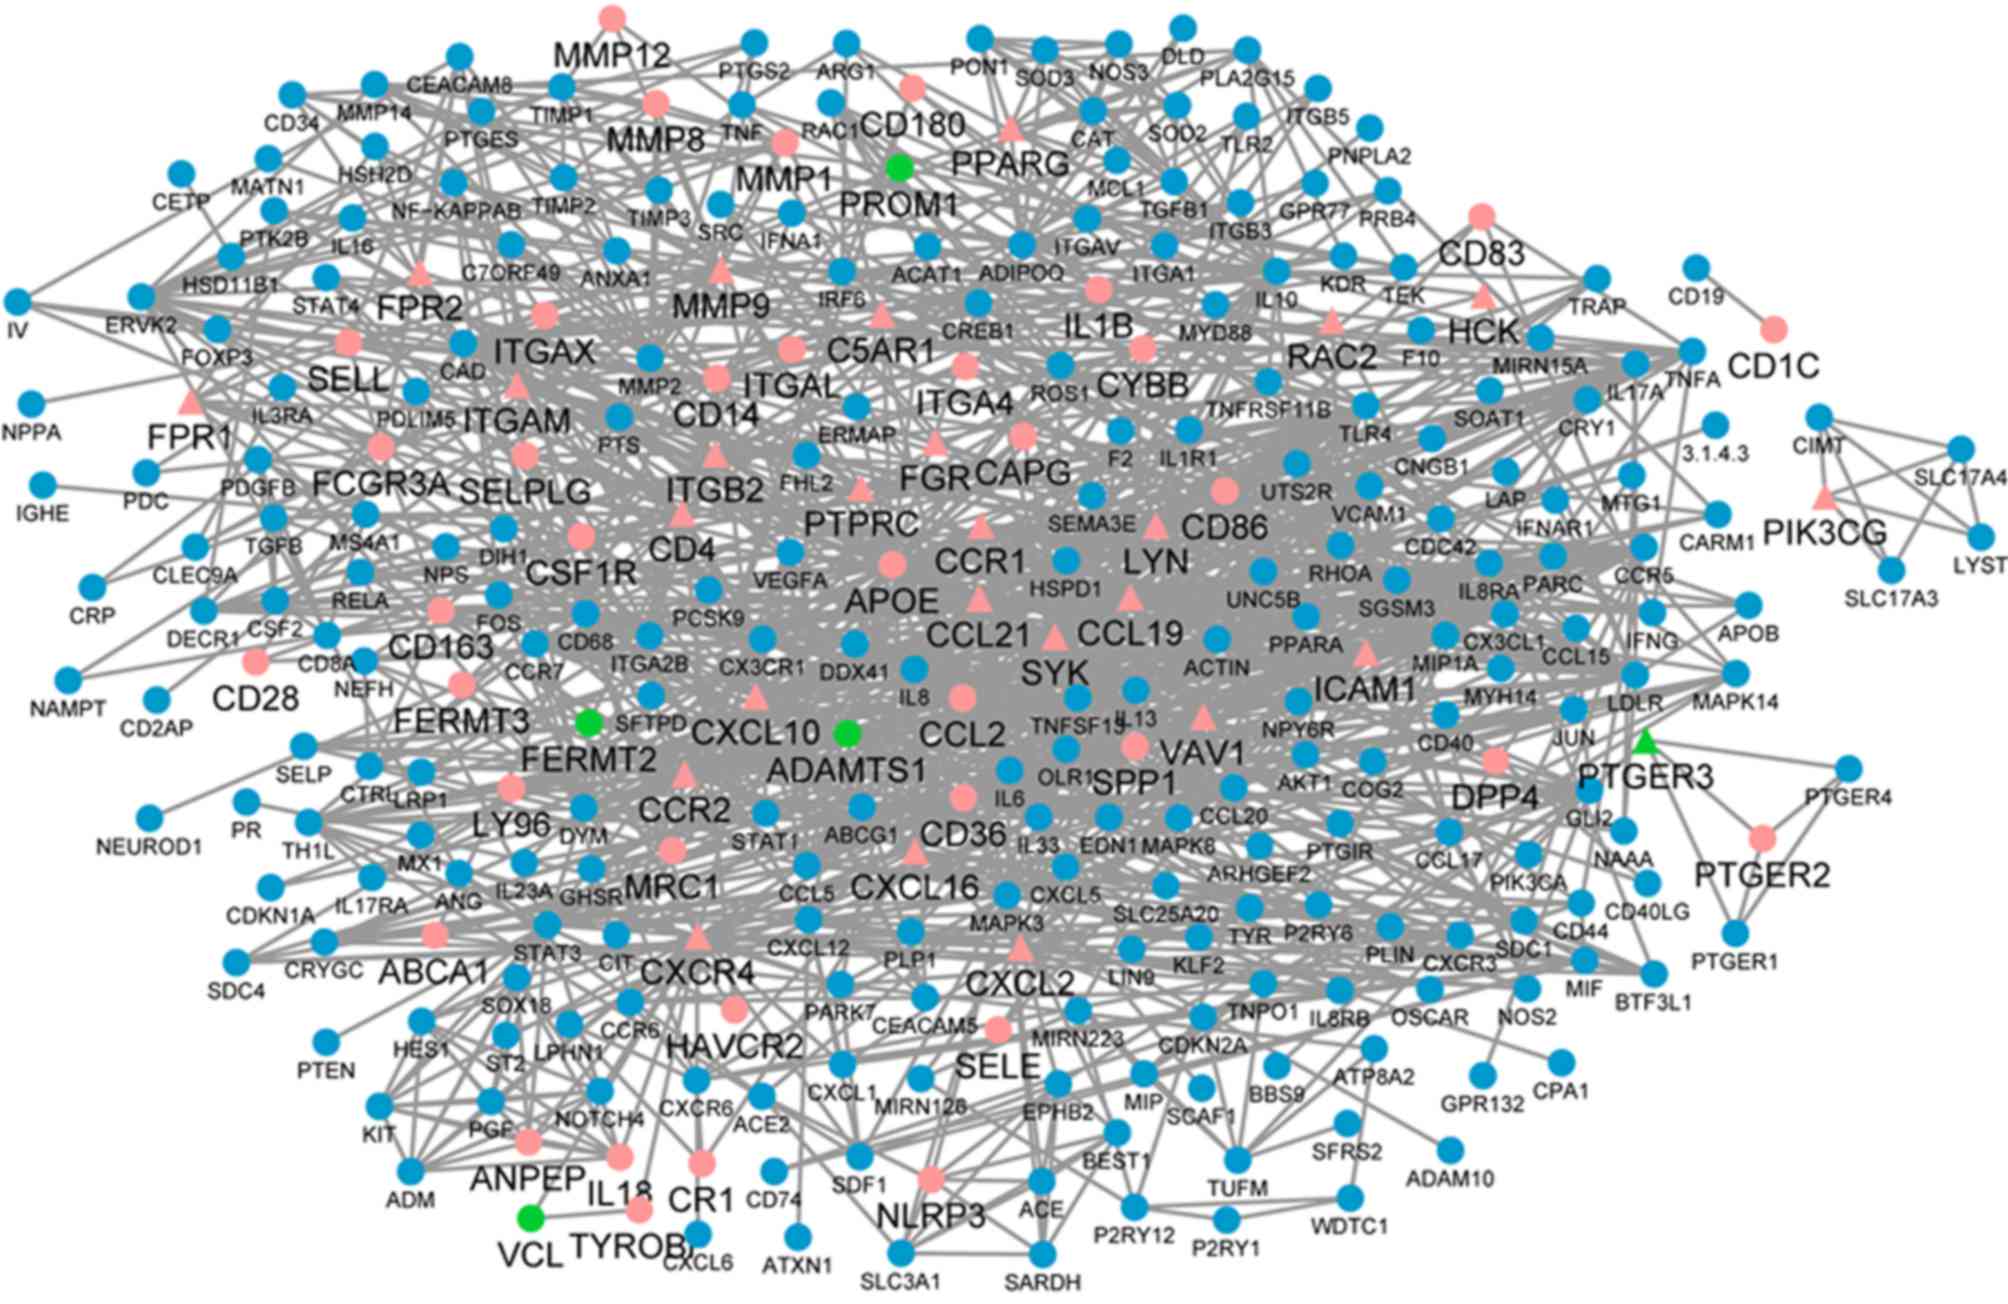
The Cytoscape tool visually constructed the PPI
network with 478 nodes and 1,457 edges, which were predicted using
STRING with a PPI score >0.07 (Fig.
4). In the PPI network, 35 nodes with a degree ≥20 were
regarded as key genes (Table I),
among which only five were downregulated and the others were
upregulated in the carotid atheroma plaque samples, compared with
the macroscopically intact tissue samples adjacent to the atheroma
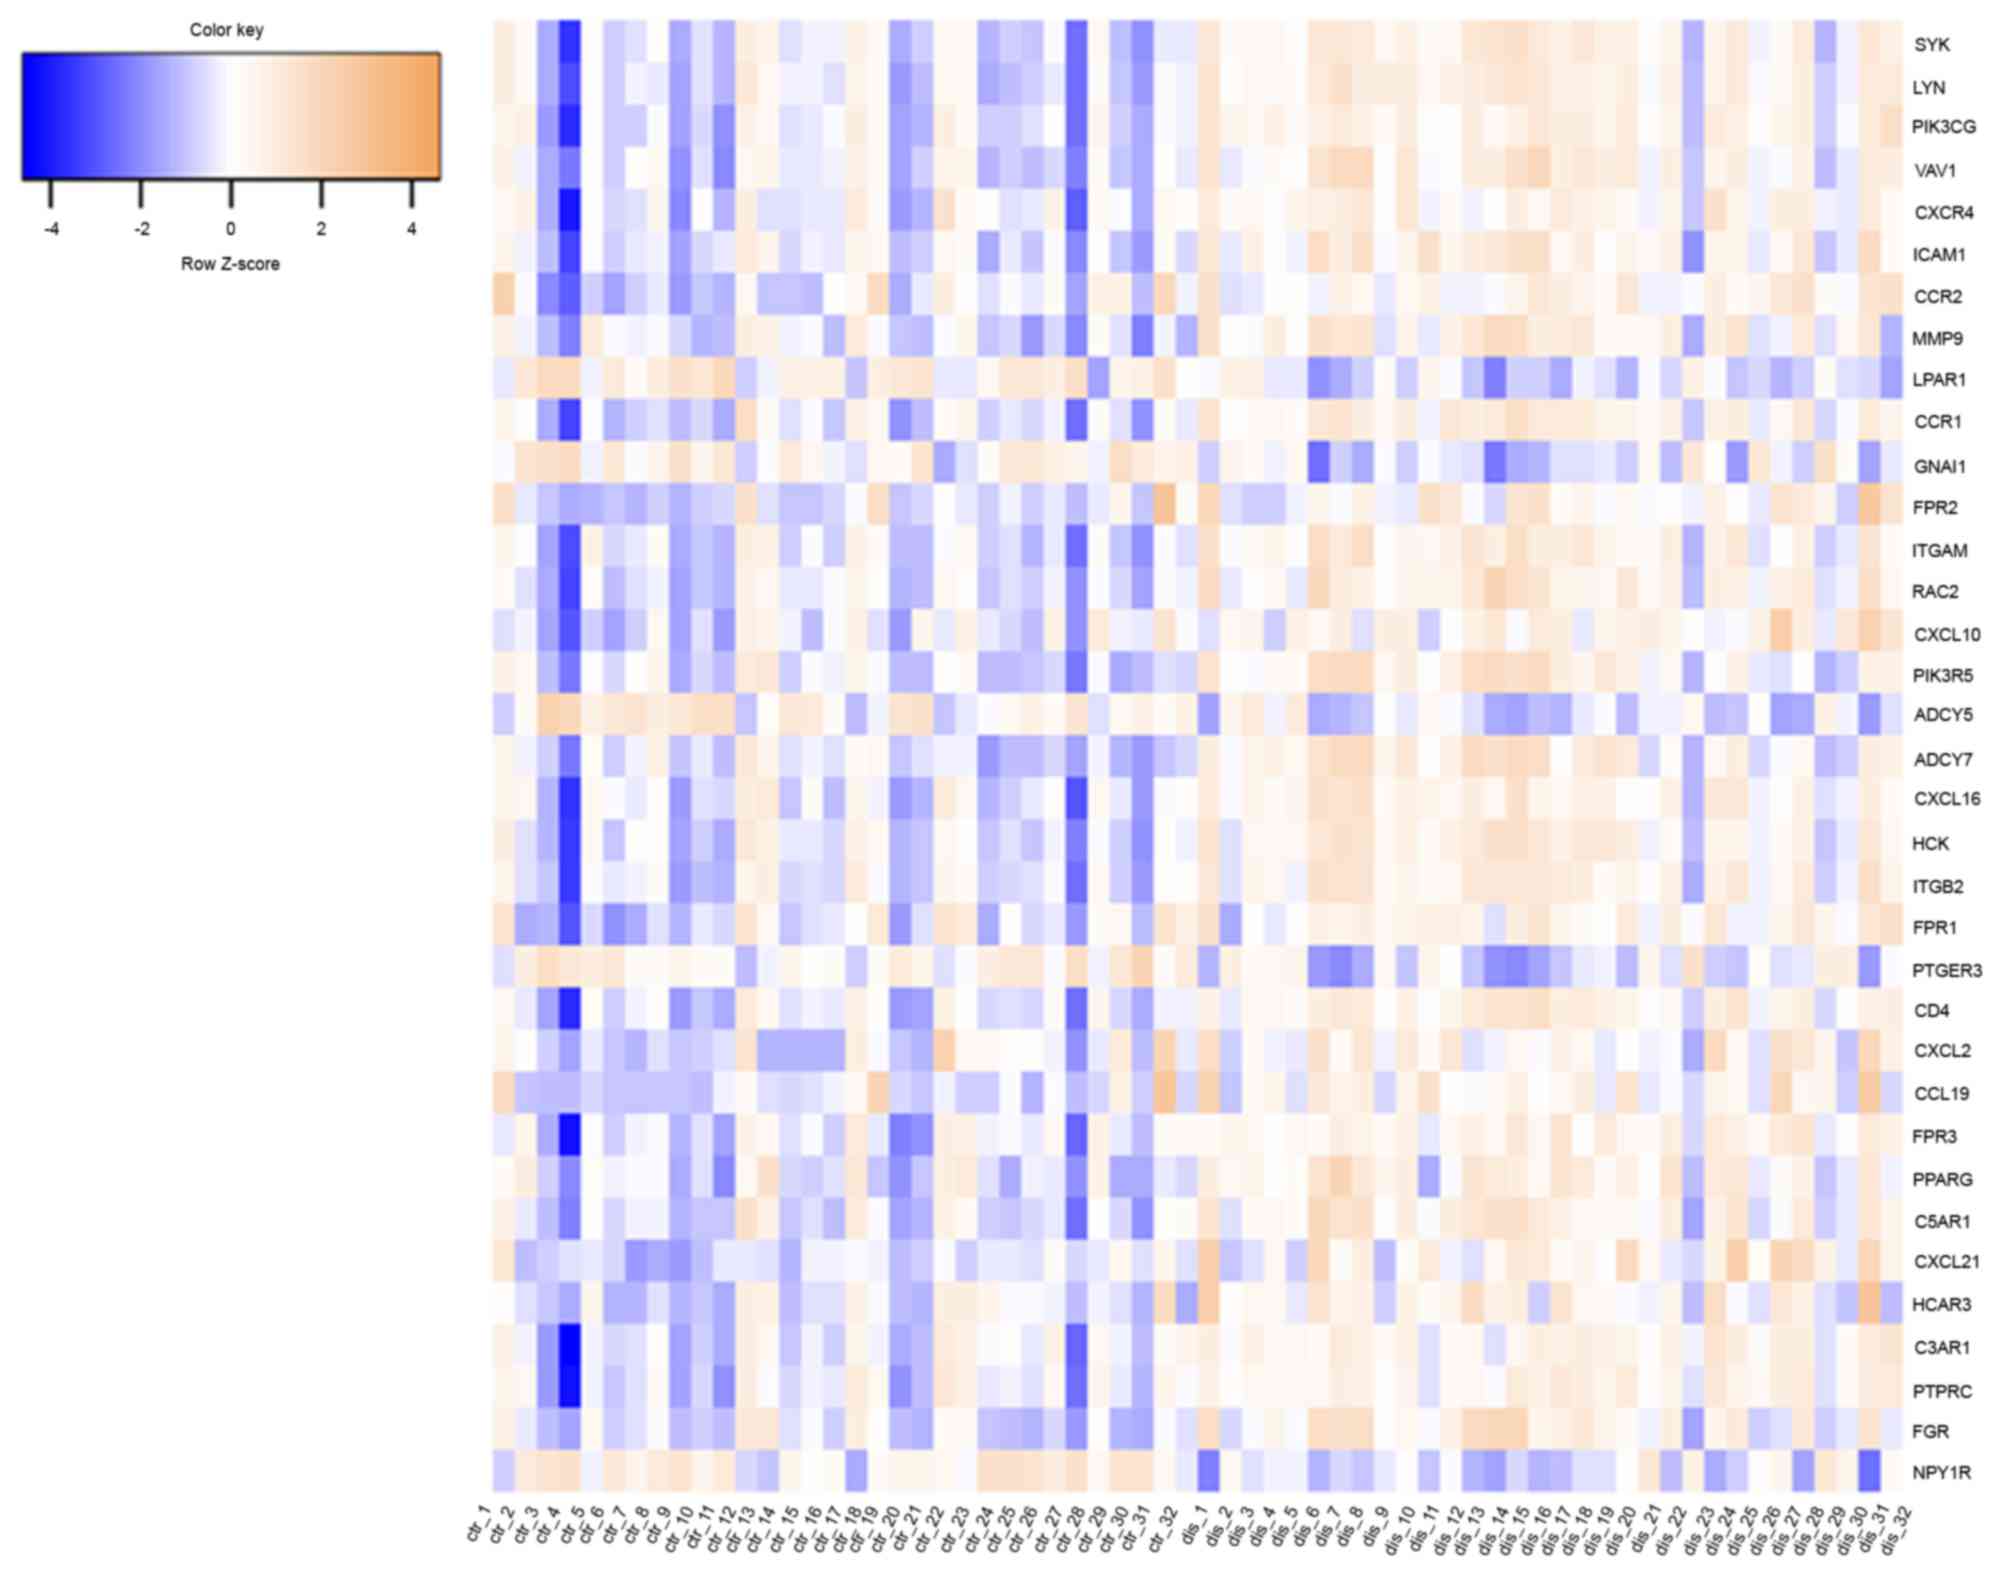
plaque. Of the 35 key nodes, SYK, LYN and PIK3CG were the top three
nodes, with degrees of 43, 43 and 37, respectively. The heat map
indicated that these 35 genes were able to distinguish the two
groups of tissue samples (Fig. 5).
Literature mining using Gene Cluster with Literature Profiles
revealed that these key nodes clustered in biological functions,
which included phospholipase C, map kinase, cytokine production and
inflammatory response (Table II).
The disease network was constructed with 296 nodes and 1,118 edges
associated with the above 35 genes using Agilent Literature Search
software (Fig. 6). Certain genes
in this disease network were the DEGs identified above, indicating
that these genes may be vital in the formation of atheroma
plaques.
 | Table I.Key nodes in the protein-protein
interaction network with degrees ≥20. |
Table I.
Key nodes in the protein-protein
interaction network with degrees ≥20.
| Gene symbol | Degree | Log2
fold-change |
|---|
| SYK | 43 | 0.854037 |
| LYN | 43 | 0.797114 |
| PIK3CG | 37 | 0.721574 |
| VAV1 | 34 | 0.712220 |
| CXCR4 | 33 | 0.728104 |
| ICAM1 | 33 | 0.765050 |
| CCR2 | 32 | 0.671559 |
| MMP9 | 31 | 1.817924 |
| LPAR1 | 31 | −0.648530 |
| CCR1 | 30 | 1.177328 |
| GNAI1 | 28 | −0.624960 |
| FPR2 | 28 | 0.708739 |
| ITGAM | 28 | 0.994177 |
| RAC2 | 27 | 0.871698 |
| CXCL10 | 26 | 1.046254 |
| PIK3R5 | 26 | 0.592723 |
| ADCY5 | 25 | −0.936170 |
| ADCY7 | 25 | 0.611163 |
| CXCL16 | 24 | 0.708373 |
| HCK | 24 | 0.789003 |
| ITGB2 | 24 | 0.967159 |
| FPR1 | 23 | 0.753358 |
| PTGER3 | 23 | −0.600980 |
| CD4 | 23 | 0.926358 |
| CXCL2 | 22 | 0.581285 |
| CCL19 | 21 | 0.908325 |
| FPR3 | 21 | 0.815153 |
| PPARG | 21 | 0.689479 |
| C5AR1 | 21 | 0.829772 |
| CCL21 | 21 | 0.620375 |
| HCAR3 | 20 | 0.580189 |
| C3AR1 | 20 | 0.676339 |
| PTPRC | 20 | 0.782351 |
| FGR | 20 | 0.767073 |
| NPY1R | 20 | −1.286510 |
| Table II.Functional enrichment of key nodes in
the protein-protein interaction network. |
Table II.
Functional enrichment of key nodes in
the protein-protein interaction network.
| Key word | Hits (n) | P-value | Genes |
|---|
| #cluster1 |
| Enrichment score:
48.42 |
|
PHOSPHOLIPASE C | 19 | 7.09E-47 | C5AR1, CCR1, CD4,
CXCR4, FGR, FPR1, FPR2, ICAM1, ITGAM, ITGB2, LPAR1, LYN, MMP9,
PIK3CG, PTGER3, PTPRC, RAC2, SYK, VAV1 |
| MAP
KINASE | 20 | 2.08E-51 | C5AR1, CD4, CXCL10,
CXCL2, CXCR4, FGR, FPR1, FPR2, ICAM1, ITGAM, ITGB2, LPAR1, LYN,
MMP9, PIK3CG, PPARG, PTPRC, RAC2, SYK, VAV1 |
| #cluster2 |
| Enrichment score:
47.48 |
|
CYTOKINE PRODUCTION | 23 | 9.57E-76 | C3AR1, C5AR1,
CCL19, CCL21, CCR1, CCR2, CD4, CXCL10, CXCL16, CXCL2, CXCR4, FPR1,
ICAM1, ITGAM, ITGB2, LYN, MMP9, PIK3CG, PPARG, PTGER3, PTPRC, SYK,
VAV1 |
|
INFLAMMATORY RESPONSE | 24 | 2.28E-38 | C3AR1, C5AR1,
CCL19, CCL21, CCR1, CCR2, CD4, CXCL10, CXCL16, CXCL2, CXCR4, FPR1,
FPR2, ICAM1, ITGAM, ITGB2, LYN, MMP9, PIK3CG, PPARG, PTGER3, PTPRC,
RAC2, SYK |
| TUMOR
NECROSIS FACTOR | 25 | 1.68E-30 | C3AR1, C5AR1,
CCL19, CCL21, CCR1, CCR2, CD4, CXCL10, CXCL16, CXCL2, CXCR4, FGR,
FPR1, FPR2, HCK, ICAM1, ITGAM, ITGB2, LYN, MMP9, PIK3CG, PPARG,
PTGER3, PTPRC, SYK |
| #cluster3 |
| Enrichment score:
41.88 |
| CELL
ADHESION | 24 | 5.81E-23 | C5AR1, CCL19,
CCL21, CCR1, CCR2, CD4, CXCL10, CXCL16, CXCL2, CXCR4, FPR1, FPR2,
HCK, ICAM1, ITGAM, ITGB2, LYN, MMP9, PIK3CG, PPARG, PTPRC, RAC2,
SYK, VAV1 |
| CELL
ACTIVATION | 26 | 2.95E-62 | C3AR1, C5AR1,
CCL19, CCL21, CCR1, CCR2, CD4, CXCL10, CXCL16, CXCL2, CXCR4, FGR,
FPR1, FPR2, HCK, ICAM1, ITGAM, ITGB2, LYN, MMP9, PIK3CG, PPARG,
PTPRC, RAC2, SYK, VAV1 |
| #cluster4 |
| Enrichment score:
37.67 |
| C REACTIVE
PROTEIN | 13 | 7.87E-13 | C5AR1, CCR2, CD4,
CXCL10, CXCL16, CXCL2, FPR1, ICAM1, ITGAM, ITGB2, MMP9, PPARG,
PTPRC |
| TUMOR
NECROSIS FACTOR | 16 | 1.57E-48 | C5AR1, CCR2, CD4,
CXCL10, CXCL16, CXCL2, CXCR4, FGR, FPR1, ICAM1, ITGAM, ITGB2, MMP9,
PIK3CG, PPARG, PTPRC |
| HUMAN
UMBILICAL VEIN | 17 | 7.91E-54 | C5AR1, CCR2, CD4,
CXCL10, CXCL16, CXCL2, CXCR4, FPR1, FPR2, ICAM1, ITGAM, ITGB2,
LPAR1, MMP9, PIK3CG, PPARG, PTPRC |
| #cluster5 |
| Enrichment score:
32.27 |
|
MONOCYTE | 18 | 8.99E-24 | C5AR1, CCL19,
CCL21, CCR1, CCR2, CD4, |
|
CHEMOATTRACTANT |
|
| CXCL10, CXCL16,
CXCL2, CXCR4, FPR1, ICAM1, |
|
PROTEIN |
|
| ITGAM, ITGB2, MMP9,
PIK3CG, PPARG, PTPRC |
|
MACROPHAGE | 18 | 2.13E-26 | C5AR1, CCL19,
CCL21, CCR1, CCR2, CD4, |
|
INFLAMMATORY |
|
| CXCL10, CXCL16,
CXCL2, CXCR4, FPR1, ICAM1, |
|
PROTEIN |
|
| ITGAM, ITGB2, MMP9,
PIK3CG, PPARG, PTPRC |
| CENTRAL
NERVOUS | 19 | 1.87E-11 | ADCY5, C3AR1,
C5AR1, CCL19, CCL21, CCR1, CCR2, |
|
SYSTEM |
|
| CD4, CXCL10, CXCL2,
CXCR4, FPR1, ICAM1, ITGAM, ITGB2, MMP9, PIK3CG, PPARG, PTPRC |
| CELL
ADHESION MOLECULE | 20 | 6.56E-45 | C5AR1, CCL19,
CCL21, CCR1, CCR2, CD4, CXCL10, CXCL16, CXCL2, CXCR4, FPR1, ICAM1,
ITGAM, ITGB2, MMP9, PIK3CG, PPARG, PTPRC, RAC2, SYK |
|
TOLL-LIKE RECEPTOR | 21 | 1.87E-58 | C5AR1, CCL19,
CCL21, CCR1, CCR2, CD4, CXCL10, CXCL16, CXCL2, CXCR4, FPR1, FPR2,
ICAM1, ITGAM, ITGB2, LYN, MMP9, PIK3CG, PPARG, PTPRC, SYK |
| #cluster6 |
| Enrichment score:
28.75 |
| MITOGEN
ACTIVATED PROTEIN | 27 | 4.90E-39 | C3AR1, C5AR1,
CCL19, CCL21, CCR1, CCR2, CD4, CXCL10, CXCL2, CXCR4, FGR, FPR1,
FPR2, HCK, ICAM1, ITGAM, ITGB2, LPAR1, LYN, MMP9, PIK3CG, PPARG,
PTGER3, PTPRC, RAC2, SYK, VAV1, |
| SIGNAL
TRANSDUCTION | 28 | 6.54E-20 | C3AR1, C5AR1,
CCL19, CCL21, CCR1, CCR2, CD4, CXCL10, CXCL16, CXCL2, CXCR4, FGR,
FPR1, FPR2, HCK, ICAM1, ITGAM, ITGB2, LPAR1, LYN, MMP9, PIK3CG,
PPARG, PTGER3, PTPRC, RAC2, SYK, VAV1 |
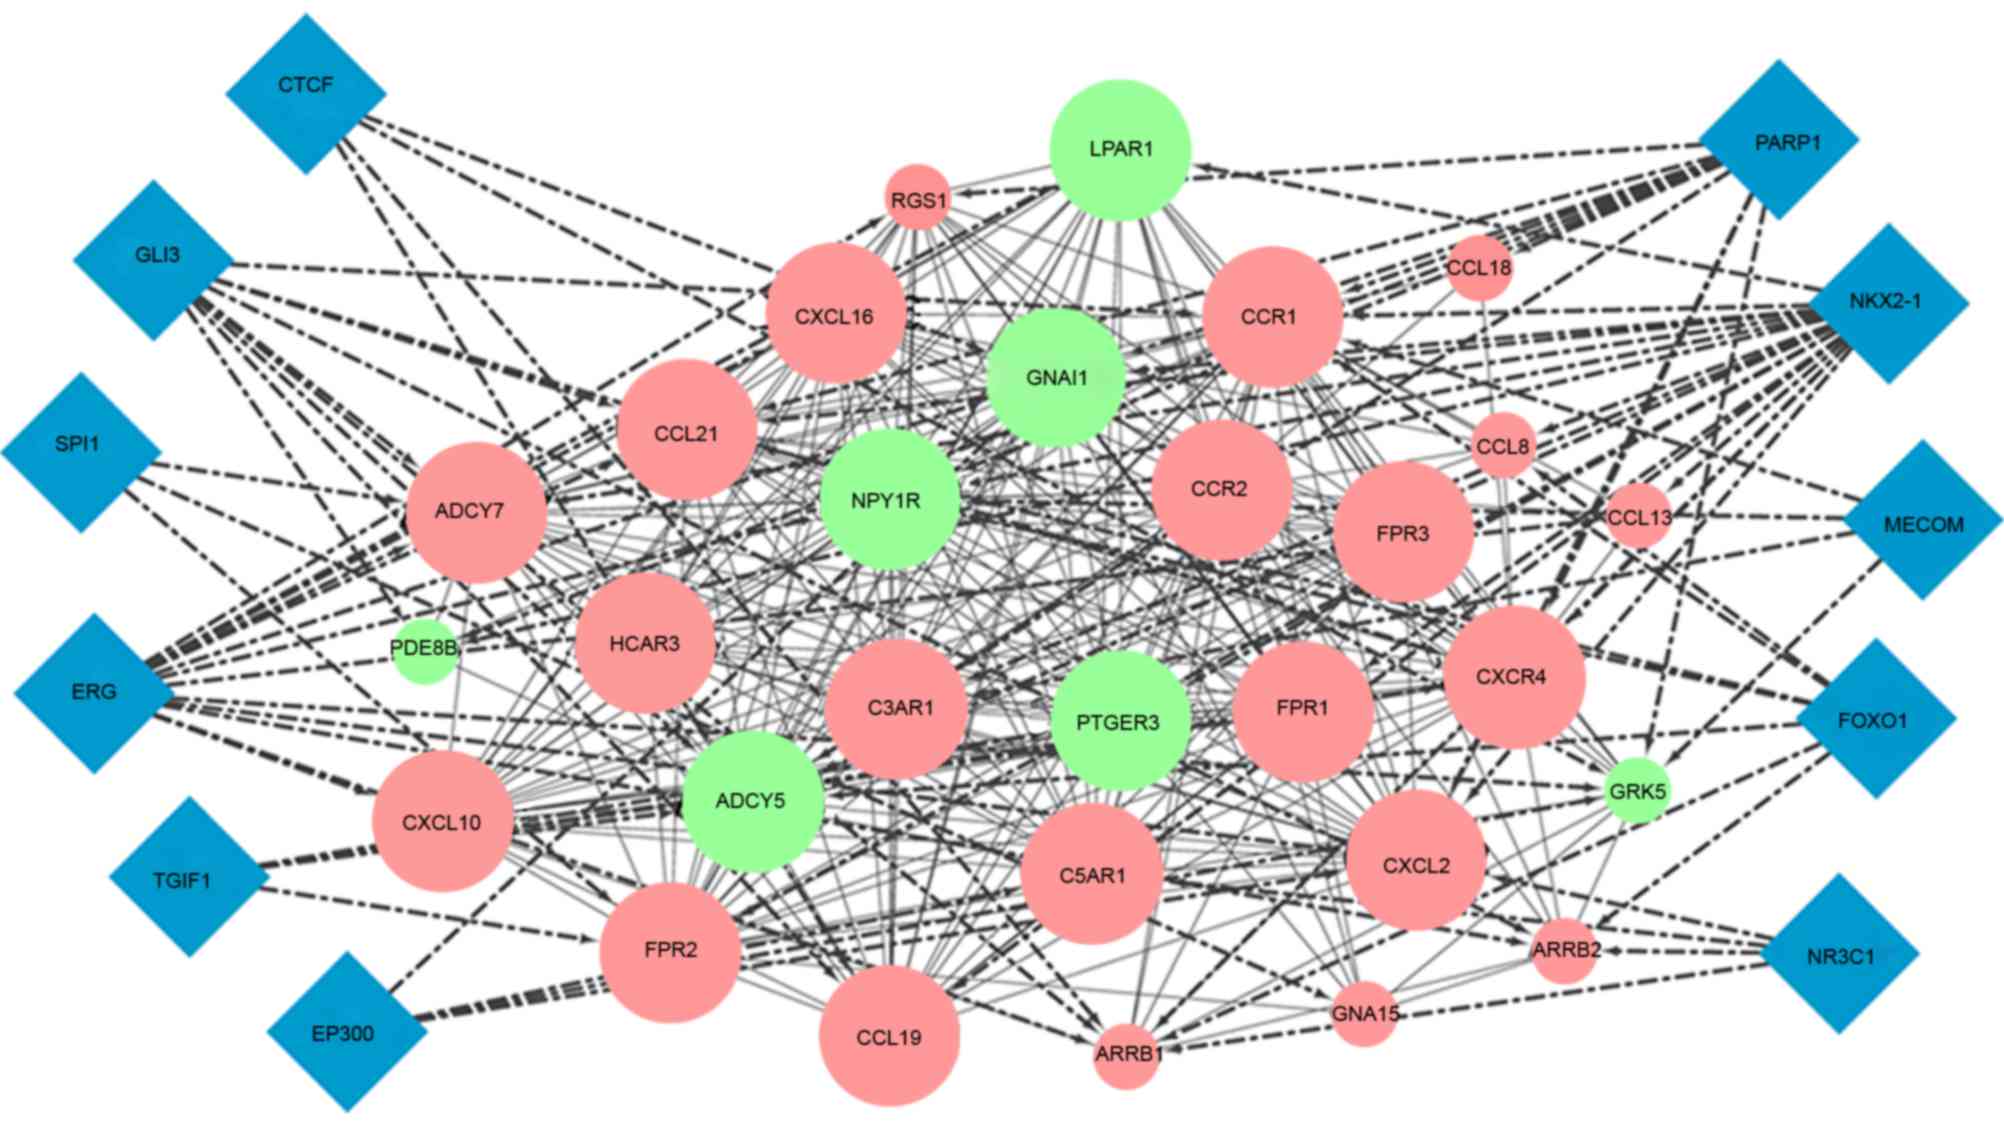
Module analysis
In the PPI network, one module was mined using
ClusterOne software with a threshold <4e-4. A total of 29 DEGs,
including 22 upregulated and seven downregulated genes, were used
to construct this module and 11 TFs were predicted to target these
genes by iRegulon (Fig. 7). The
KEGG pathway enrichment showed that genes in this module were
predominantly involved in the chemokine signaling pathway and
cytokine-cytokine receptor interaction (Table III).
| Table III.Kyoto Encyclopedia of Genes and
Genomes pathway enrichment of genes in the significant module. |
Table III.
Kyoto Encyclopedia of Genes and
Genomes pathway enrichment of genes in the significant module.
| Term | n | P-value | Genes |
|---|
| hsa04062: Chemokine
signaling pathway | 17 | 2.23E-17 | ADCY7, GNAI1,
ADCY5, CCR1, CXCL2, CCL19, CCL8, CCL18, CXCL10, CCL13, ARRB2,
CXCR4, ARRB1, CCL21, CXCL16, CCR2, GRK5 |
| hsa04060:
Cytokine-cytokine receptor interaction | 11 | 2.84E-07 | CCL13, CCL21,
CXCR4, CCR1, CXCL16, CXCL2, CCR2, CCL8, CCL19, CCL18, CXCL10 |
| hsa04080:
Neuroactive ligand-receptor interaction | 8 | 2.18E-04 | C3AR1, C5AR1,
PTGER3, FPR1, FPR3, FPR2, NPY1R, LPAR1 |
| hsa04540: Gap
junction | 4 | 0.010074 | ADCY7, GNAI1,
ADCY5, LPAR1 |
Discussion
Strokes are one of the leading causes of mortality
and long-time disability in the majority of countries worldwide
(19). Generally, a stroke is
caused by an embolus or thrombus arising from a ruptured carotid
atheromatous plaque or, more rarely, results from hemodynamic
changes induced by the considerable contraction of the carotid
lumen (20). Strokes are described
as being avoidable, however, a major challenge is identifying
efficient markers to detect patients who are at risk of stroke. The
present study aimed to investigate gene markers for predicting the
formation of atheroma plaques by applying high throughput
bioinformatics methods for comprehensive analyses of gene
expression data from 32 paired samples of carotid atheroma plaque
and macroscopically intact tissue adjacent to the atheroma plaque.
A total of 886 DEGs, including 513 upregulated and 373
downregulated genes, were identified. This set of upregulated genes
were predicted to be significantly involved in BPs, including
carbohydrate binding and immune response, and were involved in 24
pathways. The downregulated genes were predominantly involved in
ion binding and cell adhesion via 13 potential pathways. The PPI
network constructed using these DEGs revealed 35 key nodes and one
significant module. These results provided novel insight and
valuable information for improving understanding the pathogenesis
of carotid atheroma. Notably, key nodes in the PPI network and
genes in the significant modules, including SYK, LYN and
PIK3CG, are promising for the prediction of carotid atheroma
plaque formation.
SYKis a 72 kDa non-receptor tyrosine kinase and its
highest level expressed is in hematopoietic cells. SYK contains
three functional domains, including two SRC homology 2 domains and
a kinase domain (BOX 1). Investigations have focused on SYK as it
is a potential therapeutic target in chronic inflammatory diseases,
particularly in rheumatoid arthritis and asthma (21). Apoptotic cell accumulation is a
major feature of advanced human atherosclerotic lesions and is
associated with increased susceptibility to thrombotic plaque
complications (22). A previous
study reported that defective tyrosine kinase signaling in bone
marrow cells may lead to the accumulation of apoptotic cells within
atherosclerotic lesions, increase the proinflammatory immune
response and accelerate atherosclerosis (23). As a tyrosine kinase, SYK has also
been found to be correlated with atherogenesis. Choi et al
(24) demonstrated that macrophage
responses mediated by SYK may contribute to chronic inflammation in
atherosclerosis in humans. Atherosclerotic lesions in low density
lipoprotein-deficient mice, were examined following treatment with
an SYK inhibitor, and were found to contain fewer macrophages, but
more smooth muscle cells and collagen, which are features of more
stable plaques in humans (25).
The SYK inhibitor, fostamatinib was identified as a potentially
beneficial therapeutic strategy for patients with atherosclerosis
as it was reported to reduce atherosclerotic lesion size by up to
59.6% in mice (25). In the
present study, the expression of SYK was found to be upregulated in
the carotid atheroma plaque samples, compared with macroscopically
intact tissue samples from the same hypertensive patient.
Functional enrichment analysis revealed that SYK was associated
with positive regulation of the immune system process and leukocyte
activation, which was in accordance with the previous studies. Of
note, SYK was characterized with the highest degree in the PPI
network constructed of DEGs between the two sets of samples. Thus,
it was hypothesized that SYK is a key factor in the process of
carotid atherosclerosis and promising in the prediction of plaque
formation.
LYN, also known as FYN, is a 59 kDa protein located
on chromosome 6q21. LYN is also a member of the Src family of
non-receptor tyrosine kinases. LYN is identified as a convergence
point of several signaling pathways, and is vital in a number of
BPs, including regulating cell cycle entry, growth, proliferation
and cell-cell adhesion (26).
Using complementary inhibition strategies, Toubiana et al
(27) showed that LYN may be
involved in nuclear factor (NF)-κB activation in human cellular
models. Monocyte chemoattractant protein-1, as an inflammatory
marker increased with arteriosclerosis, was found to be
downregulated by inhibiting the activation of NF-κB, which is the
vascular protective mechanism underlying the antihypertensive
action of nifedipine (28). In the
present study, LYN was found to be differentially expressed
in the carotid atheroma plaque samples and macroscopically intact
tissue samples adjacent to the atheroma plaque from the same
hypertensive patient, and as a key nodes in the PPI network
constructed with using DEGs between these two groups. Therefore,
this gene may be an essential marker in predicting plaque formation
within the carotid artery.
PIK3CG encodes an enzyme, which can
phosphorylate phosphoinositides. Single nucleotide polymorphisms
(SNPs) close to or within PIK3CG have been shown to have
important clinical significance. For example, the rs342286 SNP,
located 140 kb upstream of the PIK3CG gene, may be associated with
increased platelet aggregation and acute coronary syndromes
(29). A genome-wide association
study by Wain et al (30)
on pulse pressure and mean arterial pressure demonstrated 7q22.3
close to PIK3CG as a novel pulse pressure locus, which may
affect systolic blood pressure and diastolic blood pressure. In
carotid artery plaques, a combined meta-analysis confirmed
rs17398575, situated 96.5 kb from the PIK3CG gene, as the
most significant signal, which may induce an 18% increase in chance
of plaque presence (31), although
other reports do not support the association of this locus with
subclinical atherosclerosis (32).
The results of the present study showed that PIK3CG was
upregulated in carotid atheroma plaque samples, compared with
macroscopically intact tissue samples from the same individual. It
was also a key node in the PPI network with a relatively high
degree. This suggested PIK3CG as one of key genes associated
with the formation of carotid plaques.
Taken together, the DEGs identified in the carotid
atheroma plaque samples, when compared with macroscopically intact
tissue samples, may be involved in carotid atherogenesis. The key
nodes identified in the PPI network constructed with these DEGs and
genes involved in the significant module, including SYK,
LYN and PIK3CG, are promising for the prediction of
carotid plaque formation. Further experimental evidence is required
to confirm these findings.
References
|
1
|
Fatahzadeh M and Glick M: Stroke:
Epidemiology, classification, risk factors, complications,
diagnosis, prevention and medical and dental management. Oral Surg
Oral Med Oral Pathol Oral Radiol Endod. 102:180–191. 2006.
View Article : Google Scholar : PubMed/NCBI
|
|
2
|
Friedlander AH and Baker JD: Panoramic
radiography: An aid in detecting patients at risk of
cerebrovascular accident. J Am Dent Assoc. 125:1598–1603. 1994.
View Article : Google Scholar : PubMed/NCBI
|
|
3
|
Foulkes MA, Wolf PA, Price TR, Mohr JP and
Hier DB: The Stroke data bank: Design, methods, and baseline
characteristics. Stroke. 19:547–554. 1988. View Article : Google Scholar : PubMed/NCBI
|
|
4
|
Beckstrom BW, Horsley SH, Scheetz JP, Khan
Z, Silveira AM, Clark SJ, Greenwell H and Farman AG: Correlation
between carotid area calcifications and periodontitis: A
retrospective study of digital panoramic radiographic findings in
pretreatment cancer patients. Oral Surg Oral Med Oral Pathol Oral
Radiol Endod. 103:359–366. 2007. View Article : Google Scholar : PubMed/NCBI
|
|
5
|
Kappelle LJ: Symptomatic carotid artery
stenosis. J Neurol. 249:254–259. 2002. View Article : Google Scholar : PubMed/NCBI
|
|
6
|
Ayari H and Bricca G: Identification of
two genes potentially associated in iron-heme homeostasis in human
carotid plaque using microarray analysis. J Biosci. 38:311–315.
2013. View Article : Google Scholar : PubMed/NCBI
|
|
7
|
Barrett T, Wilhite SE, Ledoux P,
Evangelista C, Kim IF, Tomashevsky M, Marshall KA, Phillippy KH,
Sherman PM, Holko M, et al: NCBI GEO: Archive for functional
genomics data sets-update. Nucleic Acids Res. 41(Database issue):
D991–D995. 2013. View Article : Google Scholar : PubMed/NCBI
|
|
8
|
Stary HC, Chandler AB, Dinsmore RE, Fuster
V, Glagov S, Insull W Jr, Rosenfeld ME, Schwartz CJ, Wagner WD and
Wissler RW: A definition of advanced types of atherosclerotic
lesions and a histological classification of atherosclerosis. A
report from the committee on vascular lesions of the council on
arteriosclerosis, American heart association. Arterioscler Thromb
Vasc Biol. 15:1512–1531. 1995. View Article : Google Scholar : PubMed/NCBI
|
|
9
|
Carvalho BS and Irizarry RA: A framework
for oligonucleotide microarray preprocessing. Bioinformatics.
26:2363–2367. 2010. View Article : Google Scholar : PubMed/NCBI
|
|
10
|
Ritchie ME, Phipson B, Wu D, Hu Y, Law CW,
Shi W and Smyth GK: limma powers differential expression analyses
for RNA-sequencing and microarray studies. Nucleic Acids Res.
43:e472015. View Article : Google Scholar : PubMed/NCBI
|
|
11
|
Benjamini Y, Drai D, Elmer G, Kafkafi N
and Golani I: Controlling the false discovery rate in behavior
genetics research. Behav Brain Res. 125:279–284. 2001. View Article : Google Scholar : PubMed/NCBI
|
|
12
|
Diboun I, Wernisch L, Orengo CA and
Koltzenburg M: Microarray analysis after RNA amplification can
detect pronounced differences in gene expression using limma. BMC
Genomics. 7:2522006. View Article : Google Scholar : PubMed/NCBI
|
|
13
|
Huang DW, Sherman BT, Tan Q, Collins JR,
Alvord WG, Roayaei J, Stephens R, Baseler MW, Lane HC and Lempicki
RA: The DAVID gene functional classification tool: A novel
biological module-centric algorithm to functionally analyze large
gene lists. Genome Biol. 8:R1832007. View Article : Google Scholar : PubMed/NCBI
|
|
14
|
Ashburner M, Ball CA, Blake JA, Botstein
D, Butler H, Cherry JM, Davis AP, Dolinski K, Dwight SS, Eppig JT,
et al: Gene ontology: Tool for the unification of biology. The gene
ontology consortium. Nat Genet. 25:25–29. 2000. View Article : Google Scholar : PubMed/NCBI
|
|
15
|
Kanehisa M, Araki M, Goto S, Hattori M,
Hirakawa M, Itoh M, Katayama T, Kawashima S, Okuda S, Tokimatsu T
and Yamanishi Y: KEGG for linking genomes to life and the
environment. Nucleic Acids Res. 36(Database issue): D480–D484.
2008.PubMed/NCBI
|
|
16
|
Szklarczyk D, Franceschini A, Wyder S,
Forslund K, Heller D, Huerta-Cepas J, Simonovic M, Roth A, Santos
A, Tsafou KP, et al: STRING v10: Protein-protein interaction
networks, integrated over the tree of life. Nucleic Acids Res.
43(Database issue): D447–D452. 2015. View Article : Google Scholar : PubMed/NCBI
|
|
17
|
Smoot ME, Ono K, Ruscheinski J, Wang PL
and Ideker T: Cytoscape 2.8: New features for data integration and
network visualization. Bioinformatics. 27:431–432. 2011. View Article : Google Scholar : PubMed/NCBI
|
|
18
|
Janky R, Verfaillie A, Imrichová H, Van De
Sande B, Standaert L, Christiaens V, Hulselmans G, Herten K,
Sanchez M Naval, Potier D, et al: iRegulon: From a gene list to a
gene regulatory network using large motif and track collections.
PLoS Comput Biol. 10:e10037312014. View Article : Google Scholar : PubMed/NCBI
|
|
19
|
Koton S, Schneider AL, Rosamond WD, Shahar
E, Sang Y, Gottesman RF and Coresh J: Stroke incidence and
mortality trends in US communities, 1987 to 2011. JAMA.
312:259–268. 2014. View Article : Google Scholar : PubMed/NCBI
|
|
20
|
Wakhloo AK, Lieber BB, Seong J, Sadasivan
C, Gounis MJ, Miskolczi L and Sandhu JS: Hemodynamics of carotid
artery atherosclerotic occlusive disease. J Vasc Interv Radiol.
15:S111–S121. 2004. View Article : Google Scholar : PubMed/NCBI
|
|
21
|
Attila M, Jürgen R and Tybulewicz VL: The
SYK tyrosine kinase: A crucial player in diverse biological
functions. Nat Rev Immunol. 10:387–402. 2010. View Article : Google Scholar : PubMed/NCBI
|
|
22
|
Mallat Z, Hugel B, Ohan J, Lesèche G,
Freyssinet JM and Tedgui A: Shed membrane microparticles with
procoagulant potential in human atherosclerotic plaques: A role for
apoptosis in plaque thrombogenicity. Circulation. 99:348–353. 1999.
View Article : Google Scholar : PubMed/NCBI
|
|
23
|
Ait-Oufella H, Pouresmail V, Simon T,
Blanc-Brude O, Kinugawa K, Merval R, Offenstadt G, Lesèche G, Cohen
PL, Tedgui A and Mallat Z: Defective mer receptor tyrosine kinase
signaling in bone marrow cells promotes apoptotic cell accumulation
and accelerates atherosclerosis. Arterioscler Thromb Vasc Biol.
28:1429–1431. 2008. View Article : Google Scholar : PubMed/NCBI
|
|
24
|
Choi SH, Yin H, Ravandi A, Armando A,
Dumlao D, Kim J, Almazan F, Taylor AM, McNamara CA, Tsimikas S, et
al: Polyoxygenated cholesterol ester hydroperoxide activates TLR4
and SYK dependent signaling in macrophages. PLoS One. 8:e831452013.
View Article : Google Scholar : PubMed/NCBI
|
|
25
|
Hilgendorf I, Eisele S, Remer I, Schmitz
J, Zeschky K, Colberg C, Stachon P, Wolf D, Willecke F, Buchner M,
et al: The oral spleen tyrosine kinase inhibitor fostamatinib
attenuates inflammation and atherogenesis in low-density
lipoprotein receptor-deficient mice. Arterioscler Thromb Vasc Biol.
31:1991–1999. 2011. View Article : Google Scholar : PubMed/NCBI
|
|
26
|
Saito YD, Jensen AR, Salgia R and Posadas
EM: Fyn: A novel molecular target in cancer. Cancer. 116:1629–1637.
2010. View Article : Google Scholar : PubMed/NCBI
|
|
27
|
Toubiana J, Rossi A-L, Belaidouni N,
Grimaldi D, Pene F, Chafey P, Comba B, Camoin L, Bismuth G, et al:
Src-family-tyrosine kinase Lyn is critical for TLR2-mediated NF-κB
activation through the PI 3-kinase signaling pathway. Innate
immunity. 21:685–697. 2015. View Article : Google Scholar : PubMed/NCBI
|
|
28
|
Horiuchi M: Anti-inflammatory effect of
nifedipine and vasculoprotection. Drugs. 66:28–30. 2006. View Article : Google Scholar : PubMed/NCBI
|
|
29
|
Sawczuk M, Maciejewska-Karłowska A,
Skotarczak B and Pawlik A: Association between single nucleotide
polymorphism rs342286 near the PIK3CG gene and acute coronary
syndromes. Pol Arch Med Wewn. 124:210–212. 2014.PubMed/NCBI
|
|
30
|
Wain LV, Verwoert GC, O'Reilly PF, Shi G,
Johnson T, Johnson AD, Bochud M, Rice KM, Henneman P, Smith AV, et
al: Genome-wide association study identifies six new loci
influencing pulse pressure and mean arterial pressure. Nat Genet.
43:1005–1011. 2011. View
Article : Google Scholar : PubMed/NCBI
|
|
31
|
Bis JC, Kavousi M, Franceschini N, Isaacs
A, Abecasis GR, Schminke U, Post WS, Smith AV, Cupples LA, Markus
HS, et al: Meta-analysis of genome-wide association studies from
the CHARGE consortium identifies common variants associated with
carotid intima media thickness and plaque. Nat Genet. 43:940–947.
2011. View
Article : Google Scholar : PubMed/NCBI
|
|
32
|
Adams JN, Raffield LM, Freedman BI,
Langefeld CD, Ng MC, Carr JJ, Cox AJ and Bowden DW: Analysis of
common and coding variants with cardiovascular disease in the
diabetes heart study. Cardiovasc Diabetol. 13:772014. View Article : Google Scholar : PubMed/NCBI
|