Introduction
Uveal melanoma (UM) is the most frequent primary
malignant tumor worldwide, which arises from neural crest-derived
melanocytes of the uveal tract, and includes the iris, ciliary body
and choroid of the eye (1).
Options for treating UM consist of enucleation (eye removal),
various forms of radiation therapy, laser hyperthermia and surgical
resection (2,3). The 5-year local-tumor control rates
in the majority of specialized treatment centers are >90%,
however, despite successful treatment of the primary tumor,
metastasis occurs via hematogenous spread in up to 50% of patients
(4). The most common sites of
involvement include the liver (93%), lung (24%) and bone (16%),
with the overwhelming majority presenting initially in the liver
(5). Due to large tumor size,
involvement of the ciliary body and increased patient age,
metastasis is life-threatening (6). Therefore, revealing the molecular
characteristics may assist in understanding the pathological
mechanism and provide potential target markers for the treatment of
UM.
Previous studies have reported several molecular
markers in revealing the pathology of UM (7–9). For
example, activating mutations in the Gαq stimulatory
subunit, guanine nucleotide binding protein (G protein), q
polypeptide, appear to represent an initiating event (10), whereas inactivating mutations in
breast cancer 1, early onset associated protein-1 show a threshold
in tumor progression, beyond which lead to metastasis and
associated mortality (11).
However, mutated genes are not involved individually and use of a
network strategy, which connects genes together, is a useful
approach to solve the problem to a certain extent (12). If the network is too large, it may
ignore a certain number of significant genes and interactions
(13), however, evaluating
sub-networks or modules of the complex network avoids this problem
(14). In small modules, the
functions of individual genes and gene-gene interactions can be
detected and examined with more detail and precision (15).
Therefore, the present study aimed to reveal
differential modules (DMs) in UM by analyzing differential
networks. To achieve this, a differential co-expression network
(DCN) for the differentially expressed genes (DEGs) of UM were
constructed, based on weighted gene co-expression network analysis
(WGCNA) and one-sided t-tests. A module algorithm was then
implemented to identify the DMs and the statistical significance of
the DMs were evaluated. These DMs may be beneficial to disease
progression and provide insight for future investigations of
UM.
Materials and methods
Inference of DMs
Using the gene expression profile, the inference of
DMs involved three steps: The first step involved construction of
the DCN. Two genes were connected in a DCN if they exhibited
correlated expression profiles across conditions, and their
expression levels were significantly different between the UM and
baseline conditions (normal control). Subsequently, the module
algorithm was adapted to identify DMs present in multiple DCNs.
Finally, the statistical significance of DMs was assessed based on
the null score distribution of DMs, generated using randomized
networks.
Gene expression profile
A gene expression profile (accession no.
E-GEOD-44295) for the UM samples and normal controls was obtained
from the online public ArrayExpress database (http://www.ebi.ac.uk/arrayexpress/). The
E-GEOD-44295 profile comprised 66 samples, of which 63 were UM
samples and three were normal samples, and these were presented on
an A-MEXP-1172-Illumina HumanRef-8 v3.0 Expression BeadChip
platform (Illumina, Inc., San Diego, CA, USA). By converting the
data of the microarray profile at the probe-level into gene
symbols, a total of 18,631 genes were obtained for further
examination.
Construction of the DCN
Prior to constructing the DCN for UM, a binary
co-expression network was built, and a weight was assigned to each
edge based on differential gene expression between UM and baseline
condition.
Binary co-expression network
To construct the binary co-expression network, DEGs
between the UM and baseline conditions were identified according to
the Significance Analysis of Microarrays (SAM) (16). SAM assigns a score to each gene on
the basis of alterations in gene expression relative to the
standard deviation of repeated measurements. The relative
difference d(i) and expected relative difference dE(i)
in gene expression were defined. For the majority of genes,
d(i)≅dE(i), however, certain genes were
represented by points displaced from the d(i)=dE(i) line
by a distance above the threshold (Δ). As Δ decreased, the number
of genes considered significant by SAM increased. In the present
study, genes which met the criterion of Δ=3.701 were selected as
DEGs.
The binary co-expression network for the DEGs of UM
was constructed using WGCNA, which describes the correlation
structure between gene expression profiles, image data, genetic
marker data, proteomics data and other high-dimensional data
(17). The first step was to
define a gene co-expression similarity (Sij) for
each pair of genes (i and j). The second step
involved transforming the similarity matrix into an adjacency
matrix with the assistance of an adjacency function. The adjacency
was defined by increasing the Sij to a soft
threshold power β≥1. This allowed the adjacency to take on values
in succession between 0 and 1 to preserve the continuous nature of
the co-expression information. The continuous measure to assess the
strength of a gene connection was calculated as aij=Sijβ and the interaction between two
genes was proportional to their Sij in the
following formula: log
(aij)=βxlog(Sij).
DCN construction
In order to remove indirect correlations resulting
from a third gene in the binary co-expression network, first order
partial Pearson's correlation coefficient was used (18) and only edges with correlations
above the pre-defined threshold (δ=0.4) were selected for the DCN.
Subsequently, weights were assigned to edges in the binary
co-expression network based on the P-value of differential gene
expression between the UM and baseline conditions, which was
calculated using a one-sided t-test (19). The weight (Wi,j) of an
edge (i,j) in the differential network was defined as follows:
Wi,j={(logpi+logpj)1/2(2*maxl∈V|logpl|)1/2'ifcor(i,j)≥δo,ifcor(i,j)<δ
Where pi and pj
represent P-values for genes i and j, respectively.
V is the node set of the co-expression network, and
cor(i,j) is the absolute value of Pearson's
correlation between genes i and j based on their
expression profiles.
Identification of DMs
A module algorithm was used to identify the DMs
present in the DCN (20), which
comprised three steps: Seed prioritization, module identification
by seed expansion and refinement of candidate modules.
Seed prioritization
For each network Gk=(V, Ek)
(k=1) with an adjacency matrix
Ak=(aijk)nxn, a function, g(i),
was proposed to assess the importance of vertex i in the
corresponding network. Gk represented a network, V and
Ek stood for the variables in the network. V→R
represented a function that builds a relationship between V and
R.
g(i)=∑j∈Nk(i)A'ijkg(j)
and
A′ijk=D–1/2AijkD1/2
In which Nk (i) represents
the set of neighbors of i in Gk;
A′ijk represents the degree of the
normalized weighted adjacency matrix; D denotes a diagonal matrix
with element Dij=∑jAijk.
A′g is the information
propagation on network via the edges of networks, which indicates
that the importance of a node depends on the number of neighbors,
strength of connection and importance of neighbors. For each gene,
the g(i)=z-score was obtained, and the genes
were ranked g=(g(1), g(2), …, g(M)) based
on their z-score, with the top 10% of genes selected as the
seed genes.
Module identification by seed
expansion
Module identification was accomplished with the
assistance of seed genes. With each seed, the module identification
step iteratively included genes whose addition led to the maximum
decrease in the graph entropy-based objective function until there
is no further decrease in the objective function. Regarding each
seed gene (v) as a module C=(v), for each vertex u in its
neighborhood in all networks, N(v)=∪iNi(v)[uϵN(v)] was
determined, in which Ni(ν) was the neighbor set in
Gi as the candidate for C. The new module, C′=C∪() and the entropy decrease between
C and C' was defined as follows:
ΔH(C′,C)=H(C)–H(C′)
The graph entropy for C across all networks and
normalized for the size of C was:
H(C)=∑k=1MHk(C)|C|
Where Hk(C)=∑i∈cH(Cj) represents the sum of all
vertices in C and network k. Ci
(1≤i≤τ) was a candidate DM. H(C') was calculated in a
similar manner. ΔH(C', C)>0 indicated that the addition
of vertex u improved the connectivity of the former module
C. The vertex u, whose addition maximized ΔH, was
added to C. The expansion step terminated when no additional
vertex could further reduce the entropy of the evolving module.
Refinement of candidate modules
During the refinement step, candidate DMs with
sizes >5 genes were removed. To merge overlapping candidate DMs
into DMs, the Jaccard index (21)
was used, which is the ratio of intersection over union for two
sets. A Jaccard index of 0.5 was used in the present study.
Evaluation of the statistical
significance of DMs
The statistical significance of DMs was computed
based on the null score distribution of DMs generated using
randomized networks. Each randomized network was composed of edges
captured from interactions in the binary co-expression network, and
the number of edges in the randomized network was the same as that
in the DCN. Each network was completely randomized 100 times by
degree-preserved edge shuffling. To construct the null distribution
for DM scores, module identification was performed on the
randomized networks. Based on the null distribution, the empirical
P-value of a DM was defined as the probability of the module having
the observed score or less by chance. P-values were corrected for
multiple testing utilizing the method of Benjamini-Hochberg
(22), and DMs with P<0.05 were
considered significant.
Results
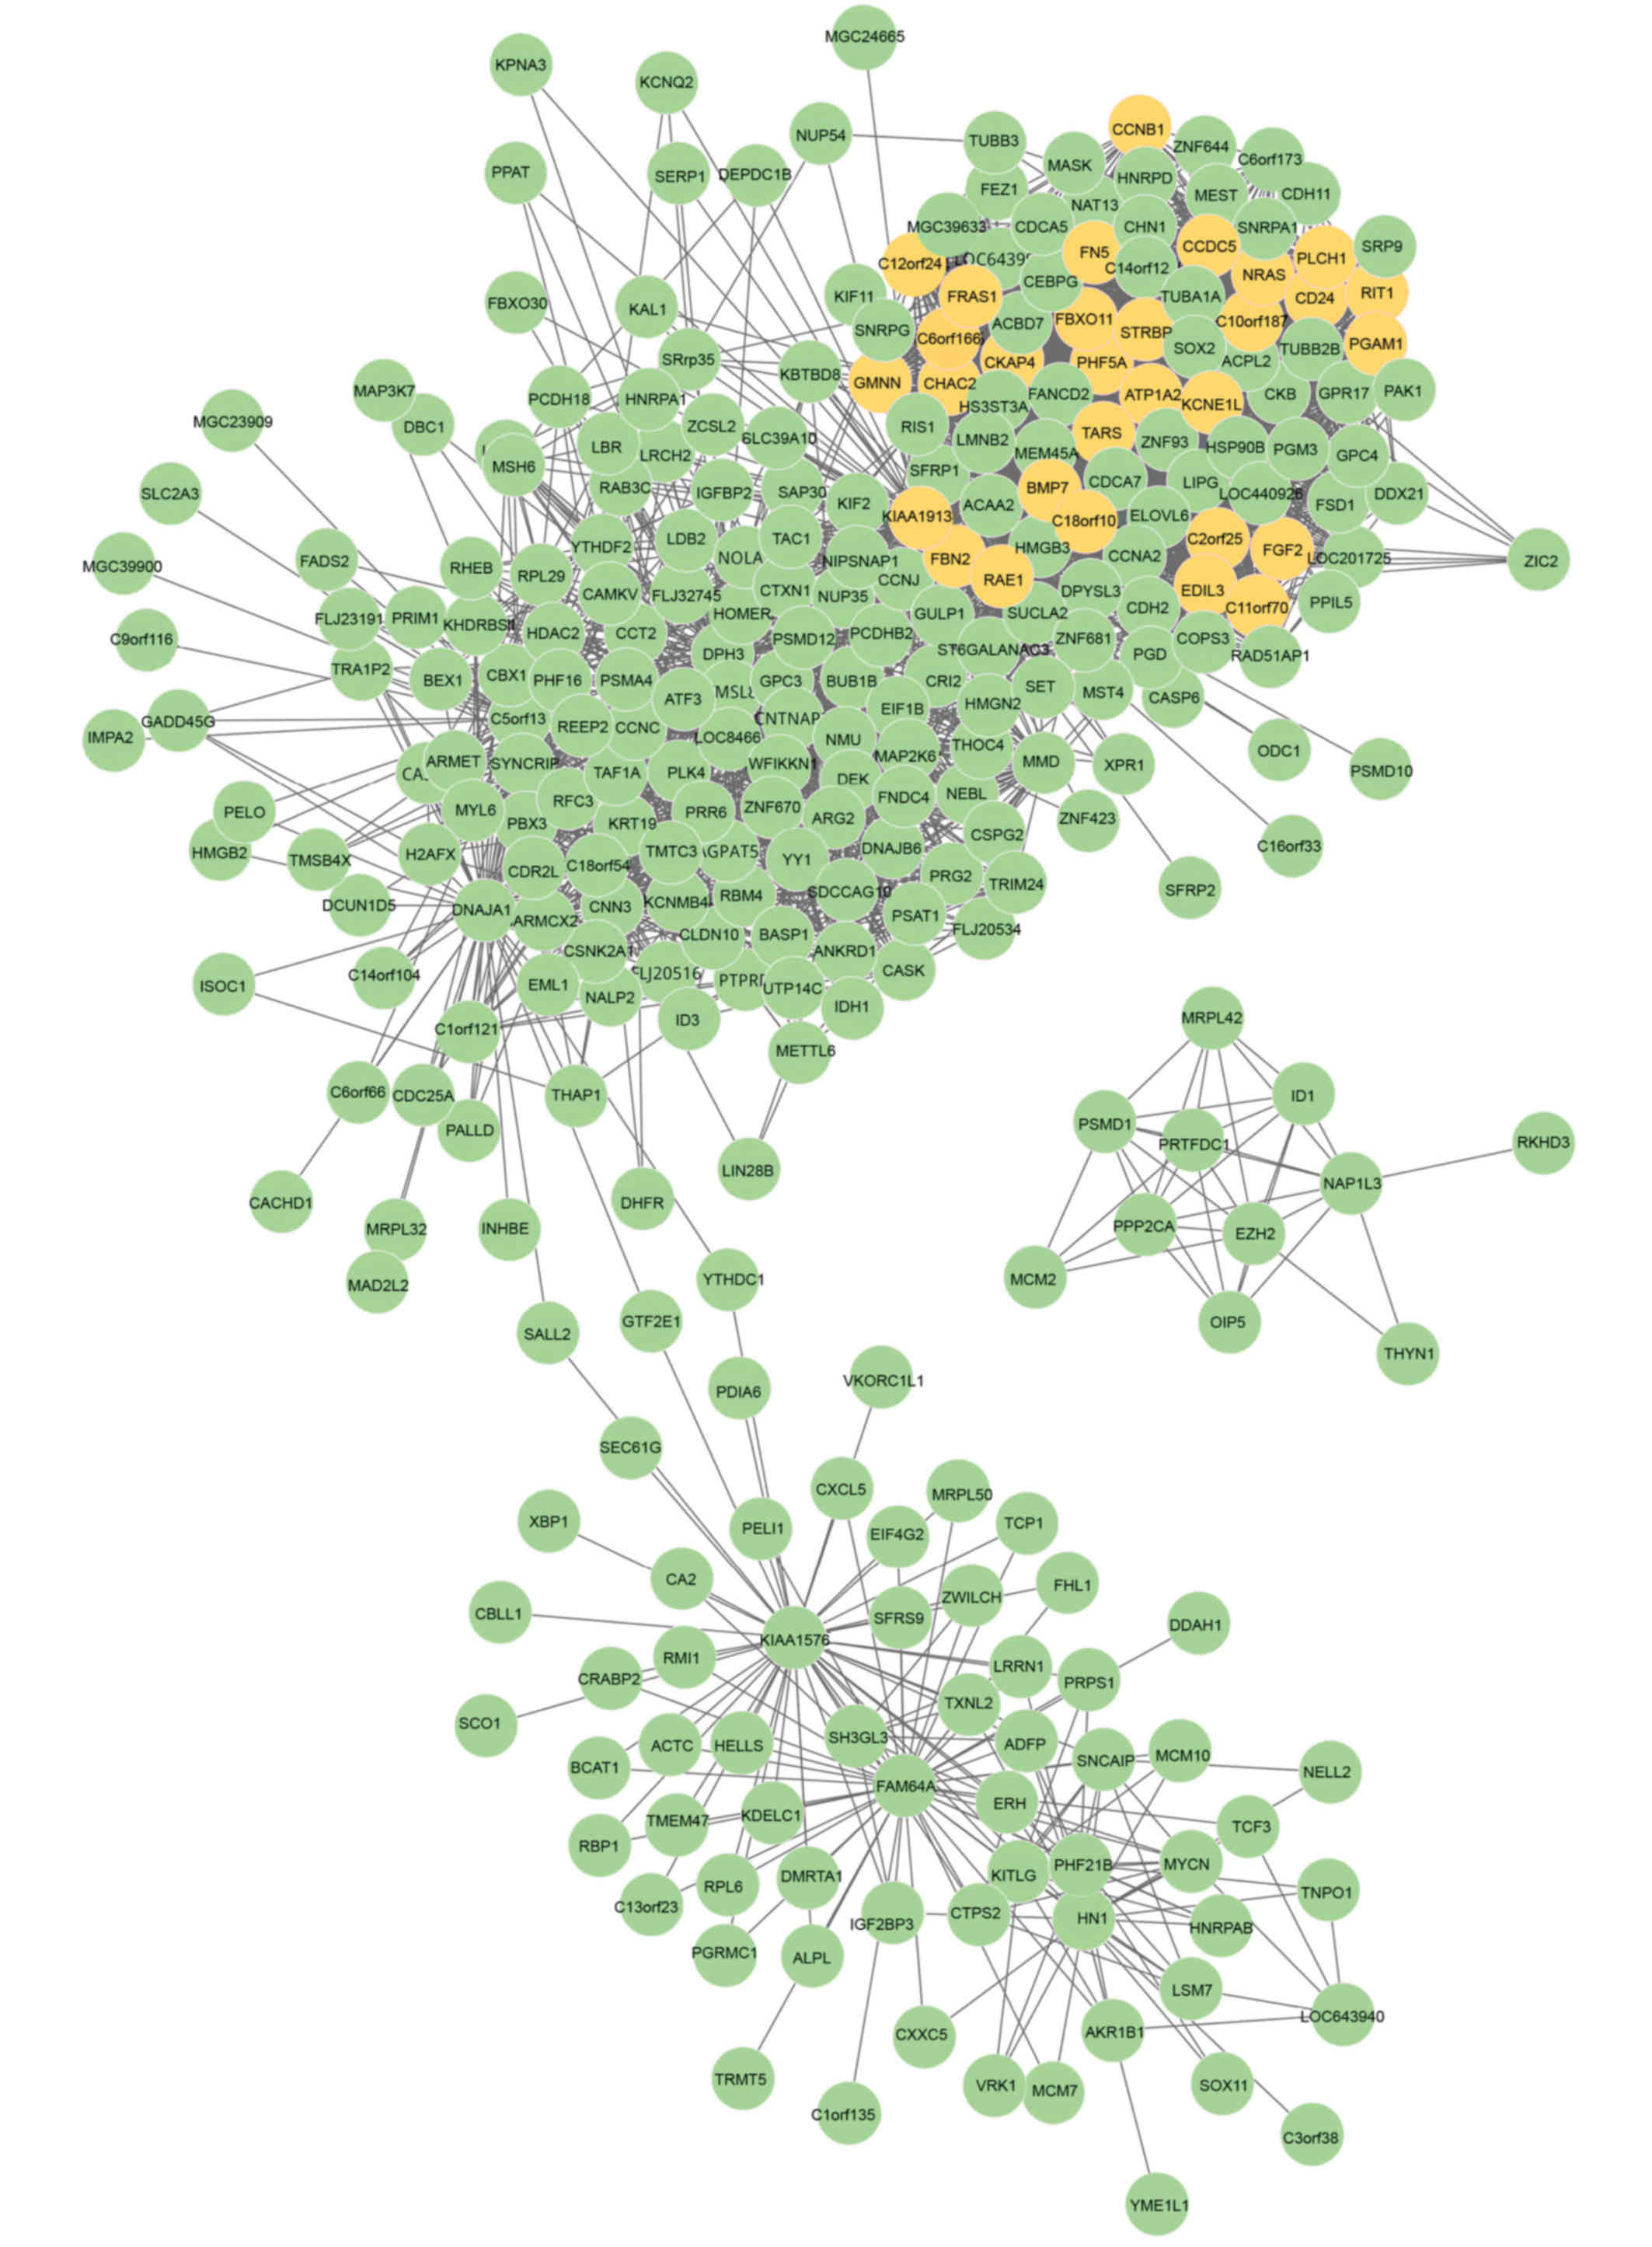
Construction of DCN
By accessing SAM, 443 DEGs were obtained between UM
and baseline conditions with the threshold of Δ=3.701.
Subsequently, on the basis of the DEGs, a binary co-expression
network comprising 97,903 interactions was constructed through
WGCNA. To remove indirect correlation and improve the network
confidence, interactions that met the δ≥0.4 criteria were selected
to form the DCN (Fig. 1). There
were a total of 309 nodes and 3,729 interactions. In addition, a
weight value was assigned to each interaction or edge, based on a
one-sided t-test. As a consequence, for genes i and j, and their
edges e(i,j), a three-dimensional matrix for the weight of the
edges, e(i,j), Wi,j, in the network, Gk, were
determined. Therefore, the DCN was termed a three-dimensional
network, which may be more feasible and stable, compared with the
binary network, and the subsequent analyses were dependent on
it.
Identification of DMs
For the purpose of extracting DMs from the DCN, the
present study used a module algorithm, which comprised seed
prioritization, module identification by seed expansion and
refinement of candidate modules. A total of 30 seed genes were
detected from the DCN, as shown in Fig. 1, and the z-scores for these are
listed in Table I. The top five
seed genes with the highest z-scores were KIAA1913
(z-score=5,030.874), RAE1 (z-score=4,654.952), EDIL3
(z-score=4,288.795), FBN2 (z-score=4,280.710) and KCNE1L
(z-score=3,907.409). With the 30 seed genes as a starting point,
modules were identification was performed based on the entropy
decrease ΔH(C, C) between C and C', and candidate modules were
obtained. Following elimination of candidate modules with sizes
<5, the modules between which the Jaccard index was ≥0.5 were
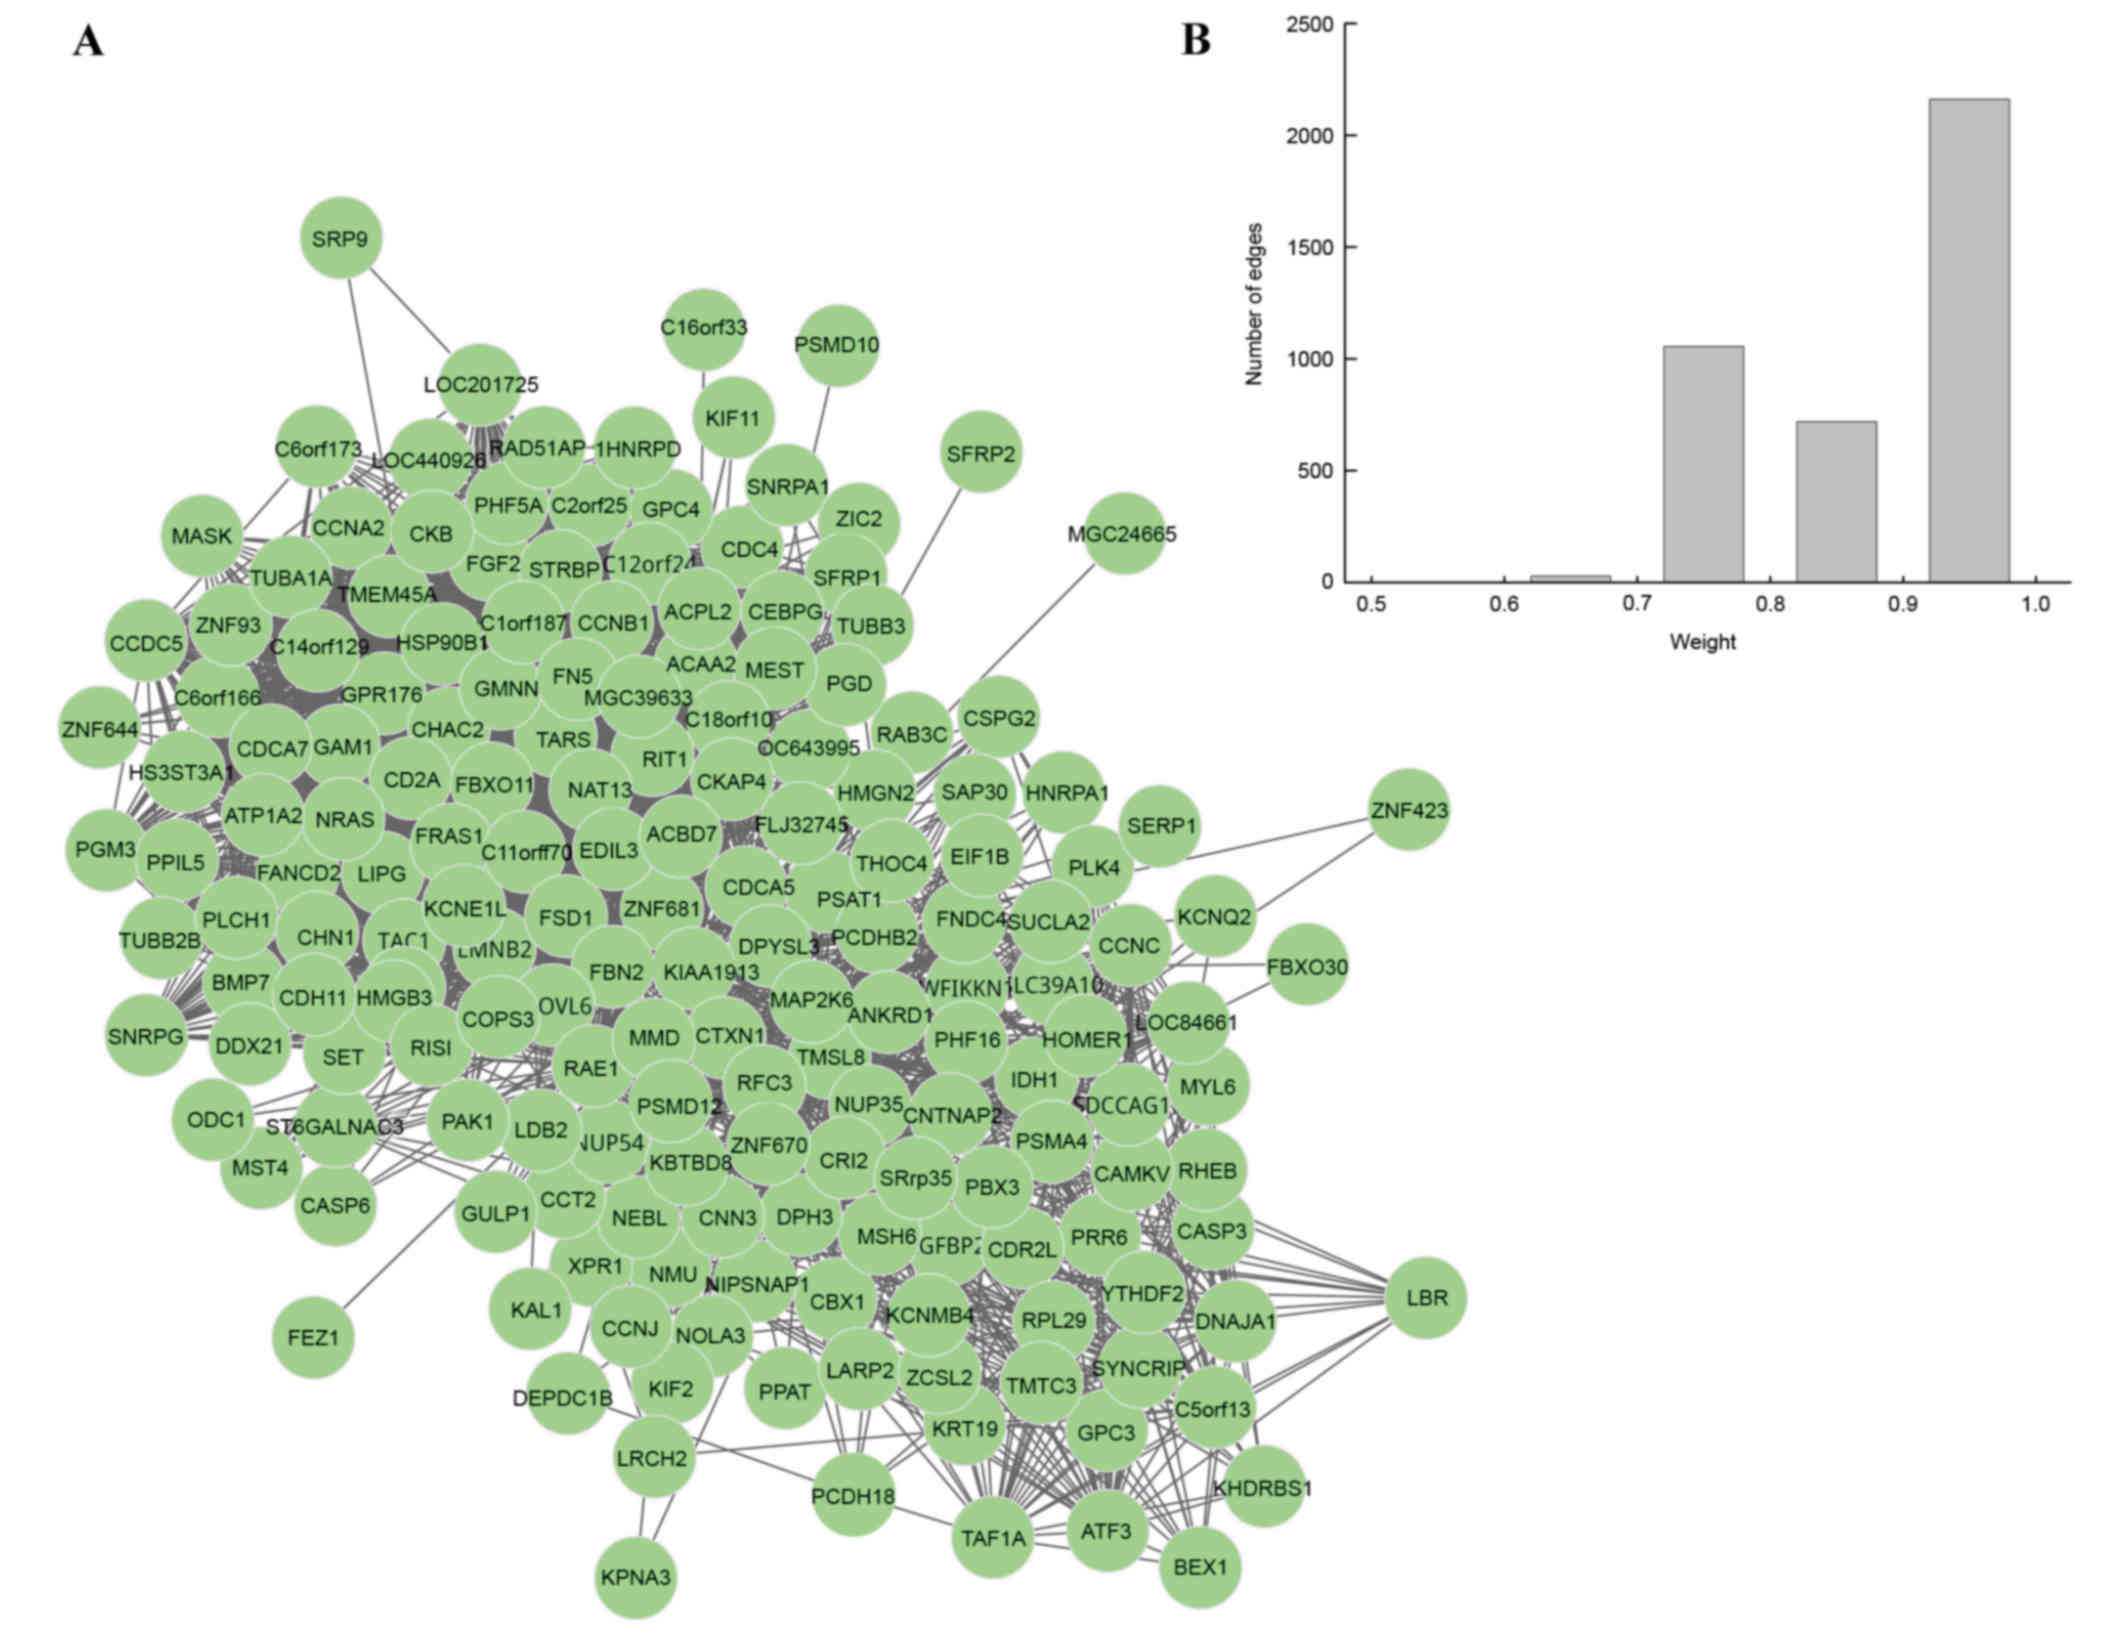
merged, and one DM was identified for UM. In this DM, there were
179 nodes and 3,068 edges (Fig.
2A). To further validate the connectivity of two genes in DM,
the present study focused on the weight distributions of edges
(Fig. 2B). The majority of edges
were distributed in the section of 0.9–1, which suggested that the
genes were closely correlated to each other and that the DM
possessed good topological properties, meaning that the constructed
DM correlated to UM closely.
 | Table I.Seed genes in the differential
co-expression network. |
Table I.
Seed genes in the differential
co-expression network.
| No. | Gene | z-score |
|---|
| 1 |
KIAA1913 | 5,030.874 |
| 2 | RAE1 | 4,654.952 |
| 3 | EDIL3 | 4,288.795 |
| 4 | FBN2 | 4,280.710 |
| 5 | KCNE1L | 3,907.409 |
| 6 |
C11orf70 | 3,893.342 |
| 7 | FN5 | 3,854.172 |
| 8 | BMP7 | 3,812.697 |
| 9 | NRAS | 3,797.038 |
| 10 | RIT1 | 3,783.095 |
| 11 | CHAC2 | 3,776.808 |
| 12 | TARS | 3,764.072 |
| 13 |
C12orf24 | 3,753.696 |
| 14 | CKAP4 | 3,730.135 |
| 16 | PGAM1 | 3,716.575 |
| 17 | GMNN | 3,689.177 |
| 18 | CCDC5 | 3,688.885 |
| 19 | C2orf25 | 3,677.012 |
| 20 | FBXO11 | 3,619.800 |
| 21 | CD24 | 3,548.007 |
| 22 |
C6orf166 | 3,542.197 |
| 23 | FRAS1 | 3,534.241 |
| 24 | PLCH1 | 3,523.897 |
| 25 | CCNB1 | 3,517.887 |
| 26 | ATP1A2 | 3,502.642 |
| 27 | PHF5A | 3,479.246 |
| 28 | FGF2 | 3,468.892 |
| 29 |
C18orf10 | 3,451.743 |
| 30 | STRBP | 3,435.203 |
Statistical significance of the
DM
To evaluate the statistical significance of DM, the
present study constructed a randomized network of the 3,729 edges
captured from 97,903 interactions of the binary co-expression
network at random to identify modules. This type of randomized
network was constructed 100 times, and a total of 4,298 modules
were obtained. The empirical P-value of DM was defined as the
probability of the module having the observed score or a lower
score by chance, and this was adjusted using the Benjamini-Hochberg
test. The P-value for DM was determined as 0.034, which indicated
that this DM was a statically significant DM across the UM
condition and baseline condition.
Discussion
A network-based approach is capable of extracting
informative and significant genes dependent on biomolecular
networks, including protein-protein interaction networks,
co-expression networks and gene regulatory networks, compared with
individual genes (23,24). In addition, it offers a
quantifiable description of the molecular networks, which
characterize the complex interactions and intricate associations
governing cellular functions among tissues and disease-associated
genes, to explain the molecular processes during the development
and progression of disease (25).
Traditionally, if one interaction between a gene pair shows high
correlation in one condition, the interaction is selected as an
edge in the network (26). By
contrast, if one gene in the interaction is differently expressed
but the other one is not, it may not be considered a significant
interaction in the entire dataset. These challenges are overcome to
a certain extent by constructing a DCN.
Therefore, in the present study, a DCN for UM was
constructed based on DEGs using WGCNA, which comprised 309 nodes
and 3,729 edges. Based on a one-sided t-test, a total of 30
seed genes were examined from the DCN. Subsequently, the
identification of DMs was performed on the DCN and its seed genes
according to the module algorithm. Following evaluation using
randomized networks and adjusting the P-value of DM using the
Benjamini-Hochberg test, one DM was obtained with P=0.034 across
the UM and baseline conditions, and was considered a statistically
significant DM between the UM and baseline conditions. The
significant DM possessed 179 nodes and 3,068 edges. In addition,
the majority of edges were distributed in section 0.9–1, which
suggested that the genes were closely correlated with each other
and the DM possessed good topological properties.
From a systems biology point of view, diseases are
caused by perturbations to the gene network (27). These perturbations are dynamic as
disease progresses. The identification of small modules may provide
assistance in investigating the dynamic perturbations with more
detail and precision. Therefore, the key focus of the present study
was to investigate DMs between UM and normal conditions utilizing
differential networks. A key innovation of the method used in the
present study is the ability to identify unique and shared modules
from multiple differential gene networks, each of which represents
a different perturbed condition (28). In addition, sets of genes, which
are differentially expressed under the UM state, but do not exhibit
correlated expression patterns are not identified as a module
(29). Therefore, the DM offers
more detailed evidence of the pathological mechanism underlying the
progression of UM.
In conclusion, the present study successfully
identified a DM in UM, based on the DCN and module algorithm. This
DM may be useful in revealing the pathological mechanism of UM and
provide insight for future investigations of UM.
References
|
1
|
Harbour JW, Onken MD, Roberson ED, Duan S,
Cao L, Worley LA, Council ML, Matatall KA, Helms C and Bowcock AM:
Frequent mutation of BAP1 in metastasizing uveal melanomas.
Science. 330:1410–1413. 2010. View Article : Google Scholar : PubMed/NCBI
|
|
2
|
Harbour JW: Clinical overview of uveal
melanoma: introduction to tumors of the eyeOcular Oncology. Albert
DM and Polans A: Marcel Dekker; New York, NY: pp. 1–18. 2003,
View Article : Google Scholar
|
|
3
|
Singh AD, Turell ME and Topham AK: Uveal
melanoma: Trends in incidence, treatment, and survival.
Ophthalmology. 118:1881–1885. 2011. View Article : Google Scholar : PubMed/NCBI
|
|
4
|
Landreville S, Agapova OA and Harbour JW:
Emerging insights into the molecular pathogenesis of uveal
melanoma. 4:629–636. 2008.
|
|
5
|
Diener-West M, Reynolds SM, Agugliaro DJ,
Caldwell R, Cumming K, Earle JD, Hawkins BS, Hayman JA, Jaiyesimi
I, Jampol LM, et al: Development of metastatic disease after
enrollment in the COMS trials for treatment of choroidal melanoma:
Collaborative ocular melanoma study group report No. 26. Arch
Ophthalmol. 123:1639–1643. 2005. View Article : Google Scholar : PubMed/NCBI
|
|
6
|
Abdel-Rahman MH, Pilarski R, Cebulla CM,
Massengill JB, Christopher BN, Boru G, Hovland P and Davidorf FH:
Germline BAP1 mutation predisposes to uveal melanoma, lung
adenocarcinoma, meningioma, and other cancers. J Med Genet.
48:856–859. 2011. View Article : Google Scholar : PubMed/NCBI
|
|
7
|
Ambrosini G, Musi E, Ho AL, de Stanchina E
and Schwartz GK: Inhibition of mutant GNAQ signaling in uveal
melanoma induces AMPK-dependent autophagic cell death. Mol Cancer
Ther. 12:768–776. 2013. View Article : Google Scholar : PubMed/NCBI
|
|
8
|
Cruz C, Teule A, Caminal JM, Blanco I and
Piulats JM: Uveal melanoma and BRCA1/BRCA2 genes: A relationship
that needs further investigation. J Clin Oncol. 29:e827–e829. 2011.
View Article : Google Scholar : PubMed/NCBI
|
|
9
|
Singh N, Bergman L, Seregard S and Singh
AD: Uveal melanoma: epidemiologic aspectsClinical Opthalmic
Oncology: Uveal Tumors. Damato B and Singh AD: 2nd edition.
Springer; Berlin Heidelberg, New York, NY: pp. 75–87. 2014,
View Article : Google Scholar
|
|
10
|
Field MG and Harbour JW: GNAQ/11 mutations
in uveal melanoma: Is YAP the key to targeted therapy? Cancer Cell.
25:714–715. 2014. View Article : Google Scholar : PubMed/NCBI
|
|
11
|
Harbour JW: The genetics of uveal
melanoma: An emerging framework for targeted therapy. Pigment Cell
Melanoma Res. 25:171–181. 2012. View Article : Google Scholar : PubMed/NCBI
|
|
12
|
Zhang L, Li S, Hao C, Hong G, Zou J, Zhang
Y, Li P and Guo Z: Extracting a few functionally reproducible
biomarkers to build robust subnetwork-based classifiers for the
diagnosis of cancer. Gene. 526:232–238. 2013. View Article : Google Scholar : PubMed/NCBI
|
|
13
|
Nibbe RK, Chowdhury SA, Koyutürk M, Ewing
R and Chance MR: Protein-protein interaction networks and
subnetworks in the biology of disease. Wiley Interdiscip Rev Syst
Biol Med. 3:357–367. 2011. View Article : Google Scholar : PubMed/NCBI
|
|
14
|
Wu Y, Jing R, Jiang L, Jiang Y, Kuang Q,
Ye L, Yang L, Li Y and Li M: Combination use of protein-protein
interaction network topological features improves the predictive
scores of deleterious non-synonymous single-nucleotide
polymorphisms. Amino Acids. 46:2025–2035. 2014. View Article : Google Scholar : PubMed/NCBI
|
|
15
|
Emilsson V, Thorleifsson G, Zhang B,
Leonardson AS, Zink F, Zhu J, Carlson S, Helgason A, Walters GB,
Gunnarsdottir S, et al: Genetics of gene expression and its effect
on disease. Nature. 452:423–428. 2008. View Article : Google Scholar : PubMed/NCBI
|
|
16
|
Li J and Tibshirani R: Finding consistent
patterns: A nonparametric approach for identifying differential
expression in RNA-Seq data. Stat Methods Med Res. 22:519–536. 2013.
View Article : Google Scholar : PubMed/NCBI
|
|
17
|
Zhang B and Horvath S: A general framework
for weighted gene co-expression network analysis. Stat Appl Genet
Mol Biol. 4:Aug 12–2005.(Epub ahead of print). PubMed/NCBI
|
|
18
|
Watson-Haigh NS, Kadarmideen HN and
Reverter A: PCIT: An R package for weighted gene co-expression
networks based on partial correlation and information theory
approaches. Bioinformatics. 26:411–413. 2010. View Article : Google Scholar : PubMed/NCBI
|
|
19
|
Cohen J, Cohen P, West SG and Aiken LS:
Applied multiple regression/correlation analysis for the behavioral
sciences. Routledge; 2013
|
|
20
|
Ma X, Gao L and Tan K: Modeling disease
progression using dynamics of pathway connectivity. Bioinformatics.
30:2343–2350. 2014. View Article : Google Scholar : PubMed/NCBI
|
|
21
|
Bouchard M, Jousselme AL and Doré PE: A
proof for the positive definiteness of the Jaccard index matrix.
Int J Approximate Reasoning. 54:615–626. 2013. View Article : Google Scholar
|
|
22
|
Benjamini Y and Hochberg Y: Controlling
the false discovery rate: A practical and powerful approach to
multiple testing. J Royal Statistical Society. Series B
(Methodological). 57:289–300. 1995.
|
|
23
|
Liu ZP, Wang Y, Zhang XS and Chen L:
Network-based analysis of complex diseases. IET Systems Biology
Institution of Engineering and Technology. 22–33. 2012. View Article : Google Scholar
|
|
24
|
Chen L, Wang R-S and Zhang X-S:
Reconstruction of Gene Regulatory NetworksBiomolecular Networks.
John Wiley & Sons, Inc.; pp. 47–87. 2009, View Article : Google Scholar
|
|
25
|
Sun SY, Liu ZP, Zeng T, Wang Y and Chen L:
Spatio-temporal analysis of type 2 diabetes mellitus based on
differential expression networks. Sci Rep. 3:22682013. View Article : Google Scholar : PubMed/NCBI
|
|
26
|
Chen L, Wang RS and Zhang XS:
Transcription regulation: Networks and modelsBiomolecular Networks.
John Wiley & Sons, Inc.; pp. 23–45. 2009, View Article : Google Scholar
|
|
27
|
Valentini G, Paccanaro A, Vierci HC,
Romero AE and Re M: Network integration boosts disease gene
prioritization. Network Biology SIG 2013 ISMB 2013. 2013.
|
|
28
|
Ma X, Gao L, Karamanlidis G, Gao P, Lee
CF, Garcia-Menendez L, Tian R and Tan K: Revealing pathway dynamics
in heart diseases by analyzing multiple differential networks. PLoS
Comput Biol. 11:e10043322015. View Article : Google Scholar : PubMed/NCBI
|
|
29
|
Segal E, Shapira M, Regev A, Pe'er D,
Botstein D, Koller D and Friedman N: Module networks: Identifying
regulatory modules and their condition-specific regulators from
gene expression data. Nat Genet. 34:166–176. 2003. View Article : Google Scholar : PubMed/NCBI
|