Introduction
FK506 (also known as tacrolimus) is a potent
immunosuppressive agent that is used to prevent graft rejection and
to treat autoimmune diseases, both experimentally and clinically
(1). Over the past decade, several
studies have reported that FK506 treatment may increase bone mass
and may be a potential treatment for bone defects (2,3).
FK506 exposure has been reported to induce osteogenic
differentiation by promoting the expression of osteoblastic
transcription factors, including core-binding factor α1 (also
termed runt related transcription factor 2, Runx2), osteopontin
(OPN) and osteocalcin (OCN) (2,3). A
previous in vivo study using bone tissue/hydroxyapatite
composite demonstrated increased bone formation and higher
osteogenic parameters when cultured with FK506 (4). However, other studies reported that
FK506 may result in osteoporosis by increasing the expression
levels of osteoclast differentiation factor or by inhibiting
osteoblast differentiation by suppressing the activity of
calcineurin and the expression of Runx2 (5,6).
These results suggested that the function of FK506 during
osteogenic differentiation was contradictory and required for
further study.
MicroRNAs (miRNAs) are small, 22-nucleotides-long,
endogenous noncoding RNAs that bind to target mRNAs at the
3′-untranslated region to mediate translation and reduce protein
expression levels (7). They are
key negative regulators of diverse biological and pathological
processes, such as proliferation, migration, apoptosis and
differentiation (7,8). A number of miRNAs have been
demonstrated to be involved in the differentiation of osteoblasts
from bone marrow stromal cells (BMSCs) by regulating specific gene
expression (9). One previous study
has indicated that miRNA (miR)-96 may promote osteogenic
differentiation by suppressing the expression of heparin-binding
epidermal growth factor-like growth factor in mouse BMSCs (10). During the process of osteogenic
differentiation of BMSCs, miR-205 was downregulated and inhibition
of miR-205 enhanced osteogenic differentiation by regulating the
expression of special AT-rich sequence-binding 2 (SATB2) and Runx2
(11). However, identification of
specific miRNAs and their regulatory roles in the FK506-induced
osteodifferentiation have been poorly investigated.
The aim of the present study was to examine the
effects of various concentrations of FK506 (5–5,000 nM) on the
osteogenic differentiation of rat BMSCs. Differentially expressed
miRNAs were profiled by miRNA array, verified by reverse
transcription-quantitative polymerase chain reaction (RT-qPCR) and
subjected to gene ontology (GO) term and Kyoto Encyclopedia of
Genes and Genomes (KEGG) pathway analysis.
Materials and methods
Isolation and culture of rat
BMSCs
Primary BMSCs were harvested from 5 male Sprague
Dawley rats (age, 4–5 weeks; weight, 80–100 g) using previously
described methods (2). The male
Sprague-Dawley rats were purchased from Shanghai SLAC Laboratory
Animal Co., Ltd. (Shanghai, China). The rats were maintained in a
temperature controlled room (22±3°C) with a 12-h light/dark cycle
and were allowed free access to drinking water and food. All
procedures were approved by The Animal Research Committee of
Zhongshan Hospital, Fudan University (Shanghai, China). Briefly,
rats were sacrificed by cervical dislocation followed by soaking in
75% ethanol for 10 min. The tibias and femurs from both legs of
each rat were dissected and the two ends of each bone were cut
under aseptic conditions. The marrow was flushed out with rat
Mesenchymal Stem Cell Growth medium (Cyagen Biosciences, Inc.,
Santa Clara, CA, USA) containing 10% fetal bovine serum, 1%
penicillin/streptomycin and 1% glutamine. The cells were
centrifuged at 500 × g for 5 min at 4°C, resuspended with
Mesenchymal Stem Cell Growth medium, plated in 25 cm2
culture flasks and incubated at 37°C in 5% CO2. The
medium was replaced every 3 days and non-adherent cells were
removed. The cells reached ~80% confluence at 10–14 days of
culture, and were subsequently dissociated using TrypLE Express
(Gibco; Thermo Fisher Scientific, Inc., Waltham, MA, USA) and
subcultured to passage 3 for further analysis. The cells were
analyzed using an Olympus SZX12 (Olympus Corporation, Tokyo, Japan)
inverted microscope equipped with a digital camera and connected to
a PC using MagnaFire 2.0 camera software (Optronics, Goleta, CA,
USA).
Phenotype analysis
BMSC cell-surface markers were analyzed by flow
cytometry. Briefly, cells at passage 3 with 80% confluence were
trypsinized using TrypLE Express (Gibco; Thermo Fisher Scientific,
Inc.), washed twice with PBS and centrifuged at 500 × g for 5 min
at 4°C. Cells were diluted with stain buffer (BD Bioscience,
Franklin Lakes, NJ, USA) and the cell number was determined by cell
counting assay following the manufacturer's instructions (Precision
Instrument Co. Ltd., Shanghai, China). Following counting, a 100 µl
cell suspension containing 5×10⁵ cells was added to flow
tubes, mixed with rat antibodies, including 1 µl FITC-labeled
anti-CD29 (1:100; cat. no. 102205; BioLegend, Inc., San Diego, CA,
USA), anti-CD45 (1:100; cat. no. 202205; BioLegend, Inc.) and
anti-CD90 (1:100; cat. no. 206105; BioLegend, Inc.) and 2.5 µl
phycoerythrin (PE) -labeled anti-CD34 (1:40; cat. no. ab187284;
Abcam, Cambridge, UK), and incubated in dark for 40 min at 4°C.
Following two washes with PBS, the stained cells were resuspended
in 300 µl PBS and immediately analyzed using a BD FACSCalibur flow
cytometer (BD Biosciences, Franklin Lakes, NJ, USA). Identification
of rat BMSCs was performed in triplicate. The mouse immunoglobulin
G1, κ was used as an isotype control (BioLegend, Inc.) and stain
buffer was used as blank control. Data were analyzed using FlowJo
software version 10 (Tree Star, Inc., Ashland, OR, USA).
Osteogenic differentiation
Cells at passage 3 with 80% confluence were
trypsinized using TrypLE Express and seeded into six plates at
1×10⁴ cells/cm2 and incubated with
Mesenchymal Stem Cell Growth medium at 37°C for 24 h. Following
incubation, the growth medium was replaced with 2 ml
osteo-induction medium was prepared as previously described
(12) containing 10 mM Na
β-glycerophosphate (Sigma-Aldrich; Merck KGaA, Darmstadt, Germany),
0.25 mM l-ascorbic acid (MP Biomedicals, LLC, Santa Ana,
CA, USA) and 0, 5, 50, 500 or 5,000 nM FK506 (Sigma-Aldrich; Merck
KGaA). The osteo-induction medium was replaced every other day;
cells were collected at 3, 7 and 14 days for RT-qPCR analysis, and
phenotype staining was done at 7 or 14 days. All biochemical assays
were carried out at least three times.
Alkaline phosphatase (ALP) and
alizarin red S (ARS) staining
ALP staining was performed following 7 days
osteogenic stimulation. Briefly, cells were rinsed twice with PBS
and fixed with 4% formaldehyde for 30 min at room temperature. The
fixed cells were stained with 5-bromo-4-chloro-3-indolyl
phosphate/nitroblue tetrazolium solution (Beyotime Institute of
Biotechnology, Shanghai, China) for 30 min at room temperature and
washed 3 times with PBS. ARS staining was used to assess mineral
deposition produced at late-stage bone formation. Briefly,
following 14 days osteogenic stimulation, cells were washed twice
with PBS, fixed with 4% formaldehyde for 30 min at room
temperature, washed twice with PBS and then stained with the
Alizarin Red S Solution (Cyagen Biosciences, Inc., Chicago, USA)
for 30 min at room temperature. Following ARS staining, the cells
were washed 3 times with PBS. Images were captured using an Olympus
SZX12 inverted microscope equipped with a digital camera and
connected to a PC using MagnaFire 2.0 camera software.
RNA extraction and RT-qPCR
analysis
According to the manufacturer's protocol, total RNA
was extracted from 1×10⁵ control and FK506-induced BMSCs
with TRIzol Reagent (Invitrogen, Carlsbad, USA), purified using the
RNeasy Mini Kit (Qiagen, CA, USA) and quantitated by using a
NanoDrop ND-1000 spectrophotometer (NanoDrop Technologies,
Wilmington, DE, USA). RNA (500 ng) was reverse transcribed into
cDNA using the PrimeScript™ RT-PCR kit (Takara Bio,
Inc., Otsu, Japan). The cDNA was amplified using the SYBR Premix Ex
Taq II kit (Takara Bio, Inc.) with the GeneAmp-PCR system 7500
(Thermo Fisher Scientific, Inc.). Total RNA for miRNA analysis was
isolated using a miRCute miRNA Isolation kit (Tiangen Biotech Co.,
Ltd., Beijing, China) and the expression of mature miRNA was
determined by miRCute miRNA PCR Detection kit (Tiangen Biotech Co.,
Ltd.) with the GeneAmp-PCR system 7500. All primers used for
RT-qPCR are listed in the Table I,
and each sample was measured in triplicate. Gene expression results
of mRNA or miRNA were evaluated by the 2−ΔΔCq method
(13) and normalized to GAPDH or
U6, respectively.
 | Table I.Primer sequences for reverse
transcription-quantitative polymerase chain reaction analysis. |
Table I.
Primer sequences for reverse
transcription-quantitative polymerase chain reaction analysis.
| Gene | Primer sequence
(5′→3′) |
|---|
| Sp7 | F:
GAGGCACAAAGAAGCCATACA |
|
| R:
GGGAAAGGGTGGGTAGTCAT |
| OCN | F:
ACAAGTCCCACACAGCAACTC |
|
| R:
CCAGGTCAGAGAGGCAGAAT |
| Runx2 | F:
CACCTCTGACTTCTGCCTCTG |
|
| R:
GATGAAATGCCTGGGAACTG |
| OPN | F:
CTTGGCTTACGGACTGAGG |
|
| R:
GCAACTGGGATGACCTTGAT |
| Smad7 | F:
TCGGAAGTCAAGAGGCTGTG |
|
| R:
CTGGACAGTCTGCAGTTGGTT |
| MAPK9 | F:
AACTCGCTACTATCGGGCTC |
|
| R:
TGGGAACAGGACTTTATGGAGG |
| Smad5 | F:
CCAGTGTTAGTGCCTCGTCA |
|
| R:
GTGGAAGGAATCAGGAAACG |
| Bambi | F:
CATTGCTGGCGGACTGAT |
|
| R:
TCCCTTCTTGGAGTGGTGTC |
| Dusp2 | F:
GGTGGTCCTGTGGAAATCTT |
|
| R:
GAATGCTCTTGTAGCGGAAAA |
| Jag1 | F:
TGCTTGGTGACAGCCTTCTA |
|
| R:
TGGGGTTTTTGATTTGGTTC |
| GAPDH | F:
CAGTGCCAGCCTCGTCTCAT |
|
| R:
AGGGGCCATCCACAGTCTTC |
miRNA microarray analysis
miRNA microarray analysis was performed by KangChen
Bio-tech Inc. (Shanghai, China). Briefly, total RNA was extracted
from 1×10⁷ control and FK506-induced BMSCs using TRIzol
reagent and purified with RNeasy Mini kit (Qiagen, Inc., Valencia,
CA, USA), according to manufacturer's protocol. The quality and
quantity of RNA were measured by using a NanoDrop ND-1000
spectrophotometer (NanoDrop Technologies, Wilmington, DE, USA), and
RNA integrity was determined using 1.5% gel electrophoresis. miRNAs
were labeled with Hy3/Hy5 fluorescence dyes using the miRCURY LNA
microRNA Array Power Labeling kit (Exiqon A/S, Vedbaek, Denmark)
and hybridized in a Hybridization Chamber II (Ambion; Thermo Fisher
Scientific, Inc.) using the miRCURY LNA microarray kit (Exiqon A/S)
according to the manufacturer's protocol. Following hybridization,
the microarray slides were processed with an Axon GenePix 4000B
Microarray Scanner (Axon Instruments; Molecular Devices, LLC,
Sunnyvale, CA, USA), and data analysis was performed using GenePix
Pro software version 6.0 (Molecular Devices, LLC). The experiment
was performed with 3 samples both in control and treatment group,
and miRNAs were defined as differentially expressed if changes in
expression levels were ≥2-fold than those of the controls.
GO analysis and KEGG pathway
annotation based on miRNA expression profile
Target genes of the differentially expressed miRNAs
were predicted using miRBase (http://www.mirbase.org), miRanda (http://www.microrna.org), TargetScan (http://www.targetscan.org) and miRDB (http://mirdb.org/miRDB) databases. GO analysis was
performed using the Database for Annotation, Visualization and
Integrated Discovery (https://david.ncifcrf.gov) to determine the functions
of the predicted target genes and to uncover the miRNA-target gene
regulatory network based on the predicted biological processes and
molecular functions. KEGG pathway analysis (http://www.genome.jp/kegg) was used to determine the
potential pathways that the predicted target genes may be a part
of. Fisher's exact test and the χ2 test were used to
classify the GO category and KEGG pathway, and the false discovery
rate (FDR) (14) was calculated to
correct the P-value. Thresholds of P<0.05 and FDR<0.05 were
used to select significant GO categories. Fisher P-value stands for
the enrichment P-value used Fisher's exact test and Fisher-P
value<0.05 was used as a threshold to select significant KEGG
pathways.
Statistical analysis
Statistical analysis of two groups was determined by
unpaired Student's t-test. All data were represented as the mean ±
standard error of the mean. P<0.05 was considered to indicate a
statistically significant difference.
Results
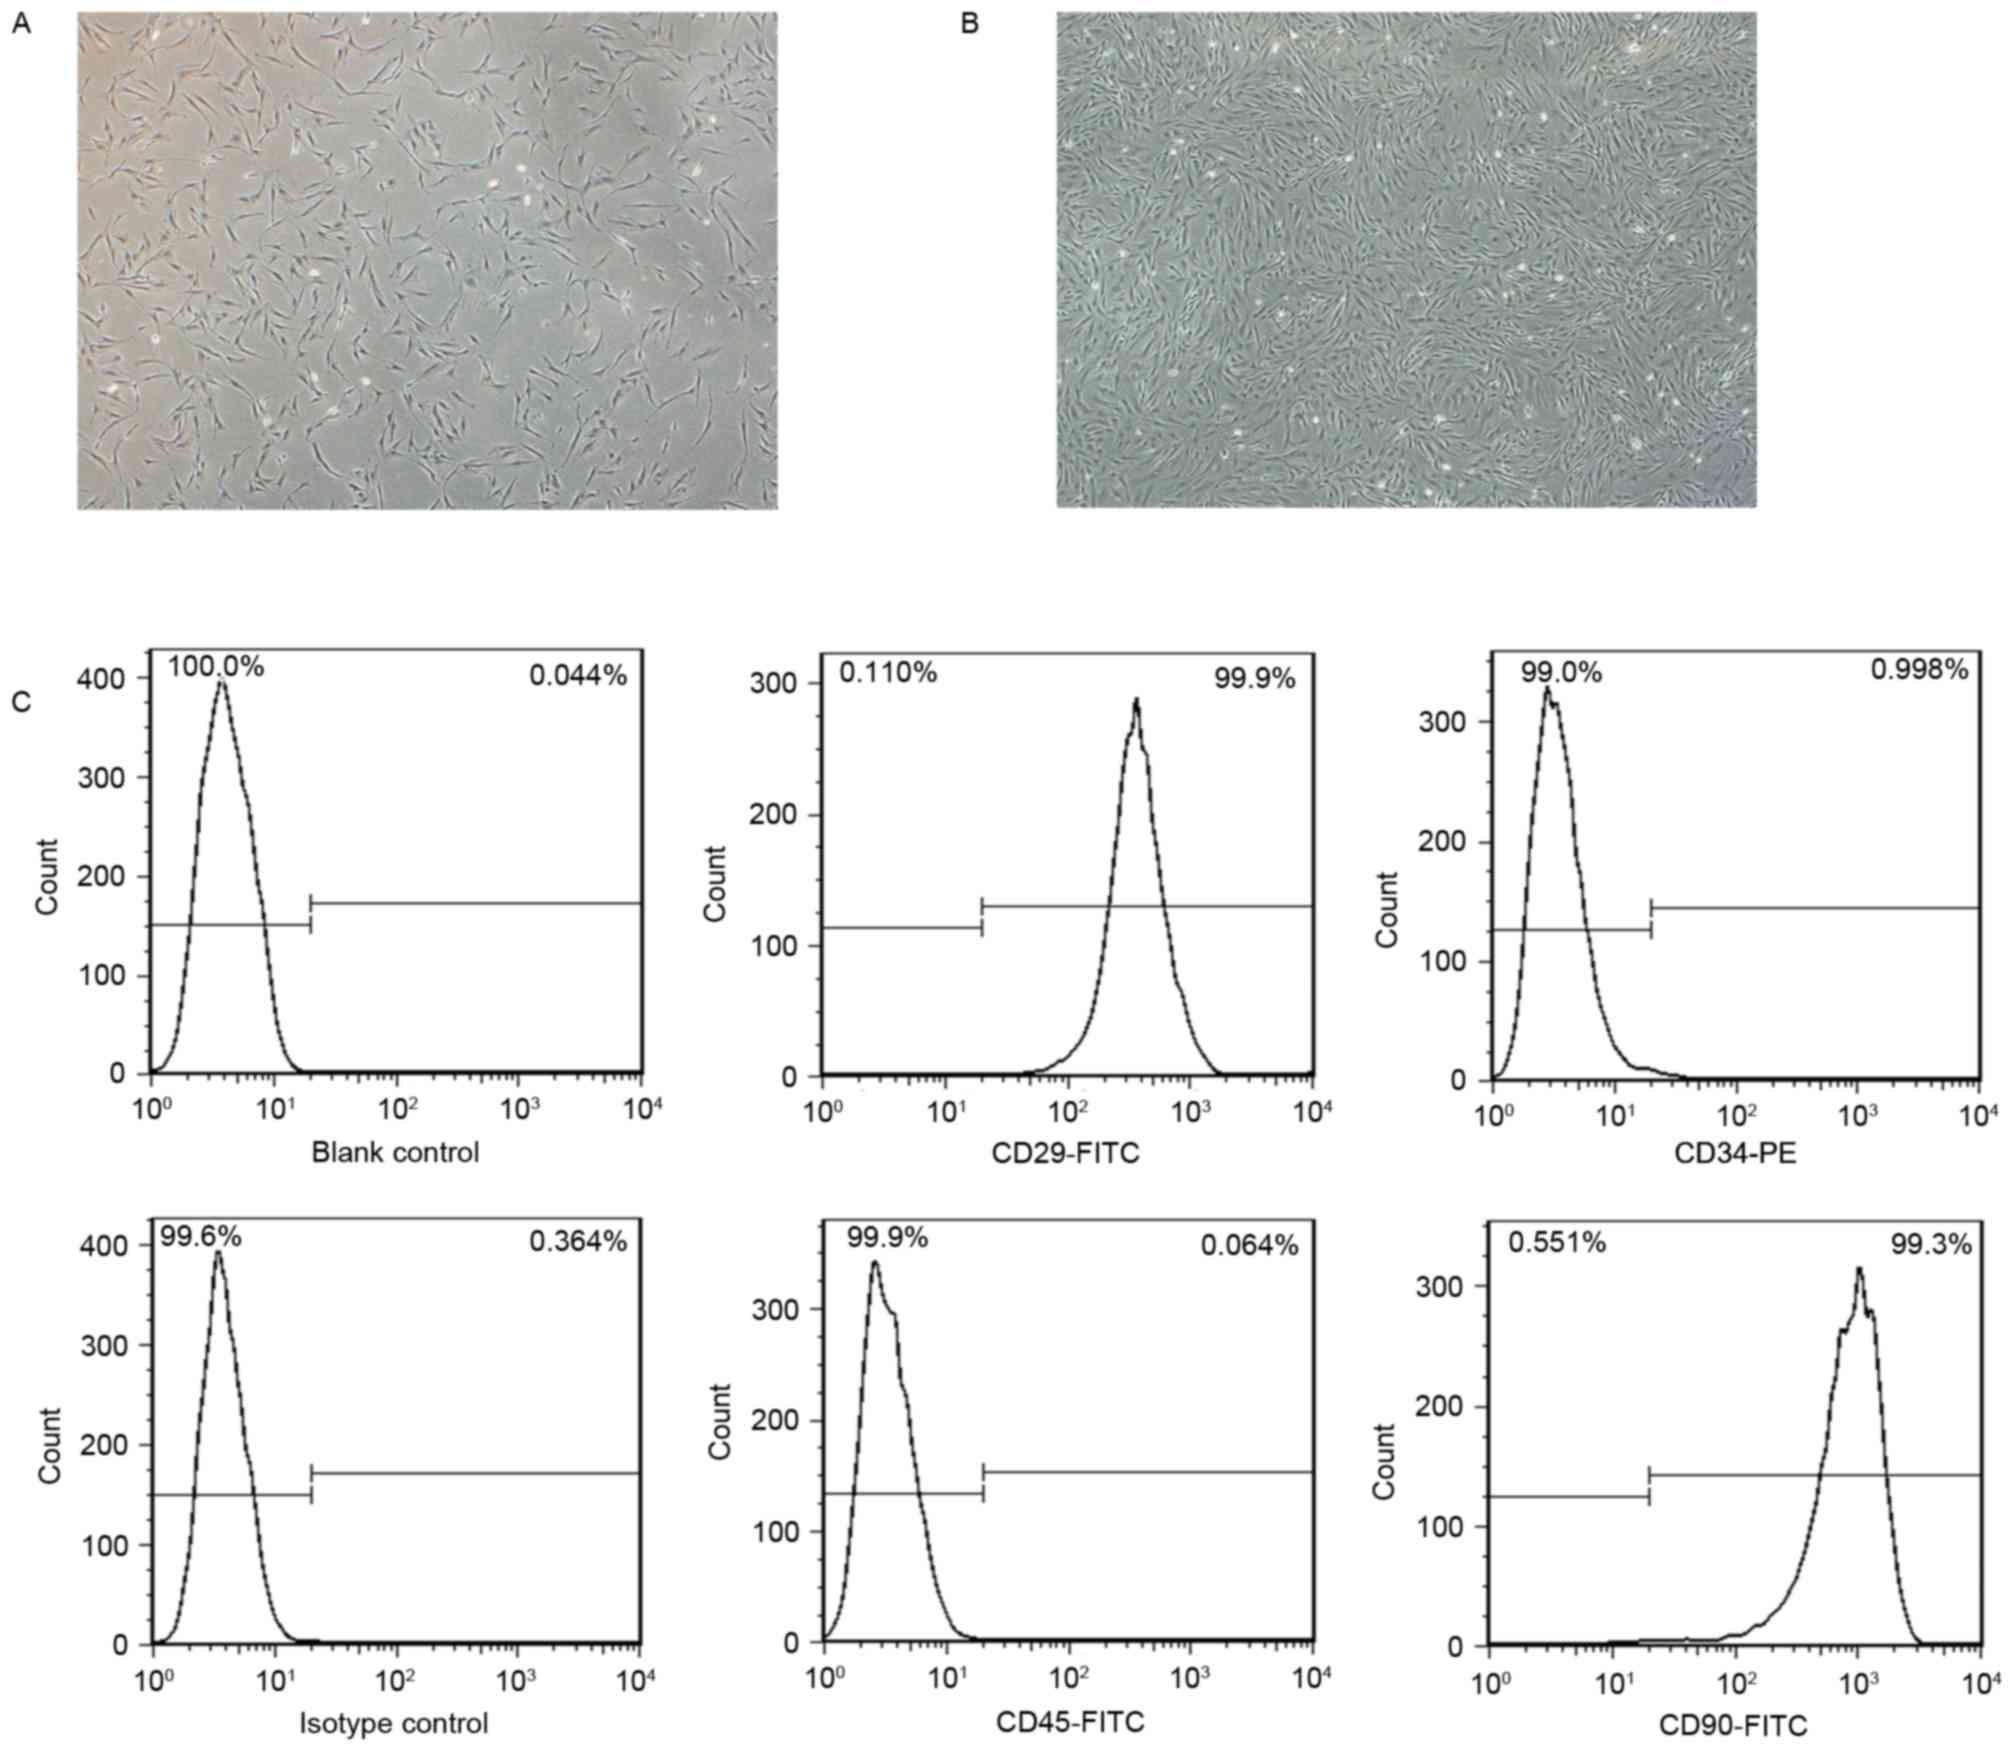
Growth characteristics and phenotype
of BMSCs using flow cytometry
Following 3 days of primary culture, the isolated
BMSCs were mostly spindle shaped, single or small colony size and
grew at a low density. (Fig. 1A).
Primary BMSCs cultured for 12 days replicated rapidly and reached
~80% confluence (Fig. 1B). Cells
were expanded by successive subculture and exhibited colony-like
growth at passage 3. BMSCs phenotypes were verified by flow
cytometric analysis. The subcultured BMSCs at passage 3 were
positive for MSCs markers CD29 (99.9%) and CD90 (99.3%), and
negative for hematopoietic lineage markers CD34 (0.998%) and CD45
(0.064%) (Fig. 1C).
FK506-induced osteogenic
differentiation of BMSCs
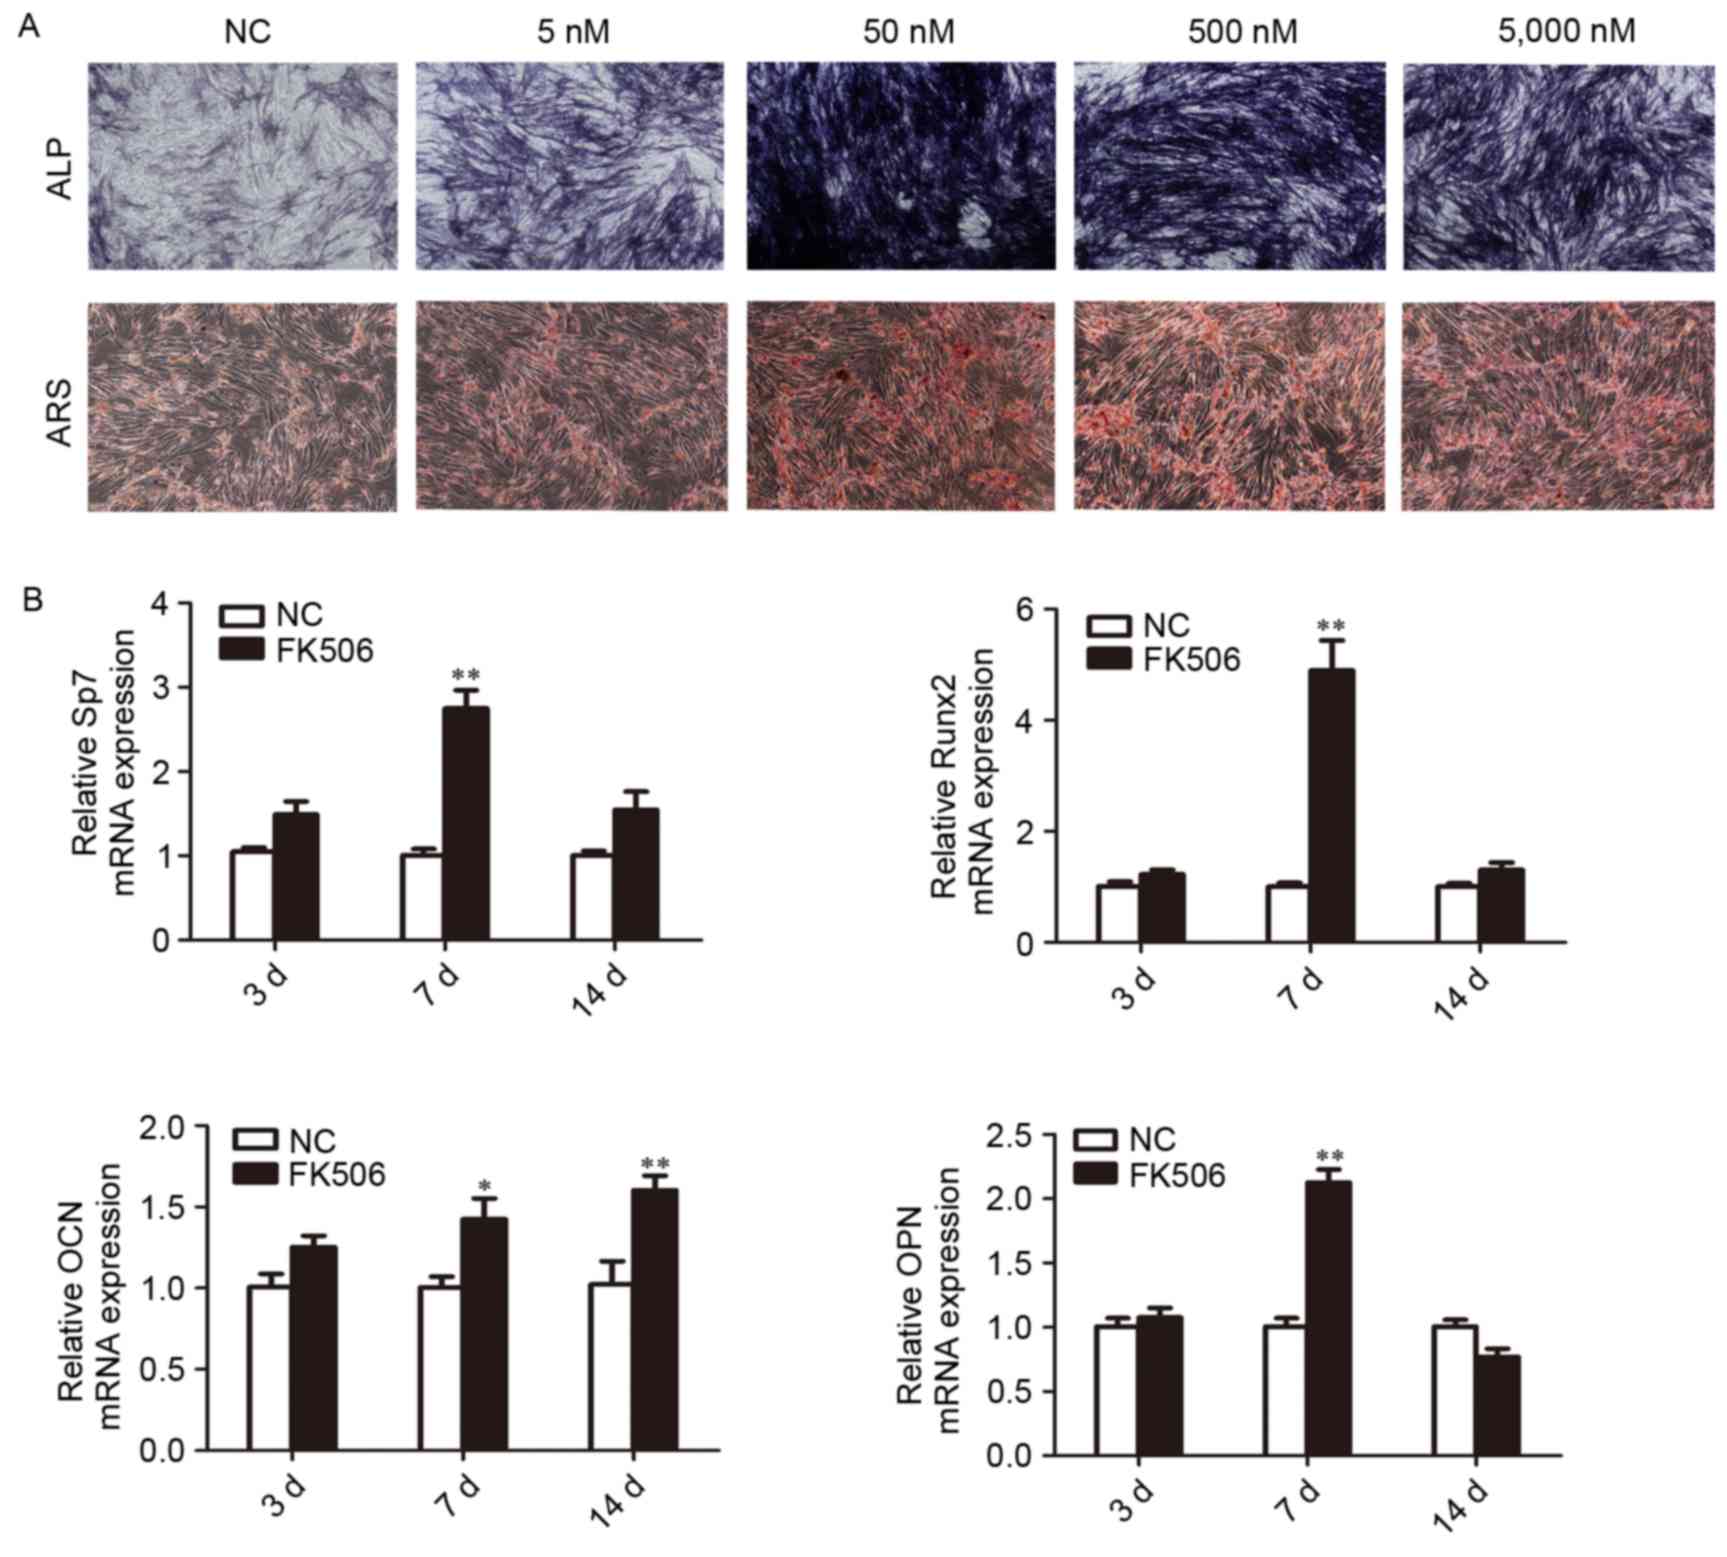
To detect the effects of FK506 treatment on the
osteogenic differentiation of BMSCs, cells were collected at
passage 3 and cultured in osteo-induction medium with a
concentration of FK506 ranging between 5 and 5,000 nM. ALP and ARS
staining were strongest in cells treated with 50 nM FK506 (Fig. 2A). RT-qPCR analysis of BMSCs
treated with 50 nM FK506 revealed that the expression of Sp7,
Runx2, and OPN were significantly increased following 7 days
stimulation and OCN expressed significantly at 7 and 14 days.
(P<0.05 vs. negative control; Fig.
2B). These results indicated that FK506 treatment has the
potential to stimulate the BMSCs differentiation into osteoblasts
at a concentration of 50 nM for 7 days of stimulation, and thus
this concentration was used for further miRNA array
experiments.
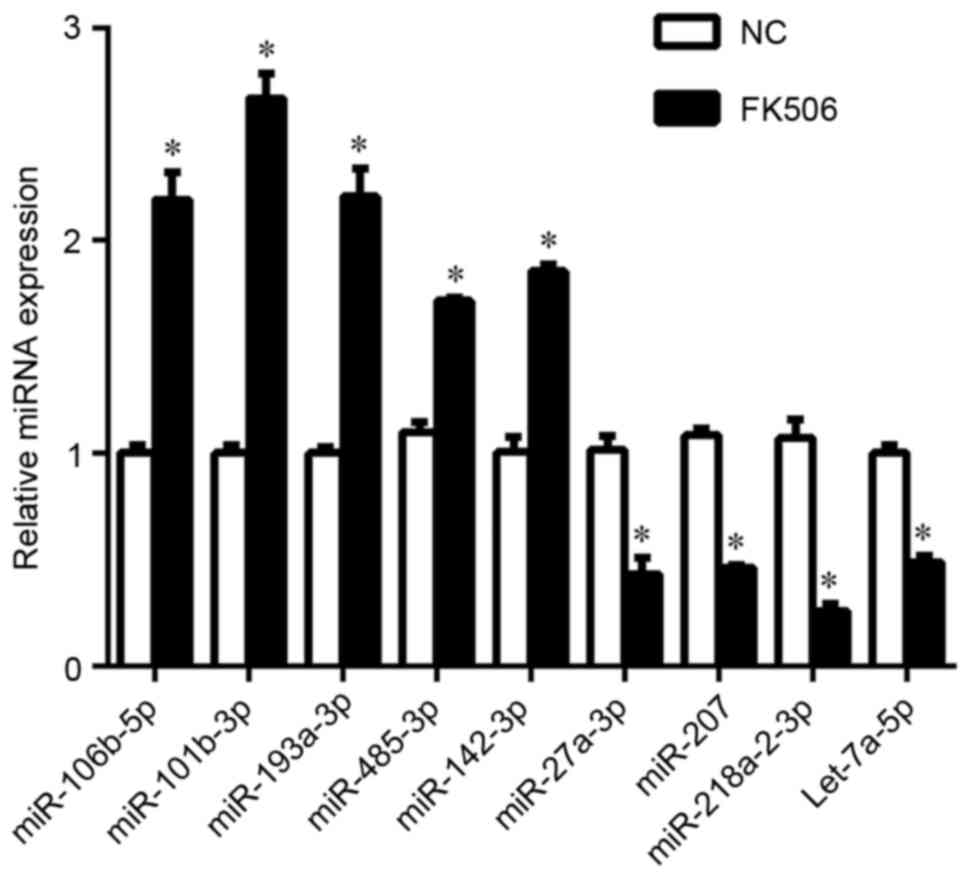
miRNA expression analysis following
FK506-induced osteogenic differentiation
To examine the differential expression of miRNAs
that are involved in FK506-induced osteodifferentiation of rat
BMSCs, miRCURY LNA microarrays were used to profile miRNA
expression 7 days following FK506 (50 nM) induction. Comparison
with the control group identified a total of 56 miRNAs, including
17 that were upregulated and 39 that were downregulated (Tables II and III, respectively). RT-qPCR analysis was
used to verify the microarray results and demonstrated that five
miRNAs were upregulated (miR-106b-5p, miR-101b-3p, miR-193a-3p,
miR-485-3p and miR-142-3p) and four were downregulated (miR-27a-3p,
miR-207, miR-218a-2-3p and let-7a-5p) compared with untreated
control cells (Fig. 3).
| Table II.Upregulated microRNAs in
FK506-treated rat bone marrow stromal cells vs. untreated
cells. |
Table II.
Upregulated microRNAs in
FK506-treated rat bone marrow stromal cells vs. untreated
cells.
| microRNA | Fold change |
|---|
|
rno-miR-101b-3p | 2.14 |
|
rno-miR-193a-3p | 2.15 |
| rno-miR-485-3p | 3.03 |
| rno-miR-33-5p | 3.03 |
| rno-miR-324-5p | 3.17 |
| rno-miR-142-3p | 3.18 |
|
rno-miR-106b-5p | 2.45 |
| rno-miR-185-3p | 2.67 |
| rno-miR-339-5p | 2.34 |
|
rno-miR-1843a-5p | 2.32 |
|
rno-miR-1839-3p | 2.22 |
| rno-let-7i-3p | 2.19 |
|
rno-miR-3068-5p | 2.19 |
| rno-miR-455-5p | 2.06 |
| rno-miR-296-3p | 2.08 |
| rno-miR-345-3p | 2.42 |
|
rno-miR-3084b-5p | 3.18 |
| Table III.Downregulated microRNAs in
FK506-treated rat bone marrow stromal cells vs. untreated
cells. |
Table III.
Downregulated microRNAs in
FK506-treated rat bone marrow stromal cells vs. untreated
cells.
| microRNA | Fold change |
|---|
| rno-miR-27a-3p | 2.70 |
|
rno-miR-218a-2-3p | 3.70 |
| rno-miR-665 | 5.00 |
| rno-miR-542-5p | 10.0 |
| rno-miR-207 | 2.63 |
| rno-miR-329-3p | 3.45 |
| rno-miR-10a-5p | 3.03 |
|
rno-miR-450a-5p | 4.12 |
| no-miR-672-3p | 3.45 |
| rno-miR-878 | 3.03 |
| rno-miR-2985 | 2.56 |
| rno-miR-370-5p | 2.38 |
| rno-miR-488-3p | 3.23 |
|
rno-miR-193a-5p | 6.67 |
| rno-miR-29b-3p | 2.17 |
| rno-miR-465-5p | 2.33 |
| rno-miR-3560 | 2.13 |
| rno-miR-3596d | 3.70 |
|
rno-miR-1956-5p | 50.0 |
| rno-miR-653-3p | 4.76 |
|
rno-miR-203a-3p | 7.14 |
| rno-miR-652-5p | 6.25 |
|
rno-miR-200c-5p | 4.17 |
|
rno-miR-181b-5p | 2.13 |
| rno-miR-1-3p | 2.04 |
| rno-miR-143-5p | 2.70 |
|
rno-miR-664-2-5p | 2.38 |
| rno-let-7a-5p | 2.22 |
|
rno-miR-3557-5p | 2.08 |
| rno-miR-331-5p | 3.85 |
| rno-let-7f-5p | 3.57 |
| rno-miR-18a-3p | 12.5 |
|
rno-miR-30c-1-3p | 2.33 |
| rno-miR-10a-3p | 25.0 |
|
rno-miR-487b-3p | 2.38 |
| rno-miR-497-5p | 11.1 |
| rno-miR-582-5p | 2.56 |
| rno-miR-493-5p | 3.45 |
| rno-miR-194-3p | 5.00 |
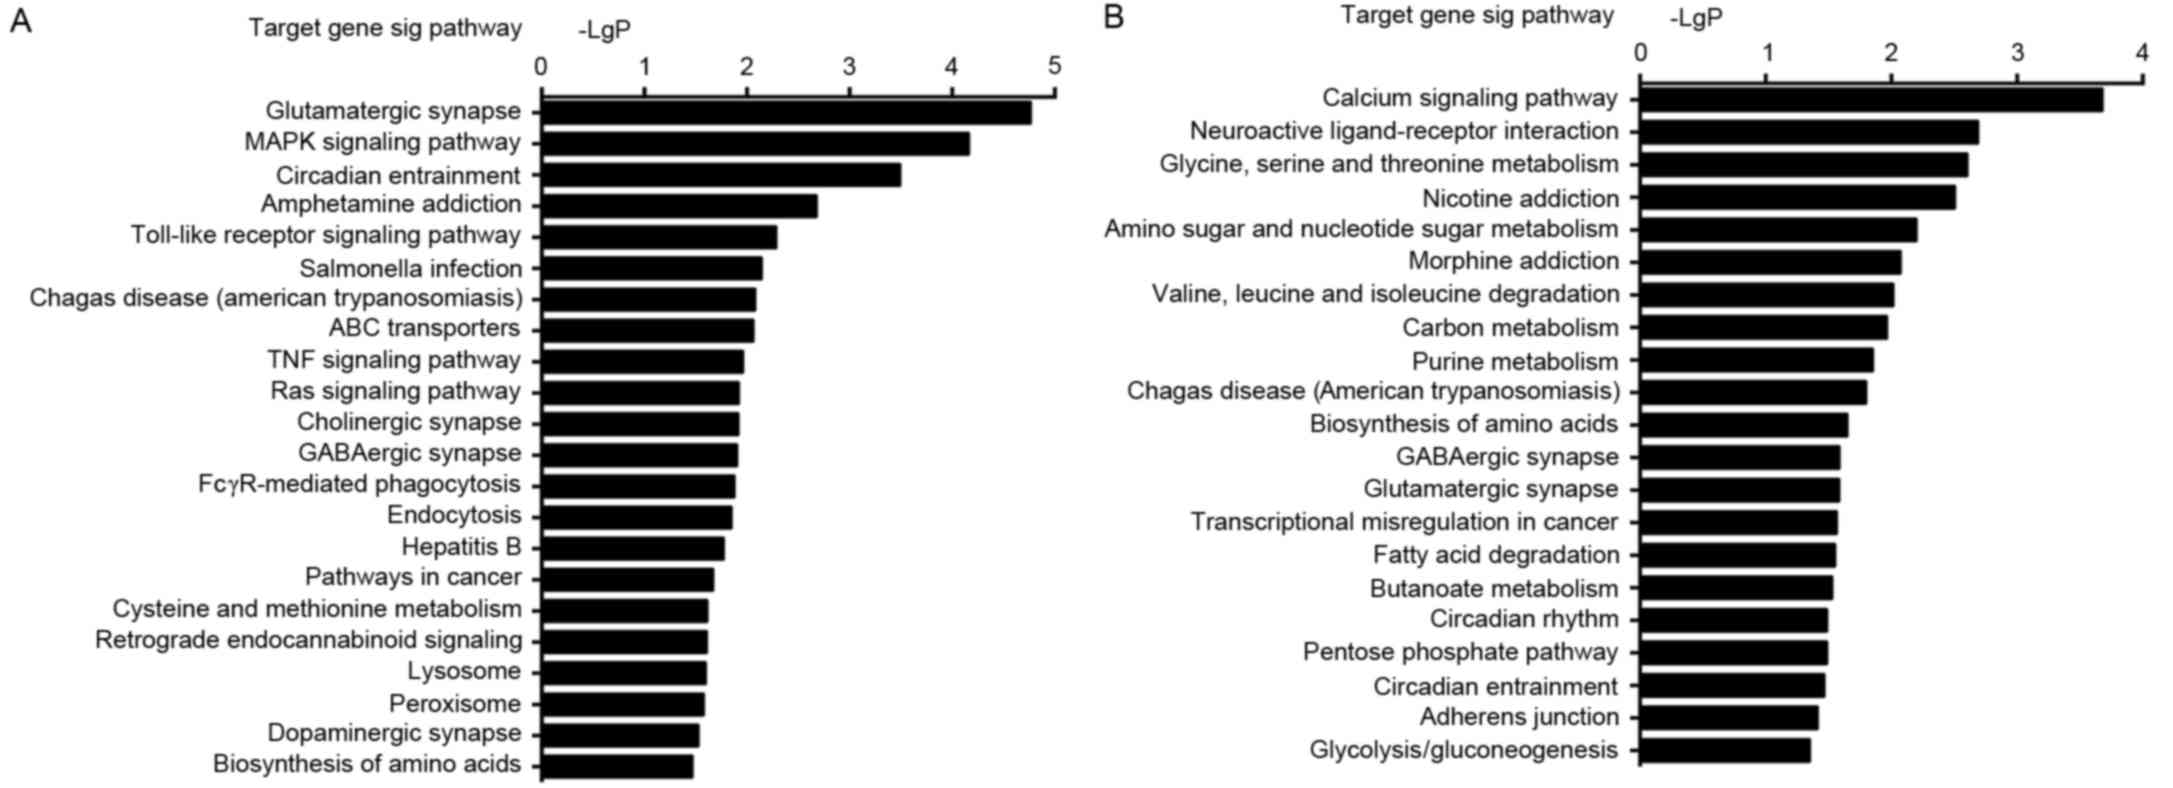
GO category and KEGG pathway
analysis
To investigate the specific roles of the nine
identified differentially expressed miRNAs in the regulation of
osteodifferentiation in BMSCs, target genes were predicted and
subjected to GO term and KEGG pathway analysis. GO analysis
demonstrated that the highly enriched GO terms targeted by these
dysregulated miRNAs were involved in multiple biological processes
such as cell differentiation, cell growth and cell migration
(Tables IV and V). KEGG pathway analysis revealed the
target genes to be highly enriched in 22 upregulated and 21
downregulated signaling pathways, including mitogen-activated
protein kinase (MAPK) signaling pathway, calcium signaling pathway
and Toll-like receptor signaling pathway (Fig. 4).
| Table IV.Predicted GO term enrichment of the
upregulated microRNAs in FK506-induced osteodifferentiation in rat
bone marrow stromal cells. |
Table IV.
Predicted GO term enrichment of the
upregulated microRNAs in FK506-induced osteodifferentiation in rat
bone marrow stromal cells.
| GO.ID | Category name | Fold
enrichment | P-value | FDR |
|---|
| GO:0051234 | Establishment of
localization | 1.60 |
1.93×10⁻¹⁰ |
5.02×10⁻⁷ |
| GO:0048522 | Positive regulation
of cellular process | 1.48 |
3.49×10⁻⁷ |
3.13×10⁻⁴ |
| GO:0048518 | Positive regulation
of biological process | 1.42 |
1.01×10⁻⁶ |
7.80×10⁻⁴ |
| GO:0009605 | Response to
external stimulus | 1.71 |
1.34×10⁻⁶ |
8.68×10⁻⁴ |
| GO:0006464 | Cellular protein
modification process | 1.55 |
1.61×10⁻⁶ |
8.68×10⁻⁴ |
| GO:0048731 | System
development | 1.42 |
2.65×10⁻⁶ |
1.30×10⁻³ |
| GO:2000278 | Regulation of DNA
biosynthetic process | 8.45 |
3.52×10⁻⁶ |
1.46×10⁻³ |
| GO:0007275 | Multicellular
organismal development | 1.38 |
6.08×10⁻⁶ |
2.04×10⁻³ |
| GO:0006873 | Cellular ion
homeostasis | 2.40 |
2.69×10⁻⁵ |
5.16×10⁻³ |
| GO:0048514 | Blood vessel
morphogenesis | 2.38 |
3.13×10⁻⁵ |
5.81×10⁻³ |
| GO:0016043 | Cellular component
organization | 1.33 |
6.33×10⁻⁵ |
9.08×10⁻³ |
| GO:0051247 | Positive regulation
of protein metabolic process | 1.85 |
8.64×10⁻⁵ |
1.08×10⁻² |
| GO:0006875 | Cellular metal ion
homeostasis | 2.36 |
9.88×10⁻⁵ |
1.19×10⁻² |
| GO:0008283 | Cell
proliferation | 1.60 |
1.02×10⁻⁴ |
1.19×10⁻² |
| GO:0007267 | Cell-cell
signaling | 1.86 |
1.26×10⁻⁴ |
1.33×10⁻² |
| GO:0034220 | Ion transmembrane
transport | 1.88 |
1.50×10⁻⁴ |
1.39×10⁻² |
| GO:0051352 | Negative regulation
of ligase activity | 1.34 | 1.60
10−4 |
1.39×10⁻² |
| GO:0012501 | Programmed cell
death | 1.60 |
1.76×10⁻⁴ |
1.48×10⁻² |
| GO:0007167 | Enzyme linked
receptor protein signaling pathway | 1.95 |
2.04×10⁻⁴ |
1.66×10⁻² |
| GO:0009653 | Anatomical
structure morphogenesis | 1.46 |
2.43×10⁻⁴ |
1.74×10⁻² |
| GO:1902531 | Regulation of
intracellular signal transduction | 1.61 |
3.03×10⁻⁴ |
1.98×10⁻² |
| GO:0051338 | Regulation of
transferase activity | 1.94 |
3.54×10⁻⁴ |
2.08×10⁻² |
| GO:0065009 | Regulation of
molecular function | 1.45 |
3.69×10⁻⁴ |
2.09×10⁻² |
| GO:0051270 | Regulation of
cellular component movement | 1.93 |
4.61×10⁻⁴ |
2.32×10⁻² |
| GO:0006915 | Apoptotic
process | 1.55 |
5.82×10⁻⁴ |
2.57×10⁻² |
| GO:0030334 | Regulation of cell
migration | 1.95 |
9.55×10⁻⁴ |
3.71×10⁻² |
| GO:0010647 | Positive regulation
of cell communication | 1.62 |
1.02×10⁻³ |
3.86×10⁻² |
| GO:0051046 | Regulation of
secretion | 1.90 |
1.12×10⁻³ |
4.21×10⁻² |
| GO:0006874 | Cellular calcium
ion homeostasis | 2.24 |
1.29×10⁻³ |
4.66×10⁻² |
| GO:0051928 | Positive regulation
of calcium ion transport | 3.73 |
1.35×10⁻³ |
4.76×10⁻² |
| Table V.Predicted GO term enrichment of the
downregulated microRNAs in FK506-induce osteodifferentiation in rat
bone marrow stromal cells. |
Table V.
Predicted GO term enrichment of the
downregulated microRNAs in FK506-induce osteodifferentiation in rat
bone marrow stromal cells.
| GO.ID | Category name | Fold
enrichment | P-value | FDR |
|---|
| GO:0044710 | Single-organism
metabolic process | 1.55 |
4.56×10⁻¹⁰ |
8.19×10⁻⁷ |
| GO:0071702 | Organic substance
transport | 1.98 |
5.32×10⁻⁹ |
5.73×10⁻⁶ |
| GO:0010648 | Negative regulation
of cell communication | 2.32 |
4.75×10⁻⁷ |
1.47×10⁻⁴ |
| GO:0042981 | Regulation of
apoptotic process | 2.00 |
3.06×10⁻⁶ |
5.15×10⁻⁴ |
| GO:0044237 | Cellular metabolic
process | 1.21 |
2.25×10⁻⁵ |
2.02×10⁻³ |
| GO:0048583 | Regulation of
response to stimulus | 1.52 |
3.12×10⁻⁵ |
2.58×10⁻³ |
| GO:0006464 | Cellular protein
modification process | 1.53 |
3.37×10⁻⁵ |
2.63×10⁻³ |
| GO:0030182 | Neuron
differentiation | 1.92 |
3.82×10⁻⁵ |
2.94×10⁻³ |
| GO:0050767 | Regulation of
neurogenesis | 2.31 |
5.02×10⁻⁵ |
3.57×10⁻³ |
| GO:0007399 | Nervous system
development | 1.65 |
5.04×10⁻⁵ |
3.57×10⁻³ |
| GO:0050804 | Regulation of
synaptic transmission | 3.04 |
5.12×10⁻⁵ |
3.58×10⁻³ |
| GO:0065009 | Regulation of
molecular function | 1.59 |
5.81×10⁻⁵ |
3.89×10⁻³ |
| GO:0016049 | Cell growth | 2.62 |
9.00×10⁻⁵ |
5.25×10⁻³ |
| GO:2000026 | Regulation of
multicellular organismal development | 1.73 |
9.04×10⁻⁵ |
5.25×10⁻³ |
| GO:0044249 | Cellular
biosynthetic process | 1.34 |
9.74×10⁻⁵ |
5.35×10⁻³ |
| GO:0030799 | Regulation of
cyclic nucleotide metabolic process | 4.18 |
1.44×10⁻⁴ |
7.08×10⁻³ |
| GO:0006954 | Inflammatory
response | 2.38 |
1.69×10⁻⁴ |
7.71×10⁻³ |
| GO:0031100 | Organ
regeneration | 4.52 |
1.72×10⁻⁴ |
7.71×10⁻³ |
| GO:0043269 | Regulation of ion
transport | 2.25 |
1.97×10⁻⁴ |
8.51×10⁻³ |
| GO:0042127 | Regulation of cell
proliferation | 1.72 |
2.86×10⁻⁴ |
9.77×10⁻³ |
| GO:0045595 | Regulation of cell
differentiation | 1.68 |
4.15×10⁻⁴ |
1.31×10⁻² |
| GO:0023014 | Signal transduction
by phosphorylation | 2.07 |
4.87×10⁻⁴ |
1.47×10⁻² |
| GO:0055012 | Ventricular cardiac
muscle cell differentiation | 10.00 |
5.82×10⁻⁴ |
1.67×10⁻² |
| GO:0051592 | Response to calcium
ion | 3.77 |
6.68×10⁻⁴ |
1.84×10⁻² |
| GO:0000165 | MAPK cascade | 1.99 |
1.43×10⁻³ |
3.16×10⁻² |
| GO:0017156 | Calcium
ion-dependent exocytosis | 4.78 |
1.56×10⁻³ |
3.31×10⁻² |
| GO:0030099 | Myeloid cell
differentiation | 2.33 |
2.16×10⁻³ |
4.00×10⁻² |
| GO:0035051 | Cardiocyte
differentiation | 3.35 |
2.78×10⁻³ |
4.78×10⁻² |
| GO:0002520 | Immune system
development | 1.76 |
2.81×10⁻³ |
4.78×10⁻² |
| GO:0045622 | Regulation of
T-helper cell differentiation | 10.00 |
2.98×10⁻³ |
4.85×10⁻² |
Verification of the target genes of
differentially expressed miRNAs
Osteodifferentiation is driven by a series of
complex events that result in the activation of specific
transcription factors. Of the predicted target genes and
differentially regulated function analysis, only those closely
related to osteoblast differentiation, ossification and signal
transduction are listed in Table
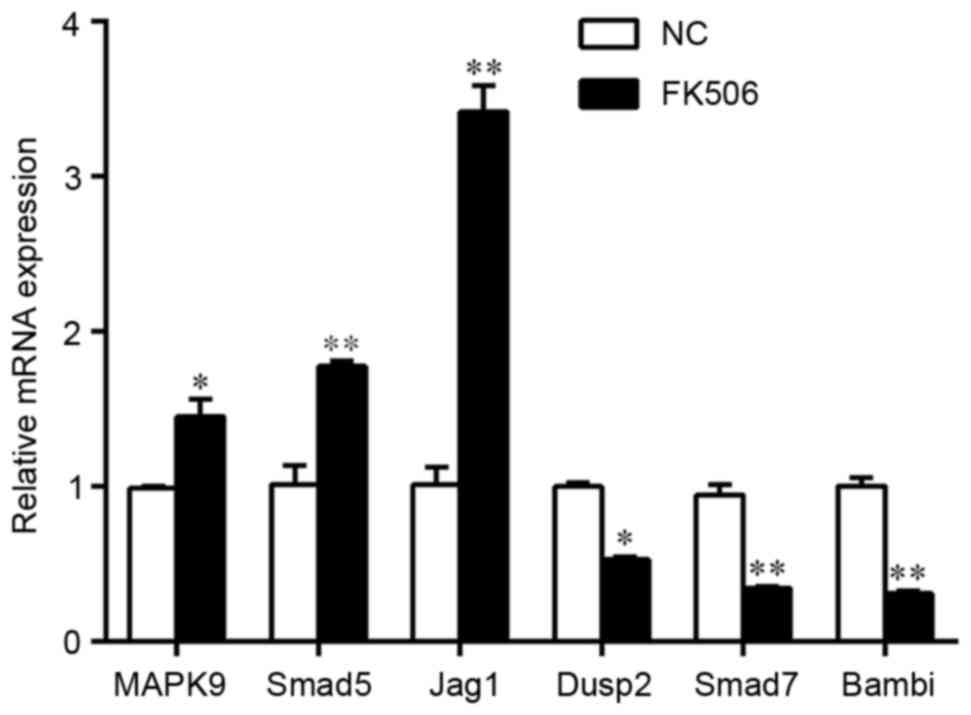
VI. RT-qPCR demonstrated that MAPK9, Smad5 and jagged 1 (Jag1),
which are positive regulators of osteogenesis, were significantly
upregulated in FK506-induced rat BMSCs undergoing osteogenic
differentiation, compared with the untreated control (Fig. 5); whereas dual-specificity
phosphatase 2 (Dusp2), Smad7 and BMP and activin membrane-bound
inhibitor (Bambi), which are negative regulators of
osteodifferentiation, were demonstrated to be significantly
downregulated. The results suggested that FK506 treatment may
induce osteogenic differentiation by regulating the expression of
specific target genes of these differentially expressed miRNAs.
| Table VI.Predicted target genes and functions
of microRNAs associated with FK506-induced osteodifferentiation in
rat bone marrow stromal cells. |
Table VI.
Predicted target genes and functions
of microRNAs associated with FK506-induced osteodifferentiation in
rat bone marrow stromal cells.
| microRNA | Target genes | Function |
|---|
|
rno-miR-101b-3p | Smad5 | Osteoblast
differentiation, ossification |
|
| TGFβR1 | Receptor for growth
factor, protein metabolism |
|
rno-miR-106b-5p | Bambi | Stem cell
differentiation, TGF-β receptor signaling |
|
| Dusp2 | Tissue development,
signal transduction |
|
| MAP3K2, MAP3K8 and
MAPK9 | MAPK cascade,
proliferation and differentiation |
|
| Smad7 | Regulator of
BMP/TGF-β signaling, osteogenesis |
| rno-miR-142-3p | TGFβR1 | Receptor for growth
factor, protein metabolism |
| rno-miR-27a-3p | MAPK9 | MAPK cascade,
proliferation and differentiation |
|
| Smad5 | Osteoblast
differentiation, ossification |
|
| CBFβ | Osteoblast
differentiation, osteogenesis |
|
rno-miR-218a-2-3p | Wnt5a | Stem cell
differentiation and proliferation |
|
| Jag1 | Mesenchymal cell
differentiation, osteogenesis |
| rno-let-7a-5p | TGFβR1 | Receptor for growth
factor, protein metabolism |
|
| AcvR1C | Receptor for growth
and differentiation factor |
|
| MAPK6 and
MAPK9 | MAPK cascade,
proliferation and differentiation |
Discussion
FK506 is a powerful and clinically useful
immunosuppressant, which has been widely used as a treatment in
organ transplantation, atopic dermatitis and rheumatoid arthritis
(15). During the treatment of
rheumatoid arthritis, a number of studies demonstrated that FK506
treatment could increase bone formation, inhibit osteoclastic bone
resorption and improve clinical symptoms (16,17).
In addition, it has been reported that FK506 exposure may promote
osteogenic and chondrogenic differentiation (18,19),
and a change of immunosuppressive monotherapy from cyclosporin A to
FK506 may be able to reverse bone loss (20), indicating that FK506 may be a
potential treatment for bone defects.
However, other studies demonstrated that FK506
treatment may result in osteoporosis, prevent osteoblast
differentiation and/or cause significant bone loss (5,6,21).
These conflicting results may be due to different drug
concentrations administered or induction time, which is crucial in
the process of bone metabolism. Low-dose and short-term application
of FK506 may be able to promote the early stage of osteogenesis. By
contrast, long-term administration of FK506 led to accelerated bone
formation and bone resorption (22). The present study demonstrated that
FK506 treatment in rat BMSCs had the most significant osteogenic
potential when administered at a dose of 50 nM for 7 days; whereas
high concentrations of FK506 or longer periods of stimulation
reduced the osteogenic potential, suggesting that the possible side
effects of drug cytotoxicity may inhibit the osteoinduction of
BMSCs.
miRNAs serve a key role in regulating
osteodifferentiation (9). The
present study identified and verified five upregulated and four
downregulated miRNAs that were differentially expressed in
FK506-induced rat BMSCs undergoing osteogenic differentiation, some
of which have been reported as positive and/or negative regulators
of osteogenesis. For example, miR-27a, an early negative regulator
of osteogenesis, was revealed to delay osteoblast differentiation
by suppressing SATB2 expression (23). By contrast, a different study
reported that miR-27a may be able to promote osteoblast
differentiation by repressing the expression of secreted
frizzled-related protein at the transcriptional level (24). A previous study revealed that
miR-193a was downregulated during osteogenic differentiation of
human adipose-derived stem cells and the osteoporotic fractures;
however, the mechanism has not been elucidated (25). In addition, miR-218 was reported to
be upregulated during osteodifferentiation and its overexpression
could significantly increase human adipose tissue-derived stem
cells osteogenic differentiation (26). However, results from the present
study are not fully in line with the results of previous studies,
which may be explained by the variability of mesenchymal stem cells
from different tissues and culture microenvironments.
To further investigate the molecular mechanisms of
FK506-induced osteogenic differentiation in rat BMSCs, functional
analysis were performed. Predicted miRNA target genes, such as
MAPK9 and Dusp2, were verified by RT-qPCR. Highly enriched KEGG
pathway analysis indicated that MAPK9 and Dusp2 may serve a role
through the MAPK signaling pathway, which is involved in a number
of cellular functions, such as differentiation, proliferation and
cell death (27). Of these, the
physiological functions of MAPK9 [(also known as c-Jun N-terminal
kinase 2 (JNK2)] in osteodifferentiation and bone formation have
been investigated previously (28). MAPK9 activity is essential for the
expression of activating transcription factor 4, and its
overexpression may enhance mineral deposition that is essential in
the late stages osteogenic differentiation (29). Activation of JNKs is also essential
for bone morphogenetic protein (BMP) 9-induced osteodifferentiation
of mesenchymal stem cells (30).
The expression of Dusp2, an inhibitor of osteoblast
differentiation, was revealed to be downregulated during osteogenic
differentiation (31,32). The DUSP subfamily (DUSP1, DUSP2,
DUSP4 and DUSP5) of nucleus-inducible MAPK phosphatases are rapidly
induced by growth factors or stress signals, such as mitogens,
oxidative stress, heat shock and hypoxia and localize exclusively
to the nucleus (32,33). In the present study, MAPK9
expression was revealed to be significantly upregulated in rat
BMSCs stimulated with 50 nM FK506 for 7 days, whereas the
expression of Dusp2 was downregulated. These data suggested that
MAPK9 and Dusp2 are important regulatory components in the process
of FK506-induced osteogenesis in rat BMSCs.
Verification of the predicted target genes also
demonstrated that Smad5 expression was upregulated, and the
expression levels of Smad7 and Bambi were downregulated. Smad5,
Smad7 and Bambi belong to the transforming growth factor (TGF)
-β/BMP superfamily, which are involved in numerous cellular
processes and bone formation (34). Previous studies have indicated that
FK506 may be able to induce osteogenic and chondrogenic
differentiation by regulating Smads (18,19),
the downstream effectors of TGF-β/Smad signaling pathway. Smad5 is
a positive regulator in BMP/Smad signaling, and was previously
demonstrated to be highly expressed in genistein-induced osteogenic
differentiation of human BMSCs (35). Smad5 protein degradation in the
Smurf1-overexpression C2C12 mouse myoblast cells was demonstrated
to cause the inability to undergo BMP-induced osteoblast
differentiation and Smad1/5-knockout mice exhibited severe
chondrodysplasia (36,37). Smad7 and Bambi act as negative
regulators of osteogenic differentiation: Smad7 was reported to
inhibit proliferation, differentiation and mineralization of mouse
osteoblastic cells (38); and
Bambi, a target gene of miR-20a, was demonstrated to inhibit the
osteogenesis of human BMSCs (39).
In the present study, although the target genes of differentially
expressed miRNAs were not highly enriched in the TGF-β/Smad
signaling pathway, it may be concluded that these differentially
expressed miRNAs may promote FK506-induced osteogenic
differentiation by regulating the expression of their target genes,
such as Smad5, Smad7 and Bambi.
In conclusion, the results of the present study
demonstrated that FK506 treatment was able to significantly promote
osteogenic differentiation of rat BMSCs at the concentration of 50
nM. Following 7 day stimulation, several miRNAs were identified as
differentially expressed and may regulate osteodifferentiation by
targeting genes that are involved in bone formation. These
preliminary results may provide an experimental basis for further
research on the functions of miRNAs in FK506-induced osteogenic
differentiation.
Acknowledgements
The present study was supported by a grant from the
Major Scientific and Technological Research Projects of The Science
and Technology Commission of Shanghai Municipality (grant no.
14JC1490600) and a grant from The Natural Science Foundation of
Shanghai (grant no. 15ZR1406200).
References
|
1
|
Tang L, Ebara S, Kawasaki S, Wakabayashi
S, Nikaido T and Takaoka K: FK506 enhanced osteoblastic
differentiation in mesenchymal cells. Cell Biol Int. 26:75–84.
2002. View Article : Google Scholar : PubMed/NCBI
|
|
2
|
Byun YK, Kim KH, Kim SH, Kim YS, Koo KT,
Kim TI, Seol YJ, Ku Y, Rhyu IC and Lee YM: Effects of
immunosuppressants, FK506 and cyclosporin A, on the osteogenic
differentiation of rat mesenchymal stem cells. J Periodontal
Implant Sci. 42:73–80. 2012. View Article : Google Scholar : PubMed/NCBI
|
|
3
|
Iejima D, Lee MH, Kojima H, Yoshikawa T,
Wang PC and Uemura T: Cbfa1 expression is enhanced by the
immunosuppressant FK506 in the osteoblastic cell line: UMR106.
Mater Sci Eng: C. 24:845–850. 2004. View Article : Google Scholar
|
|
4
|
Yoshikawa T, Nakajima H, Yamada E, Akahane
M, Dohi Y, Ohgushi H, Tamai S and Ichijima K: In vivo osteogenic
capability of cultured allogeneic bone in porous hydroxyapatite:
Immunosuppressive and osteogenic potential of FK506 in vivo. J Bone
Miner Res. 15:1147–1157. 2000. View Article : Google Scholar : PubMed/NCBI
|
|
5
|
Fukunaga J, Yamaai T, Yamachika E,
Ishiwari Y, Tsujigiwa H, Sawaki K, Lee YJ, Ueno T, Kirino S,
Mizukawa N, et al: Expression of osteoclast differentiation factor
and osteoclastogenesis inhibitory factor in rat osteoporosis
induced by immunosuppressant FK506. Bone. 34:425–431. 2004.
View Article : Google Scholar : PubMed/NCBI
|
|
6
|
Sun L, Blair HC, Peng Y, Zaidi N, Adebanjo
OA, Wu XB, Wu XY, Iqbal J, Epstein S, Abe E, et al: Calcineurin
regulates bone formation by the osteoblast. Proc Natl Acad Sci USA.
102:17130–17135. 2005. View Article : Google Scholar : PubMed/NCBI
|
|
7
|
Xu JF, Yang Gh, Pan XH, Zhang SJ, Zhao C,
Qiu BS, Gu HF, Hong JF, Cao L, Chen Y, et al: Altered microRNA
expression profile in exosomes during osteogenic differentiation of
human bone marrow-derived mesenchymal stem cells. PLoS One.
9:e1146272014. View Article : Google Scholar : PubMed/NCBI
|
|
8
|
Martin EC, Qureshi AT, Dasa V, Freitas MA,
Gimble JM and Davis TA: MicroRNA regulation of stem cell
differentiation and diseases of the bone and adipose tissue:
Perspectives on miRNA biogenesis and cellular transcriptome.
Biochimie. 124:98–111. 2016. View Article : Google Scholar : PubMed/NCBI
|
|
9
|
Fang S, Deng Y, Gu P and Fan X: MicroRNAs
regulate bone development and regeneration. Int J Mol Sci.
16:8227–8253. 2015. View Article : Google Scholar : PubMed/NCBI
|
|
10
|
Yang M, Pan Y and Zhou Y: miR-96 promotes
osteogenic differentiation by suppressing HBEGF-EGFR signaling in
osteoblastic cells. FEBS Lett. 588:4761–4768. 2014. View Article : Google Scholar : PubMed/NCBI
|
|
11
|
Hu N, Feng C, Jiang Y, Miao Q and Liu H:
Regulative effect of Mir-205 on osteogenic differentiation of bone
mesenchymal stem cells (BMSCs): Possible role of SATB2/Runx2 and
ERK/MAPK pathway. Int J Mol Sci. 16:10491–10506. 2015. View Article : Google Scholar : PubMed/NCBI
|
|
12
|
Dai W, Dong J, Fang T and Uemura T:
Stimulation of osteogenic activity in mesenchymal stem cells by
FK506. J Biomed Mater Res A. 86:235–243. 2008. View Article : Google Scholar : PubMed/NCBI
|
|
13
|
Livak KJ and Schmittgen TD: Analysis of
relative gene expression data using real-time quantitative PCR and
the 2(−Delta Delta C(T)) Method. Methods. 25:402–408. 2001.
View Article : Google Scholar : PubMed/NCBI
|
|
14
|
Benjamini Y and Hochberg Y: Controlling
the False Discovery Rate: A Practical and powerful Approach to
multiple testing. J R Stat Soc B. 57:289–300. 1995.
|
|
15
|
Dumont FJ: FK506, an immunosuppressant
targeting calcineurin function. Curr Med Chem. 7:731–748. 2000.
View Article : Google Scholar : PubMed/NCBI
|
|
16
|
Kang KY, Ju JH, Song YW, Yoo DH, Kim HY
and Park SH: Tacrolimus treatment increases bone formation in
patients with rheumatoid arthritis. Rheumatol Int. 33:2159–2163.
2013. View Article : Google Scholar : PubMed/NCBI
|
|
17
|
Yago T, Nanke Y, Kawamoto M, Yamanaka H
and Kotake S: Tacrolimus potently inhibits human osteoclastogenesis
induced by IL-17 from human monocytes alone and suppresses human
Th17 differentiation. Cytokine. 59:252–257. 2012. View Article : Google Scholar : PubMed/NCBI
|
|
18
|
Kugimiya F, Yano F, Ohba S, Igawa K,
Nakamura K, Kawaguchi H and Chung UI: Mechanism of osteogenic
induction by FK506 via BMP/Smad pathways. Biochem Biophys Res
Commun. 338:872–879. 2005. View Article : Google Scholar : PubMed/NCBI
|
|
19
|
Tateishi K, Higuchi C, Ando W, Nakata K,
Hashimoto J, Hart DA, Yoshikawa H and Nakamura N: The
immunosuppressant FK506 promotes development of the chondrogenic
phenotype in human synovial stromal cells via modulation of the
Smad signaling pathway. Osteoarthritis Cartilage. 15:709–718. 2007.
View Article : Google Scholar : PubMed/NCBI
|
|
20
|
Spolidorio LC, Nassar PO, Nassar CA,
Spolidorio DM and Muscará MN: Conversion of immunosuppressive
monotherapy from cyclosporin a to tacrolimus reverses bone loss in
rats. Calcif Tissue Int. 81:114–123. 2007. View Article : Google Scholar : PubMed/NCBI
|
|
21
|
Luo L, Shi Y, Bai Y, Zou Y, Cai B, Tao Y,
Lin T and Wang L: Impact of tacrolimus on bone metabolism after
kidney transplantation. Int Immunopharmacol. 13:69–72. 2012.
View Article : Google Scholar : PubMed/NCBI
|
|
22
|
Kaihara S, Bessho K, Okubo Y, Sonobe J,
Kusumoto K, Ogawa Y and Iizuka T: Effect of FK506 on osteoinduction
by recombinant human bone morphogenetic protein-2. Life Sci.
72:247–256. 2002. View Article : Google Scholar : PubMed/NCBI
|
|
23
|
Hassan MQ, Gordon JAR, Beloti MM, Croce
CM, van Wijnen AJ, Stein JL, Stein GS and Lian JB: A network
connecting Runx2, SATB2 and the miR-23a- 27a-24-2 cluster regulates
the osteoblast differentiation program. Proc Natl Acad Sci USA.
107:19879–19884. 2010. View Article : Google Scholar : PubMed/NCBI
|
|
24
|
Guo D, Li Q, Lv Q, Wei Q, Cao S and Gu J:
MiR-27a targets sFRP1 in hFOB cells to regulate proliferation,
apoptosis and differentiation. PLoS One. 9:e913542014. View Article : Google Scholar : PubMed/NCBI
|
|
25
|
Zhang Zj Zhang H, Kang Y, Sheng PY, Ma YC,
Yang ZB, Zhang ZQ, Fu M, He AS and Liao WM: miRNA expression
profile during osteogenic differentiation of human adipose-derived
stem cells. J Cell Biochem. 113:888–898. 2012. View Article : Google Scholar : PubMed/NCBI
|
|
26
|
Zhang WB, Zhong WJ and Wang L: A
signal-amplification circuit between miR-218 and Wnt/β-catenin
signal promotes human adipose tissue-derived stem cells osteogenic
differentiation. Bone. 58:59–66. 2014. View Article : Google Scholar : PubMed/NCBI
|
|
27
|
Seger R and Krebs EG: The MAPK signaling
cascade. FASEB J. 9:726–735. 1995.PubMed/NCBI
|
|
28
|
Wang P, Xiong Y, Ma C, Shi T and Ma D:
Molecular cloning and characterization of novel human JNK2 (MAPK9)
transcript variants that show different stimulation activities on
AP-1. BMB Rep. 43:738–743. 2010. View Article : Google Scholar : PubMed/NCBI
|
|
29
|
Matsuguchi T, Chiba N, Bandow K, Kakimoto
K, Masuda A and Ohnishi T: JNK activity is essential for Atf4
expression and late-stage osteoblast differentiation. J Bone Miner
Res. 24:398–410. 2009. View Article : Google Scholar : PubMed/NCBI
|
|
30
|
Zhao YF, Xu J, Wang WJ, Wang J, He JW, Li
L, Dong Q, Xiao Y, Duan XL, Yang X, et al: Activation of JNKs is
essential for BMP9-induced osteogenic differentiation of
mesenchymal stem cells. BMB Rep. 46:422–427. 2013. View Article : Google Scholar : PubMed/NCBI
|
|
31
|
Li Z, Hassan MQ, Jafferji M, Aqeilan RI,
Garzon R, Croce CM, van Wijnen AJ, Stein JL, Stein GS and Lian JB:
Biological functions of miR-29b contribute to positive regulation
of osteoblast differentiation. J Biol Chem. 284:15676–15684. 2009.
View Article : Google Scholar : PubMed/NCBI
|
|
32
|
Caunt CJ, Rivers CA, Conway-Campbell BL,
Norman MR and McArdle CA: Epidermal growth factor receptor and
protein kinase C signaling to ERK2: Spatiotemporal regulation of
ERK2 by dual specificity phosphatases. J Biol Chem. 283:6241–6252.
2008. View Article : Google Scholar : PubMed/NCBI
|
|
33
|
Jeffrey KL, Camps M, Rommel C and Mackay
CR: Targeting dual-specificity phosphatases: Manipulating MAP
kinase signalling and immune responses. Nat Rev Drug Discov.
6:391–403. 2007. View
Article : Google Scholar : PubMed/NCBI
|
|
34
|
Chen G, Deng C and Li YP: TGF-β and BMP
signaling in osteoblast differentiation and bone formation. Int J
Biol Sci. 8:272–288. 2012. View Article : Google Scholar : PubMed/NCBI
|
|
35
|
Dai J, Li Y, Zhou H, Chen J, Chen M and
Xiao Z: Genistein promotion of osteogenic differentiation through
BMP2/SMAD5/RUNX2 signaling. Int J Biol Sci. 9:1089–1098. 2013.
View Article : Google Scholar : PubMed/NCBI
|
|
36
|
Ying SX, Hussain ZJ and Zhang YE: Smurf1
facilitates myogenic differentiation and antagonizes the bone
morphogenetic protein-2-induced osteoblast conversion by targeting
Smad5 for degradation. J Biol Chem. 278:39029–39036. 2003.
View Article : Google Scholar : PubMed/NCBI
|
|
37
|
Retting KN, Song B, Yoon BS and Lyons KM:
BMP canonical Smad signaling through Smad1 and Smad5 is required
for endochondral bone formation. Development. 136:1093–1104. 2009.
View Article : Google Scholar : PubMed/NCBI
|
|
38
|
Yano M, Inoue Y, Tobimatsu T, Hendy G,
Canaff L, Sugimoto T, Seino S and Kaji H: Smad7 inhibits
differentiation and mineralization of mouse osteoblastic cells.
Endocr J. 59:653–662. 2012. View Article : Google Scholar : PubMed/NCBI
|
|
39
|
Zhang JF, Fu WM, He ML, Xie WD, Lv Q, Wan
G, Li G, Wang H, Lu G, Hu X, et al: MiRNA-20a promotes osteogenic
differentiation of human mesenchymal stem cells by co-regulating
BMP signaling. RNA Biol. 8:829–838. 2011. View Article : Google Scholar : PubMed/NCBI
|