Introduction
Hypertrophic cardiomyopathy (HCM) is a complex and
relatively common genetic heart disease, which is characterized by
unexplained asymmetric or symmetric cardiac hypertrophy,
interstitial fibrosis and cardiomyocyte disarray (1). HCM is a prevalent disease that
affects 0.2% of the global population (2). Patients with HCM may suffer from
early sudden cardiac death which is most common in individuals
<35 years of age (3,4). Therefore, it is necessary to identify
effective therapeutic strategies and investigate the etiology of
HCM.
The development of large scale microarray analyses
has led to research at the gene level, which may be a powerful and
informative means of investigating the mechanism of a disease
(5). HCM is predominantly induced
by mutations in genes encoding sarcomere proteins, including myosin
heavy chain 7, myosin light chain 2 and myosin binding protein C,
cardiac (6,7). HCM-associated genes are typically
selected by analyzing differentially expressed genes (DEGs).
However, a previous study identified inconsistencies between
numerous gene signatures across different studies of the same
disease (8). A potentially more
effective method is to use pathway analysis in order to evaluate
disease-associated biomarkers.
Pathway analysis has been widely used in previous
studies (9–11) and is becoming the primary method of
obtaining a deep insight into biological processes (12). The identification of active
pathways that differ between two conditions is of increased utility
compared with a list of DEGs (10). However, existing methods primarily
utilize pathway repositories, including the Kyoto Encyclopedia of
Genes and Genomes (13), to
evaluate whether a pathway is significant by assigning a P-value to
the pathway, an approach which focuses on the static regulation
between genes (14,15). Analysis of dynamic regulation or
network rewiring may reveal important information which may not be
identified in static conditions (16). Interactions between molecules may
alter in different tissues and these alterations are associated
with disease progression. Therefore, novel pathway-based biomarkers
may be identified by studying dynamic regulation and network
rewiring among molecules, in contrast with investigations which
only examine differential expression.
In the present study, a novel method was developed
to identify pathway-based biomarkers in HCM, by investigating
interactions between molecules associated with pathogenesis through
a co-expression network strategy. HCM-associated microarray
expression data were downloaded from the European Molecular Biology
Laboratory-European Bioinformatics Institute (EMBL-EBI) database.
The co-expression network was constructed using an empirical Bayes
(EB) approach following assignment of a weight value for each
pathway. A random model was constructed to define the thresholds to
select differential pathways. Pathway enrichment analysis of DEGs,
based on the Database for Annotation, Visualization and Integrated
Discovery (DAVID) test, was implemented to verify the feasibility
of the novel method.
Materials and methods
Data collection and preprocessing
The HCM-associated microarray expression data, under
accession number E-GEOD-36961, were downloaded from the EMBL-EBI
database (http://www.ebi.ac.uk/arrayexpress/). In gene
expression profile E-GEOD-36961, there were 39 healthy subjects and
106 HCM samples. In order to assess the quality of the data,
standard preprocessing of microarray probe data was performed. This
preprocessing included the following successive steps: Background
correction using robust multiarray analysis (17); normalization using the quartile
function to eliminate the influence of nonspecific hybridization
(18); perfect match correction
using the MAS5.0 algorithm (19);
and calculation of expression values from probe intensities. The
expression value for every gene was acquired, including 37,846
genes from 145 samples (39 healthy and 106 HCM).
Pathway data
Reactome is a database which includes numerous
pathways in Homo sapiens and a number of reference species,
offering an infrastructure for computation across the biological
reaction network (20). Human
biological pathways were downloaded from the Reactome pathway
database (reactome.org). A total of 1,675 pathways
were obtained. In order to ensure the validity of the pathways,
pathways in which the gene number was ≤2 were discarded. Finally, a
total of 1,639 pathways were determined as background pathways.
Construction of a co-expression
network using an EB approach
Numerous methods have been demonstrated for
co-expression analysis to identify co-expression gene pairs, which
include EB (21), Arabidopsis
Co-expression Tool (22) and WGCNA
(23). In the present study, an EB
framework was implemented, which offered a false discovery rate
(FDR)-controlled list of the gene pairs of interest (21).
The mean gene number (N) for the 1,639 background
pathways was computed based on N=overall gene number for background
pathways (73,099)/the number of background pathways (1,639);
therefore, N=44.6. In order to facilitate the analysis, the mean
gene number was subsequently defined as N=44.
The gene number of each pathway was termed A, and
the number of intersections between each pathway and the gene
expression profile was termed B. The informative pathways used in
the present study were screened out according to the following
conditions: B>5; and the ratio B:A>0.9. Therefore, a total of
1,074 informative pathways were selected for further
investigation.
Subsequently, the EB approach developed by Dawson
and Kendziorski (24) was used to
identify co-expression gene pairs among the genes in each
informative pathway and construct a co-expression network. The
number of possible gene pairs of each informative pathway was
termed C [C=A × (A-1)/2]. In the EB method, the identification of
co-expression gene pairs was implemented based on the following
steps: Three inputs of matrix X; the conditions array; and the
pattern object required. The expression levels in an m ×
n matrix of X, where m=the number of genes under any
informative pathway and n=the total number of representative
pathways, were normalized. Subsequently, the members of the
conditions array with length n took values in 1, 2, ……
K, where K indicated the number of conditions. Based
on matrix X and the conditions array, intra-group correlations for
all gene pairs were computed, and M matrix of correlations
was obtained. The Mclust algorithm (25) was used to initialize the
hyper-parameters via the initializeHP function of the EBcoexpress
package (26), to discover the
component normal mixture model which best fitted the correlations
of M. The crit.fun function of EBcoexpress package (26), was used to define a threshold by
controlling the posterior probabilities of co-expression to extract
particular co-expression gene pairs. Gene pairs with FDR ≤0.05 were
chosen to construct the co-expression network. The number of
interactions in one pathway co-expression network was termed D, and
D/C was recorded as the weight value of the pathway.
Identification of differential
pathways
In an attempt to identify differential pathways
between HCM and normal samples, a random model consisting of G
genes was constructed. G genes were randomly selected from gene
expression profiles and the weight values for each pathway were
calculated using the EB approach. This step was repeated 10,000
times and the weight values were listed in descending order. The
FDR for the 100th weight value was set at 0.01 (weight
value=0.01057). The pathways with a weight value >0.01057 were
considered to be differential pathways.
Identification of DEGs
As previously demonstrated, differential gene
expression levels are associated with disease severity. In the
current study, the identification of DEGs between HCM and normal
samples was performed using the significance analysis of
microarrays (SAM) package. The samr function of the SAM package was
used to extract the genes which exhibited statistically significant
differential expression. Each gene was assigned a score according
to the difference in gene expression compared with the standard
deviation of repeated measurements for this gene. Genes with scores
above the threshold were considered to be potentially significant.
The percentage of falsely significant genes relative to the
significant genes was defined as the FDR. In order to increase the
stringency for differential gene expression, the delta value was
determined using the function SAMR.compute.delta.table. DEGs in HCM
were identified for further analysis with the delta threshold value
of 7.48.
Pathway analyses for DEGs
In order to further investigate the biological
functions of DEGs, Reactome pathway enrichment analysis was
conducted through DAVID (27) by
means of the Expression Analysis Systematic Explorer (EASE) test
(28). The EASE score was applied
to identify the significant categories. In the present study, the
pathways with P<0.05 were considered to be significant
pathways.
Results
Identification of differential
pathways
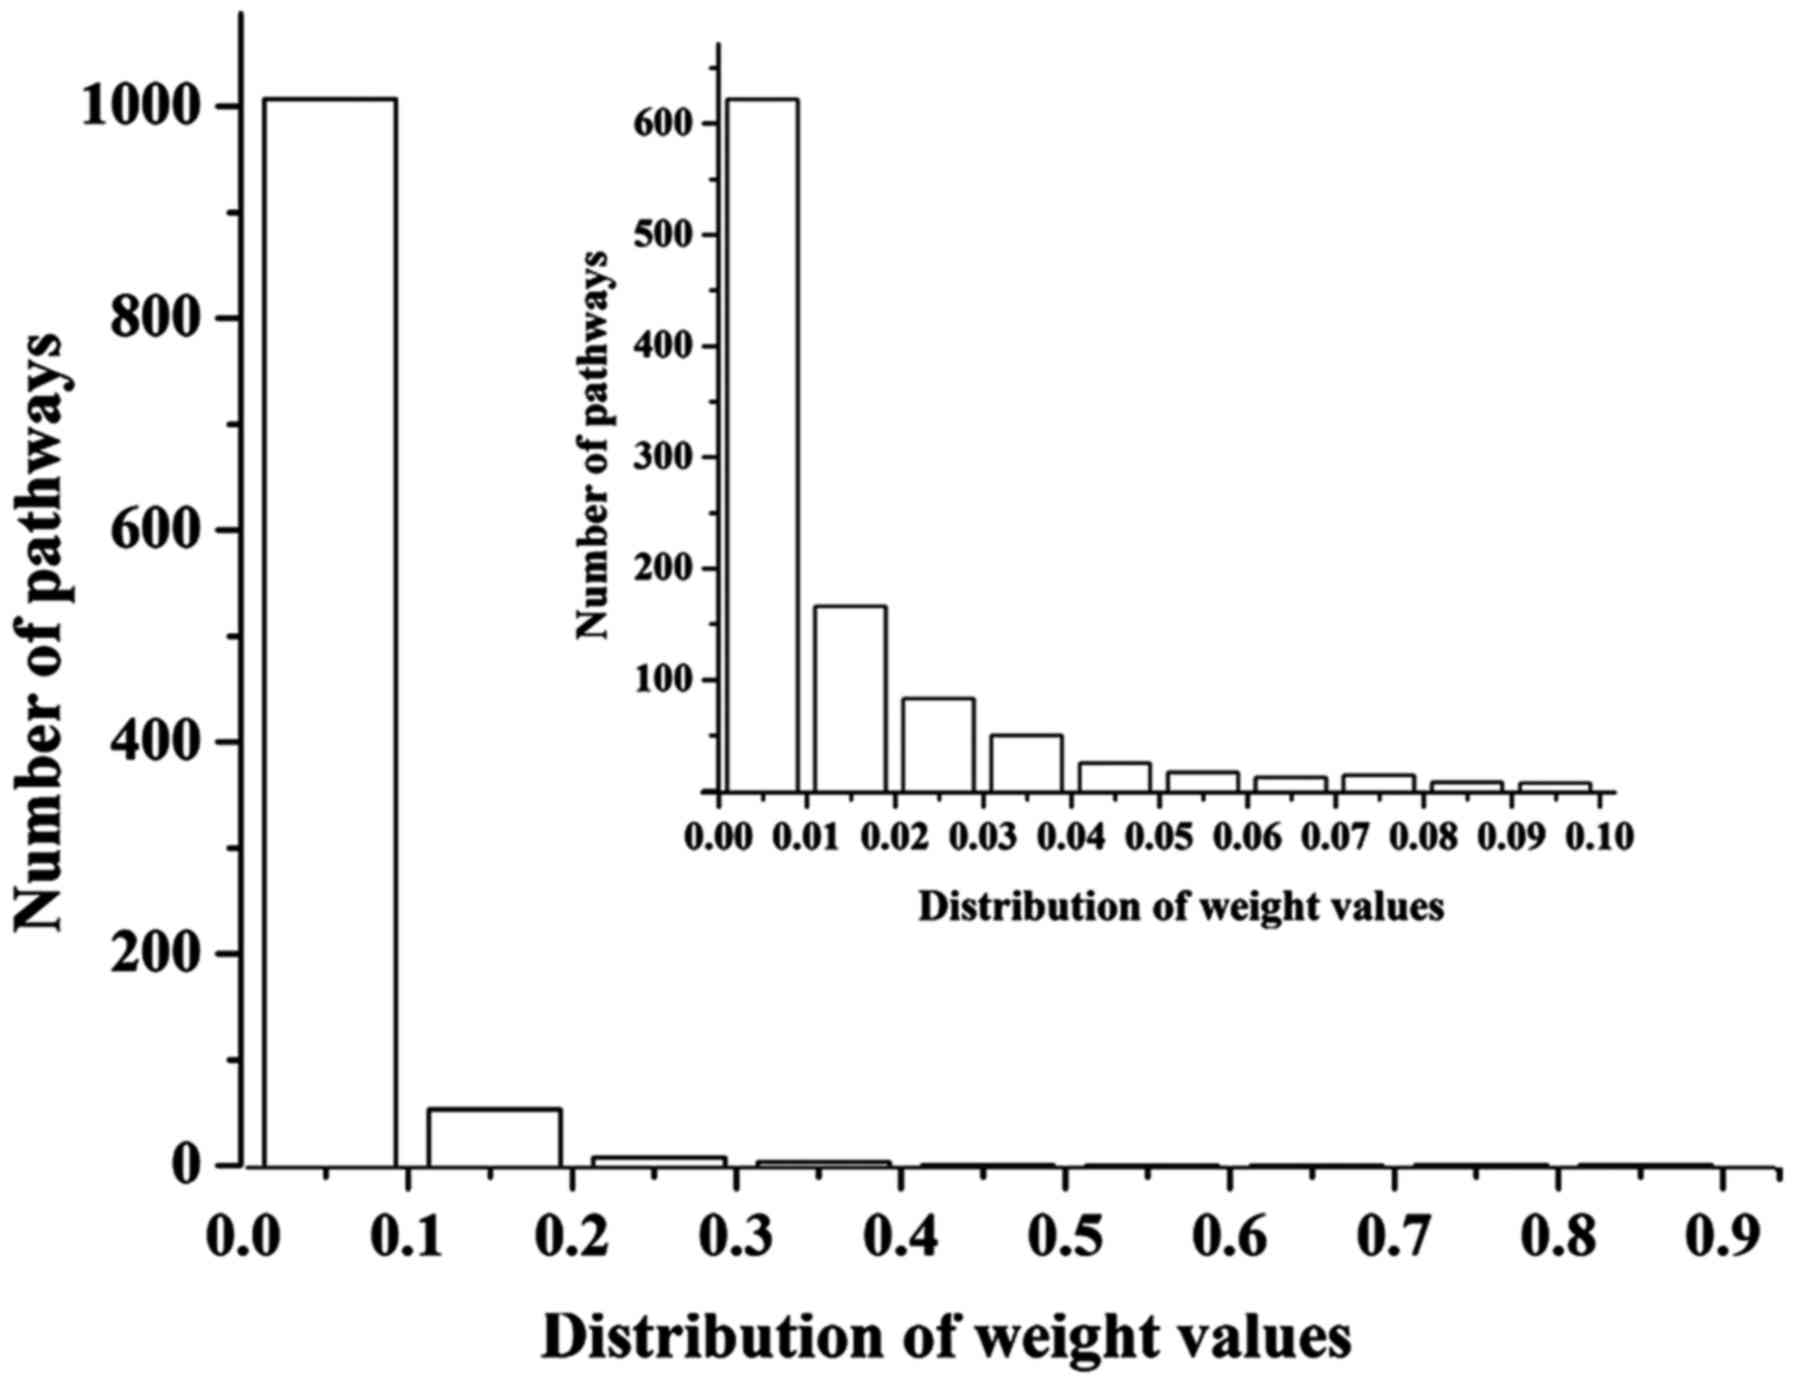
Following pre-processing, a total of 37,846 genes
were obtained and used for subsequent analysis. A total of 1,074
informative pathways were identified, based on the Reactome pathway
database and filtration treatment. For each informative pathway, a
weight value was calculated based on the EB co-expression network.
The distribution of weight values of the pathways are presented in
Fig. 1; it was observed that the
majority of informative pathways exhibited weight values between 0
and 0.04, particularly between 0 and 0.01. An increased weight
value indicates a more significant pathway. Therefore, the
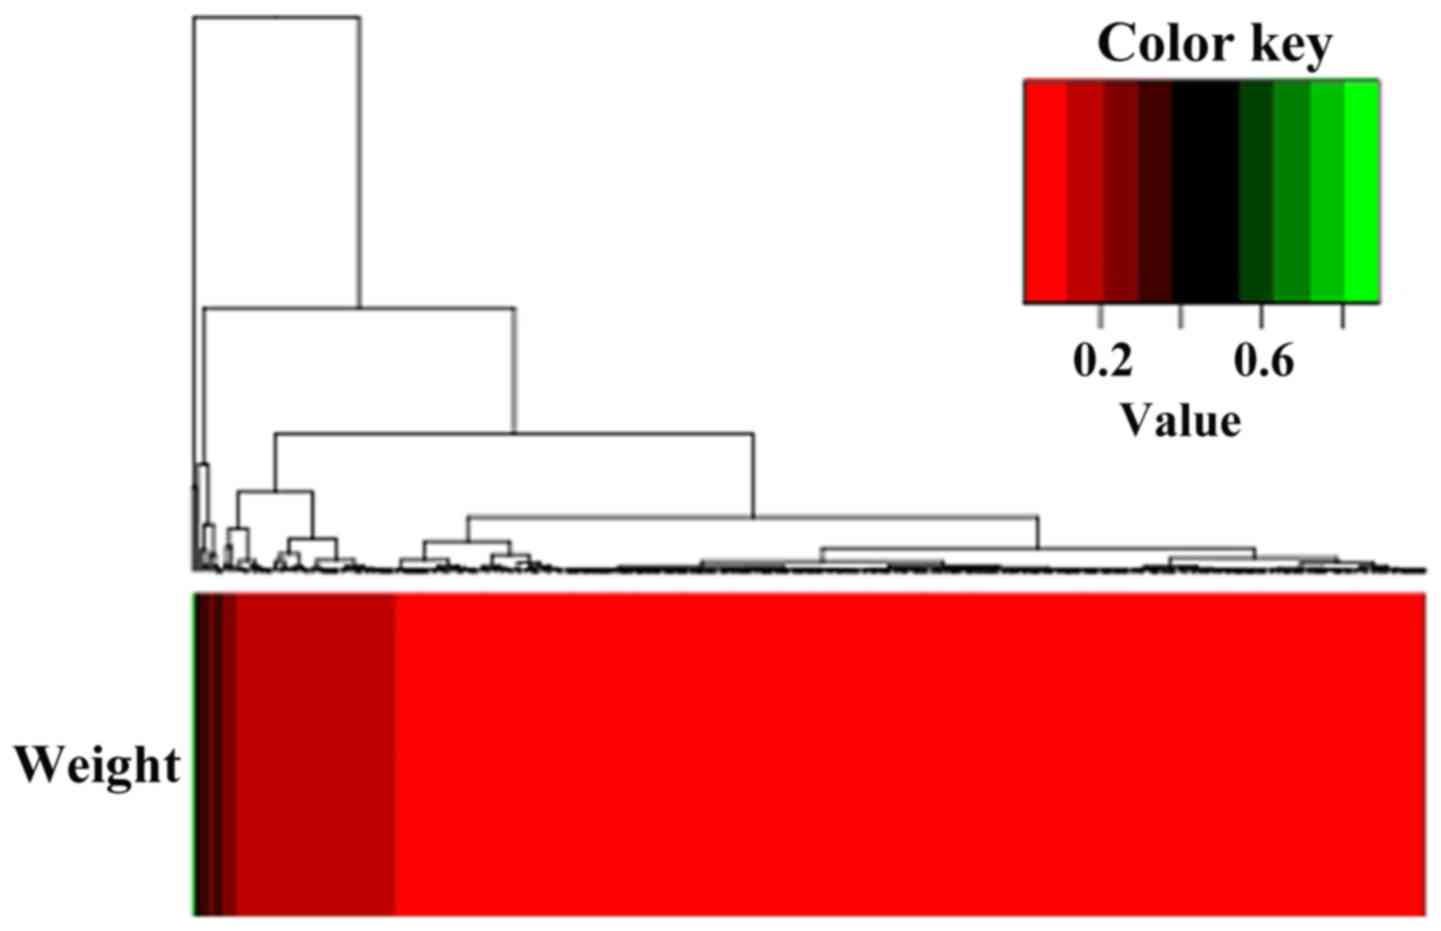
threshold criteria for differential pathways was defined. In the
present study, the threshold for weight values was calculated to be
0.01057, and 447 differential pathways were selected according to
the threshold. The heat-map between differential pathways and the
corresponding weight values is presented in Fig. 2. The top 20 differential pathways
are presented in Table I. Among
these, the top 5 differential pathways were: Folding of actin by
chaperonin containing T-complex protein 1 (CCT)/T-complex protein 1
ring complex (TRiC) (weight value=0.88889); purine ribonucleoside
monophosphate biosynthesis (weight value=0.75556); ubiquinol
biosynthesis (weight value=0.42857); synthesis of
5-eicosatetraenoic acids (weight value=0.33333); and cooperation of
prefoldin and TRiC/CCT in actin and tubulin folding (weight
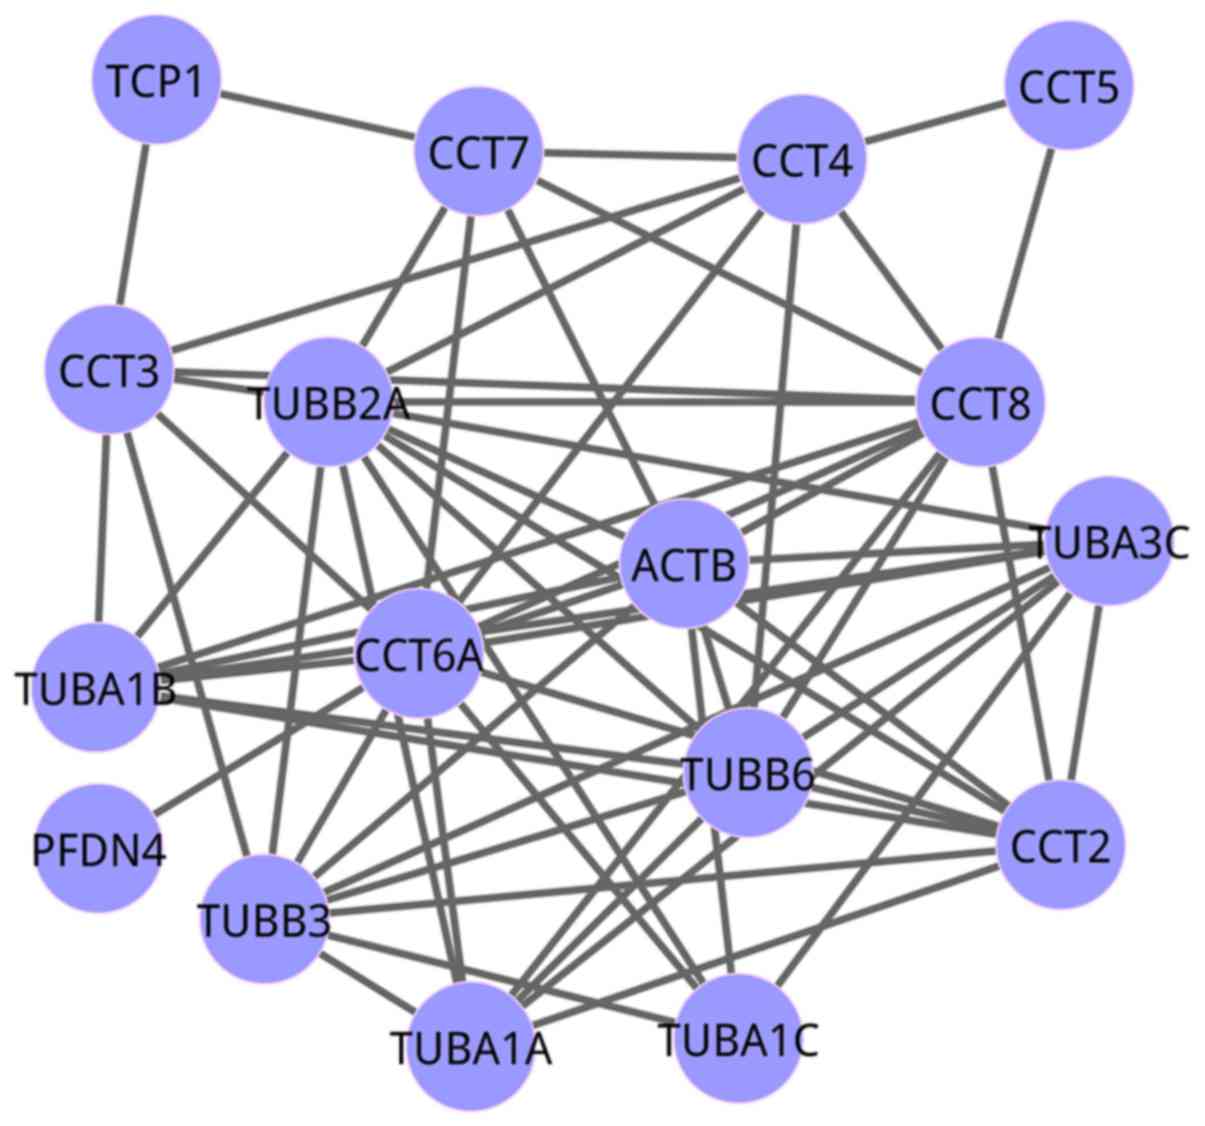
value=0.31000). In order to further elucidate each pathway,
networks were constructed using the EB method. As the gene count
varied between differential pathways, and too few genes are unable
to form a network, differential pathways with an increased number
of genes were chosen, including cooperation of prefoldin and
TRiC/CCT in actin and tubulin folding (gene number=25), and
nonsense mediated decay (NMD) independent of the exon junction
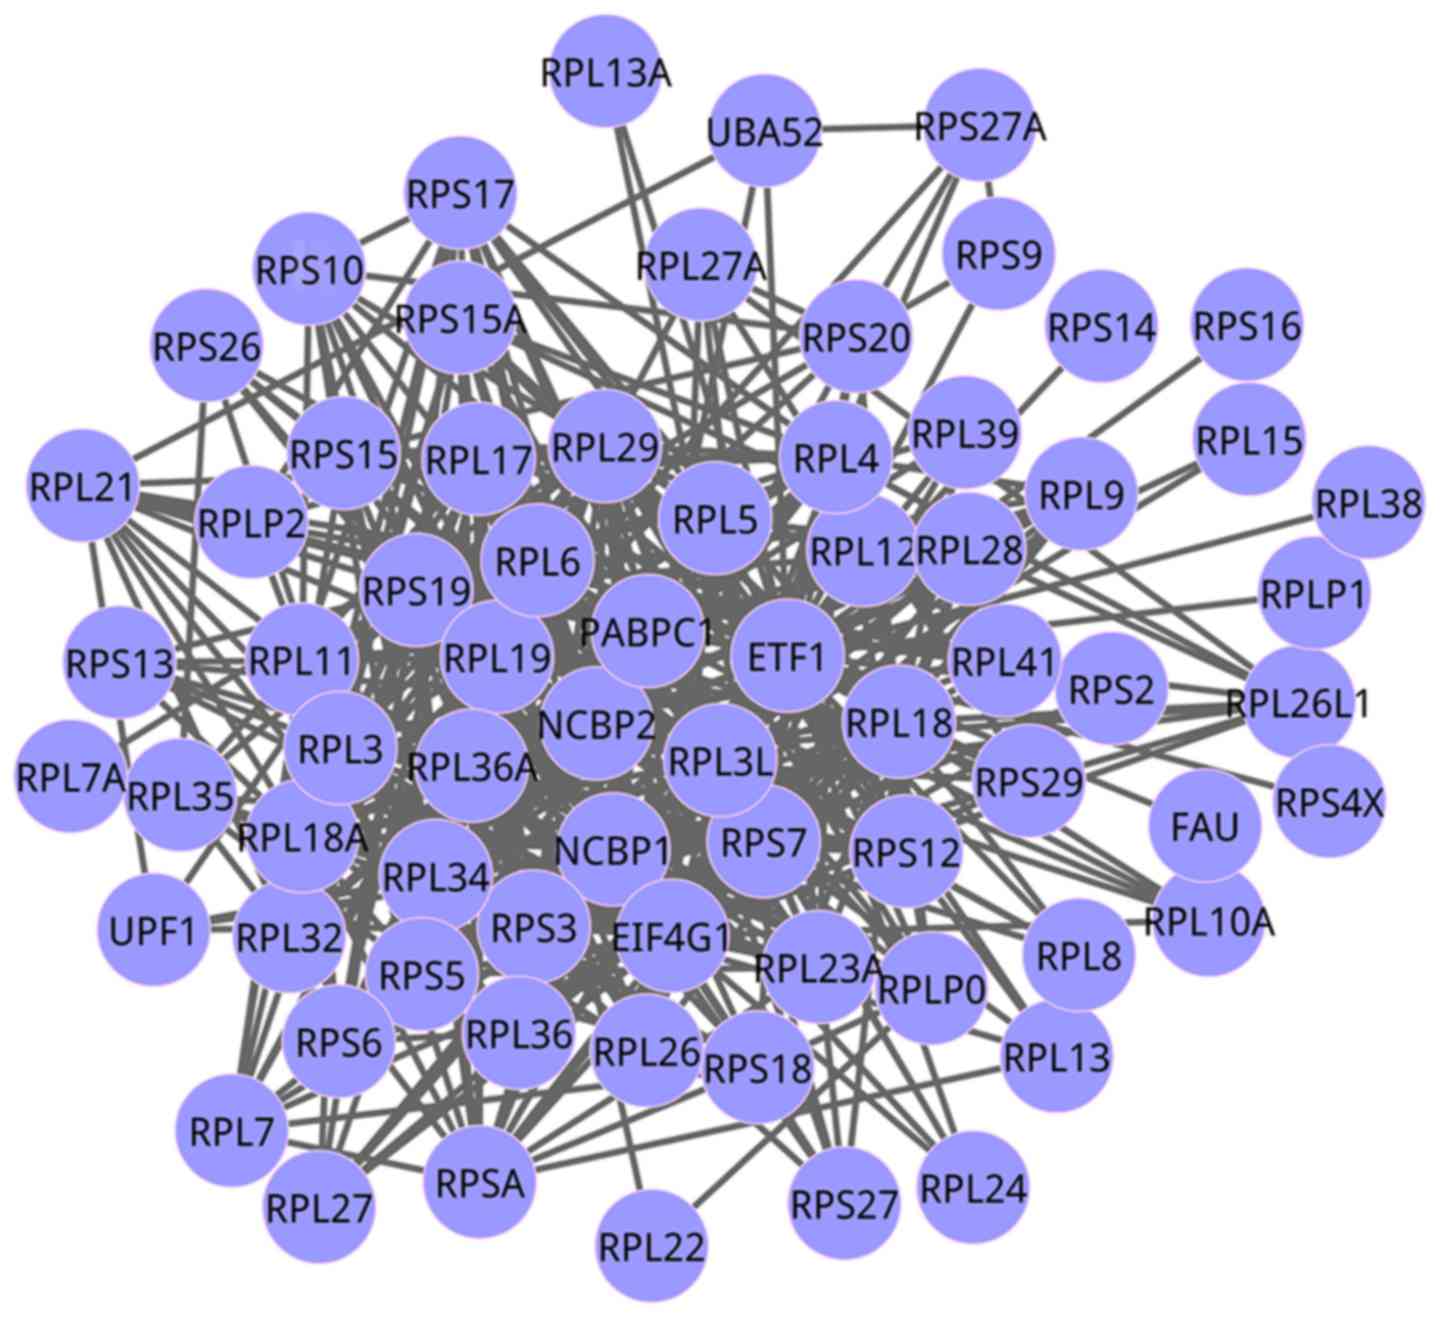
complex (EJC) (gene number=88). The co-expression networks of the
pathways of cooperation of prefoldin and TRiC/CCT in actin and
tubulin folding, and NMD independent of the EJC, are exhibited in
Figs. 3 and 4, respectively. For the network of
cooperation of prefoldin and TRiC/CCT in actin and tubulin folding,
there were 17 genes, while there were 72 genes in the network of
NMD independent of the EJC.
 | Table I.Top 20 differential pathways
identified by the empirical Bayesian analysis. |
Table I.
Top 20 differential pathways
identified by the empirical Bayesian analysis.
| Row | Weight values | Differential
pathways |
|---|
| 1 | 0.88889 | Folding of actin by
CCT/TRiC |
| 2 | 0.75556 | Purine ribonucleoside
monophosphate biosynthesis |
| 3 | 0.42857 | Ubiquinol
biosynthesis |
| 4 | 0.33333 | Synthesis of
5-eicosatetraenoic acids |
| 5 | 0.31000 | Cooperation of
prefoldin and TRiC/CCT in actin and tubulin folding |
| 6 | 0.30072 | Prefoldin mediated
transfer of substrate to CCT/TRiC |
| 7 | 0.28571 | Defective
holocarboxylase synthetase causes multiple carboxylase
deficiency |
| 8 | 0.28571 | Defects in biotin
metabolism |
| 9 | 0.28571 | Mitochondrial fatty
acid beta-oxidation |
| 10 | 0.27941 | Branched-chain
amino acid catabolism |
| 11 | 0.25974 | Cytosolic tRNA
aminoacylation |
| 12 | 0.22807 | Citric acid
cycle |
| 13 | 0.22222 | Role of Abl in
Robo-Slit signaling |
| 14 | 0.20000 | Uptake and function
of diphtheria toxin |
| 15 | 0.19044 | Nonsense mediated
decay independent of the exon junction complex |
| 16 | 0.17778 | Zinc influx into
cells by the SLC39 gene family |
| 17 | 0.17191 | Eukaryotic
translation termination |
| 18 | 0.17177 | GTP hydrolysis and
joining of the 60S ribosomal subunit |
| 19 | 0.17114 | Cap-dependent
translation initiation |
| 20 | 0.17114 | Eukaryotic
translation initiation |
Pathway analyses for DEGs using
traditional DAVID software
Based on the delta cut-off value of 7.48, a total of
344 DEGs were identified. Pathway analyses indicated that there
were only 2 significant pathways based with P<0.05, including
signaling in immune system and hemostasis (data not shown).
Comparison of EB and DAVID
In order to assess whether the pathway co-expression
network method was feasible, the method developed in the present
study was compared with traditional DAVID software. It was observed
that the differential pathway of hemostasis was the common pathway
obtained from the co-expression network approach and the DAVID
method. However, the pathway quantity obtained from co-expression
network approach was increased compared with the DAVID method; A
total of 447 differential pathways were selected using
co-expression network method, while only 2 significant pathways
were identified using the traditional DAVID). Therefore, the
present study demonstrated that the co-expression network method
exhibited increased efficiency compared with DAVID (data not
shown).
Discussion
In the present study, a novel method of identifying
pathway-based biomarkers in HCM was developed, by investigating
dynamic interactions between molecules associated with pathogenesis
through a co-expression network strategy. The results of the
present study identified 447 differential pathways between HCM and
normal samples, including folding of actin by CCT/TRiC, purine
ribonucleoside monophosphate biosynthesis, and cooperation of
prefoldin and TRiC/CCT in actin and tubulin folding.
Actin, as a ubiquitous protein, serves functions in
numerous cellular processes, including the maintenance of cell
motility, cell shape, mitosis and intracellular transport processes
(29,30). Notably, the conserved nature of the
amino acid sequence of actin indicates that mutated residues may
affect basic functions, including actomyosin interactions and
actin-actin interactions involved in polymerization (31). In previous studies, seven
recognized actin mutations have been demonstrated to be associated
with HCM (30,32). Alterations may be induced by
environmental factors, including diet, exercise, or by the cellular
protein folding machinery. Previous studies have suggested that
chaperone complexes (TRiC and CCT) may assist the folding of actin
(33,34). Vang et al (35) demonstrated that protein-folding
pathways serve a role in disease progression for actin mutations
associated with HCM. Consistent with previous studies, the
differentially expressed pathway of folding of actin by CCT/TRiC
was identified in the present study. Therefore, it may be inferred
that the disturbance of actin folding may be the molecular basis
for the subsequent initiation of the hypertrophic pathway,
resulting in the occurrence of HCM.
An additional altered pathway, purine ribonucleoside
monophosphate biosynthesis, was screened out in the present study.
As demonstrated in a recent study, energy flow is generated from
ribose in purine ribonucleoside monophosphates (36). The inability to maintain normal ATP
utilization may be the primary abnormality in HCM (37,38).
Therefore, the differential pathway of purine ribonucleoside
monophosphate biosynthesis may be important in the progression of
HCM, which may involve a response to the disruption of energy
homeostasis.
In conclusion, based on a co-expression network,
differential pathways, including folding of actin by CCT/TRiC and
purine ribonucleoside monophosphate biosynthesis, were successfully
identified and these pathways may be involved in the pathogenic
process of HCM. The results of the present study may be applied
clinically for the diagnosis, prognostic management and treatment
of patients with HCM.
References
|
1
|
McLeod CJ, Bos JM, Theis JL, Edwards WD,
Gersh BJ, Ommen SR and Ackerman MJ: Histologic characterization of
hypertrophic cardiomyopathy with and without myofilament mutations.
Am Heart J. 158:799–805. 2009. View Article : Google Scholar : PubMed/NCBI
|
|
2
|
Ashrafian H and Watkins H: Reviews of
translational medicine and genomics in cardiovascular disease: New
disease taxonomy and therapeutic implications cardiomyopathies:
Therapeutics based on molecular phenotype. J Am Coll Cardiol.
49:1251–1264. 2007. View Article : Google Scholar : PubMed/NCBI
|
|
3
|
Watkins H, McKenna WJ, Thierfelder L, Suk
HJ, Anan R, O'Donoghue A, Spirito P, Matsumori A, Moravec CS,
Seidman JG, et al: Mutations in the genes for cardiac troponin T
and alpha-tropomyosin in hypertrophic cardiomyopathy. N Engl J Med.
332:1058–1065. 1995. View Article : Google Scholar : PubMed/NCBI
|
|
4
|
Maron BJ, Doerer JJ, Haas TS, Tierney DM
and Mueller FO: Sudden deaths in young competitive athletes:
Analysis of 1866 deaths in the United States, 1980–2006.
Circulation. 119:1085–1092. 2009. View Article : Google Scholar : PubMed/NCBI
|
|
5
|
Bradley EW, Ruan MM, Vrable A and Oursler
MJ: Pathway crosstalk between Ras/Raf and PI3K in promotion of
M-CSF-induced MEK/ERK-mediated osteoclast survival. J Cell Biochem.
104:1439–1451. 2008. View Article : Google Scholar : PubMed/NCBI
|
|
6
|
Efthimiadis GK, Pagourelias ED, Gossios T
and Zegkos T: Hypertrophic cardiomyopathy in 2013: Current
speculations and future perspectives. World J Cardiol. 6:262014.
View Article : Google Scholar : PubMed/NCBI
|
|
7
|
Roma-Rodrigues C and Fernandes AR:
Genetics of hypertrophic cardiomyopathy: Advances and pitfalls in
molecular diagnosis and therapy. Appl Clin Genet.
7:1952014.PubMed/NCBI
|
|
8
|
Liang D, Han G, Feng X, Sun J, Duan Y and
Lei H: Concerted perturbation observed in a hub network in
Alzheimer's disease. PLoS One. 7:e404982012. View Article : Google Scholar : PubMed/NCBI
|
|
9
|
Green M and Karp P: The outcomes of
pathway database computations depend on pathway ontology. Nucleic
Acids Res. 34:3687–3697. 2006. View Article : Google Scholar : PubMed/NCBI
|
|
10
|
Glazko GV and Emmertstreib F: Unite and
conquer: Univariate and multivariate approaches for finding
differentially expressed gene sets. Bioinformatics. 25:2348–2354.
2009. View Article : Google Scholar : PubMed/NCBI
|
|
11
|
Zhai DK, Liu B, Bai XF and Wen JA:
Identification of biomarkers and pathway-related modules involved
in ovarian cancer based on topological centralities. J BUON.
21:208–220. 2016.PubMed/NCBI
|
|
12
|
Khatri P, Sirota M and Butte AJ: Ten years
of pathway analysis: Current approaches and outstanding challenges.
PLoS Comput Biol. 8:e10023752012. View Article : Google Scholar : PubMed/NCBI
|
|
13
|
Kanehisa M and Goto S: KEGG: Kyoto
encyclopedia of genes and genomes. Nucleic Acids Res. 28:27–30.
2000. View Article : Google Scholar : PubMed/NCBI
|
|
14
|
Liu X, Tang WH, Zhao XM and Chen L: A
network approach to predict pathogenic genes for Fusarium
graminearum. PLoS One. 5:pii: e13021. 2010.
|
|
15
|
Chen L, Wang RS and Zhang XS: Biomolecular
Networks: Methods and Applications in Systems Biology. Wiley; 2009,
View Article : Google Scholar
|
|
16
|
Bandyopadhyay S, Mehta M, Kuo D, Sung MK,
Chuang R, Jaehnig EJ, Bodenmiller B, Licon K, Copeland W, Shales M,
et al: Rewiring of genetic networks in response to DNA damage.
Science. 330:1385–1389. 2010. View Article : Google Scholar : PubMed/NCBI
|
|
17
|
Irizarry RA, Hobbs B, Collin F,
Beazer-Barclay YD, Antonellis KJ, Scherf U and Speed TP:
Exploration, normalization, and summaries of high density
oligonucleotide array probe level data. Biostatistics. 4:249–264.
2003. View Article : Google Scholar : PubMed/NCBI
|
|
18
|
Bolstad BM, Irizarry RA, Astrand M and
Speed TP: A comparison of normalization methods for high density
oligonucleotide array data based on variance and bias.
Bioinformatics. 19:185–193. 2003. View Article : Google Scholar : PubMed/NCBI
|
|
19
|
Pepper SD, Saunders EK, Edwards LE, Wilson
CL and Miller CJ: The utility of MAS5 expression summary and
detection call algorithms. BMC Bioinformatics. 8:2732007.
View Article : Google Scholar : PubMed/NCBI
|
|
20
|
Croft D: Building models using Reactome
pathways as templates. In Silico Systems Biology Springer.
1021:pp273–283. 2013. View Article : Google Scholar
|
|
21
|
Dawson JA, Ye S and Kendziorski C:
R/EBcoexpress: An empirical Bayesian framework for discovering
differential co-expression. Bioinformatics. 28:1939–1940. 2012.
View Article : Google Scholar : PubMed/NCBI
|
|
22
|
Manfield IW, Jen CH, Pinney JW,
Michalopoulos I, Bradford JR, Gilmartin PM and Westhead DR:
Arabidopsis Co-expression Tool (ACT): Web server tools for
microarray-based gene expression analysis. Nucleic Acids Res.
34:(Web Server Issue). W504–W509. 2006. View Article : Google Scholar : PubMed/NCBI
|
|
23
|
Langfelder P and Horvath S: WGCNA: An R
package for weighted correlation network analysis. BMC
Bioinformatics. 9:5592008. View Article : Google Scholar : PubMed/NCBI
|
|
24
|
Dawson JA and Kendziorski C: An empirical
bayesian approach for identifying differential coexpression in
high-throughput experiments. Biometrics. 68:455–465. 2012.
View Article : Google Scholar : PubMed/NCBI
|
|
25
|
Fraley C and Raftery AE: Model-based
clustering, discriminant analysis and density estimation. J Am Stat
Assoc. 97:611–631. 2002. View Article : Google Scholar
|
|
26
|
Dawson JA, Dawson M and Ebarrays D:
Package ‘EBcoexpress’.
|
|
27
|
da Huang W, Sherman BT and Lempicki RA:
Systematic and integrative analysis of large gene lists using DAVID
bioinformatics resources. Nat Protoc. 4:44–57. 2009. View Article : Google Scholar : PubMed/NCBI
|
|
28
|
Ford G, Xu Z, Gates A, Jiang J and Ford
BD: Expression analysis systematic explorer (EASE) analysis reveals
differential gene expression in permanent and transient focal
stroke rat models. Brain Res. 1071:226–236. 2006. View Article : Google Scholar : PubMed/NCBI
|
|
29
|
Huxley HE: Fifty years of muscle and the
sliding filament hypothesis. Eur J Biochem. 271:1403–1415. 2004.
View Article : Google Scholar : PubMed/NCBI
|
|
30
|
Kodama A, Lechler T and Fuchs E:
Coordinating cytoskeletal tracks to polarize cellular movements. J
Cell Biol. 167:203–207. 2004. View Article : Google Scholar : PubMed/NCBI
|
|
31
|
Bookwalter CS and Trybus KM: Functional
consequences of a mutation in an expressed human alpha-cardiac
actin at a site implicated in familial hypertrophic cardiomyopathy.
J Biol Chem. 281:16777–16784. 2006. View Article : Google Scholar : PubMed/NCBI
|
|
32
|
Van Driest SL, Ellsworth EG, Ommen SR,
Tajik AJ, Gersh BJ and Ackerman MJ: Prevalence and spectrum of thin
filament mutations in an outpatient referral population with
hypertrophic cardiomyopathy. Circulation. 108:445–451. 2003.
View Article : Google Scholar : PubMed/NCBI
|
|
33
|
Rommelaere H, Waterschoot D, Neirynck K,
Vandekerckhove J and Ampe C: Structural plasticity of functional
actin: Pictures of actin binding protein and polymer interfaces.
Structure. 11:1279–1289. 2003. View Article : Google Scholar : PubMed/NCBI
|
|
34
|
Hansen WJ, Cowan NJ and Welch WJ:
Prefoldin-nascent chain complexes in the folding of cytoskeletal
proteins. J Cell Biol. 145:265–277. 1999. View Article : Google Scholar : PubMed/NCBI
|
|
35
|
Vang S, Corydon TJ, Børglum AD, Scott MD,
Frydman J, Mogensen J, Gregersen N and Bross P: Actin mutations in
hypertrophic and dilated cardiomyopathy cause inefficient protein
folding and perturbed filament formation. FEBS J. 272:2037–2049.
2005. View Article : Google Scholar : PubMed/NCBI
|
|
36
|
Hibbs JB Jr, Vavrin Z and Cox JE: Complex
coordinated extracellular metabolism: Acid phosphatases activate
diluted human leukocyte proteins to generate energy flow as NADPH
from purine nucleotide ribose. Redox Biol. 8:271–284. 2016.
View Article : Google Scholar : PubMed/NCBI
|
|
37
|
Spindler M, Saupe K, Christe M, Sweeney H,
Seidman C, Seidman JG and Ingwall JS: Diastolic dysfunction and
altered energetics in the alphaMHC403/+ mouse model of familial
hypertrophic cardiomyopathy. J Clin Invest. 101:1775–1783. 1998.
View Article : Google Scholar : PubMed/NCBI
|
|
38
|
Blair E, Redwood C, Ashrafian H, Oliveira
M, Broxholme J, Kerr B, Salmon A, Ostman-Smith I and Watkins H:
Mutations in the gamma(2) subunit of AMP-activated protein kinase
cause familial hypertrophic cardiomyopathy: Evidence for the
central role of energy compromise in disease pathogenesis. Hum Mol
Genet. 10:1215–1220. 2001. View Article : Google Scholar : PubMed/NCBI
|