Introduction
Tetralogy of Fallot (TOF) is a congenital heart
disease, with an incidence rate estimated at 5–7/10,000 live births
worldwide (1). TOF is
characterized by ventricular septal defects, sub-pulmonary and
pulmonary stenosis, an over-riding aorta and right ventricular
hypertrophy (2). At present, the
molecular mechanisms underlying the pathogenesis of TOF remain
poorly understood. In past decades, the association between the
pathogenesis of this disease and mutations in specific genes,
including GATA binding protein 4 (3,4),
GATA binding protein 6 (5), zinc
finger protein, FOG family member 2 (4,6) and
jagged 1 (7) have been reported;
although the function of these genes remains controversial among
different studies. In addition, a deletion in chromosome 22q11
(8,9) and copy number variations in various
chromosomes, such as duplications 1q21.1 and micro deletions in
14q23 (10), have been implicated
in the pathogenesis of TOF.
Through the use of genome-wide gene expression
microarrays, Bittel et al (11) revealed that the majority of
abnormally expressed genes in cardiac tissue samples derived from
patients with TOF were involved in compensatory functions,
including hypertrophy, cardiac fibrosis and cardiac dilation, and
the expression of genes involved in the WNT and Notch signaling
pathways were suppressed. Using bioinformatics methods, the present
study employed the microarray results submitted by Bittel et
al (11) to further identify
key genes that may be involved in the pathogenesis of TOF.
Data and methods
Microarray data
The GSE26125 expression profile dataset was
downloaded from the Gene Expression Omnibus database (http://www.ncbi.nlm.nih.gov/geo/) (12). The mRNA used for array
hybridization was extracted from the cardiovascular tissue samples
of 16 children with TOF and five healthy age-matched control
infants (11). The CodeLink Human
Whole Genome Bioarray (Applied Microarrays, Inc., Tempe, AZ, USA),
which contains >54,000 probes, was employed to analyze the
samples (11). In addition, the
GPL11329 CodeLink Human Whole Genome Bioarray (Applied Microarrays,
Inc.) annotation platform was used.
Data preprocessing and identification
of differentially expressed genes (DEGs)
The downloaded data were subjected to background
correction, quantile normalization and probe summarization using
the robust multi-array average method (13) with the R/Affy package version 3.2.2
in Bioconductor release 3.2 (14).
Differential expression analysis of genes between the TOF and
control groups was then performed using the Student's t-test with
the R/limma package version 3.2.2 in Bioconductor release 3.2
(15). Genes with a
log2 fold-change (FC) of ≥2 and a false discovery rate
(FDR) of <0.01 were considered to be DEGs. The samples were
subsequently clustered based on the identified DEGs using the
pvclust R package (16) by
calculating the approximate unbiased P-values.
Functional annotation and pathway
enrichment analyses of DEGs
The biological function of the identified DEGs was
determined using the following tools: ToppGene (https://toppgene.cchmc.org/) (17), which is a one-stop portal for
functional enrichment analysis of gene lists based on the Gene
Ontology (GO) database (18); the
BioSystems database (19); the
BIOCYC database (http://BioCyc.org/) (20); the Kyoto Encyclopedia of Genes and
Genomes (KEGG) database (21); the
REACTOME pathway database (22,23);
WikiPathways September 2015 release (http://www.wikipathways.org/index.php/Wiki Pathways),
GenMAPP version 2.1 (Gladstone Institutes, San Francisco, CA, USA),
the MSigDB C2 database version 5.0 (http://software.broadinstitute.org/gsea/msigdb), which
integrated BioCarta, (Sigma-Aldrich and Signaling Gateway;
http://www.biocarta.com/), the PANTHER database
version 1.4 (http://pantherdb.org/downloads/index.jsp) (24), Pathway Ontology (http://www.obofoundry.org/ontology/pw.html) (25) and the Small Molecule Pathway
Database (SMPDB) version 2.0 (http://www.smpdb.ca) (26,27).
FDR values of <0.05 and a gene count of ≥2 were set as the
threshold values. GO categories were classified into the following
terms: Biological process, molecular function and cellular
component.
Gene functional interaction (FI)
network and pathway enrichment analyses
ReactomeFIViz (28)
is a Cytoscape software version 3.2.0 (29) application that allows researchers
to identify network and signaling pathway patterns of interest,
search for gene signatures from gene expression data sets, reveal
signaling pathways significantly enriched by a list of genes, as
well as integrate multiple genomic data types into a pathway
context using probabilistic graphical models. In the present study,
an FI network was constructed by merging interactions extracted
from curated human pathways, with interactions predicted using a
machine learning approach. The correlations among genes involved in
the same FI were calculated and then used as weights for edges in
the FI network. Then, a Monte Carlo Localization graph clustering
algorithm was applied to the weighted FI network to generate a
sub-network for a list of selected network modules, based on module
size and average correlation. Each parameter was set a default
value during the analysis as follows: Size of MCL (Markov Cluster
Alorithm) clustering result=7; inflation parameter for MCL=5.0; and
average correlation=2.5. The gene FI networks were visualized using
Cytoscape software (29). Pathway
enrichment analysis of each function module was subsequently
performed to identify the signaling pathways enriched by genes in
each module, with FDR values of <0.05.
Construction of gene-transcription
factor regulation networks
The iRegulon plugin (30) in Cytoscape software version 3.2.0,
that is associated with and contains information form the
integrated databases TRANSFAC, JASPAR, ENCODE (https://genome.ucsc.edu/ENCODE/), SwissRegulon
(http://swissregulon.unibas.ch/sr/),
and HOMER (http://homer.ucsd.edu/homer/motif/motifDatabase.html),
was used to identify transcription factors predicted to regulate
the DEGs in the FI network according to the following parameters: A
minimum identity between orthologous genes equal to 0.05, and a
maximum FDR value of motif similarity equal to 0.001. A larger
normalized enrichment score (NES) indicates a higher reliability,
and an NES of >3.5 was set as the threshold. The
gene-transcription factor pairs were then visualized using
Cytoscape software.
Results
Identification of DEGs
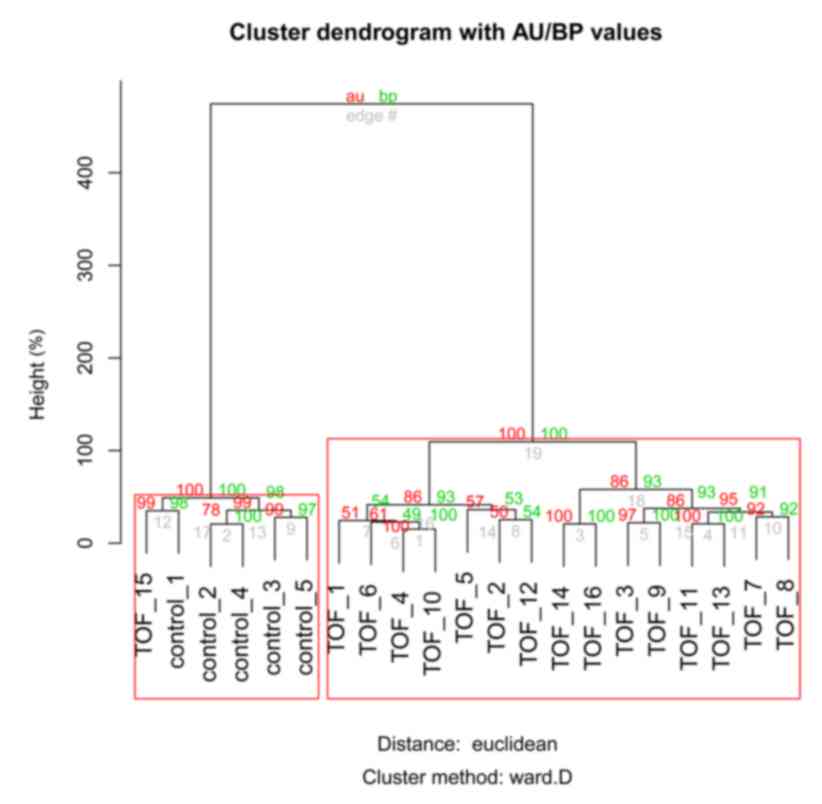
Using log2FC values of >2 and FDR
values of <0.01 as thresholds, a total of 878 DEGs were
identified, including 848 upregulated genes and 30 downregulated
genes. Among the 21 samples, 20 were correctly divided into the TOF
or control groups by clustering analysis based on the identified
DEGs, with an accuracy rate of ~95% (Fig. 1). One sample (TOF_15) was not
divided into the TOF group by clustering analysis. Nevertheless,
this indicated a relatively good performance of the clustering
analysis.
GO functional annotation and pathway
enrichment analyses of DEGs
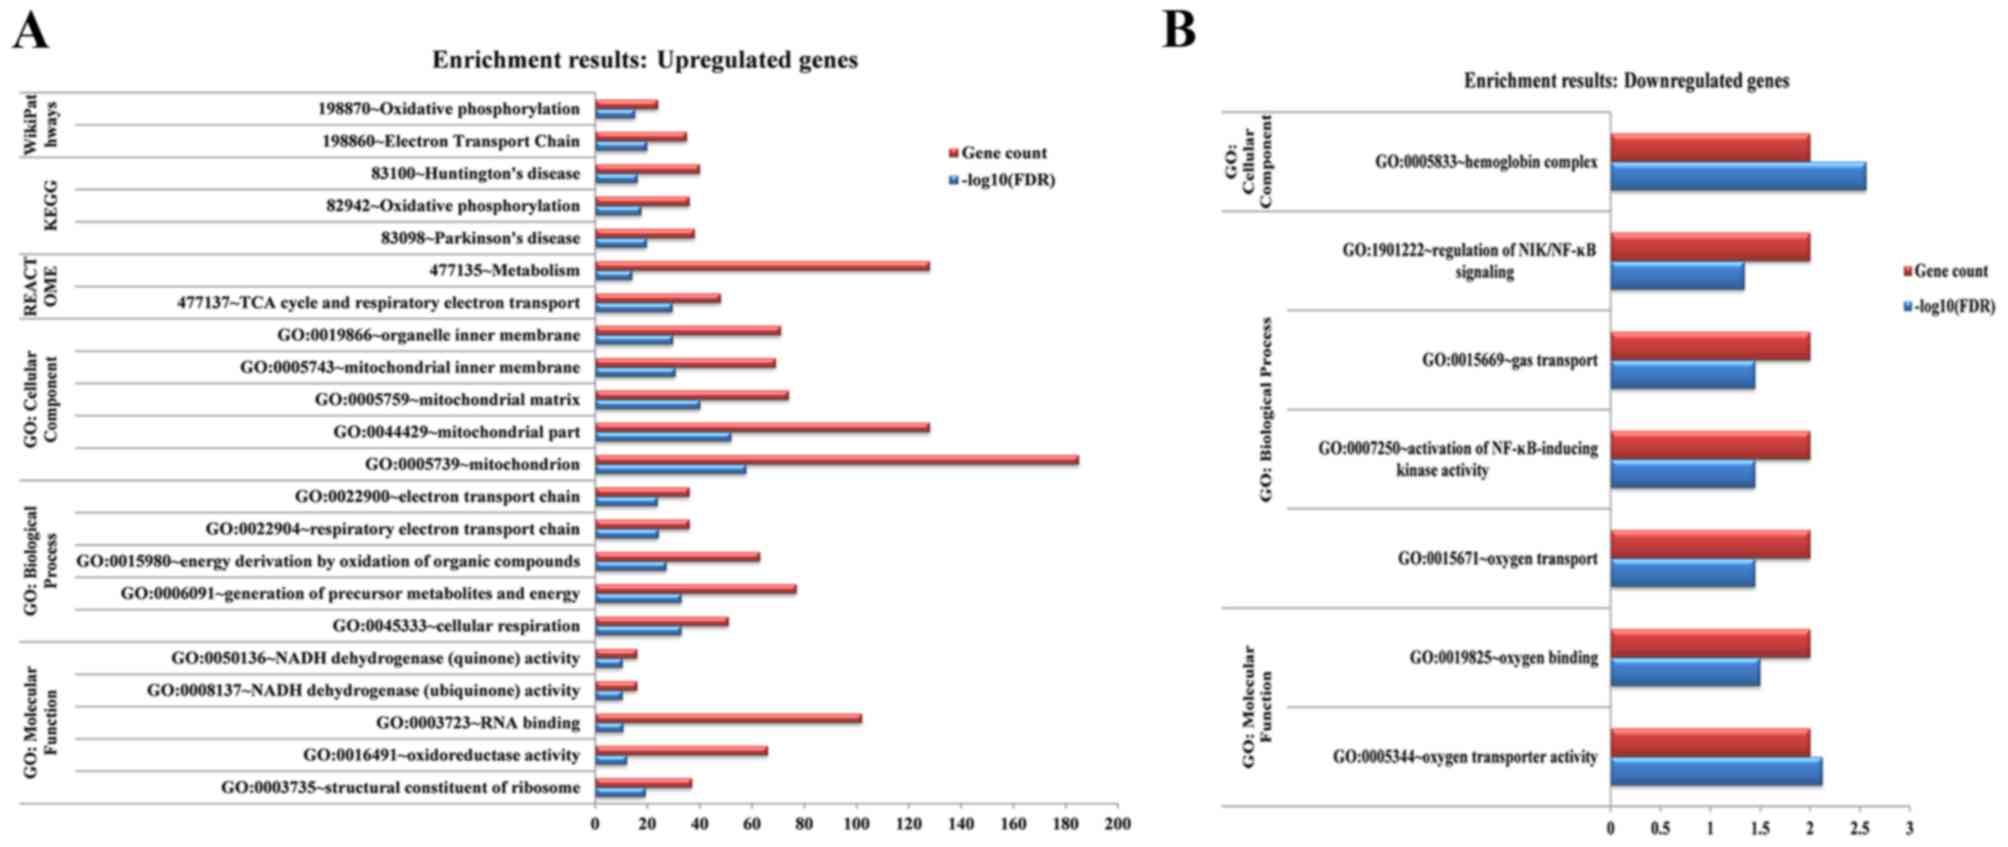
According to the different databases, the
upregulated genes were enriched in multiple signaling pathways,
including oxidative phosphorylation, the electron transport chain,
Huntington's disease, Parkinson's disease, metabolism, the citric
acid cycle and respiratory electron transport (Fig. 2). By contrast, the downregulated
genes were not significantly enriched in any signaling pathway;
however, they were enriched for several GO terms, such as
hemoglobin complex, activation of nuclear factor-κB-inducing kinase
activity and oxygen transport (Fig.
2).
Gene FI network and pathway enrichment
analyses
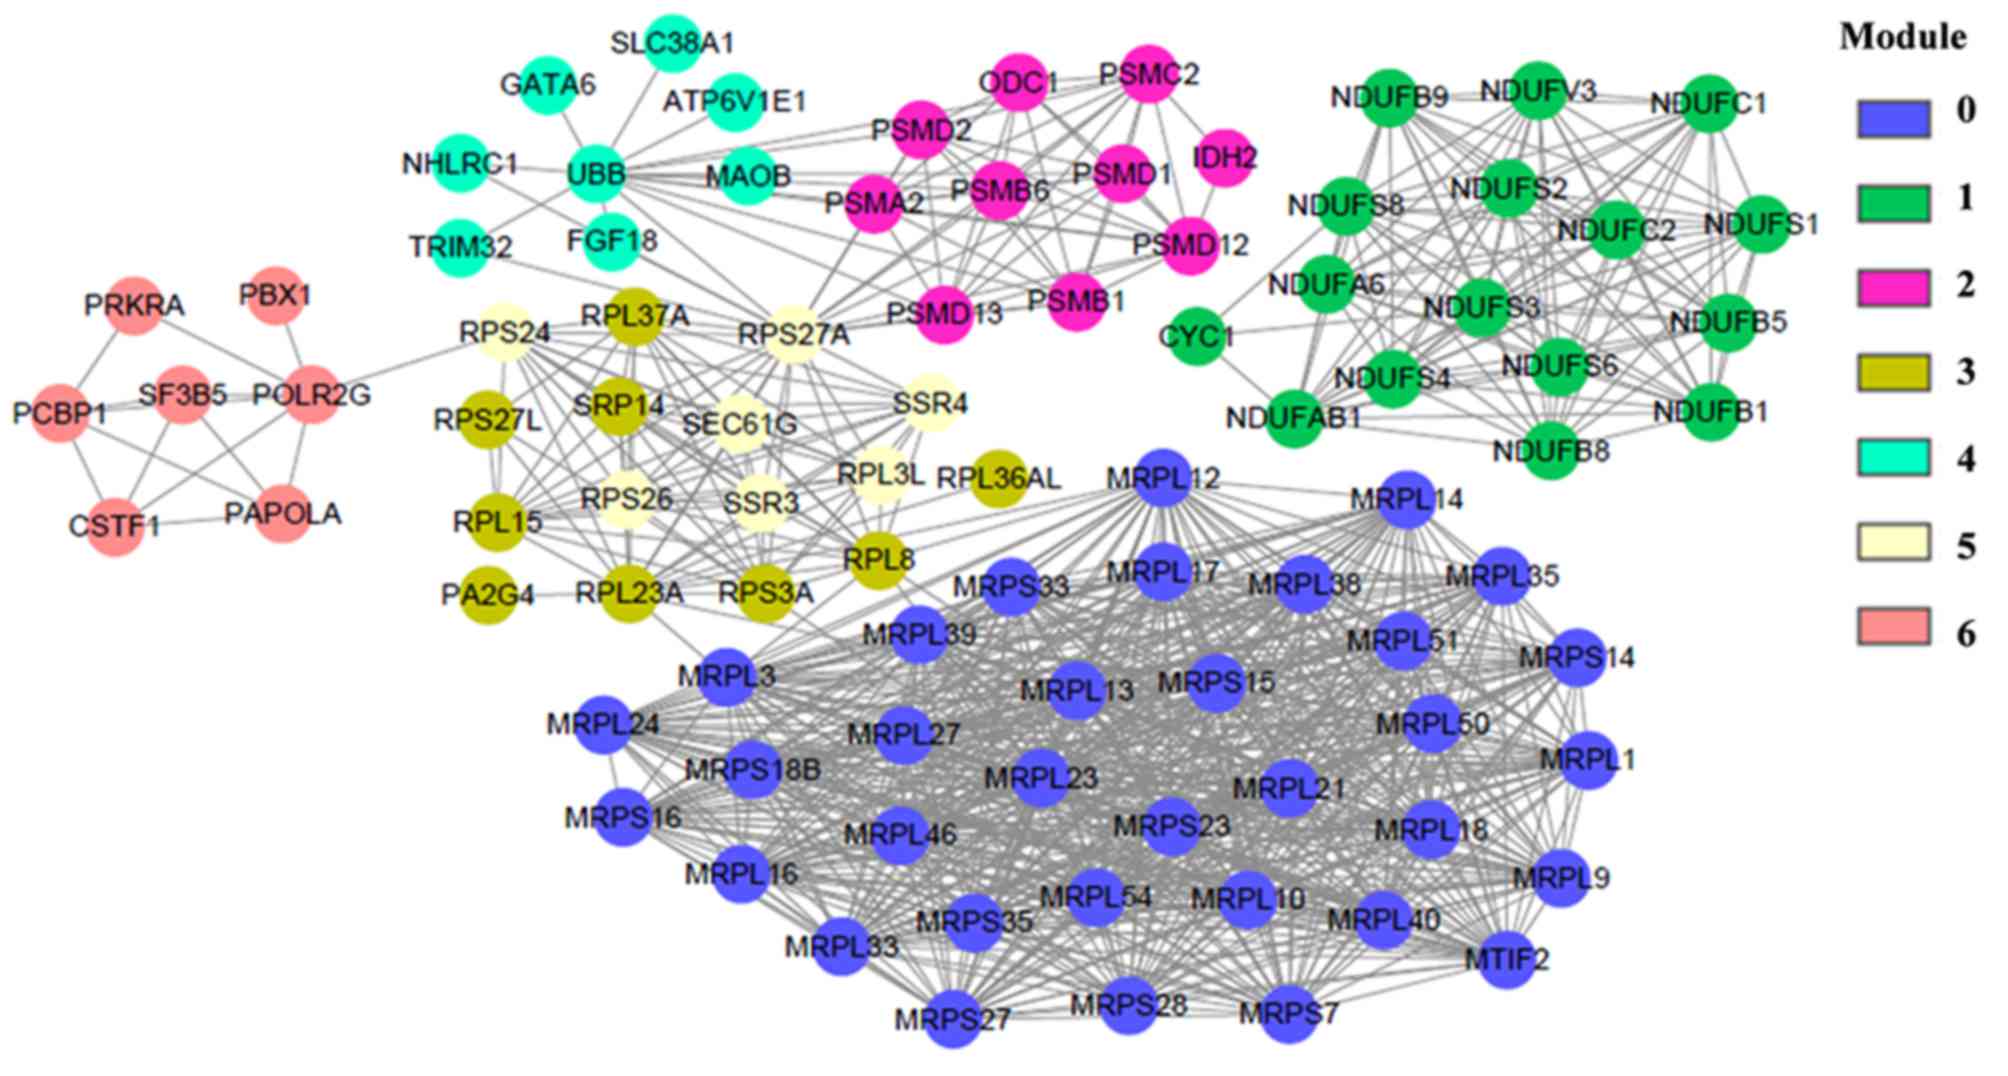
The gene FI network contained 7 function modules,
each consisting of upregulated genes (Fig. 3). Genes in Modules 0, 1, 2, 3, 5
and 6 were further enriched in ≥ 1 signaling pathways (Table I). Notably, genes enriched in
Module 1, including nictotinamide adenine dinucleotide
(NADH):ubiquinone oxidoreductase (NDUF) subunit B5, NDUFB8, NDUFA6,
NDUFB9, cytochrome c1, NDUFAB1, NDUFC2, NDUFC1, NDUFB1, NDUFV3,
NDUFS6, NDUFS4, NADH:ubiquinone oxidoreductase core subunit S
(NDUFS)8, NDUFS3, NDUFS2 and NDUFS1 were enriched in the
Parkinson's disease, Alzheimer's disease and Huntington's disease
pathways. Therefore, according to the KEGG database these genes
were associated with neurodegenerative disorders. Genes enriched in
Module 0, included the mitochondrial ribosomal protein-large (MRPL)
and MRP-small (MRPS) gene families. Module 3 included ribosomal
protein (RP)S3A, RPL8, RPL15, RPL37A, RPL23A, RPS27L, RPL36AL and
signal recognition particle 14. Module 5 consisted of RPS26, RPL3L,
signal sequence receptor subunit (SSR)4, Sec6a translocon γ
subunit, RPS27A, SSR3 and RPS24. Genes in Modules 0, 3 and 5 were
dominantly enriched in pathways associated with ribosomes and/or
protein translation (Table I).
 | Table I.Pathway enrichment analysis of genes
in the gene functional modules. |
Table I.
Pathway enrichment analysis of genes
in the gene functional modules.
| A, Module 0 |
|---|
|
|---|
| Pathway
enrichment | Protein from
module | False discovery
rate |
|---|
| Mitochondrial
translation (R) | 34 |
<5.000×10⁻⁴ |
| Ribosome (K) | 20 |
<5.000×10⁻⁴ |
|
| B, Module 1 |
|
| Pathway
enrichment | Protein from
module | False discovery
rate |
|
| The citric acid
cycle and respiratory electron transport (R) | 16 |
<1.667×10⁻⁴ |
| Parkinson's disease
(K) | 16 |
<1.667×10⁻⁴ |
| Alzheimer's disease
(K) | 16 |
<1.667×10⁻⁴ |
| Huntington's
disease (K) | 16 |
<1.667×10⁻⁴ |
| Non-alcoholic fatty
liver disease (K) | 16 |
<1.667×10⁻⁴ |
|
| C, Module 2 |
|
| Pathway
enrichment | Protein from
module | False discovery
rate |
|
| Hedgehog ligand
biogenesis (R) | 8 |
<3.333×10⁻⁴ |
| Regulation of
apoptosis (R) | 8 |
<3.333×10⁻⁴ |
| Proteasome (K) | 8 |
<3.333×10⁻⁴ |
| Degradation of
beta-catenin by the destruction complex (R) | 8 |
<2.500×10⁻⁴ |
| Metabolism of amino
acids and derivatives (R) | 9 |
<1.667×10⁻⁴ |
|
| D, Module 3 |
|
| Pathway
enrichment | Protein from
module | False discovery
rate |
|
| Ribosome (K) | 7 |
<1.000×10⁻³ |
| SRP-dependent
co-translational protein targeting to membrane (R) | 6 |
<5.000×10⁻⁴ |
| Eukaryotic
translation termination (R) | 5 |
<3.333×10⁻⁴ |
| Eukaryotic
translation elongation (R) | 5 |
<2.500×10⁻⁴ |
| Nonsense-mediated
decay (R) | 5 |
<2.000×10⁻⁴ |
|
| E, Module 5 |
|
| Pathway
enrichment | Protein from
module | False discovery
rate |
|
| SRP-dependent
co-translational protein targeting to membrane (R) | 7 |
<1.000×10⁻³ |
| Eukaryotic
translation termination (R) | 4 |
<5.000×10⁻⁴ |
| Eukaryotic
translation elongation (R) | 4 |
<3.333×10⁻⁴ |
| Nonsense-mediated
decay (R) | 4 |
<2.500×10⁻⁴ |
| Eukaryotic
translation initiation (R) | 4 |
<2.000×10⁻⁴ |
|
| F, Module 6 |
|
| Pathway
enrichment | Protein from
module | False discovery
rate |
|
| Processing of
capped intron-containing Pre-mRNA (R) | 5 |
<1.000×10⁻³ |
| RNA polymerase II
transcription (R) | 3 |
4.000×10⁻³ |
| Processing of
capped intron-less pre-mRNA (R) | 2 |
8.330×10⁻³ |
| Transcriptional
regulation of pluripotent stem cells (R) | 2 |
1.230×10⁻² |
| Regulatory RNA
pathways (R) | 2 |
4.200×10⁻² |
Construction of gene-transcription
factor regulation networks
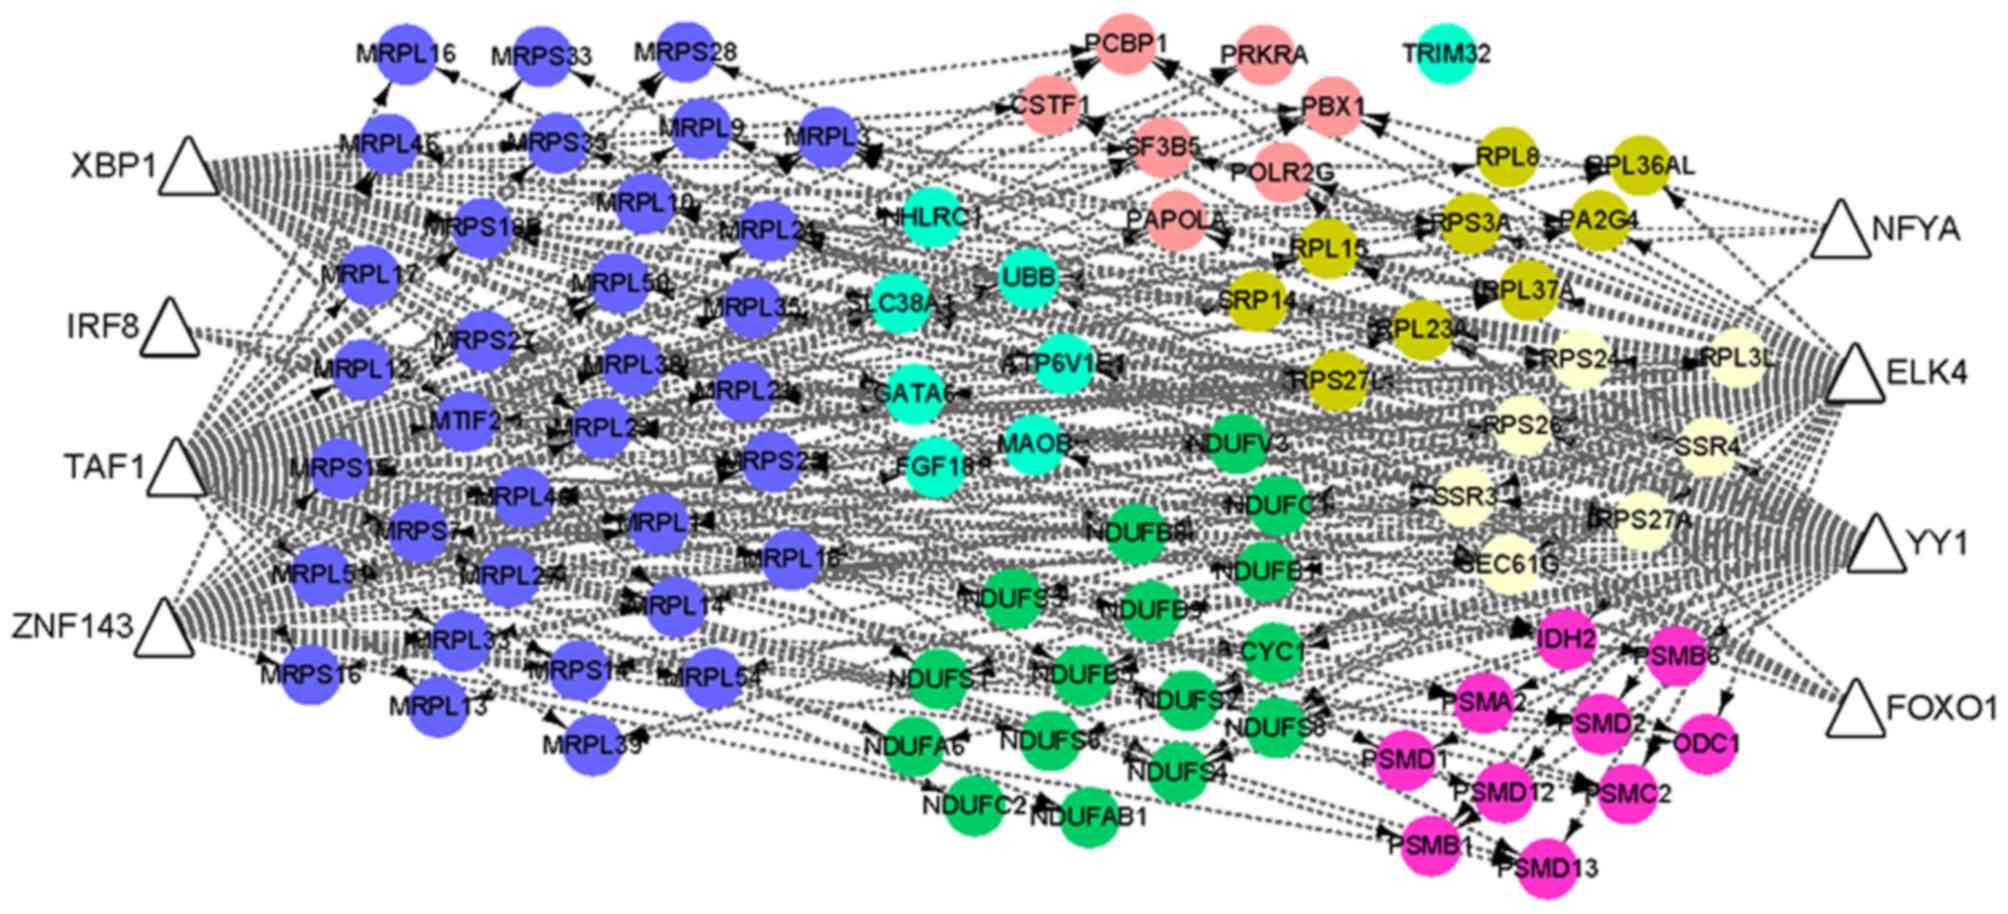
Using the iRegulon plugin, eight transcription
factors, including Xbox binding protein 1 (XBP1), ETS transcription
factor, forkhead box O1, interferon regulatory factor 8, TATA-box
binding protein associated factor 1, zinc finger protein 143,
nuclear transcription factor Y subunit α (NFYA) and YY1
transcription factor (YY1) were predicted to regulate DEGs in the
FI network (Fig. 4). Among them,
XBP1 was an upregulated gene, and its target genes included those
encoding ribosomal proteins (including RPS24, RPL37A, RPS27A,
RPS27L, RPL23A and RPL36AL), mitochondrial ribosomal proteins
(MRPS35, MRPL14, MRPL23 and MRPS18B), as well as NDUFB8, NDUFB5,
NDUFS4, NDUFS1, proteasome 26S subunit and non-ATPase 13. In
addition, a further two transcription factors (NFYA and YY1)
demonstrated differential expression patterns (Log2FC
>1) in the TOF samples when compared with the normal controls,
although their Log2FC values were lower than the
threshold (Table II).
| Table II.Transcription factors predicted to
regulate genes in the gene functional interaction networks. |
Table II.
Transcription factors predicted to
regulate genes in the gene functional interaction networks.
| Transcription
factor | Log2FC | P-value | Adjusted
P-value |
|---|
| NFYA | −1.70543 | 0.017312 | 0.066934 |
| XBP1 | 2.513494 | 0.000124 | 0.001634 |
| TAF1 | 0.065708 | 0.873505 | 0.922746 |
| FOXO1A | 0.315049 | 0.449193 | 0.607251 |
| ZNF143 | 0.675544 | 0.103911 | 0.227741 |
| IRF8 | −0.48724 | 0.423961 | 0.585214 |
| YY1 | 1.462285 | 0.001838 | 0.012075 |
| ELK4 | 0.281777 | 0.31807 | 0.482523 |
Discussion
Previously, Bittel et al (11) identified 1,062 DEGs using threshold
log2FC and FDR values of ≥2 and <0.05, respectively.
In the present study, 878 DEGs were identified using an FDR
threshold value of <0.01 and log2FC threshold values
>2. Gu et al (31)
identified 499 DEGs using the same microarray dataset (GSE26125)
with the narrower log2FC threshold values of >2.5 and
P-values of <0.01. Therefore, the number of DEGs identified
depended on the threshold values used. In addition, the methods and
software used for the bioinformatics analyses among these two
previous studies and the present study varied. Bittel et al
(11) used the Ingenuity Pathway
Analysis tool for ontological assessments, which is a curated
database and analytical bioinformatics system for identifying
interactions, functions and interconnections (networks) between
biological molecules. In addition, the differential expression
patterns of several genes involved in the WNT or Notch signaling
pathways were validated using reverse transcription-quantitative
polymerase chain reaction analysis. In the present study, as well
as the functional annotation of individual genes, an FI network was
constructed and pathway enrichment analysis for each function
module was performed. This was used to identify transcription
factors predicted to regulate genes in the FI network. Gu et
al (31) searched for
potential small-molecule drugs by mapping the identified DEGs to
the Connectivity Map database.
Bittel et al (11) demonstrated that the majority of the
DEGs with abnormal expression were involved in compensatory
functions, including hypertrophy, cardiac fibrosis and cardiac
dilation, while the WNT and Notch signaling pathways, which are
involved in spatial and temporal cell differentiation, appeared to
be suppressed (11). In the
present study, an FI network based on the identified DEGs was
constructed and the biological functions of these genes were
investigated using different databases. The results demonstrated
that these genes were dominantly enriched in signaling pathways
associated with ribosomes and protein translation, as well as
neurodegenerative disorders.
The MRPL and MRPS family genes in Module 0 and
S-ribosomal protein (RPS) and L-ribosomal protein (RPL) family
genes in Modules 3 and 5 were dominantly enriched in signaling
pathways associated with ribosomes and protein translation. MRPL
family genes, including MRPL40, MRPL10, MRPL13, MRPL12, MRPL14,
MRPL17, MRPL16, MRPL54, MRPL18, MRPL38, MRPL39, MRPL33 and MRPL35,
encode RPs that form the large subunit of mitochondrial ribosomes.
RPS and MRPS family genes, including MRPS35, MRPS16, MRPS33,
MRPS15, MRPS14, MRPS27, MRPS23, MRPS7 and MRPS18B, encode RPs that
form the small subunit of mitochondrial ribosomes. Meanwhile,
RPS26, RPS27A, RPS3A and RPS24 encode RPs of the small ribosomal
subunit, and RPL8, RPL15, RPL37A, RPL23A and RPL3L, encode RPs of
the large subunit. This suggests that the abnormal expression of
cytoplasmic and mitochondrial ribosomes may contribute to the
pathogenesis of TOF, which is consistent with the results of a
previous study that reported an increase in ribosome number in
patients with congenital heart disease (32). In addition, O'Brien et al
(33) observed a marked increase
in the expression of small nucleolar RNAs (snoRNAs) in the right
ventricular myocardium of 16 infants with nonsyndromic TOF, and
demonstrated that the target nucleotides of the differentially
expressed snoRNAs were primarily 28S and 18S ribosomal RNAs. These
results, together those of the present study suggests that the
differential expression of genes encoding ribosome subunits may be
associated with the dysregulation of snoRNAs. In a previous study
that investigated mutations in RPL5 and RPL11 genes in Czech
patients with Diamond-Blackfan anemia (34), a mutation in RPL5 in a patient with
TOF was reported. Therefore, this study may support the involvement
of RPL genes in the pathogenesis of TOF.
In the present study, multiple upregulated genes
encoding the subunits of the NADH dehydrogenase complex, including
NDUFB8, NDUFB5, NDUFS4 and NDUFS1, were enriched in three signaling
pathways associated with Parkinson's disease, Alzheimer's disease
and Huntington's disease. This indicates that TOF may share common
mechanisms with neurodegenerative disorders. However, the
association between NDUFB and NDUFS family genes and TOF has seldom
been reported, except for NDUFB5, which has been confirmed to be
expressed in mouse heart tissues (35). Despite the lack of direct evidence,
previous studies have supported a connection between TOF and
neurodegenerative disorders. For instance, Brown et al
(36) reported a case of a male
infant with infantile neurodegeneration and TOF, and Jinnou et
al (37) reported a case of a
male infant with pontocerebellar hypoplasia and TOF. These two
cases suggest that the pathological mechanisms underlying TOF and
neurodegenerative disorders may share common features.
Among the eight transcription factors predicted by
the iRegulon plugin in the present study, XBP1 expression was
observed to be upregulated in patients in the TOF group. Notably,
this gene was predicted to regulate genes encoding the subunits of
cytoplasmic and mitochondrial ribosomes, as well as genes involved
in neurodegenerative disorders. The XBP1 protein is characterized
by its ability to bind the conserved transcriptional Xbox element,
which is present in the promoter of the human leukocyte antigen DRα
(38). XBP1 is known to be a
marker of endoplasmic reticulum stress, a phenomenon that manifests
with the accumulation of unfolded proteins in the endoplasmic
reticulum (39), which frequently
occurs during ischemia/reperfusion following myocardial ischemia
(40). However, XBP1 is not a
known regulator of the aforementioned genes; therefore, further
studies that explore the role of XBP1 in the pathogenesis of TOF in
more detail are required.
In conclusion, the results of the present study
suggest that the dysregulation of genes encoding the mitochondrial
and cytoplasmic ribosomal subunits may contribute to the
pathogenesis of TOF via signaling pathways associated with
ribosomes and protein translation. In addition, genes encoding the
NADH dehydrogenase complex may contribute to the pathogenesis of
this disease via neurodegenerative disorder-associated signaling
pathways. As the transcription factor XBP1 was predicted to be
implicated in the regulation of genes involved in these signaling
pathways, it may therefore be involved in the pathogenesis of TOF.
However, this is yet to be validated in future studies. The results
of the present study provide an in-depth insight into the molecular
mechanisms underlying the pathogenesis of TOF.
Acknowledgements
The authors would like to thank all participants of
the present study, and all individuals that provided
assistance.
References
|
1
|
Gruber PJ and Epstein JA: Development gone
awry Congenital heart disease. Circ Res. 94:273–283. 2004.
View Article : Google Scholar : PubMed/NCBI
|
|
2
|
Apitz C, Webb GD and Redington AN:
Tetralogy of fallot. Lancet. 374:1462–1471. 2009. View Article : Google Scholar : PubMed/NCBI
|
|
3
|
Nemer G, Fadlalah F, Usta J, Nemer M,
Dbaibo G, Obeid M and Bitar F: A novel mutation in the GATA4 gene
in patients with tetralogy of fallot. Hum Mutat. 27:293–294. 2006.
View Article : Google Scholar : PubMed/NCBI
|
|
4
|
De Luca A, Sarkozy A, Ferese R, Consoli F,
Lepri F, Dentici ML, Vergara P, De Zorzi A, Versacci P, Digilio MC,
et al: New mutations in ZFPM2/FOG2 gene in tetralogy of fallot and
double outlet right ventricle. Clin Genet. 80:184–190. 2011.
View Article : Google Scholar : PubMed/NCBI
|
|
5
|
Lin X, Huo Z, Liu X, Zhang Y, Li L, Zhao
H, Yan B, Liu Y, Yang Y and Chen YH: A novel GATA6 mutation in
patients with tetralogy of fallot or atrial septal defect. J Hum
Genet. 55:662–667. 2010. View Article : Google Scholar : PubMed/NCBI
|
|
6
|
Pizzuti A, Sarkozy A, Newton AL, Conti E,
Flex E, Digilio MC, Amati F, Gianni D, Tandoi C, Marino B, et al:
Mutations of ZFPM2/FOG2 gene in sporadic cases of tetralogy of
fallot. Hum Mutat. 22:372–377. 2003. View Article : Google Scholar : PubMed/NCBI
|
|
7
|
Le Caignec C, Lefevre M, Schott JJ,
Chaventre A, Gayet M, Calais C and Moisan JP: Familial deafness,
congenital heart defects, and posterior embryotoxon caused by
cysteine substitution in the first epidermal-growth-factor-like
domain of jagged 1. Am J Hum Genet. 71:180–186. 2002. View Article : Google Scholar : PubMed/NCBI
|
|
8
|
Momma K, Kondo C, Ando M, Matsuoka R and
Takao A: Tetralogy of fallot associated with chromosome 22q11
deletion. Am J Cardiol. 76:618–621. 1995. View Article : Google Scholar : PubMed/NCBI
|
|
9
|
Maeda J, Yamagishi H, Matsuoka R, Ishihara
J, Tokumura M, Fukushima H, Ueda H, Takahashi E, Yoshiba S and
Kojima Y: Frequent association of 22q11.2 deletion with tetralogy
of fallot. Am J Med Genet. 92:269–272. 2000. View Article : Google Scholar : PubMed/NCBI
|
|
10
|
Lahm H, Schön P, Doppler S, Dreßen M,
Cleuziou J, Deutsch MA, Ewert P, Lange R and Krane M: Tetralogy of
fallot and hypoplastic left heart syndrome-complex clinical
phenotypes meet complex genetic networks. Curr Genomics.
16:141–158. 2015. View Article : Google Scholar : PubMed/NCBI
|
|
11
|
Bittel DC, Butler MG, Kibiryeva N,
Marshall JA, Chen J, Lofland GK and O'Brien JE Jr: Gene expression
in cardiac tissues from infants with idiopathic conotruncal
defects. BMC Med Genomics. 4:12011. View Article : Google Scholar : PubMed/NCBI
|
|
12
|
Edgar R, Domrachev M and Lash AE: Gene
expression omnibus: NCBI gene expression and hybridization array
data repository. Nucleic Acids Res. 30:207–210. 2002. View Article : Google Scholar : PubMed/NCBI
|
|
13
|
Irizarry RA, Hobbs B, Collin F,
Beazer-Barclay YD, Antonellis KJ, Scherf U and Speed TP:
Exploration, normalization, and summaries of high density
oligonucleotide array probe level data. Biostatistics. 4:249–264.
2003. View Article : Google Scholar : PubMed/NCBI
|
|
14
|
Gautier L, Cope L, Bolstad BM and Irizarry
RA: affy-analysis of Affymetrix GeneChip data at the probe level.
Bioinformatics. 20:307–315. 2004. View Article : Google Scholar : PubMed/NCBI
|
|
15
|
Ritchie ME, Phipson B, Wu D, Hu Y, Law CW,
Shi W and Smyth GK: limma powers differential expression analyses
for RNA-sequencing and microarray studies. Nucleic Acids Res.
43:e472015. View Article : Google Scholar : PubMed/NCBI
|
|
16
|
Suzuki R and Shimodaira H: Pvclust: An R
package for assessing the uncertainty in hierarchical clustering.
Bioinformatics. 22:1540–1542. 2006. View Article : Google Scholar : PubMed/NCBI
|
|
17
|
Chen J, Bardes EE, Aronow BJ and Jegga AG:
ToppGene suite for gene list enrichment analysis and candidate gene
prioritization. Nucleic Acids Res. 37:(Web Server issue).
W305–W311. 2009. View Article : Google Scholar : PubMed/NCBI
|
|
18
|
Gene Ontology Consortium, . Gene ontology
consortium: Going forward. Nucleic Acids Res. 43:(Database issue).
D1049–D1056. 2015. View Article : Google Scholar : PubMed/NCBI
|
|
19
|
Geer LY, Marchler-Bauer A, Geer RC, Han L,
He J, He S, Liu C, Shi W and Bryant SH: The NCBI bioSystems
database. Nucleic Acids Res. 38:(Database issue). D492–D496. 2010.
View Article : Google Scholar : PubMed/NCBI
|
|
20
|
Latendresse M, Paley S and Karp PD:
Browsing metabolic and regulatory networks with BioCyc. Methods Mol
Biol. 804:197–216. 2012. View Article : Google Scholar : PubMed/NCBI
|
|
21
|
Kanehisa M and Goto S: KEGG: Kyoto
encyclopaedia of genes and genomes. Nucleic Acids Res. 28:27–30.
2000. View Article : Google Scholar : PubMed/NCBI
|
|
22
|
Croft D, Mundo AF, Haw R, Milacic M,
Weiser J, Wu G, Caudy M, Garapati P, Gillespie M, Kamdar MR, et al:
The reactome pathway knowledgebase. Nucleic Acids Res. 42:(Database
issue). D472–D477. 2014. View Article : Google Scholar : PubMed/NCBI
|
|
23
|
Fabregat A, Sidiropoulos K, Garapati P,
Gillespie M, Hausmann K, Haw R, Jassal B, Jupe S, Korninger F,
McKay S, et al: The reactome pathway knowledgebase. Nucleic Acids
Res. 44:D481–D487. 2016. View Article : Google Scholar : PubMed/NCBI
|
|
24
|
Thomas PD, Campbell MJ, Kejariwal A, Mi H,
Karlak B, Daverman R, Diemer K, Muruganujan A and Narechania A:
PANTHER: A library of protein families and subfamilies indexed by
function. Genome Res. 13:2129–2141. 2003. View Article : Google Scholar : PubMed/NCBI
|
|
25
|
Petri V, Jayaraman P, Tutaj M, Hayman GT,
Smith JR, De Pons J, Laulederkind SJ, Lowry TF, Nigam R, Wang SJ,
et al: The pathway ontology-updates and applications. J Biomed
Semantics. 5:72014. View Article : Google Scholar : PubMed/NCBI
|
|
26
|
Frolkis A, Knox C, Lim E, Jewison T, Law
V, Hau DD, Liu P, Gautam B, Ly S, Guo AC, et al: SMPDB: The small
molecule pathway database. Nucleic Acids Res. 38:(Database issue).
D480–D487. 2010. View Article : Google Scholar : PubMed/NCBI
|
|
27
|
Jewison T, Su Y, Disfany FM, Liang Y, Knox
C, Maciejewski A, Poelzer J, Huynh J, Zhou Y, Arndt D, et al: SMPDB
2.0: Big improvements to the small molecule pathway database.
Nucleic Acids Res. 42:(Database issue). D478–D484. 2014. View Article : Google Scholar : PubMed/NCBI
|
|
28
|
Wu G, Dawson E, Duong A, Haw R and Stein
L: ReactomeFIViz: A Cytoscape app for pathway and network-based
data analysis. F1000Res. 3:1462014.PubMed/NCBI
|
|
29
|
Shannon P, Markiel A, Ozier O, Baliga NS,
Wang JT, Ramage D, Amin N, Schwikowski B and Ideker T: Cytoscape: A
software environment for integrated models of biomolecular
interaction networks. Genome Res. 13:2498–2504. 2003. View Article : Google Scholar : PubMed/NCBI
|
|
30
|
Janky R, Verfaillie A, Imrichová H, Van de
Sande B, Standaert L, Christiaens V, Hulselmans G, Herten K, Naval
Sanchez M, Potier D, et al: iRegulon: From a gene list to a gene
regulatory network using large motif and track collections. PLoS
Comput Biol. 10:e10037312014. View Article : Google Scholar : PubMed/NCBI
|
|
31
|
Gu Q, Chen XT, Xiao YB, Chen L, Wang XF,
Fang J, Chen BC and Hao J: Identification of differently expressed
genes and small molecule drugs for tetralogy of fallot by
bioinformatics strategy. Pediatr Cardiol. 35:863–869. 2014.
View Article : Google Scholar : PubMed/NCBI
|
|
32
|
Jones M and Ferrans VJ: Myocardial
degeneration in congenital heart disease: Comparison of morphologic
findings in young and old patients with congenital heart disease
associated with muscular obstruction to right ventricular outflow.
Am J Cardiol. 39:1051–1063. 1977. View Article : Google Scholar : PubMed/NCBI
|
|
33
|
O'Brien JE Jr, Kibiryeva N, Zhou XG,
Marshall JA, Lofland GK, Artman M, Chen J and Bittel DC: Noncoding
RNA expression in myocardium from infants with tetralogy of fallot.
Circ Cardiovasc Genet. 5:279–286. 2012. View Article : Google Scholar : PubMed/NCBI
|
|
34
|
Cmejla R, Cmejlova J, Handrkova H, Petrak
J, Petrtylova K, Mihal V, Stary J, Cerna Z, Jabali Y and
Pospisilova D: Identification of mutations in the ribosomal protein
L5 (RPL5) and ribosomal protein L11 (RPL11) genes in Czech patients
with Diamond-Blackfan anemia. Hum Mutat. 30:321–327. 2009.
View Article : Google Scholar : PubMed/NCBI
|
|
35
|
Komurcu-Bayrak E, Ozsait B and
Erginel-Unaltuna N: Isolation and analysis of genes mainly
expressed in adult mouse heart using subtractive hybridization cDNA
library. Mol Biol Rep. 39:8065–8074. 2012. View Article : Google Scholar : PubMed/NCBI
|
|
36
|
Brown GK, Hunt SM, Scholem R, Fowler K,
Grimes A, Mercer JF, Truscott RM, Cotton RG, Rogers JG and Danks
DM: beta-Hydroxyisobutyryl coenzyme A deacylase deficiency: A
defect in valine metabolism associated with physical malformations.
Pediatrics. 70:532–538. 1982.PubMed/NCBI
|
|
37
|
Jinnou H, Okanishi T, Enoki H and Ohki S:
Pontocerebellar hypoplasia type 3 with tetralogy of fallot. Brain
Dev. 34:392–395. 2012. View Article : Google Scholar : PubMed/NCBI
|
|
38
|
Romero-Ramirez L, Cao H, Nelson D, Hammond
E, Lee AH, Yoshida H, Mori K, Glimcher LH, Denko NC, Giaccia AJ, et
al: XBP1 is essential for survival under hypoxic conditions and is
required for tumor growth. Cancer Res. 64:5943–5947. 2004.
View Article : Google Scholar : PubMed/NCBI
|
|
39
|
Li Y, Xu S, Giles A, Nakamura K, Lee JW,
Hou X, Donmez G, Li J, Luo Z, Walsh K, et al: Hepatic
overexpression of SIRT1 in mice attenuates endoplasmic reticulum
stress and insulin resistance in the liver. FASEB J. 25:1664–1679.
2011. View Article : Google Scholar : PubMed/NCBI
|
|
40
|
Yamamoto T and Sadoshima J: Protection of
the heart against ischemia/reperfusion by silent information
regulator 1. Trends Cardiovasc Med. 21:27–32. 2011. View Article : Google Scholar : PubMed/NCBI
|