Introduction
Osteoarthritis (OA) is the most common arthritic
disease in humans, affecting the majority of individuals over 65
years of age (1). OA most affects
the joint including hands, knees, spine and hips, and is a leading
musculoskeletal disease with declining joint functions (1). It takes a worldwide toll in the light
of decreased physical ability, increased morbidity, and causes a
substantial economic burden as well as serious socioeconomic
consequences (2). Treatment of OA
includes pain alleviation, the functional capacities maintenance
and quality-of-life improvement (3). However, there are no effective
interventions to decelerate the progression of OA since the precise
mechanisms that involved in the pathogenesis of OA remain largely
unknown.
OA has been recently considered as a multifactorial
whole-joint disease that can affect the whole joint, including
structural defects, cellular changes, and dysfunction of all
compartments of the joint, such as cartilage, bone and synovium
(4). Evidence has demonstrated
that degradation and loss of articular cartilage, hypertrophic
changes in bone, subchondral bone remodeling, and inflammation of
the synovium are the main characteristics of this disease (5). Recently, Wang et al had showed
that proteins of the complement system were differentially
expressed in osteoarthritic synovial fluids compared to those from
healthy individuals (6). Vance
et al observed that highly expressed genes in the synovial
fluid from patients with early meniscal injury having no OA
symptoms were associated with OA and inflammation, such as
Leukocyte-Associated Immunoglobulin-Like Receptor 1 (LAIR1) and
Chemokine (C-C Motif) Receptor 6 (CCR6) (7). Although progresses have been gained
about the pathogenesis of OA, concrete genetic mechanisms of OA
remain to be elucidated.
In the present study, we downloaded the microarray
data of GSE32317 from a public database. With the same microarray
data, Zhu et al demonstrated that Tachykinin, Precursor 1
(TAC1) and the G protein-coupled receptor pathway might play
significant roles in the progression of the early and late stages
of OA (8). In addition, the work
of Ma et al showed that the genes related immune response,
cartilage development, and genes involve in the Toll-like receptor
(TLR) signaling pathway and Wnt signaling pathway might be the
potential target genes for the OA treatment (9). In this study, we analyzed the
differentially expressed genes (DEGs) in samples of synovial
membrane from patients with early stage of knee OA and late stage
of knee OA compared with healthy specimens. Comprehensive
bioinformatics analysis was applied to analyze the significant
functions and pathways that were enriched by the common DEGs
identified both in early-stage knee OA samples and late-stage knee
OA samples. Besides, a protein-protein interaction (PPI) network
was constructed and significant modules were extracted. Moreover,
transcription factors (TFs) that could regulate genes in the
significant modules were identified. We sought to gain more
insights into the molecular circuitry in OA and identify more
potential target genes for OA treatment.
Materials and methods
Microarray data
The microarray data of GSE32317, which was deposited
by Wang et al (6), was
downloaded from the NCBI Gene Expression Omnibus (GEO) database
(http://www.ncbi.nlm.nih.gov/geo/query/acc.cgi?acc=GSE32317).
The platform information is GPL570 [HG-U133_Plus_2] Affymetrix
Human Genome U133 Plus 2.0 Array. This dataset consisted of 26
samples of synovial membrane from the suprapatellar pouch of 10
early-stage knee OA patients who were undergoing arthroscopic
procedures for degenerative meniscal tears (with documented
cartilage degeneration but no full-thickness cartilage loss,
Kellgren Lawrence score ≤2), and of 9 patients with end-stage knee
OA (diffuse full thickness cartilage erosion) who were undergoing
total knee joint replacement, and 7 healthy individual samples
which were run on the same platform and array (from GEO accession
number GSE12021) as our OA samples. In this study, the samples from
early-stage knee OA patients, end-stage knee OA patients and
healthy individuals were named as OA_Early, OA_End and Healthy,
respectively.
Data preprocessing and screening of
DEGs
The preprocessed microarray data that was conducted
by robust multi-array average (RMA) algorithm (10) were obtained. Subsequently, probe ID
was converted into gene symbol using the R/Bioconductor platform
annotation packages hgu133plus2.db (11), org.Hs.eg.db (12), annotate (13). When several probes were mapped to a
same gene symbol, the average value of these probes was calculated
as the expression value of this gene. Then, 20389 gene expression
matrix were obtained.
DEGs in OA_Early vs. Healthy and OA_End vs. Healthy
were analyzed. Unpaired t test in limma package (14) was used to calculate P-values to
determine the significance of DEGs. False discovery rate (FDR)
(15) was applied to carry out the
correction of multiple testing using Benjamini and Hochberg (BH)
method (16). In this study,
|log2fold change (FC) |≥1 and FDR <0.05 were selected
as the threshold for DEGs screening. Moreover, the common DEGs in
OA_Early vs. Healthy and OA_End vs. Healthy with the same gene
change were considered to be potentially associated with the
mechanism of OA. In this study, the common DEGs with same gene
change in these two groups were identified and were our focus. Venn
diagram was constructed using Venny 2.0 (http://bioinfogp.cnb.csic.es/tools/venny/).
Function and pathway enrichment
analysis
ToppGene Suite (http://toppgene.cchmc.org) which is free and open to
all users is a one-stop portal for gene list enrichment analysis,
and candidate gene prioritization (17). ToppFun application from Toppgene
suit can provide gene enrichment analysis in many biological
categories, such as Gene Ontology (GO) terms and biological
pathways (18). Specially, in the
pathway analysis, ToppFun can use a comprehensive collection of
pathways from several major databases such as KEGG, Reactome, and
BioCarta (18). In this study, we
undertook gene enrichment analysis of common upregulated genes and
common downregulated genes using the ToppGene Suite ToppFun
software (17). GO term or pathway
was identified as significant under a BH multiple correction at a
FDR value cut-off of 0.05.
PPI network construction
In this study, the PPI network was retrieved from
the Search Tool for the Retrieval of Interacting Genes (STRING)
database (19), which is a
database providing ease of access to known and predicted protein
interactions. Proteins included in the PPI network were all common
DEGs with the same gene change in OA_Early vs. Healthy and OA_End
vs. Healthy. Interaction pairs with a confidence score >0.7 were
input to construct the PPI network. Additionally, Cytoscape
software (6) was used for network
visualizations, where nodes indicated proteins and edges
represented interactions between any two proteins. Moreover, the
degree of each node in this PPI network was calculated and the
nodes with higher degree were considered as hub proteins.
Besides, significant modules in the PPI network were
analyzed using Clustering with Overlapping Neighborhood Expansion
(ClusterONE) tool, which is designed to identify densely connected
regions (20). P<0.0001 was set
as the cut-off value. In addition, pathway enrichment analysis was
performed on the significant modules selected.
Search for candidate TFs for genes in
significant modules
iRegulon (21),
available as a Cytoscape plugin (6), implements a genome-wide
ranking-and-recovery approach to detect enriched TF motifs and
their optimal sets of direct target genes. In this study, we
executed iRegulon and screened TFs for genes in the significant
modules identified. The parameters were set as: Minimum identity
between orthologous genes, 0.05; maximum false discovery rate on
motif similarity, 0.001. The default Normalized Enrichment Score
(NES) cut-off in iRegulon is set at 3.0, corresponding to FDR
between 3% and 9% (21). In the
present study, we selected the TF-gene pairs with NES above 5 for
the follow-up analysis.
Results
DEGs screening
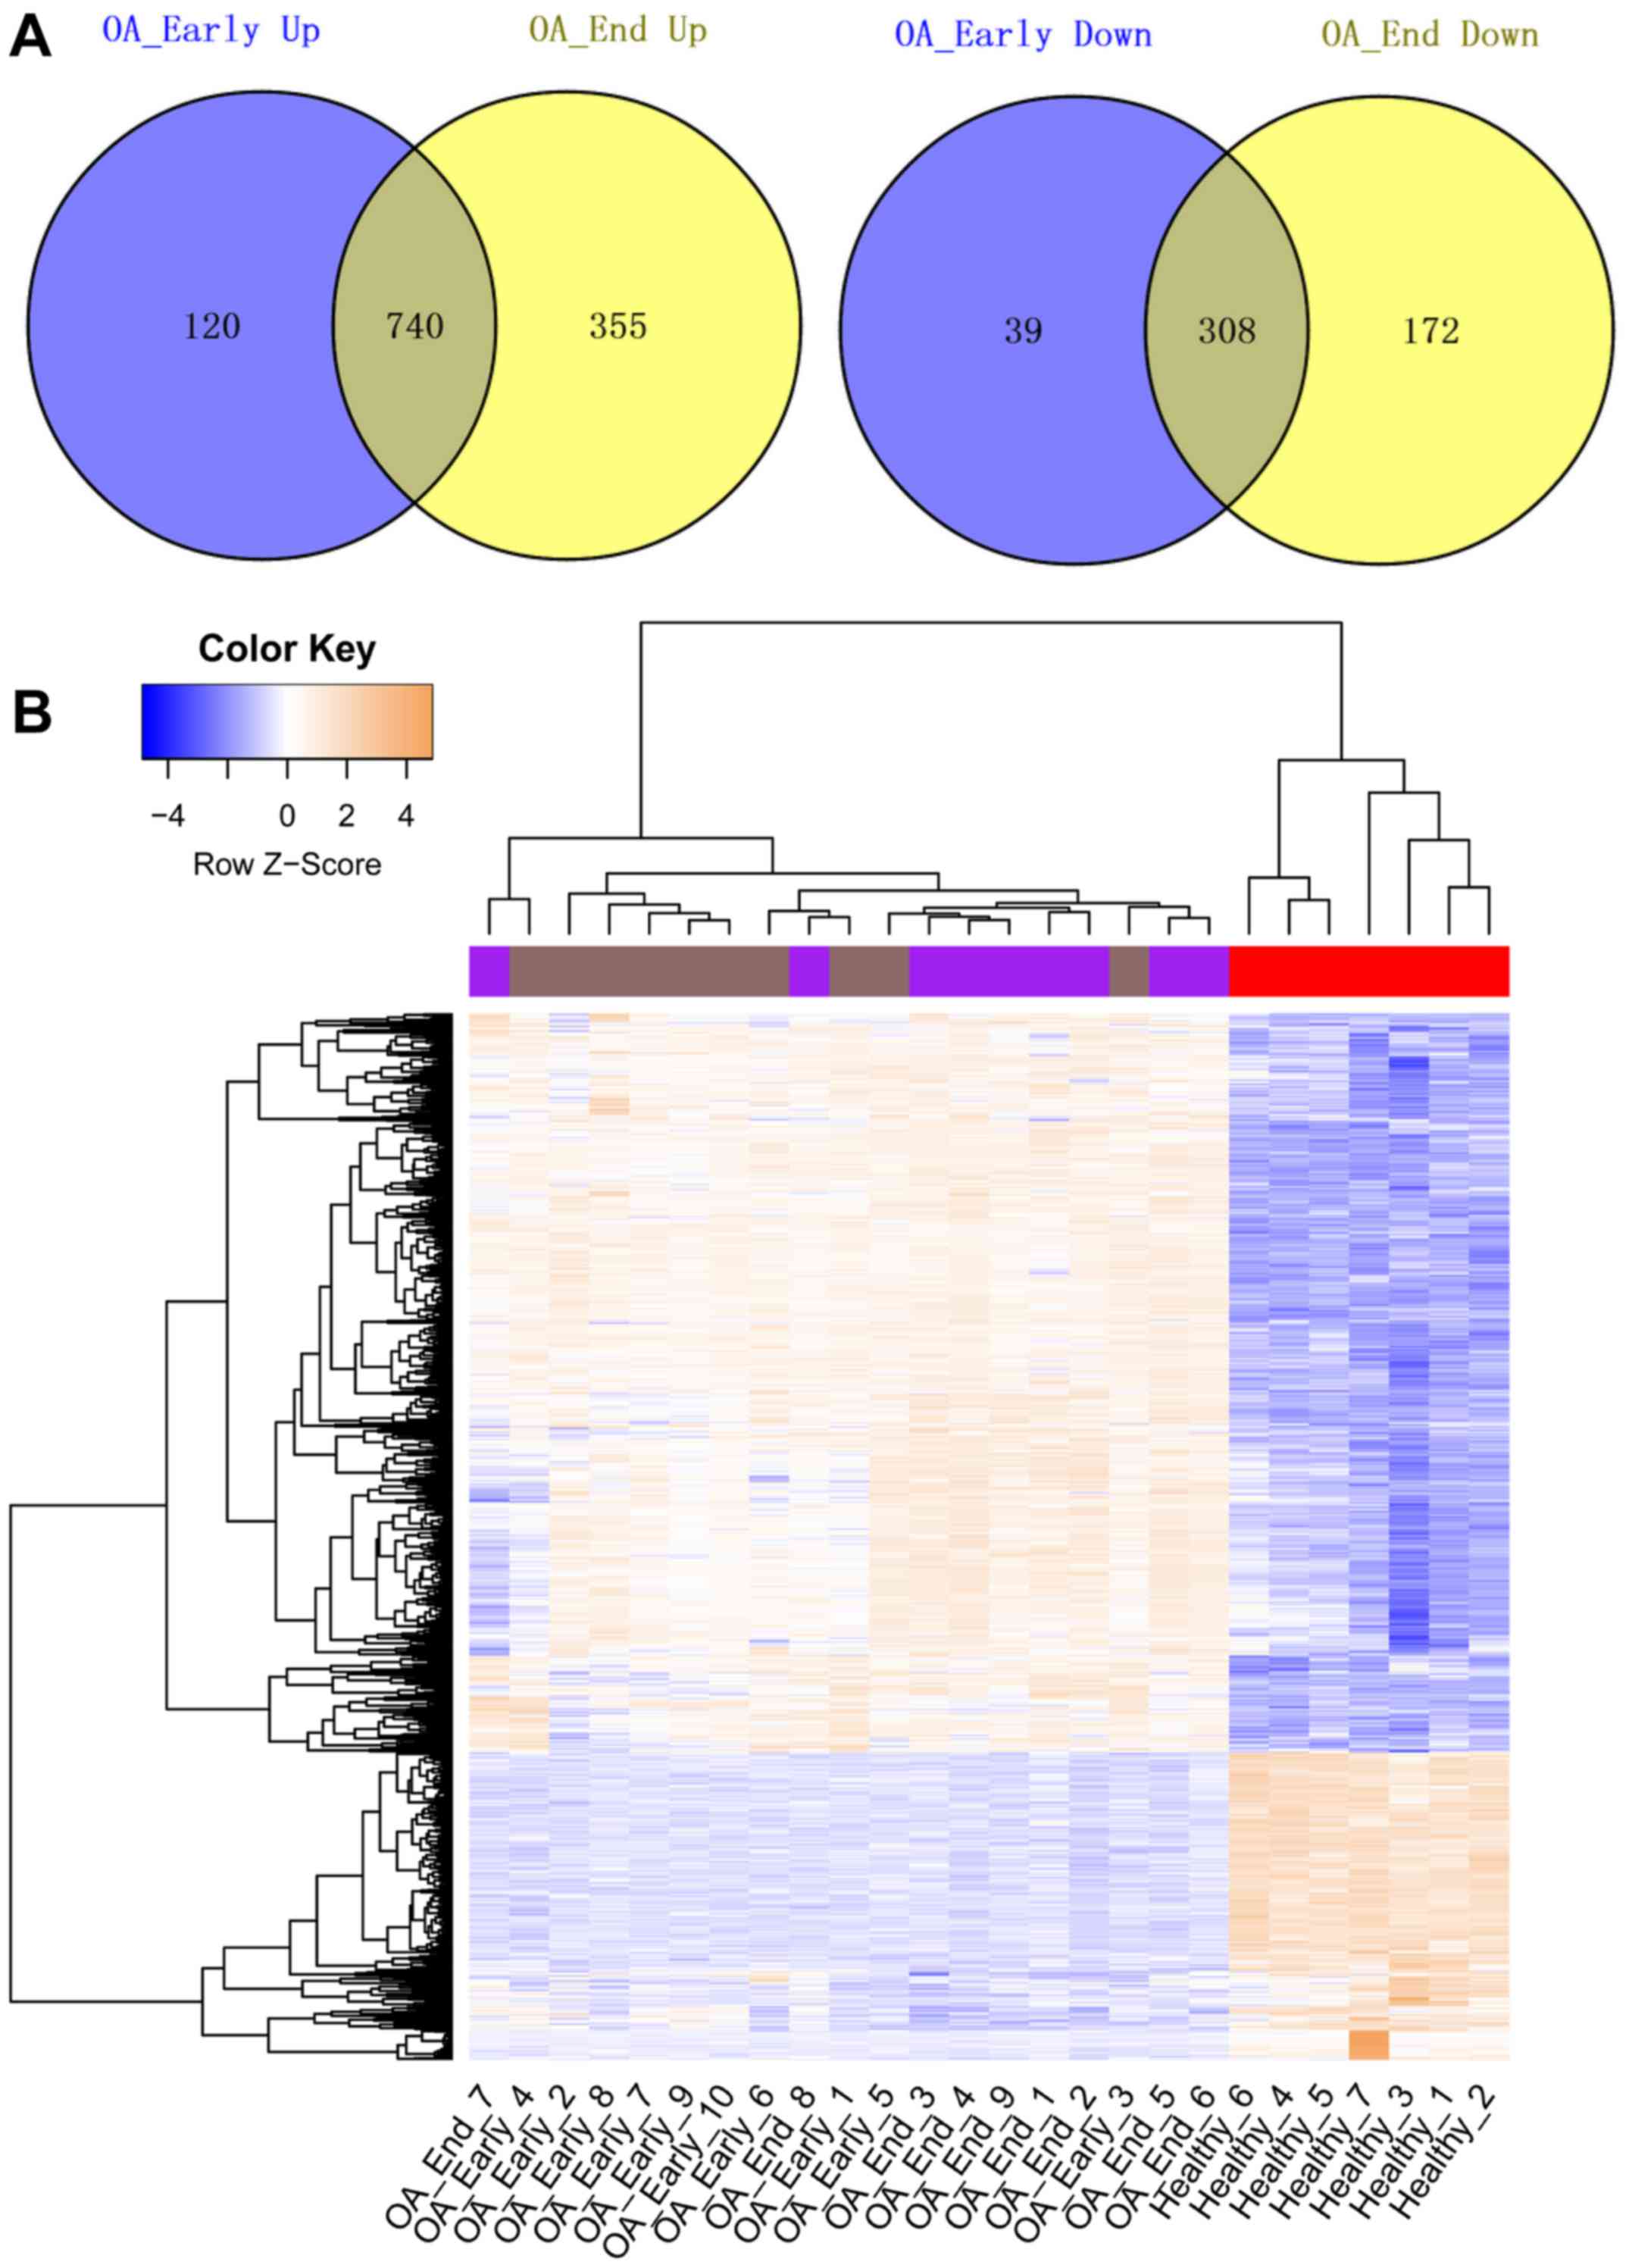
Compared with the Healthy samples, a total of 1,207
and 1,575 DEGs were identified in OA_Early and OA_End samples,
respectively. The Venn diagrams representing upregulated genes and
downregulated genes identified in OA_Early and OA_End were shown in
Fig. 1A. From the results, we
found that total 740 genes were upregulated in both OA_Early and
OA_End samples. While a total of 308 common downregulated genes
were identified in OA_Early and OA_End samples. The heat map of
these common upregulated and downregulated genes was represented in
Fig. 1B, showing that these common
DEGs could significantly distinguish knee OA samples from Healthy
samples.
GO and KEGG pathway enrichment
analysis
The top 5 over-represented GO terms, including
molecular function (MF), biological processes (BP), and cellular
component (CC) categories of the common up and downregulated genes
were summarized in Tables I and
II. Results showed that the
common upregulated genes were significantly associated with immune
response, receptor binding, and cell activation. Besides, the
common downregulated genes were significantly enriched in different
GO terms, such as structural constituent of muscle, structural
molecule activity, and neuropeptide binding. On the other hand, the
results of pathway enrichment analysis were shown in Table III (only most significant
pathways were shown). In special, the common upregulated genes were
found to be enriched in distinct pathways, such as rheumatoid
arthritis. The downregulated genes were enriched in only two
pathways, namely, GPCRs, Class A Rhodopsin-like and Striated Muscle
Contraction.
 | Table I.Top 5 over-represented GO terms mapped
to each category of common upregulated genes. |
Table I.
Top 5 over-represented GO terms mapped
to each category of common upregulated genes.
| Category | GO ID | Name | FDR | Count |
|---|
| MF | GO:0038024 | cargo receptor
activity | 2.13E-02 | 11 |
|
| GO:0004715 | non-membrane spanning
protein tyrosine kinase activity | 2.13E-02 |
9 |
|
| GO:0005102 | receptor binding | 4.90E-02 | 79 |
| BP | GO:0006955 | immune response | 2.22E-19 | 131 |
|
| GO:0050776 | regulation of immune
response | 3.49E-15 | 85 |
|
| GO:0002682 | regulation of immune
system process | 1.22E-14 | 108 |
|
| GO:0002684 | positive regulation
of immune system process | 1.22E-14 | 79 |
|
| GO:0001775 | cell activation | 1.78E-14 | 90 |
| CC | GO:0005764 | lysosome | 4.58E-10 | 52 |
|
| GO:0000323 | lytic vacuole | 4.58E-10 | 52 |
|
| GO:0005773 | vacuole | 5.51E-09 | 53 |
|
| GO:0005765 | lysosomal
membrane | 7.78E-06 | 28 |
|
| GO:0005774 | vacuolar
membrane | 2.57E-05 | 29 |
| Table II.Top 5 over-represented GO terms
mapped to each category of common downregulated genes. |
Table II.
Top 5 over-represented GO terms
mapped to each category of common downregulated genes.
| Category | GO ID | Name | FDR | Count |
|---|
| MF | GO:0008307 | structural
constituent of muscle | 2.68E-03 | 6 |
|
| GO:0005198 | structural molecule
activity | 1.78E-02 | 19 |
|
| GO:0042923 | neuropeptide
binding | 1.89E-02 | 3 |
|
| GO:0003779 | actin binding | 3.97E-02 | 13 |
|
| GO:0051373 | FATZ binding | 3.97E-02 | 2 |
| BP | GO:0003012 | muscle system
process | 7.23E-05 | 19 |
|
| GO:0055002 | striated muscle
cell development | 1.94E-03 | 11 |
|
| GO:0055001 | muscle cell
development | 2.73E-03 | 11 |
|
| GO:0006936 | muscle
contraction | 5.84E-03 | 14 |
|
| GO:0018149 | peptide
cross-linking | 9.77E-03 | 5 |
| CC | GO:0030016 | myofibril | 1.31E-06 | 15 |
|
| GO:0030017 | sarcomere | 1.31E-06 | 14 |
|
| GO:0043292 | contractile
fiber | 1.31E-06 | 15 |
|
| GO:0044449 | contractile fiber
part | 2.22E-06 | 14 |
|
| GO:0031674 | I band | 6.58E-05 | 10 |
| Table III.The most significant pathways
enriched by common upregulated genes and common downregulated
genes. |
Table III.
The most significant pathways
enriched by common upregulated genes and common downregulated
genes.
| Gene change | Database | ID | Name | P-value | Count |
|---|
| Up | BioSystems:
KEGG | 172846 | Staphylococcus
aureus infection | 4.79E-09 | 18 |
|
| BioSystems:
KEGG | 200309 | Rheumatoid
arthritis | 1.68E-07 | 20 |
|
| BioSystems:
KEGG | 213780 | Tuberculosis | 1.21E-05 | 25 |
|
| BioSystems:
KEGG | 128760 | Intestinal immune
network for IgA production | 1.35E-04 | 12 |
|
| BioSystems:
KEGG | 99052 | Lysosome | 2.47E-04 | 18 |
|
| BioSystems:
KEGG | 83051 | Cytokine-cytokine
receptor interaction | 7.82E-04 | 27 |
|
| MSigDB C2:
BioCarta | M917 | Complement
pathway | 9.05E-04 | 7 |
|
| BioSystems:
KEGG | 144181 | Leishmaniasis | 1.04E-03 | 13 |
|
| BioSystems:
REACTOME | 366160 | Adaptive immune
system | 1.04E-03 | 48 |
|
| MSigDB C2:
BioCarta | M7146 | Classical
complement pathway | 1.16E-03 | 6 |
|
| BioSystems:
KEGG | 842771 | Inflammatory bowel
disease (IBD) | 1.47E-03 | 12 |
|
| BioSystems:
WikiPathways | 198823 | Complement
activation, classical pathway | 3.62E-03 | 6 |
| Down | BioSystems:
WikiPathways | 198886 | GPCRs, Class A
Rhodopsin-like | 1.24E-02 | 12 |
|
| BioSystems:
WikiPathways | 198903 | Striated muscle
contraction | 1.84E-02 | 5 |
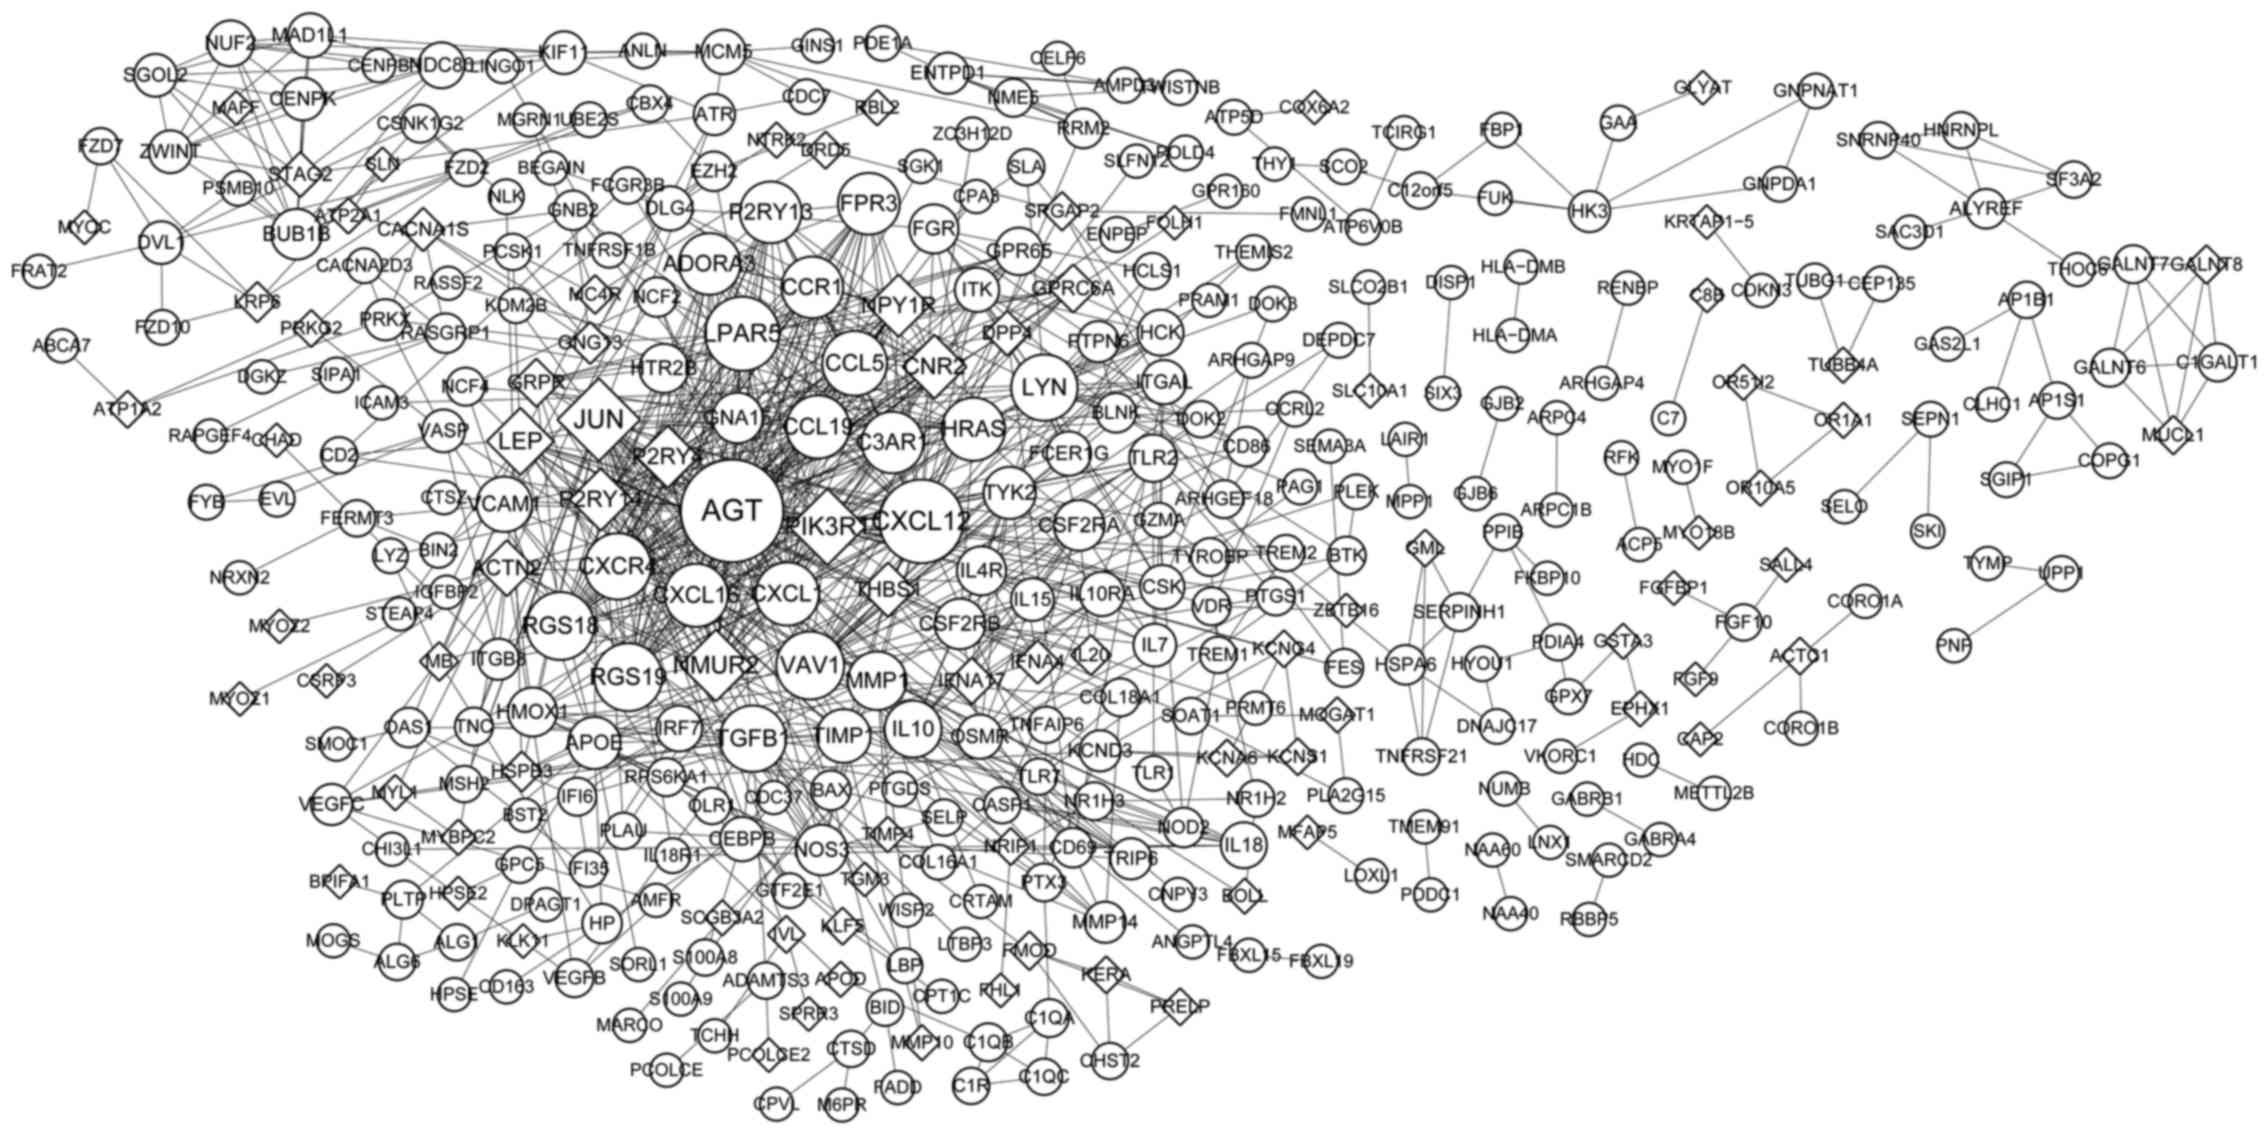
PPI network analysis
The PPI based on the common DEGs was constructed as
shown in Fig. 2, consisting of 378
nodes (proteins) and 895 interactions (edges). Nodes with higher
degree were Angiotensinogen (Serpin Peptidase Inhibitor, Clade A,
Member 8) (AGT) (degree=45), Chemokine (C-X-C Motif) Ligand 12
(CXCL12) (degree=33), Jun Proto-Oncogene (JUN) (degree=32),
Phosphoinositide-3-Kinase, Regulatory Subunit 1 (Alpha) (PIK3R1)
(degree=28), Lysophosphatidic Acid Receptor 5 (LPAR5) (degree=27),
Neuromedin U Receptor 2 (NMUR2) (degree=25), Regulator Of G-Protein
Signaling 18 (RGS18) (degree=23), RGS19 (degree=23), Vav 1 Guanine
Nucleotide Exchange Factor (VAV1) (degree=23).
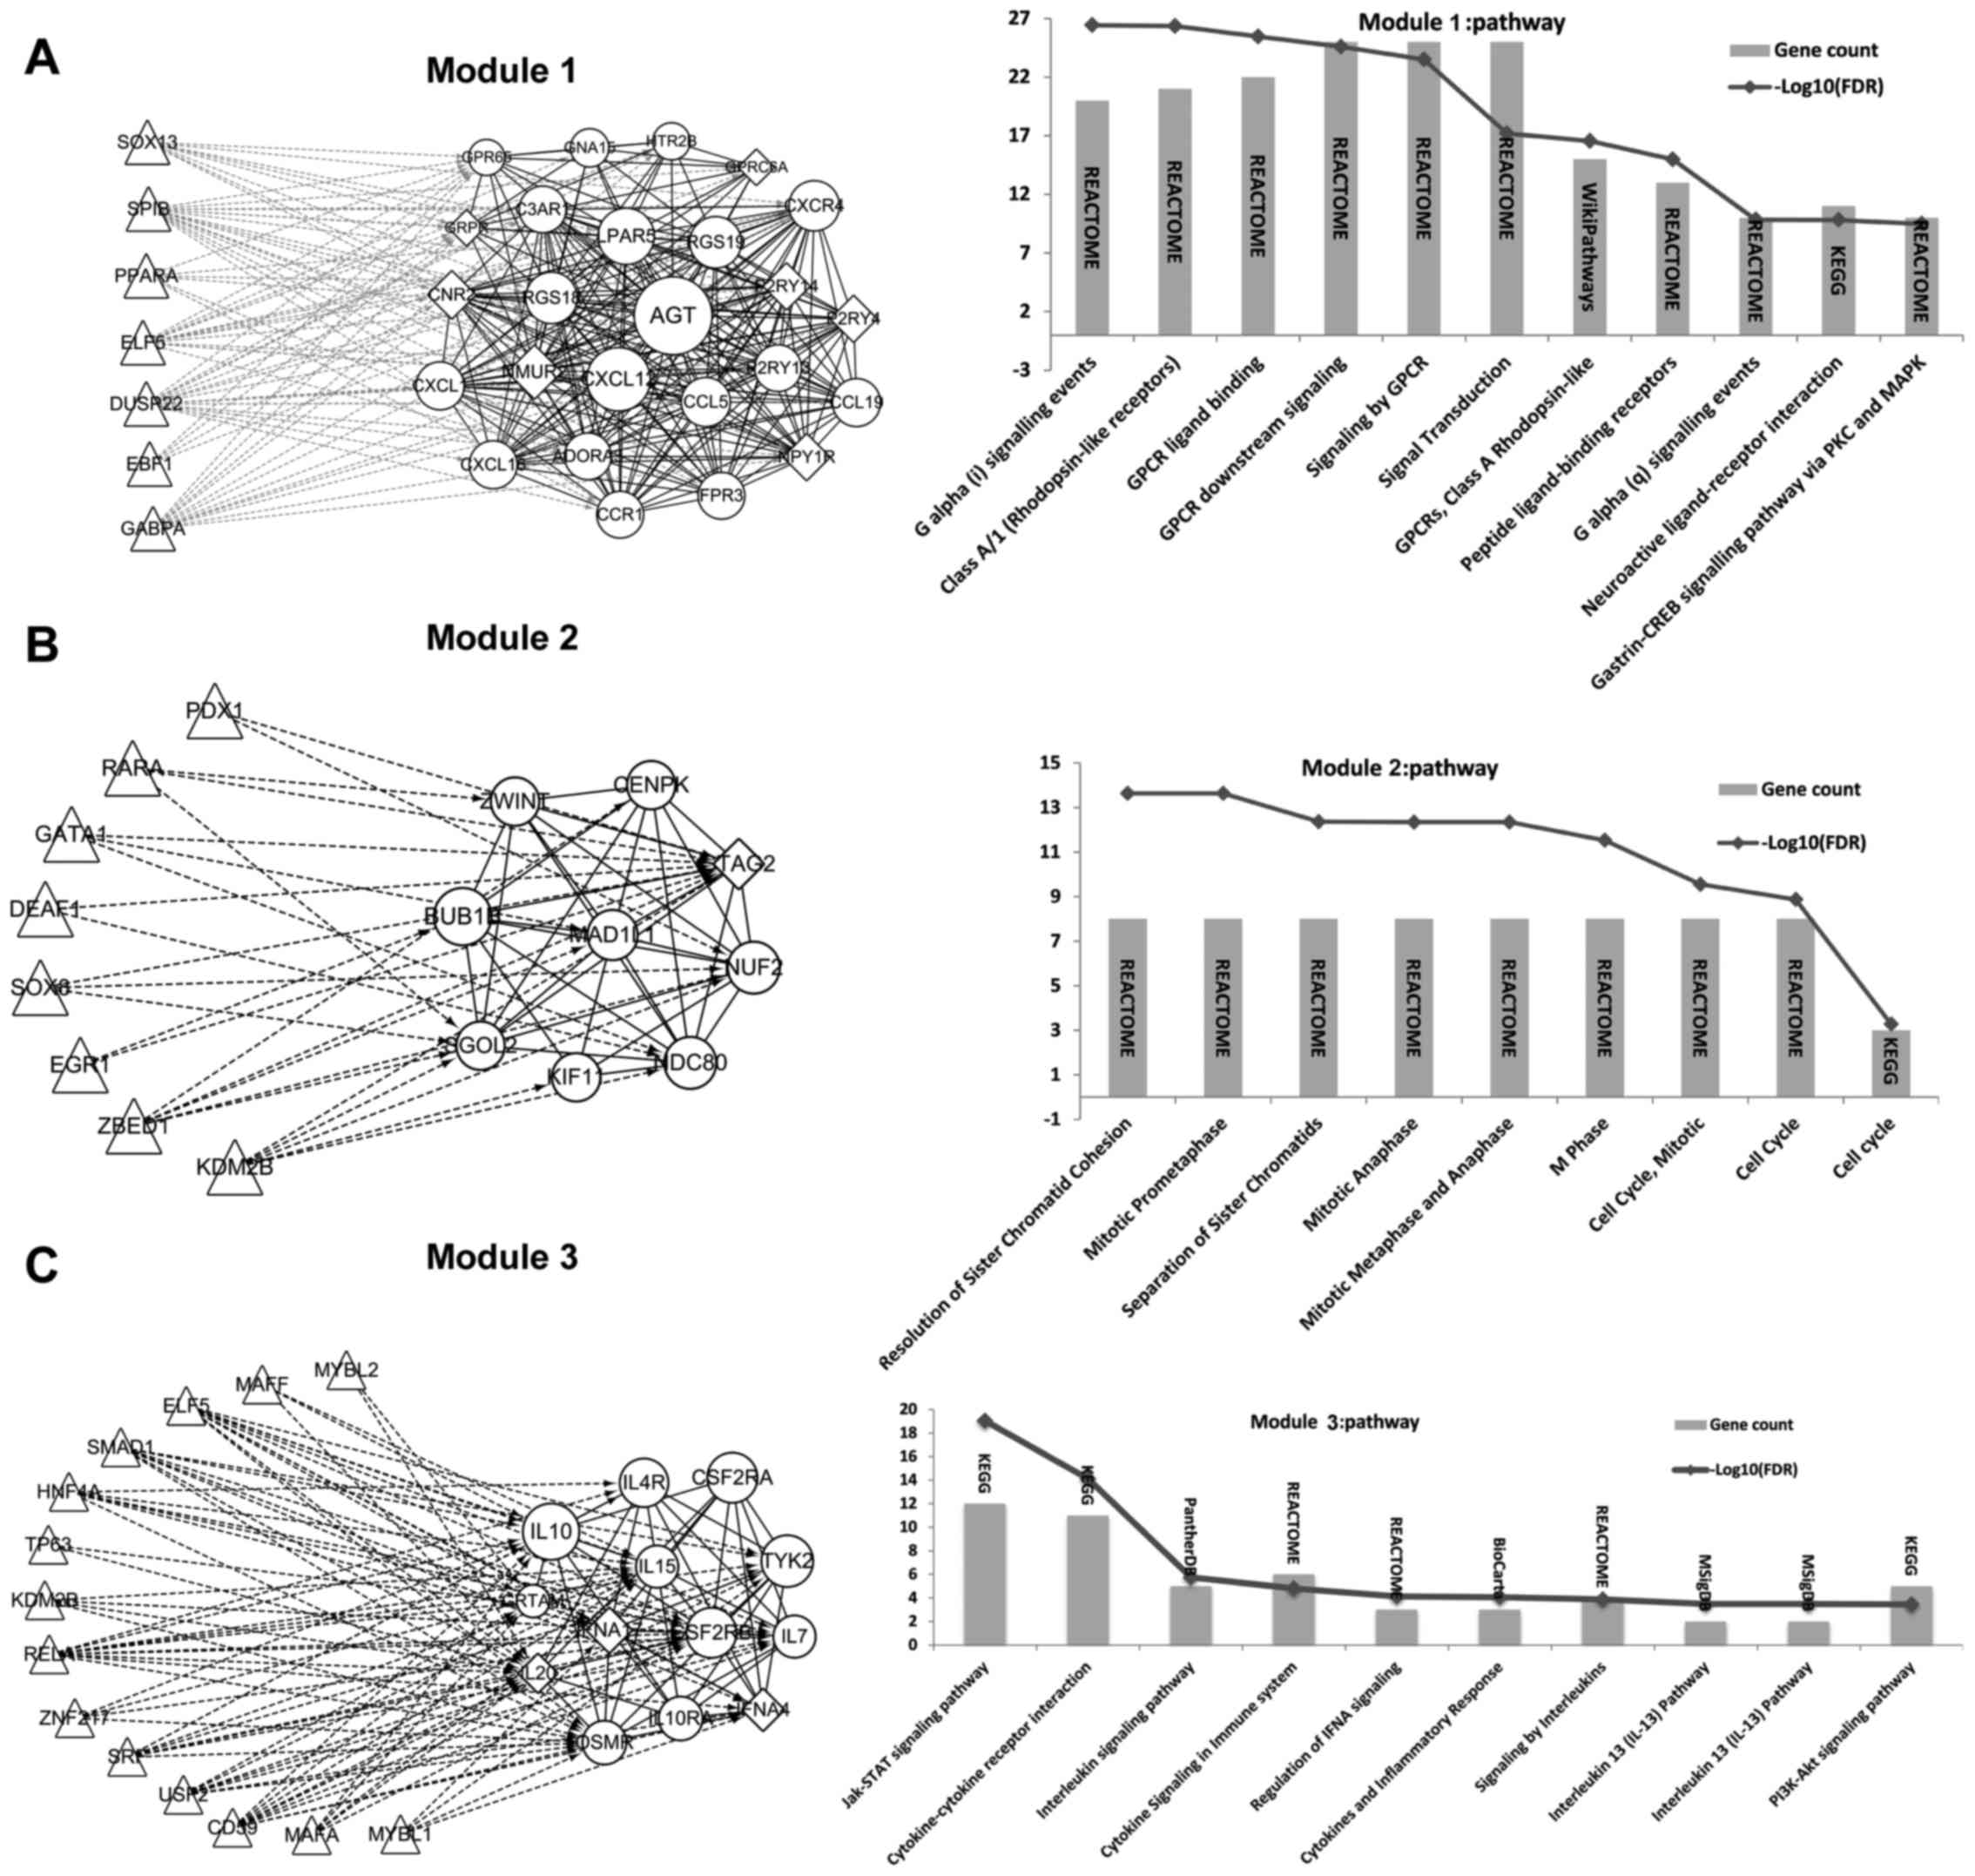
Extraction of significant modules from
the PPI network and TFs identification
Three significant modules were obtained. Besides,
the TFs that regulated genes in these 3 modules were identified and
the regulation network was constructed correspondingly (Fig. 3). From the results, we found that a
total of 7, 8 and 14 TFs could regulate genes in module 1, module
2, and module 3, respectively. Thereinto, TFs identified to
regulate genes in module 1 were not DEGs (Fig. 3A). While 2 DEGs were found to be
TFs that regulated genes in module 2, including Lysine (K)-Specific
Demethylase 2B (KDM2B, a common upregulated gene) and SRY (Sex
Determining Region Y)-Box 8 (SOX8, a common upregulated gene)
(Fig. 3B). Two DEGs were found to
be TFs that regulated genes in module 3, including KDM2B and V-Maf
Avian Musculoaponeurotic Fibrosarcoma Oncogene Homolog F (MAFF, a
common downregulated gene) (Fig.
3C).
Discussion
Gene expression profiling analysis revealed genes
with abnormal expression concerned with OA, enabling the
identification of targets for therapeutic options of OA. In the
current study, 1,207 and 1,575 DEGs were identified in knee
OA_Early and knee OA_End samples compared with healthy samples,
respectively. Total 740 genes were upregulated and 308 genes were
downregulated both in OA_Early and OA_End samples. These common
DEGs were enriched in different GO terms and pathways. The
upregulated genes AGT and CXCL12 were identified to be hub proteins
in the PPI network or in the selected module 1. Besides, the
upregulated DEG KDM2B was identified to be a TF that could regulate
genes in the significant module 2 and module 3.
The risk factors for OA include biological factors
and mechanical injury factors, such as aging, obesity and joint
trauma (22). Meniscal tear is one
of the risk factors for OA and is strongly associated with the
development and progression of OA (23). In this study, synovial membranes of
early knee OA patients were from those patients with meniscal tear.
While the OA_End samples were derived from end-stage knee OA
patients (diffuse full thickness cartilage erosion) who were
undergoing total knee joint replacement regardless of the specific
cause. To eliminate the influence of risk factor, we focused on the
common DEGs both identified in the OA_Early and OA_End samples.
Moreover, we chose 3 DEGs (AGT, CXCL12, and KDM2B) with higher node
degree or having the function of TF to be our further focus.
The protein encoded by AGT, pre-angiotensinogen or
angiotensinogen precursor, is cleaved by the renin enzyme in answer
to lowered blood pressure (24).
Then, the resulting product, angiotensin I, is cleaved by
angiotensin converting enzyme (ACE) to generate the angiotensin II,
a physiologically active enzyme (24). Evidence had demonstrated that local
renin-angiotensin system components expressed particularly in
hypertrophic chondrocytes and did not in hyaline chondrocytes
(25). Recently, Yamagishi et
al revealed that activation of the renin-angiotensin system may
introduce OA (26). Evidence had
shown that an ACE inhibitor (Ramipril) could improve vascular
function in patients with rheumatoid arthritis (27). However, few study directly showed
the effect of ACE inhibitor on OA. In our study, we found that AGT
was an upregulated DEG both in the early stage of knee OA and late
stage of knee OA. Besides, AGT was a hub protein in the PPI
network. In line with the previous studies, it is reasonable to
conclude that that AGT may play a key role in the development and
progression of knee OA, which needs further validations.
CXCL12 functions as the natural ligand for the
G-protein coupled receptor, chemokine (C-X-C motif) receptor 4
(CXCR4) and plays a role in many diverse cellular functions,
including inflammation response (28). The work of Zhu et al showed
that the G protein-coupled receptor pathway might play significant
roles in the progression of the early and late stages of OA
(8). Recently, He et al
found that CXCL12 levels in the plasma and synovial fluid might
serve as effective biomarkers for the severity of OA (29). In the present study, we found that
CXCL12 was an upregulated DEG both in the early stage of knee OA
and late stage of knee OA compared with controls. Besides, CXCL12
was another hub protein in the PPI network. Collectively, we
suggest that CXCL12 may be essential in the pathogenesis of knee OA
and it may be used as a biomarker of the disease severity as well
as a potential drug target (30).
Furthermore, we found that the DEG KDM2B was
identified to be a TF that could regulate genes in the significant
module 2 and module 3 in our study. KDM2B encodes a member of the
F-box protein family which function in phosphorylation-dependent
ubiquitination (31). Farcas et
al had demonstrated that an direct link between recognition of
CpG islands by KDM2B and targeting of the polycomb repressive
system (32). DNA methylation
occurs naturally and mostly at positions where cytosine is bonded
to guanine to form a CpG dinucleotide (32). Moreover, the involvement of DNA
methylation has been most studied in the context of OA in
musculoskeletal diseases (33).
Taken together, we suggested that KDM2B might play a critical role
in the pathogenesis of knee OA and KDM2B may be used as a novel
drug target. However, experimental verifications are needed to
confirm this finding.
In conclusion, AGT, CXCL12, and KDM2B were
identified to be key genes associated with the pathogenesis of knee
OA. Though the results are promising, the sample size in our study
is small and this study needs further experimental verifications.
Thus, further investigations with larger samples in this direction
may provide a more conclusive result and may emphasize the
potential of these identified genes as targets for therapeutic
strategy.
Acknowledgements
This study was supported by the Institutional
Research Funds for The First Affiliated Hospital of Xi'an Jiaotong
University (no. 2015YK27).
References
|
1
|
Xia B, Di Chen, Zhang J, Hu S, Jin H and
Tong P: Osteoarthritis pathogenesis: A review of molecular
mechanisms. Calcif Tissue Int. 95:495–505. 2014. View Article : Google Scholar : PubMed/NCBI
|
|
2
|
Ni GX, Li Z and Zhou YZ: The role of small
leucine-rich proteoglycans in osteoarthritis pathogenesis.
Osteoarthritis Cartilage. 22:896–903. 2014. View Article : Google Scholar : PubMed/NCBI
|
|
3
|
Lapidario RS: Osteoarthritis of the knee.
Md State Med J. 19:75–78. 1970.PubMed/NCBI
|
|
4
|
Xu YK, Ke Y, Wang B and Lin JH: The role
of MCP-1-CCR2 ligand-receptor axis in chondrocyte degradation and
disease progress in knee osteoarthritis. Biol Res. 48:642015.
View Article : Google Scholar : PubMed/NCBI
|
|
5
|
Türkmen F, Sever C, Toker EE, Erkoçak ÖF,
Acar MA and Toker S: Osteoarthritis: Pathogenesis, risk factors and
current treatment options. Eur J Med Sci. 1:36–42. 2014. View Article : Google Scholar
|
|
6
|
Wang Q, Rozelle AL, Lepus CM, Scanzello
CR, Song JJ, Larsen DM, Crish JF, Bebek G, Ritter SY, Lindstrom TM,
et al: Identification of a central role for complement in
osteoarthritis. Nat Med. 17:1674–1679. 2011. View Article : Google Scholar : PubMed/NCBI
|
|
7
|
Vance D, Wang L, Rampersaud E, Lesniak P,
Vance J, Pericak-Vance M and Kaplan L: Dynamic gene expression
profile changes in synovial fluid following meniscal injury;
osteoarthritis (OA) Markers found. J Exerc Sports Orthop. 1:1–7.
2014.
|
|
8
|
Zhu YC, Deng BY, Zhang LG, Xu P, Du XP,
Zhang QG and Yang B: Protein-protein interaction network analysis
of osteoarthritis-related differentially expressed genes. Genet Mol
Res. 13:9343–9351. 2014. View Article : Google Scholar : PubMed/NCBI
|
|
9
|
Ma CH, Lv Q, Cao Y, Wang Q, Zhou XK, Ye BW
and Yi CQ: Genes relevant with osteoarthritis by comparison gene
expression profiles of synovial membrane of osteoarthritis patients
at different stages. Eur Rev Med Pharmacol Sci. 18:431–439.
2014.PubMed/NCBI
|
|
10
|
Irizarry RA, Hobbs B, Collin F,
Beazer-Barclay YD, Antonellis KJ, Scherf U and Speed TP:
Exploration, normalization, and summaries of high density
oligonucleotide array probe level data. Biostatistics. 4:249–264.
2003. View Article : Google Scholar : PubMed/NCBI
|
|
11
|
Taminau J, Steenhoff D, Coletta A, Meganck
S, Lazar C, de Schaetzen V, Duque R, Molter C, Bersini H, Nowé A
and Weiss Solís DY: inSilicoDb: An R/Bioconductor package for
accessing human Affymetrix expert-curated datasets from GEO.
Bioinformatics. 27:3204–3205. 2011. View Article : Google Scholar : PubMed/NCBI
|
|
12
|
Feng G, Du P, Krett NL, Tessel M, Rosen S,
Kibbe WA and Lin SM: A collection of bioconductor methods to
visualize gene-list annotations. BMC Res Notes. 3:102010.
View Article : Google Scholar : PubMed/NCBI
|
|
13
|
Dudoit S, Gentleman RC and Quackenbush J:
Open source software for the analysis of microarray data.
Biotechniques (Suppl). S45–S51. 2003.
|
|
14
|
Gentleman R, Carey VJ, Huber W, Irizarry R
and Dudoit S: Bioinformatics and computational biology solutions
using R and bioconductor. Springer; 2005, View Article : Google Scholar
|
|
15
|
Genovese CR, Lazar NA and Nichols T:
Thresholding of statistical maps in functional neuroimaging using
the false discovery rate. Neuroimage. 15:870–878. 2002. View Article : Google Scholar : PubMed/NCBI
|
|
16
|
Thissen D, Steinberg L and Kuang D: Quick
and easy implementation of the Benjamini-Hochberg procedure for
controlling the false positive rate in multiple comparisons. J Edu
Behav Statist. 27:77–83. 2002. View Article : Google Scholar
|
|
17
|
Chen J, Bardes EE, Aronow BJ and Jegga AG:
ToppGene suite for gene list enrichment analysis and candidate gene
prioritization. Nucleic Acids Res. 37:(Web Server issue).
W305–W311. 2009. View Article : Google Scholar : PubMed/NCBI
|
|
18
|
Zhao Z, Guo AY, Van den Oord EJ, Aliev F,
Jia P, Edenberg HJ, Riley BP, Dick DM, Bettinger JC, Davies AG, et
al: Multi-species data integration and gene ranking enrich
significant results in an alcoholism genome-wide association study.
BMC Genomics. 13:(Suppl 8). S162012. View Article : Google Scholar : PubMed/NCBI
|
|
19
|
Szklarczyk D, Franceschini A, Kuhn M,
Simonovic M, Roth A, Minguez P, Doerks T, Stark M, Muller J, Bork
P, et al: The STRING database in 2011: Functional interaction
networks of proteins, globally integrated and scored. Nucleic Acids
Res. 39:(Database issue). D561–D568. 2011. View Article : Google Scholar : PubMed/NCBI
|
|
20
|
Nepusz T, Yu H and Paccanaro A: Detecting
overlapping protein complexes in protein-protein interaction
networks. Nat Methods. 9:471–472. 2012. View Article : Google Scholar : PubMed/NCBI
|
|
21
|
Janky R, Verfaillie A, Imrichová H, Van de
Sande B, Standaert L, Christiaens V, Hulselmans G, Herten K, Naval
Sanchez M, Potier D, et al: iRegulon: From a gene list to a gene
regulatory network using large motif and track collections. PLoS
Comput Biol. 10:e10037312014. View Article : Google Scholar : PubMed/NCBI
|
|
22
|
Andriacchi TP, Favre J, Erharthledik JC
and Chu CR: A systems view of risk factors for knee osteoarthritis
reveals insights into the pathogenesis of the disease. Ann Biomed
Eng. 43:376–387. 2015. View Article : Google Scholar : PubMed/NCBI
|
|
23
|
Berthiaume MJ, Raynauld JP,
Martel-Pelletier J, Labonté F, Beaudoin G, Bloch DA, Choquette D,
Haraoui B, Altman RD, Hochberg M, et al: Meniscal tear and
extrusion are strongly associated with progression of symptomatic
knee osteoarthritis as assessed by quantitative magnetic resonance
imaging. Ann Rheum Dis. 64:556–563. 2005. View Article : Google Scholar : PubMed/NCBI
|
|
24
|
Bernstein KE, Giani JF, Shen XZ and
Gonzalez-Villalobos RA: Renal angiotensin-converting enzyme and
blood pressure control. Curr Opin Nephrol Hypertens. 23:106–112.
2014. View Article : Google Scholar : PubMed/NCBI
|
|
25
|
Tsukamoto I, Akagi M, Inoue S, Yamagishi
K, Mori S and Asada S: Expressions of local renin-angiotensin
system components in chondrocytes. Eur J Histochem. 58:23872014.
View Article : Google Scholar : PubMed/NCBI
|
|
26
|
Yamagishi K, Tsukamoto I and Akagi M:
Activation of the renin-angiotensin system introduces
osteoarthritis. Osteoarthritis Cartilage. 23:A320–A321. 2015.
View Article : Google Scholar
|
|
27
|
Flammer AJ, Sudano I, Hermann F, Gay S,
Forster A, Neidhart M, Künzler P, Enseleit F, Périat D, Hermann M,
et al: Angiotensin-converting enzyme inhibition improves vascular
function in rheumatoid arthritis. Circulation. 117:2262–2269. 2008.
View Article : Google Scholar : PubMed/NCBI
|
|
28
|
Xu Q, Sun XC, Shang XP and Jiang HS:
Association of CXCL12 levels in synovial fluid with the
radiographic severity of knee osteoarthritis. J Investig Med.
60:898–901. 2012. View Article : Google Scholar : PubMed/NCBI
|
|
29
|
He W, Wang M, Wang Y, Wang Q and Luo B:
Plasma and synovial fluid CXCL12 levels are correlated with disease
severity in patients with knee osteoarthritis. J Arthroplasty.
31:373–377. 2016. View Article : Google Scholar : PubMed/NCBI
|
|
30
|
Müllertidow C, Schwäble J, Steffen B,
Tidow N, Brandt B, Becker K, Schulze-Bahr E, Halfter H, Vogt U,
Metzger R, et al: High-throughput analysis of genome-wide receptor
tyrosine kinase expression in human cancers identifies potential
novel drug targets. Clin Cancer Res. 10:1241–1249. 2004. View Article : Google Scholar : PubMed/NCBI
|
|
31
|
Gaoyang L, Jin H and Yi Z: Kdm2b promotes
induced pluripotent stem cell generation by facilitating gene
activation early in reprogramming. Nat Cell Biol. 14:457–466. 2012.
View Article : Google Scholar : PubMed/NCBI
|
|
32
|
Farcas AM, Blackledge NP, Sudbery I, et
al: KDM2B links the Polycomb Repressive Complex 1 (PRC1) to
recognition of CpG islands. Elife. 1:e0002052012. View Article : Google Scholar
|
|
33
|
Gordon JA, Stein JL, Westendorf JJ and
Wijnen AJ: Chromatin modifiers and histone modifications in bone
formation, regeneration, and therapeutic intervention for
bone-related disease. Bone. 81:739–745. 2015. View Article : Google Scholar : PubMed/NCBI
|