Introduction
Chronic kidney disease has become a critical public
health concern in China (1). IgA
nephropathy (IgAN), the most prevalent type of glomerulonephritis
in humans, is characterized by the expansion of the glomerular
mesangial matrix with mesangial cell proliferation and/or
mononuclear cell infiltration (2,3).
This disease has a variable course and can lead to renal failure
(4). Hypertensive nephropathy (HT)
is a medical condition referring to damage to the kidney due to
chronic high blood pressure. IgAN and HT affect a large proportion
of the population and induce high levels of pain in patients
worldwide (5). Thus, improving
strategies for early diagnosis and screening of disease biomarkers
in IgAN and HT are key issues.
Previously, a number of biomarkers have been
identified for the detection kidney damage at earlier stages of
progression, such as proteinuria and serum creatinine. Urinary IgA
and IgG concentrations have been revealed to be higher in patients
with IgAN than in healthy controls and in patients with other renal
diseases (6). Urinary excretion of
interleukin 6 (IL6) has been reported to predict long-term renal
outcomes in patients with IgAN (7). In addition, serum galactose-deficient
IgA1 and glycan-specific autoantibody levels have been identified
as potential candidates for diagnostic biomarkers of IgAN (8). Furthermore, the urinary expressions
of transforming growth factor-β, monocyte chemoattractant protein-1
and collagen IV are associated with HT (9). However, the underlying association
between these factors and a variety of chronic kidney diseases
remains largely unknown and there is still a lack of effective
treatments for IgAN and HT.
In the present study, in order to gain a deeper
insight into the potential correlations and treatments of IgAN and
HT, the mRNA expression profiles of three types of human renal
biopsy samples from patients with IgAN and HT, and pre-transplant
healthy living controls (LD) were analyzed to obtain a set of
differentially expressed genes (DEGs) and transcription factors
(TFs). Finally, functional enrichment was performed to analyze the
potential functions of DEGs and to identify candidate biomarkers
and treatment targets.
Materials and methods
Microarray data and data
preprocessing
mRNA expression profiles (GSE37460) (10) were extracted from the Gene
Expression Omnibus database (http://www.ncbi.nlm.nih.gov/geo/) (11). The total microarray contained 69
chips of human renal biopsy samples from 27 patients with IgAN, 15
patients with HT and 27 LD controls (total n=69). Renal biopsies
were obtained following the collection of informed written consent
from all patients and approval from the ethics committee of
European Renal cDNA Bank-Kröner-Fresenius biopsy bank (ERCB-KFB)
and the specialized subcommittee for internal medicine of the
cantonal ethics committee of Zurich (10). RNA from the glomeruli and
tubulointerstitial compartments was obtained and processed for
hybridization on Affymetrix microarrays, as previously described
(10). The expression profiles of
22,283 probe sets from 51 samples (27 IgAN, 15 HT and 9 LD samples)
were analyzed by GPL14663 Affymetrix Genechip Human Genome HG-U133A
(Affymetrix, Inc., Santa Clara, CA, USA) and 54,675 probe sets from
18 LD samples were analyzed by GPL11670 Affymetrix Human Genome
U133 Plus 2.0 Array (Affymetrix, Inc.). To ensure the consistency
of the data source and platform, the results from these 51 samples
were selected for further analysis. The probe-level data in CEL
files were converted into the mRNA expression profiles. Raw data
from the 51 samples were preprocessed using the Guanine Cytosine
Robust Multi-Array Analysis method (12) with the Affy package (13,14)
in R. The Affmetrix Microarray Suited 5 calls (MAS5calls) algorithm
was used for Affymetrix CEL file analysis. Then, the probe-level
data in CEL files were converted into the mRNA expression
profiles.
Screening of DEGs
The Linear Models for Microarray Data package
(version 3.22.1; available at http://www.bioconductor.org/packages/release/bioc/html/limma.html)
(15) was used to normalize the
results and identify the differentially expressed mRNAs between any
two groups. The DEGs with the cutoff criteria of
|log2fold change (FC)|>2 and a Q-value <0.01 were
considered to be significantly different. In addition, the DEGs
shared by the IgAN and HT groups were screened. In order to
investigate whether the mRNAs were sample-specific, the Pheatmap
package (version 0.7.7; http://cran.r-project.org/web/packages/pheatmap/index.html)
(16) in R was used to perform
hierarchical clustering by comparing the value of each mRNA in 51
samples.
Functional enrichment analysis of
DEGs
The online platform Genomatix (available at
http://www.genomatix.de/index.html)
was used to identify the enriched functions and pathways in DEGs.
P<0.01 was set as the cutoff criterion.
Identification of TFs for DEGs and
construction of the regulatory network
Genomatix was also used to identify the enriched TFs
of DEGs, screen the key nodes or node pairs and draw the signal
pathways that regulate the expression of the DEGs. Finally, the
regulatory networks that contained DEGs and TFs were visualized
using Cytoscape software (version 3.2.0; http://www.cytoscape.org/) (17).
Results
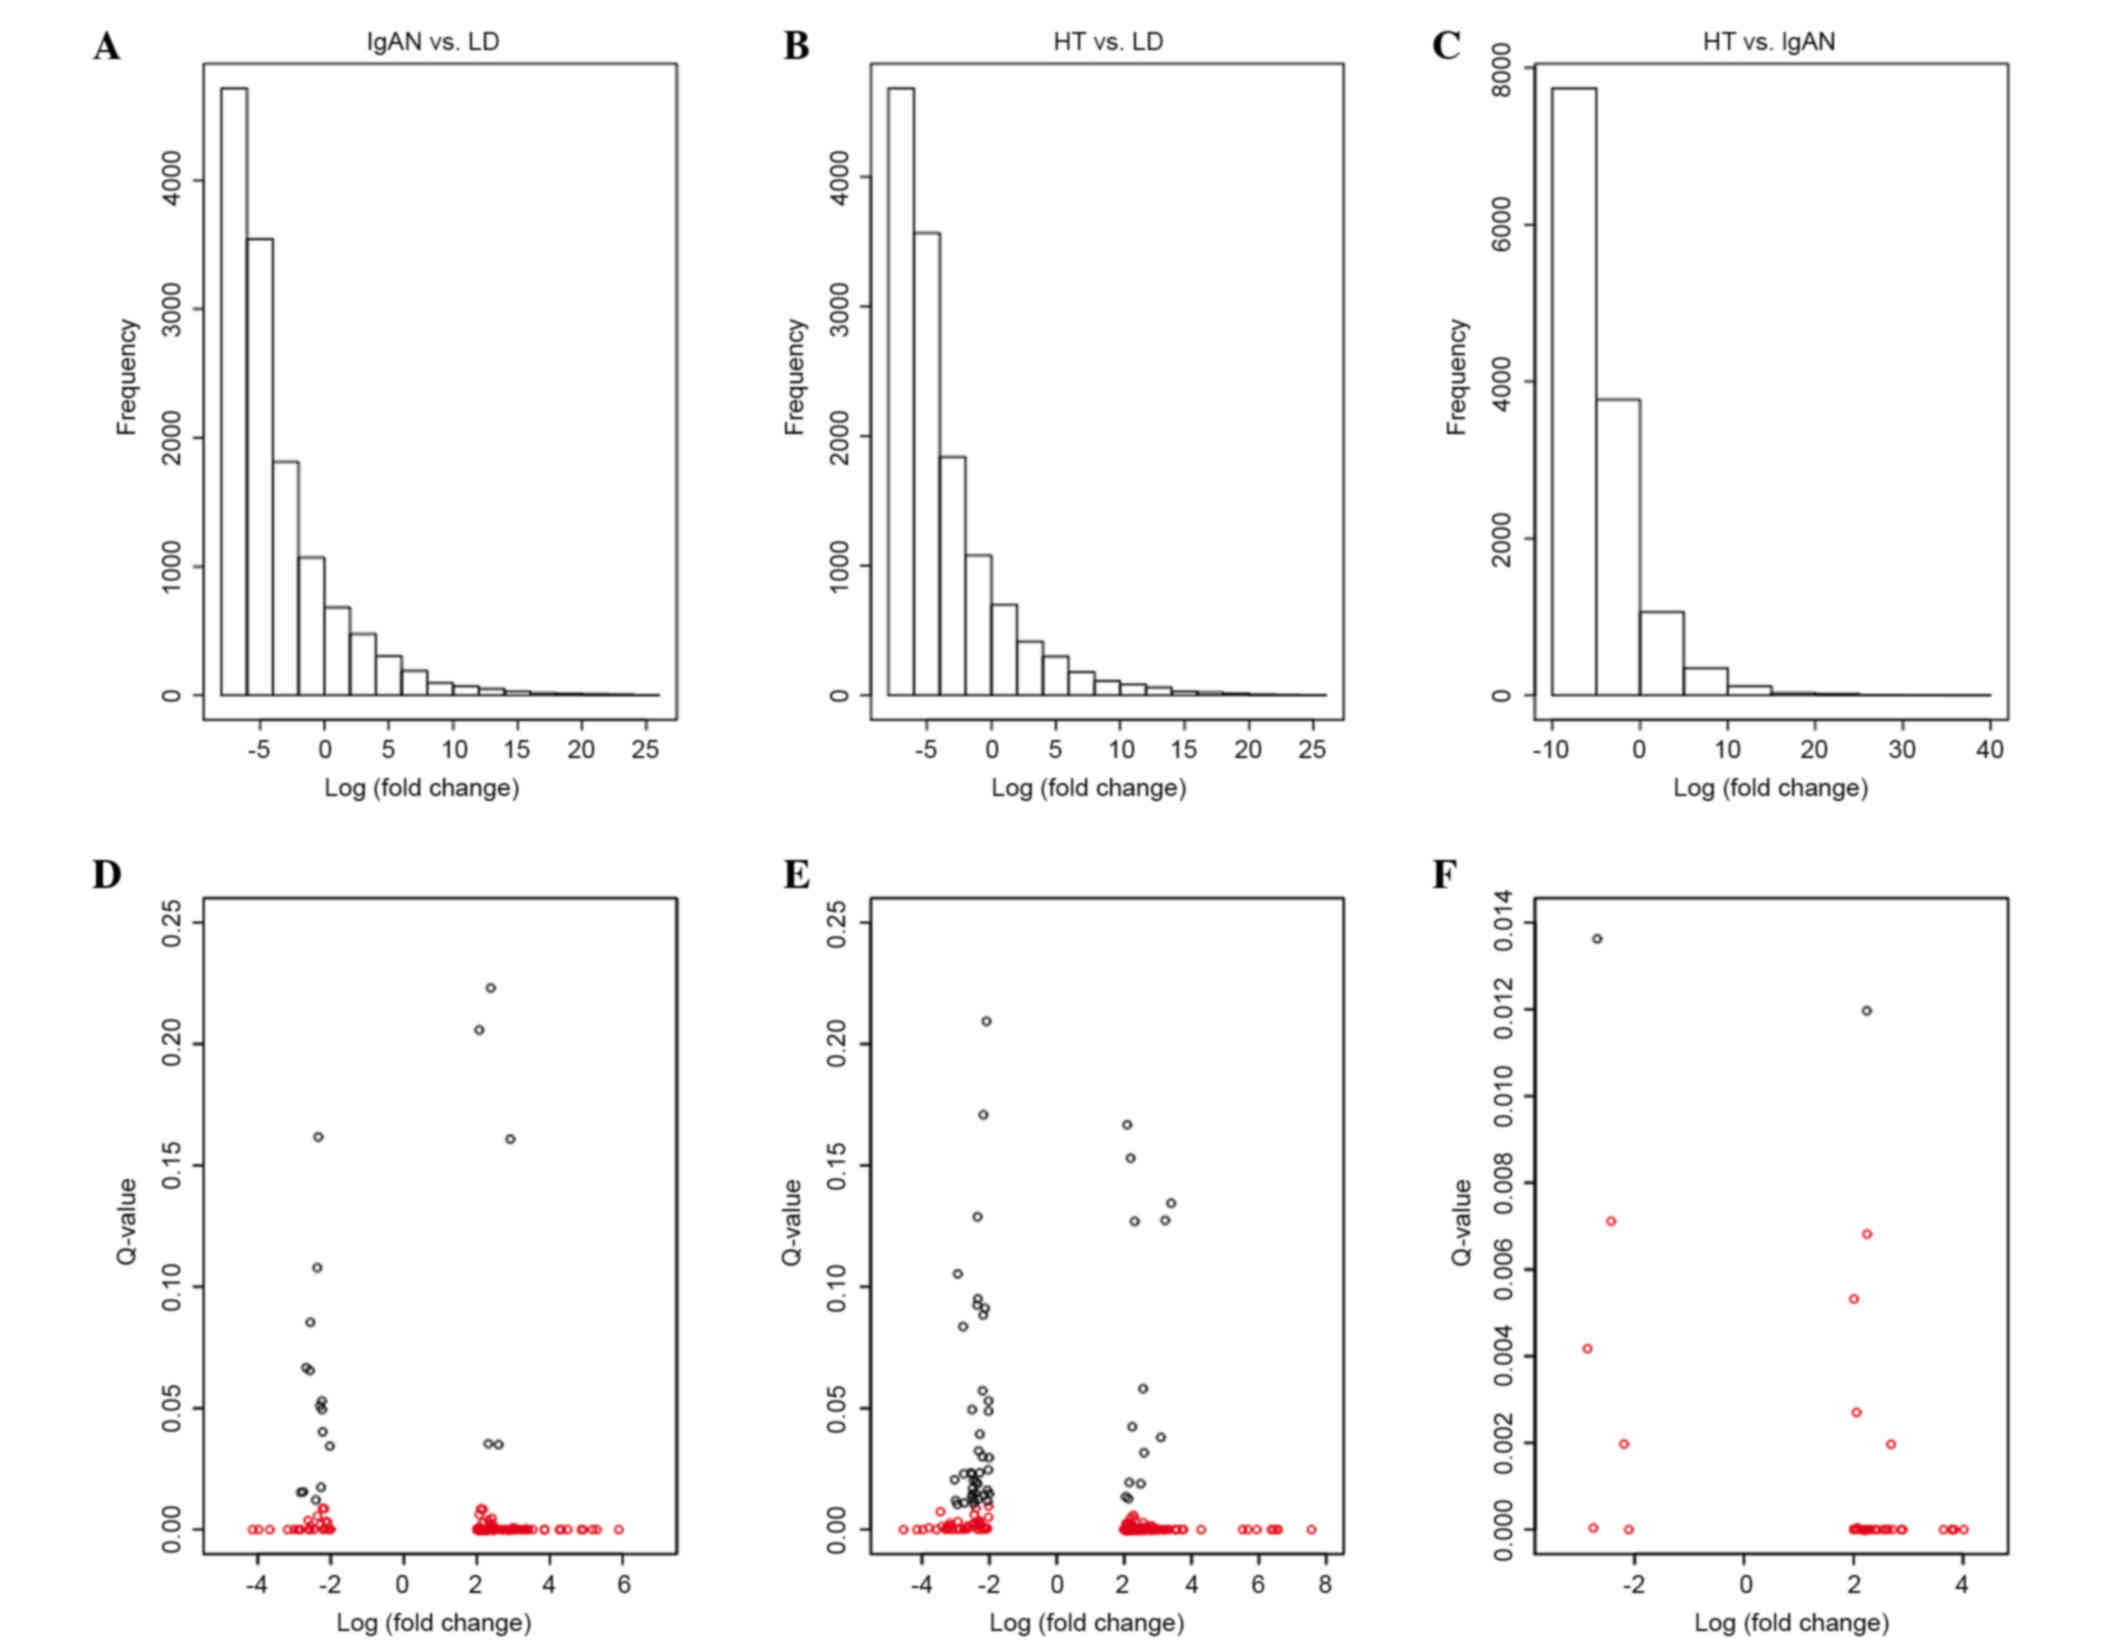
Identification of DEGs
Almost 13,096 probe sets were selected from the
22,283 probe sets of 51 samples using the MAS5calls method
(Fig. 1). When compared with the
LD group, 134 genes (108 up- and 26 downregulated) were
significantly modified in the IgAN group (termed IgAN vs. LD;
Fig. 1A) and 188 genes (149 genes
up- and 39 genes downregulated) were significantly modified in the
HT group (termed HT vs. LD; Fig.
1B). In addition, 39 genes (34 genes up- and 5 genes
downregulated) were significantly altered in the HT group (termed
HT vs. IgAN; Fig. 1C) when
compared with the IgAN group. In addition, in order to investigate
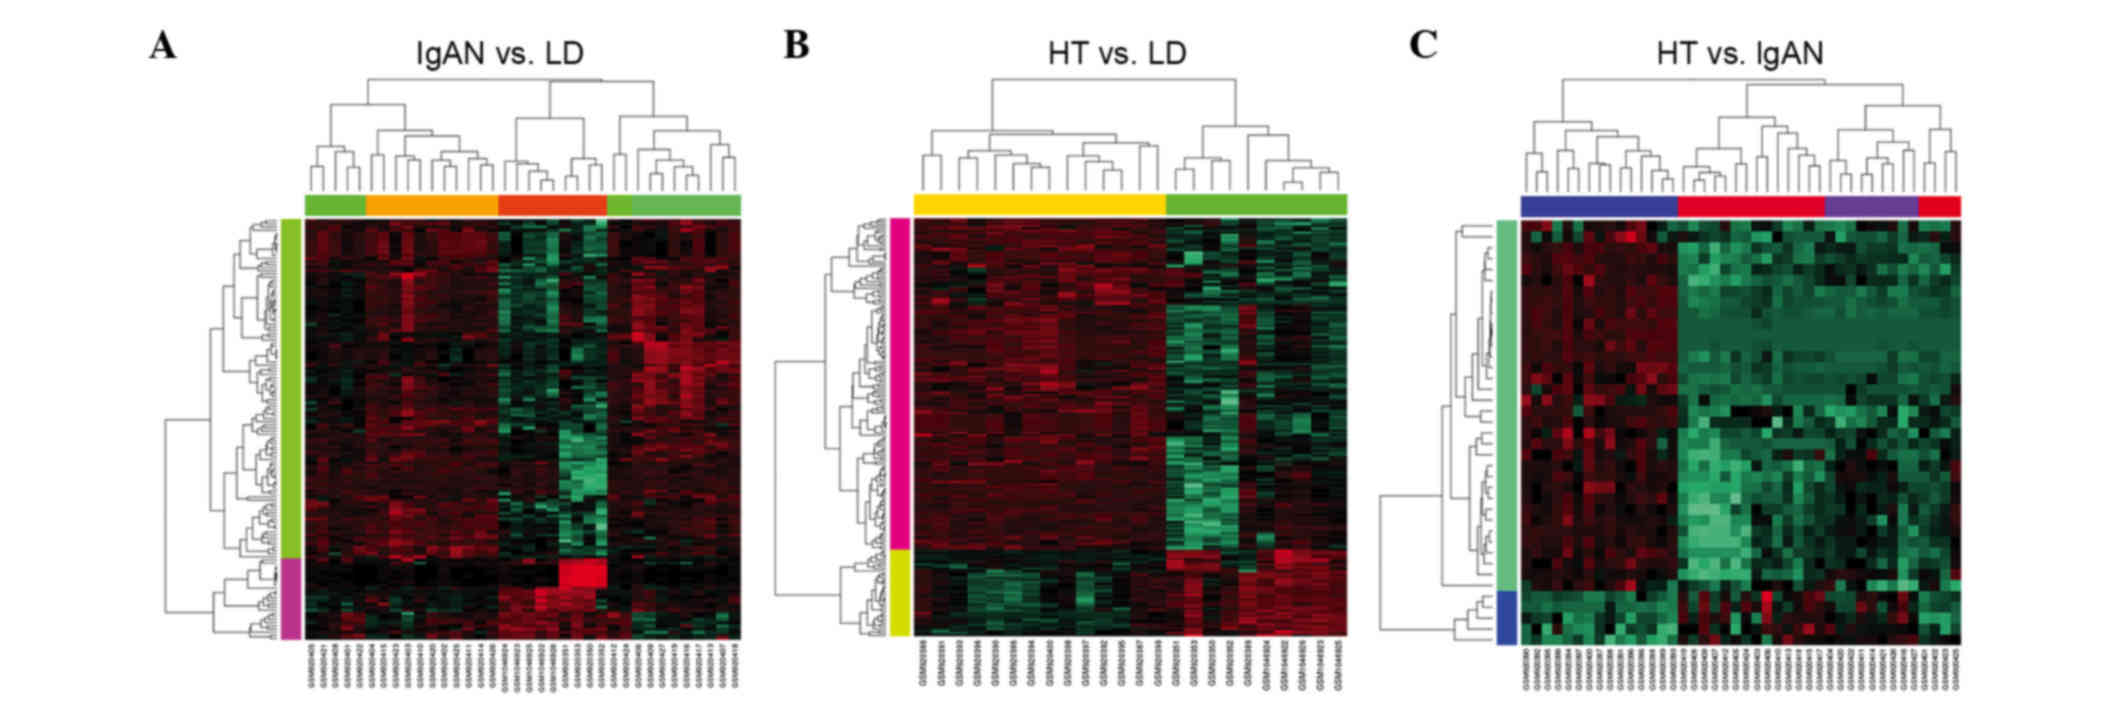
the differences among the 51 samples, a heat map was obtained to
compare their expression values. The hierarchical clustering
analysis revealed a clearly distinct expression of 134 DEGs between
the IgAN and LD groups (Fig. 2A),
188 DEGs between the HT and LD groups (Fig. 2B) and 39 DEGs between the HT and
IgAN groups (Fig. 2C).
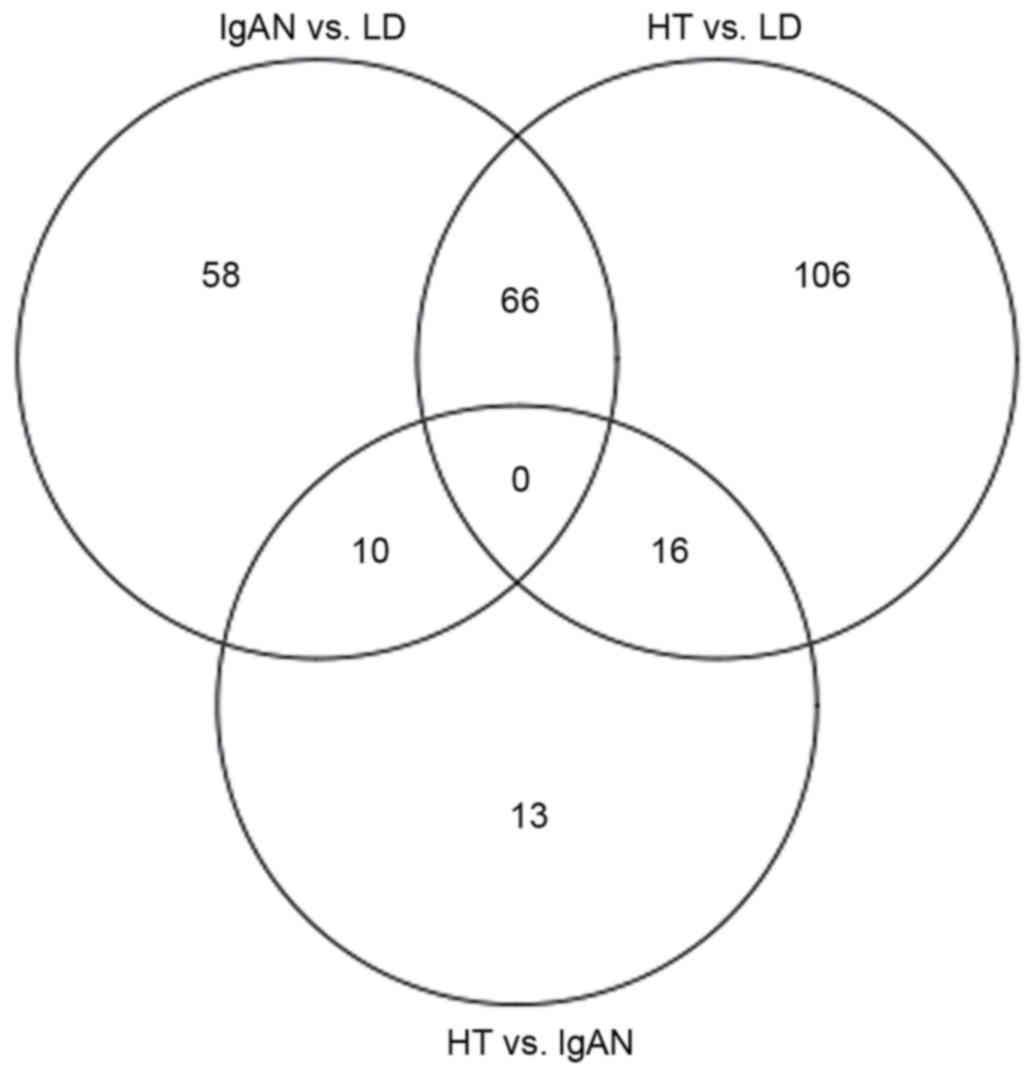
To identify further similarities and differences
between HT and IgAN, the overlapping DEGs among IgAN vs. LD, HT vs.
LD and HT vs. IgAN were analyzed. The results revealed that 66 DEGs
were shared in IgAN vs. LD and HT vs. LD (including 52 up- and 14
downregulated DEGs), 10 DEGs were shared in IgAN vs. LD and HT vs.
IgAN groups, and 16 DEGs were shared in HT vs. LD and HT vs. IgAN
groups (Fig. 3).
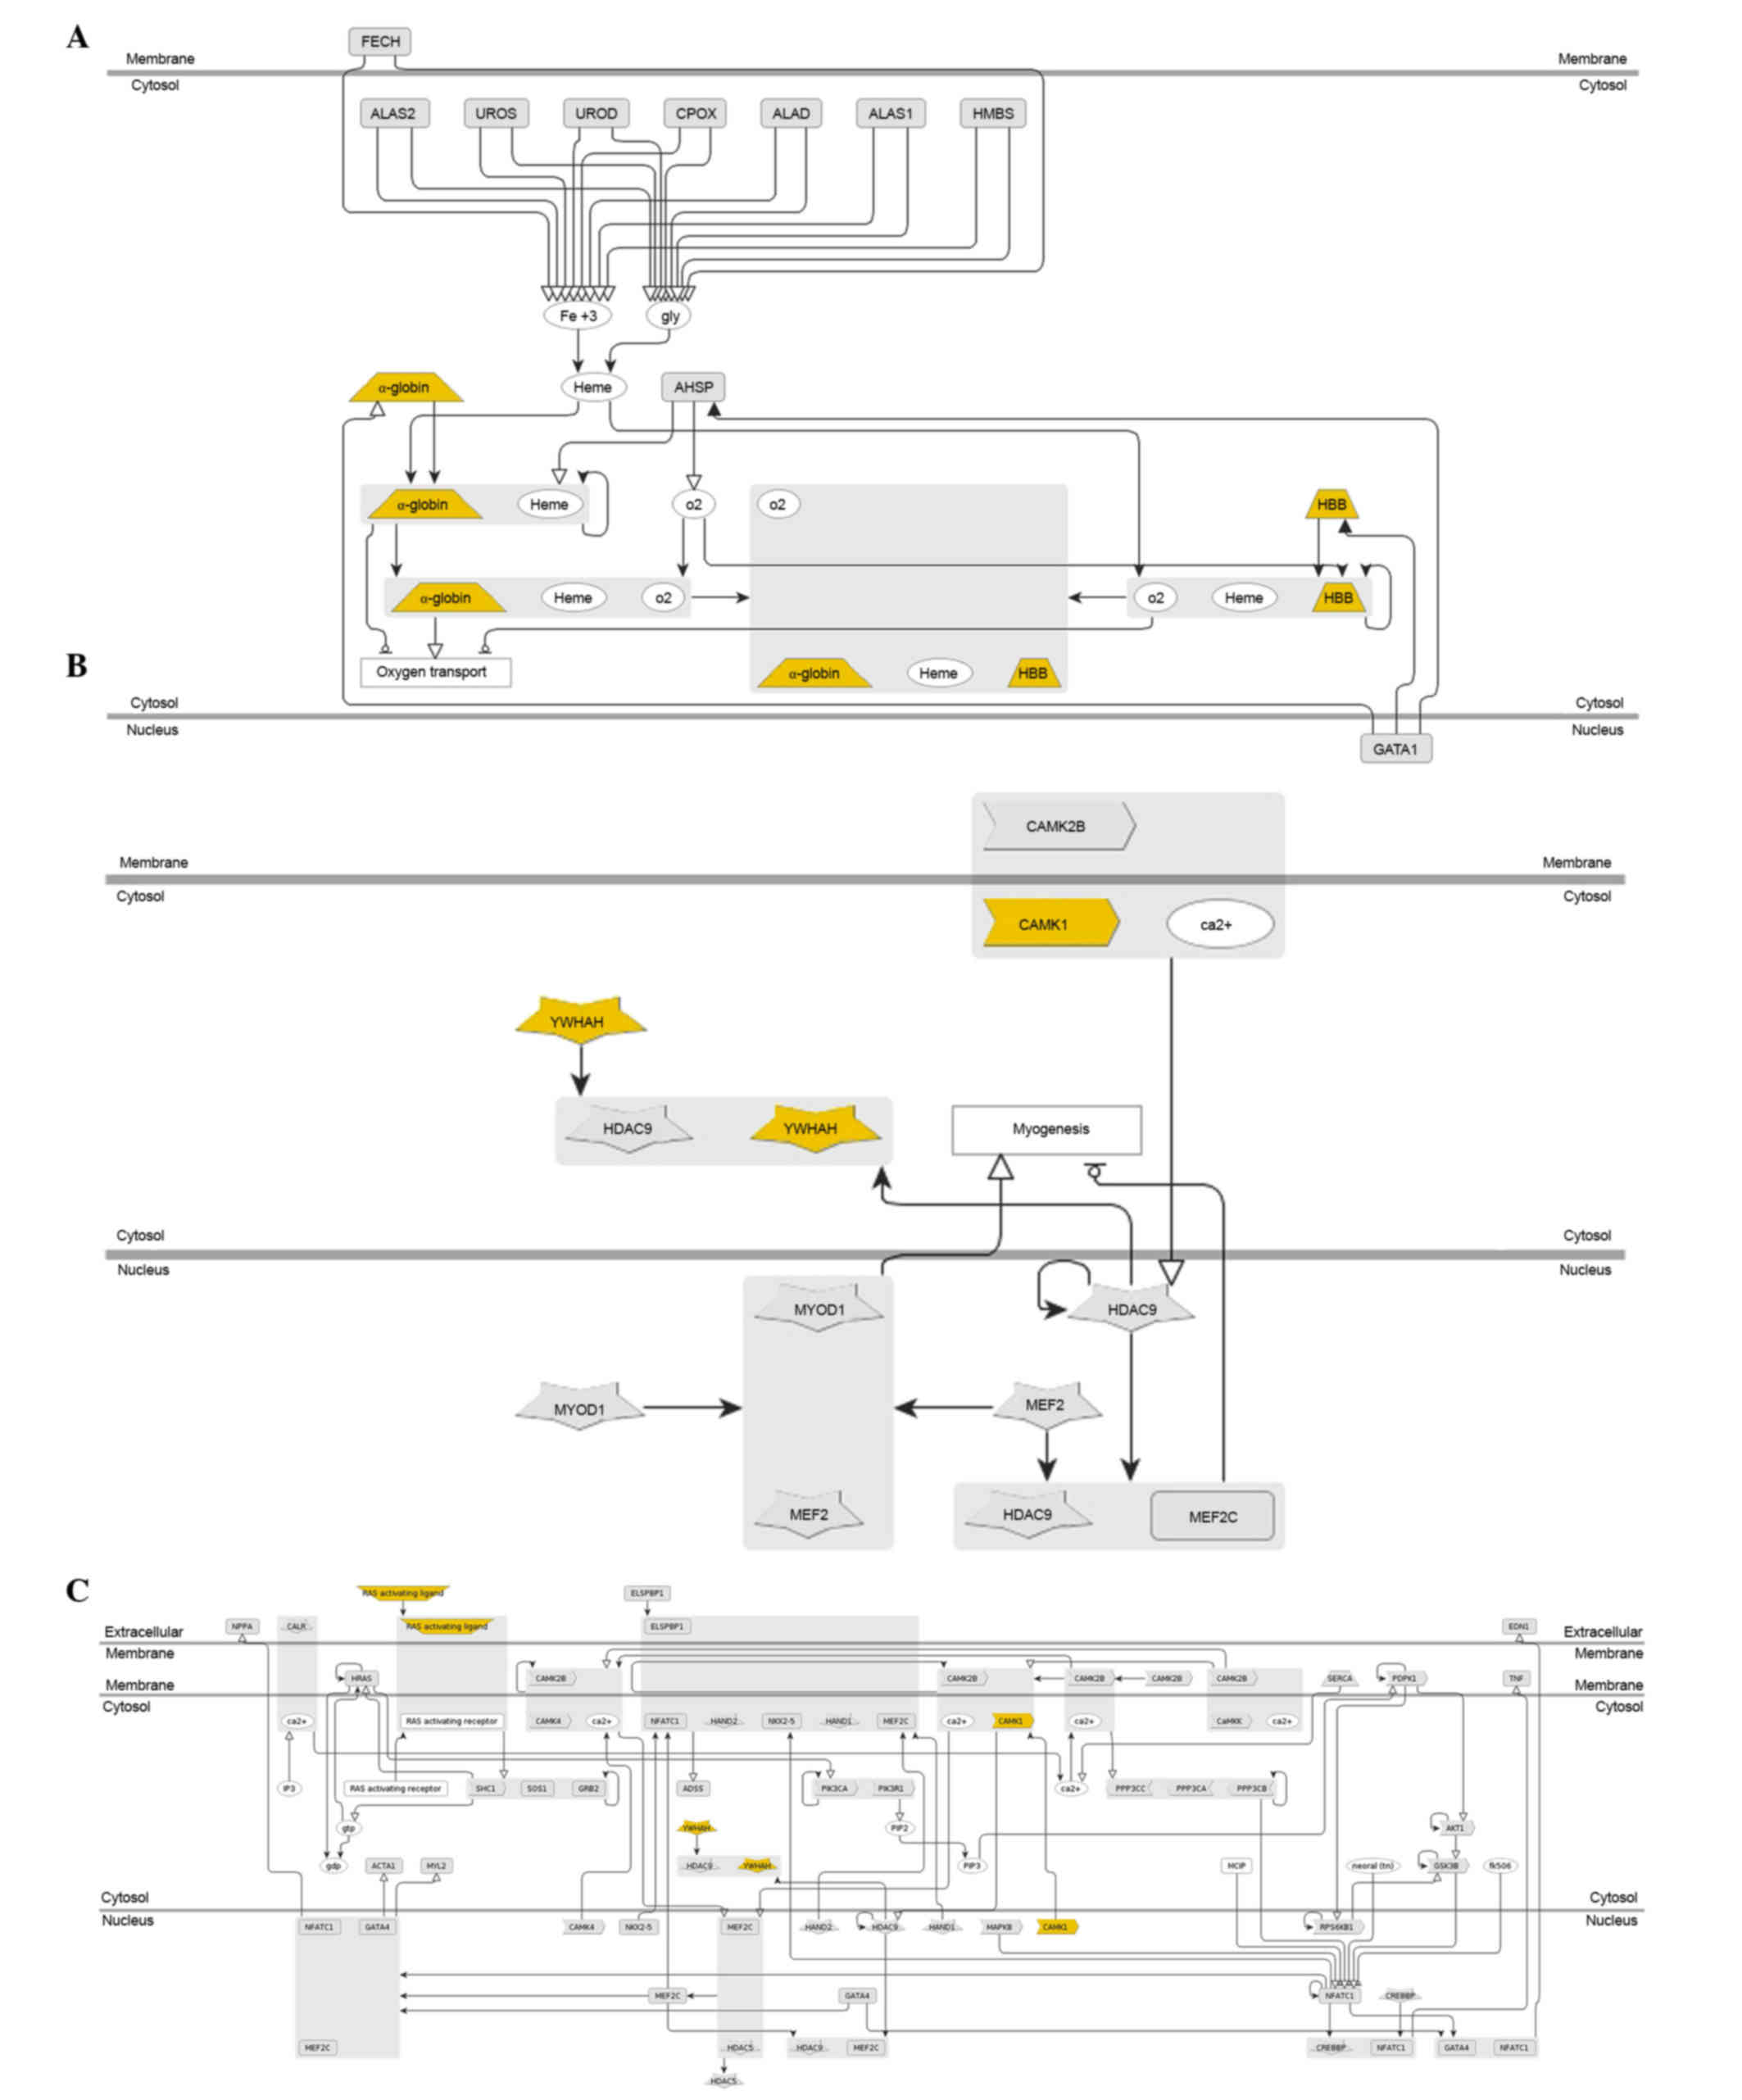
Functional annotation of DEGs
Genomatix was used to identify the enriched
functions and pathways in DEGs. The results demonstrated that the
66 shared DEGs in IgAN vs. LD and HT vs. LD were enriched in 245
Gene Ontology (GO) terms (including vasculature development,
circulatory system development and cardiovascular system
development) and significantly enriched in 3 pathways, including
hemoglobin's chaperone (P=1.80e-4; Fig. 4A), signal dependent regulation of
myogenesis by corepressor microtubule interacting and transport
(P=2.74e-3; Fig. 4B), and nuclear
factor of activated T cells and hypertrophy of the heart
(P=7.35e-3; Fig. 4C). In addition,
24 of the 66 shared DEGs were revealed to be associated with kidney
cancer, including inhibitor of DNA binding 1 dominant negative
helix-loop-helix protein, early growth response 1 (EGR1) and
integrin α8 (Table I).
 | Table I.Differentially expressed genes
associated with different types of cancer. |
Table I.
Differentially expressed genes
associated with different types of cancer.
| Associated cancer
tissue | P-value | Genes |
|---|
| Lung |
1.03×10⁻³ | ID1, EGR1,
ITGA8, CAMK1, LYN, PYCARD, IGF1, G6PC, SIK1, CASP1, CYBB, CRIP2,
ATF3, RIT1, KLF6, ITGB2, HHEX, CXCR4, FRZB, CDH5, IGFBP5, RAB31,
ACTB, TIE1, YWHAH, MAFF |
| Haematopoietic and
lymphoid tissue |
1.98×10⁻³ | EGR1, FN1,
ITGA8, CAMK1, LYN, CTSS, G6PC, SIK1, CASP1, CEACAM1, CYBB, ATF3,
PXDN, CXCR4, SOSTDC1, FRZB, PPAP2B, RALYL, POLR2E, TIE1 |
| Kidneys |
7.49×10⁻³ | ID1, EGR1,
ITGA8, CAMK1, LYN, PYCARD, G6PC, SIK1, CASP1, CYBB, NR4A1, CRIP2,
ATF3, RIT1, KLF6, ITGB2, HHEX, CXCR4, RAB31, ACTB, TIE1, NR4A2,
YWHAH, MAFF |
The screened 39 DEGs in the HT vs. IgAN group were
divided into three classes: Class I, 10 shared genes in HT vs. IgAN
and IgAN vs. LD; class II, 16 shared genes in HT vs. IgAN and HT
vs. LD; class III, 13 specific genes HT vs. IgAN (Table II). GO enrichment indicated that
IL1 receptor antagonist (IL1RN) and collagen type IV α2
(COL4A2) in class I were enriched in inflammation-associated
biological processes such as negative regulation of the
IL1-mediated signaling pathway and negative regulation of
heterotypic cell-cell adhesion. Structural maintenance of
chromosomes 3 (SMC3), v-crk avian sarcoma virus CT10
oncogene homolog (CRK), caldesmon 1 (CALD), myosin VI
(MYO6), type I DNA topoisomerase (TOP1), ST3
β-galactoside α-2,3-sialyltransferase 1 (ST3GAL1),
peptidylprolyl isomerase G (PPIG), kin Of IRRE like
(Drosophila; KIRREL), ankyrin repeat domain 12
(ANKRD12) and tetratricopeptide repeat domain 3
(TTC3) in class II were enriched in
noninflammation-associated biological processes including genetic
transfer, DNA mediated transformation and actin filament-based
process. IL8, FBJ murine osteosarcoma viral oncogene homolog
(FOS), pro-platelet basic protein (chemokine (C-X-C motif)
ligand 7 (PPBP), somatostatin (SST), DIS3
exosome endoribonuclease and 3′-5′ exoribonuclease (DIS3),
kinesin family member 3B (KIF3B), RNA binding motif protein
25 (RBM25), Rho GTPase activating protein 28
(ARHGAP28) and erythrocyte membrane protein band 4.1 like 5
(EPB41L5) in class III were enriched in
inflammation-associated biological processes such as the response
to bacterium and temperature stimulus, and cryptic unstable
transcripts catabolic process.
| Table II.Comparisons between differentially
expressed genes in hypertensive nephropathy and immunoglobulin A
nephropathy samples. |
Table II.
Comparisons between differentially
expressed genes in hypertensive nephropathy and immunoglobulin A
nephropathy samples.
| Class | Genes |
|---|
| Class I | IL1RN,
COL4A2 |
| Class II | SMC3, CRK, CALD,
MYO6, TOP1, ST3GAL1, PPIG, KIRREL, ANKRD12, TTC3 |
| Class III | IL8, FOS, PPBP,
SST, DIS3, KIF3B, RBM25, ARHGAP28, EPB41L5 |
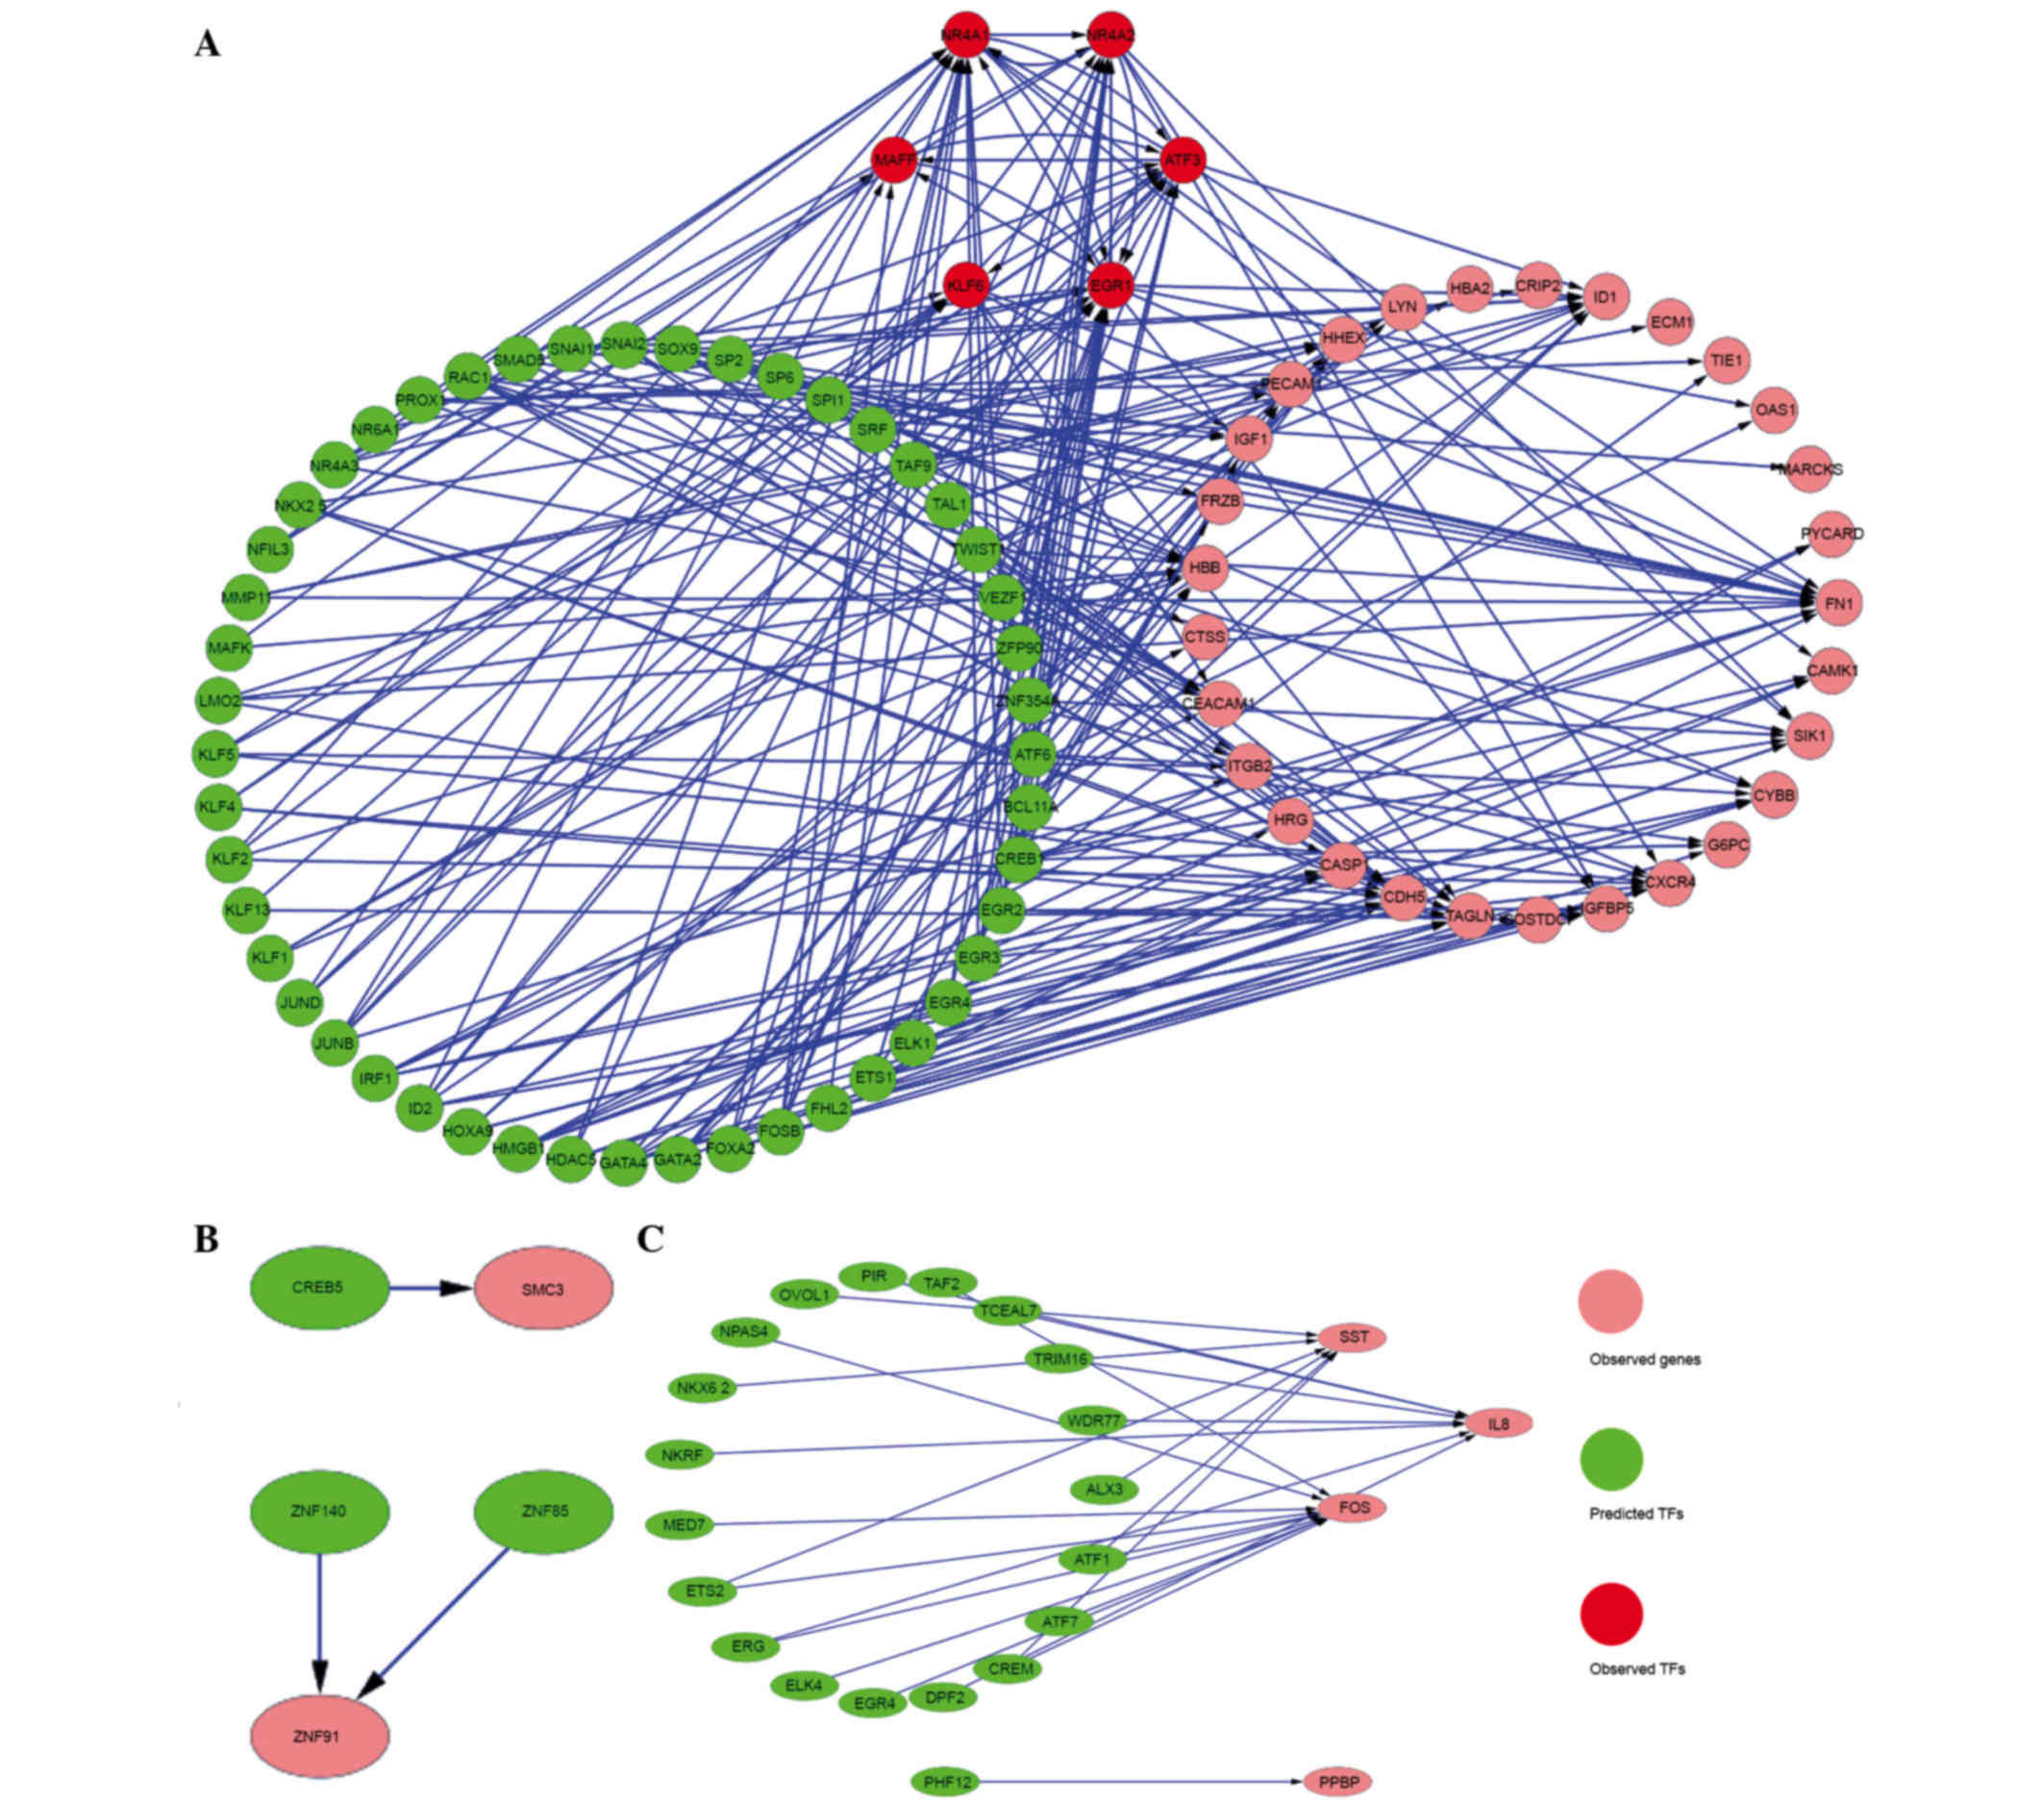
Identification of TFs and construction
of the regulatory network
Genomatix was used to predict the TFs of the 66
shared DEGs in IgAN vs. LD and HT vs. LD, and the 39 genes in HT
vs. IgAN. Then, 54 TFs were identified, 6 of which belonged to DEGs
including EGR1, activating transcription factor 3 (ATF3), nuclear
receptor subfamily 4 group A member 2 (NR4A2), NR4A1, v-maf avian
musculoaponeurotic fibrosarcoma oncogene homolog F (MAFF) and
Kruppel-like factor 6 (KLF6). In addition, 3 TFs [cAMP responsive
element binding protein 5 (CREB5), zinc finger protein 140 (ZNF140)
and ZNF85] and 20 TFs (including pirin, TATA-box binding protein
associated factor 2 and NFκB repressing factor) were predicted to
regulate the genes in class II and class III, respectively. The
regulatory networks of DEGs and their TFs are presented in Fig. 5.
Discussion
Currently, bioinformatics analysis provides a
high-efficiency method to study renal disease. In the present
study, in order to extend our understanding of IgAN and HT, 39 DEGs
in patients with HT were compared with those in patients with IgAN
and 66 shared DEGs in IgAN vs. LD and HT vs. LD were identified;
their associated TFs were screened as well. These genes may provide
a basis for the identification of potential biomarkers. In
addition, 6 DEGs were identified as TFs and they may be effective
as potential therapeutic targets.
The results demonstrated that 66 genes were
significantly altered in patients with IgAN and HT when compared
with healthy controls, among which EGR1, ATF3, NR4A2, NR4A1, MAFF
and KLF6 were identified as TFs. EGR1, a member of the early growth
response family of zinc finger TFs, modulates the regulation of
cluster of differentiation 40 ligand (CD40L) expression in
megakaryocytes (18). CD40L is
important in the development of cardiovascular disease and a number
of chronic autoimmune inflammatory diseases that target the
vasculature such as chronic kidney disease (19). ATF3, a member of the ATF/CREB
family of TFs, regulates transcription by binding to DNA sites as a
homodimer or heterodimer with c-JUN proteins (20). In addition, EGFR1 and ATF3 have
been reported to regulate the expression of inflammation- and
immune-associated genes (21).
NR4A2 and NR4A1, members of the nuclear hormone receptor subfamily,
are involved in cell apoptosis and carcinogenesis (22). MAFF has been associated with the
cellular stress response and detected in the kidney (23). KLF6, a DNA-binding protein
containing a triple zinc-finger motif, serves a role during kidney
development and, more specifically, during the development of the
renal collecting duct system (10). Therefore, the results of the
present study suggested that EGR1, ATF3, NR4A2, NR4A1, MAFF and
KLF6, serve as TFs and serve important roles during the development
of human kidney. Thus, they could be used as candidate therapeutic
targets for IgAN and HT.
In addition, 39 genes were screened in HT samples
and compared with IgAN samples; these genes were then divided into
three classes. IL1RN and COL4A2 belong to class I,
which were altered in IgAN vs. LD group. IL1RN is involved in
autoinflammatory disease (24) and
may contribute to the risk of IgAN (25,26).
COL4A2 is a member of the collagen type IV family that may be
effective as a marker of renal dysfunction (27). Furthermore, IL1RN and
COL4A2 were enriched in a number of inflammation-associated
biological processes such as the negative regulation of the
IL1-mediated signaling pathway and negative regulation of
heterotypic cell-cell adhesion. Genes in class II were also altered
in HT vs. LD, including SMC3, CRK, CALD,
MYO6, TOP1, ST3GAL1, PPIG,
KIRREL, ANKRD12 and TTC3. The results
indicated that SMC3 was modulated by CREB5, a TF belonging
to the CREB protein family. SMC3 is also involved in sister
chromatid cohesion (28). The GO
enrichment results demonstrated that genes including SMC3,
CRK and MYO6 were enriched in
non-inflammation-associated biological processes (including genetic
transfer, DNA mediated transformation and actin filament-based
process). Thus, the authors speculated that the genes in class II
may particulate in the cell cycle of HT cells. In addition,
IL8, FOS, PPBP, SST, DIS3,
KIF3B, RBM25, ARHGAP28 and EPB41L5 in
class III were specific DEGs in HT vs. IgAN. IL8, a novel leukocyte
chemotactic activating cytokine, has been observed to serve a
causative role in acute inflammation by activating neutrophils
(29). The expression of SST in
IgAN increased and thus may be involved in the pathogenesis of
inflammatory renal disease (30).
FOS is thought to be involved in the treatment of diabetic
nephropathy (31), which is
closely associated with HT. Therefore, the results of the present
study also suggested that IL1RN and COL4A2 may be
effective biomarkers in patients with IgAN, genes in class II
(including SMC3, CRK and CALD) may serve as
biomarkers for patients with HT and genes in class III (including
IL8, FOS and SST) may be alternative
biomarkers for IgAN and HT.
In conclusion, the present study screened a large
number of DEGs and their TFs in IgAN and HT samples, which were
then compared with healthy controls by analyzing mRNA expression
profiles. The results suggested that EGR1, ATF3,
NR4A2, NR4A1, MAFF and KLF6 may be
candidate targets for the treatment of IgAN and/or HT. In addition,
genes that were screened in HT samples and compared with IgAN
samples, including IL1RN, COL4A2, SMC3,
CRK and MYO6, IL8, FOS and SST,
may be useful as biomarkers for IgAN and/or HT. However, the
majority of candidate biomarkers are still being validated.
Therefore, further investigation is required into the role of these
biomarkers and targets in appropriate, larger and randomized
cohorts, prior to their use in routine clinical screening.
Acknowledgements
The present study was supported by the Jilin Health
and Family Planning Commission Project (grant nos. 3D513J603429 and
2009Z039) and the Foundational Research Programme of Jilin
University (grant no. 2012000016).
References
|
1
|
Zhang L, Wang F, Wang L, Wang W, Liu B,
Liu J, Chen M, He Q, Liao Y, Yu X, et al: Prevalence of chronic
kidney disease in China: A cross-sectional survey. Lancet.
379:815–822. 2012. View Article : Google Scholar : PubMed/NCBI
|
|
2
|
Tomino Y: Immunopathological predictors of
prognosis in IgA nephropathy. Contrib Nephrol. 181:65–74. 2013.
View Article : Google Scholar : PubMed/NCBI
|
|
3
|
Packham D: Prognosis in IgA nephropathy.
Nephrology. 3:231–235. 1997. View Article : Google Scholar
|
|
4
|
Lee S, Rao VM, Franklin WA, Schiffer MS,
Aronson AJ, Spargo BH and Katz AI: IgA nephropathy: Morphologic
predictors of progressive renal disease. Hum Pathol. 13:314–322.
1982. View Article : Google Scholar : PubMed/NCBI
|
|
5
|
Ikee R, Kobayashi S, Saigusa T, Namikoshi
T, Yamada M, Hemmi N, Imakiire T, Kikuchi Y, Suzuki S and Miura S:
Impact of hypertension and hypertension-related vascular lesions in
IgA nephropathy. Hypertens Res. 29:15–22. 2006. View Article : Google Scholar : PubMed/NCBI
|
|
6
|
Julian BA, Wittke S, Haubitz M, Zürbig P,
Schiffer E, Mcguire BM, Wyatt RJ and Novak J: Urinary biomarkers of
IgA nephropathy and other IgA-associated renal diseases. World J
Urol. 25:467–476. 2007. View Article : Google Scholar : PubMed/NCBI
|
|
7
|
Harada K, Akai Y, Kurumatani N, Iwano M
and Saito Y: Prognostic value of urinary interleukin 6 in patients
with IgA nephropathy: An 8-year follow-up study. Nephron.
92:824–826. 2002. View Article : Google Scholar : PubMed/NCBI
|
|
8
|
Hastings MC, Moldoveanu Z, Suzuki H,
Berthoux F, Julian BA, Sanders JT, Renfrow MB, Novak J and Wyatt
RJ: Biomarkers in IgA nephropathy: Relationship to pathogenetic
hits. Expert Opin Med Diagn. 7:615–627. 2013. View Article : Google Scholar : PubMed/NCBI
|
|
9
|
Chaudhary K, Phadke G, Nistala R,
Weidmeyer CE, McFarlane SI and Whaley-Connell A: The emerging role
of biomarkers in diabetic and hypertensive chronic kidney disease.
Curr Diab Rep. 10:37–42. 2010. View Article : Google Scholar : PubMed/NCBI
|
|
10
|
Reich HN, Tritchler D, Cattran DC,
Herzenberg AM, Eichinger F, Boucherot A, Henger A, Berthier CC,
Nair V, Cohen CD, et al: A molecular signature of proteinuria in
glomerulonephritis. PLoS One. 5:e134512010. View Article : Google Scholar : PubMed/NCBI
|
|
11
|
Barrett T, Wilhite SE, Ledoux P,
Evangelista C, Kim IF, Tomashevsky M, Marshall KA, Phillippy KH,
Sherman PM, Holko M, et al: NCBI GEO: Archive for functional
genomics data sets-update. Nucleic Acids Res. 41:(Database Issue).
D991–D995. 2013. View Article : Google Scholar : PubMed/NCBI
|
|
12
|
Wu Z and Irizarry RA: Preprocessing of
oligonucleotide array data. Nat Biotechnol. 22:656–658. 2004.
View Article : Google Scholar : PubMed/NCBI
|
|
13
|
Ihaka R and Gentleman R: R: A language for
data analysis and graphics. J Comput Graph Stat. 5:299–314. 1996.
View Article : Google Scholar
|
|
14
|
Gautier L, Cope L, Bolstad BM and Irizarry
RA: Affy-analysis of Affymetrix GeneChip data at the probe level.
Bioinformatics. 20:307–315. 2004. View Article : Google Scholar : PubMed/NCBI
|
|
15
|
Smyth GK: Limma: Linear models for
microarray dataBioinformatics and computational biology solutions
using R and Bioconductor. Springer; pp. 397–420. 2005, View Article : Google Scholar
|
|
16
|
Wang L, Cao C, Ma Q, Zeng Q, Wang H, Cheng
Z, Zhu G, Qi J, Ma H, Nian H and Wang Y: RNA-seq analyses of
multiple meristems of soybean: Novel and alternative transcripts,
evolutionary and functional implications. BMC Plant Biol.
14:1692014. View Article : Google Scholar : PubMed/NCBI
|
|
17
|
Kohl M, Wiese S and Warscheid B:
Cytoscape: Software for visualization and analysis of biological
networks. Methods Mol Biol. 696:291–303. 2011. View Article : Google Scholar : PubMed/NCBI
|
|
18
|
Crist SA, Elzey BD, Ahmann MT and Ratliff
TL: Early Growth response-1 (Egr-1) and nuclear factor of activated
T cells (NFAT) cooperate to mediate CD40L expression in
megakaryocytes and platelets. J Biol Chem. 288:33985–33996. 2013.
View Article : Google Scholar : PubMed/NCBI
|
|
19
|
Kairaitis L, Wang Y, Zheng L, Tay YC, Wang
Y and Harris DC: Blockade of CD40-CD40 ligand protects against
renal injury in chronic proteinuric renal disease. Kidney Int.
64:1265–1272. 2003. View Article : Google Scholar : PubMed/NCBI
|
|
20
|
Tsujino H, Kondo E, Fukuoka T, Dai Y,
Tokunaga A, Miki K, Yonenobu K, Ochi T and Noguchi K: Activating
transcription factor 3 (ATF3) induction by axotomy in sensory and
motoneurons: A novel neuronal marker of nerve injury. Mol Cell
Neurosci. 15:170–182. 2000. View Article : Google Scholar : PubMed/NCBI
|
|
21
|
Pestka JJ: Deoxynivalenol-induced
proinflammatory gene expression: Mechanisms and pathological
sequelae. Toxins (Basel). 2:1300–1317. 2010. View Article : Google Scholar : PubMed/NCBI
|
|
22
|
Li Q, Ke N, Sundaram R and Wong-Staal F:
NR4A1, 2, 3-an orphan nuclear hormone receptor family involved in
cell apoptosis and carcinogenesis. Histol Histopathol. 21:533–540.
2006.PubMed/NCBI
|
|
23
|
Kimura T, Ogita K, Kumasawa K, Tomimatsu T
and Tsutsui T: Molecular analysis of parturition via oxytocin
receptor expression. Taiwan J Obstet Gynecol. 52:165–170. 2013.
View Article : Google Scholar : PubMed/NCBI
|
|
24
|
Reddy S, Jia S, Geoffrey R, Lorier R,
Suchi M, Broeckel U, Hessner MJ and Verbsky J: An autoinflammatory
disease due to homozygous deletion of the IL1RN locus. N Engl J
Med. 360:2438–2444. 2009. View Article : Google Scholar : PubMed/NCBI
|
|
25
|
Syrjänen J, Hurme M, Lehtimäki T, Mustonen
J and Pasternack A: Polymorphism of the cytokine genes and IgA
nephropathy. Kidney Int. 61:1079–1085. 2002. View Article : Google Scholar : PubMed/NCBI
|
|
26
|
Liu DJ, Liu Y, Ran LM and Li DT: Genetic
variants in interleukin genes and susceptibility to IgA
nephropathy: A meta-analysis. DNA Cell Biol. 33:345–354. 2014.
View Article : Google Scholar : PubMed/NCBI
|
|
27
|
Minz WR, Bakshi A, Chhabra S, Joshi K and
Sakhuja V: Role of myofibroblasts and collagen type IV in patients
of IgA nephropathy as markers of renal dysfunction. Indian J
Nephrol. 20:34–39. 2010. View Article : Google Scholar : PubMed/NCBI
|
|
28
|
Beckouët F, Hu B, Roig MB, Sutani T,
Komata M, Uluocak P, Katis VL, Shirahige K and Nasmyth K: An Smc3
acetylation cycle is essential for establishment of sister
chromatid cohesion. Mol Cell. 39:689–699. 2010. View Article : Google Scholar : PubMed/NCBI
|
|
29
|
Harada A, Sekido N, Akahoshi T, Wada T,
Mukaida N and Matsushima K: Essential involvement of interleukin-8
(IL-8) in acute inflammation. J Leukoc Biol. 56:559–564.
1994.PubMed/NCBI
|
|
30
|
Bhandari S, Watson N, Long E, Sharpe S,
Zhong W, Xu SZ and Atkin SL: Expression of somatostatin and
somatostatin receptor subtypes 1–5 in human normal and diseased
kidney. J Histochem Cytochem. 56:733–743. 2008. View Article : Google Scholar : PubMed/NCBI
|
|
31
|
Mao CP and Gu ZL: Puerarin reduces
increased c-fos, c-jun, and type IV collagen expression caused by
high glucose in glomerular mesangial cells. Acta Pharmacol Sin.
26:982–986. 2005. View Article : Google Scholar : PubMed/NCBI
|