Introduction
Complex regional pain syndrome (CRPS) is an uncommon
chronic pain condition that develops following trauma. The features
include limb pain, allodynia, hypersensitivity, motor abnormality
and trophic alterations (1). Women
are affected more commonly than men, and postmenopausal women
demonstrate the highest risk (2).
CRPS is classified into two subtypes depending on the presence of
peripheral nerve injury. CRPS type I without peripheral nerve
injury is more common than type II, which presents as peripheral
nerve injury (3). In addition,
CRPS is categorized into ‘warm’ or ‘cold’ CRPS depending on whether
skin temperature is increased or decreased (4). Although CRPS is designated as an
orphan disease in the general population, it affects ~4–7% patients
experiencing limb fractures (5).
CRPS is a burden on the healthcare system and society. A number of
different therapeutic strategies have been applied to treat CRPS,
including pharmacological, interventional and psychological
methods; however, there evidence to support their efficiency of
these methods is insufficient (5).
The pathogenesis of CRPS is unclear (6), however several mechanisms have are
thought to be involved, including inflammation, neurogenic
inflammation and alterations of the central nerve system (6). Goebel et al (7) elucidated the association between
inflammation, immune response and CRPS, and an autoimmune model was
proposed. Oaklander et al (8) proposed that CRPS is associated with
distal degeneration of small diameter peripheral axons. Barad et
al (9) demonstrated that brain
structure was involved in CRPS. However, little is known about how
these mechanisms interact to lead to CRPS. Therefore, identifying
key genes or signaling pathways involved in the development of CRPS
may facilitate elucidation of the integrated mechanism of CRPS and
enable the development of targeted therapies.
Genome-wide expression profiling of CPRS was
recently performed by Jin et al (10). The authors collected and analyzed
peripheral blood examples from healthy controls and patients with
CRPS. Differentially expressed genes (DEGs) were identified using
microarray analysis, and out of those identified, 6 genes were
selected for further confirmation by reverse
transcription-quantitative polymerase chain reaction analysis. The
authors focused on a significantly upregulated DEG (matrix
metallopeptidase 9), thought to be associated with pain progression
in CRPS. However, the gene/protein interaction networks involved in
CRPS remain unknown, which is necessary to elucidate how
inflammation, neurogenic inflammation and alterations of the
central nervous system are involved in CRPS. Therefore, the authors
of the present study constructed a protein-protein interaction
network in order to identify the specific molecular interactions
involved in CRPS.
In the present study, the GSE47603 gene expression
profiling microarray data deposited by Jin et al (10) was obtained and used to identify
CRPS-associated genes in patients with CRPS. The microarray data
was used to identify key DEGs associated with CRPS by employing
comprehensive analysis methods in order to enrich the functions and
signaling pathways of identified DEGs. In addition, a
protein-protein interaction (PPI) network was constructed and
analyzed to identify hub genes. The aim of the current study was to
identify several key genes associated with the disease, and examine
their potential function in the development of CRPS by expression
profile analysis. The results may facilitate the identification of
potential targets for the diagnosis and treatment of CRPS.
Materials and methods
Microarray data
The GSE47603 microarray data, deposited by Jin et
al (10) was obtained from the
Gene Expression Omnibus (GEO; http://www.ncbi.nlm.nih.gov/geo). This microarray used
the GPL10558 platform (Illumina HumanHT-12 v4 expression beadchip;
Illumina, Inc., San Diego, CA, USA). A total of 9 peripheral blood
samples from 4 patients with CRPS and 5 healthy controls were
included in the genome-wide expression profiling array, as
described previously (10). Out of
the patients with CRPS, 2 patients presented with CRPS type I and 2
patients presented with CRPS type II. Patients who received
medication of CRPS were included; however, those with additional
neurogenic disorders caused by this medication were excluded. The
control subjects did not present with infectious disease, pain
disorders and had not undergone recent surgery.
Data processing
Array data export, processing and analysis was
performed using the Gene Expression Module (version, 1.9.0) of
Illumina GenomeStudio software (version, 2011.1; Illumina, Inc.).
Data were already quantile-normalized. Significant DEGs were
identified by comparing profile data from patients with CRPS with
that of control subjects using the online analysis tool, GEO2R
(http://www.ncbi.nlm.nih.gov/geo/geo2r/, version R
3.2.3, Biobase 2.30.0, GEOquery 2.40.0, limma 3.26.8), as was
accessible from the GEO website. This tool uses the linear models
for microarray analysis package to identify DEGs and provides
t-statistics and P-values. Benjamini and Hochberg's false discovery
rate was applied to adjust the P-values. DEGs with adjusted
P-values of <0.05 and fold change (FC) values of >1.5 were
considered to be significant.
Gene ontology (GO) enrichment and
Kyoto encyclopedia of genes and genomes (KEGG) pathway
analysis
The GO database (http://geneontology.org) is a large-scale collection
of genomic data divided into 3 categories according to biological
process (BP), molecular function and cellular component. KEGG
(http://www.genome/ad.jp/kegg/) is a
pathway-associated database for gene classification. The Database
for Annotation Visualization and Integrated Discovery (DAVID,
https://david.ncifcrf.gov/) integrates
biological data and analysis tools to provide systematic functional
annotation for a large number of genes and proteins.
To analyze the putative functions of identified
DEGs, GO annotation associated with BP and KEGG pathway enrichment
analyses were performed using the online DAVID tool version 6.7
(11,12). A P-value of <0.05 and gene
counts of >2 were considered to be significant.
PPI construction
The Search Tool for the Retrieval of Interaction
Genes (STRING; http://string.embl.de/) database
collects comprehensive information regarding predicted and
experimental interactions between proteins in a given cell. In the
present study, DEGs were mapped in the STRING database version,
10.0 (13) to construct a PPI
network, which provides an improved understanding of the functional
organization of the proteome. A combined score of >4 was set as
the threshold. The PPI network was subsequently analyzed using
Cytoscape (http://www.cytoscape.org/, version,
3.3.0) software. The degree of connectivity of each node in the PPI
network was calculated, and the hub nodes were identified. Genes
were clustered using the MCODE Cytoscape plugin (version,
1.4.1).
Results
DEG analysis
Using adjusted P-values of <0.05 and FC values of
>1.5, a total of 257 DEGs were identified in blood samples from
patients with CRPS when compared with the controls. This included
243 upregulated and 14 downregulated genes (Tables I and II). The most significantly upregulated
and downregulated genes were human leukocyte antigen (HLA)-DRB1 and
HLA-DQB1, respectively, which belong to the HLA family. An
additional member of the HLA family, HLA-DRB4, was significantly
downregulated in CRPS samples when compared with controls (Table II).
 | Table I.Significantly upregulated
differentially expressed genes (n=15). |
Table I.
Significantly upregulated
differentially expressed genes (n=15).
| Illumina ID | Adjusted P-value | logFC | Gene symbol |
|---|
| ILMN_1715169 | 0.0000060 | 3.8971524 | HLA-DRB1 |
| ILMN_1738075 | 0.0026403 | 1.3041826 | CMIP |
| ILMN_1670130 | 0.0015978 | 1.2499989 | ARID3A |
| ILMN_1722872 | 0.0033398 | 1.1720856 | MYH9 |
| ILMN_2371169 | 0.0026403 | 1.1696512 | ZYX |
| ILMN_1696643 | 0.0026403 | 1.0804514 | TLN1 |
| ILMN_1760027 | 0.0026403 | 0.9688758 | WAS |
| ILMN_1811823 | 0.0026403 | 0.9556934 | MED25 |
| ILMN_1663618 | 0.0026403 | 0.9497475 | STAT3 |
| ILMN_1800425 | 0.0026403 | 0.9133604 | SLC9A1 |
| ILMN_1777906 | 0.0030662 | 0.9120812 | MAP7D1 |
| ILMN_1725534 | 0.0026403 | 0.8451986 | ACTN4 |
| ILMN_1682930 | 0.0026403 | 0.8188014 | SIPA1 |
| ILMN_2275098 | 0.0026403 | 0.7684677 | DTX2 |
| ILMN_1764788 | 0.0026403 | 0.7212105 | TNFRSF1B |
| Table II.Significantly downregulated
differentially expressed genes (n=14). |
Table II.
Significantly downregulated
differentially expressed genes (n=14).
| Illumina ID | Adjusted
P-value | logFC | Gene symbol |
|---|
| ILMN_1661266 | 0.0151182 | −2.4675689 | HLA-DQB1 |
| ILMN_2356991 | 0.0196116 | −1.2897218 | CD47 |
| ILMN_1718766 | 0.0086679 | −0.8003821 | MT1F |
| ILMN_3241953 | 0.0341073 | −0.7595469 | GGACT |
| ILMN_1741133 | 0.0161371 | −0.7282374 | NME1 |
| ILMN_1780368 | 0.0251894 | −0.7091328 | GPR18 |
| ILMN_1676575 | 0.0251784 | −0.6922376 | IKZF1 |
| ILMN_1712298 | 0.0169227 | −0.6912831 | ANKRD46 |
| ILMN_1726460 | 0.0136377 | −0.6765224 | RPL14 |
| ILMN_1715661 | 0.0211196 | −0.6750304 | TFAM |
| ILMN_1771333 | 0.0121527 | −0.6515932 | CD47 |
| ILMN_1752592 | 0.0493698 | −0.6494842 | HLA-DRB4 |
| ILMN_2326273 | 0.0241474 | −0.6120625 | CHI3L2 |
| ILMN_1653026 | 0.0196116 | −0.6098733 | PLAC8 |
Functional enrichment analysis
The over-represented GO-BP terms of DEGs were
primarily associated with antigen processing and presentation, the
immune response process, the integrin-mediated signaling pathway,
cell motion and adhesion, angiogenesis, and cell-substrate junction
assembly (Table III). In
addition, DEGs were enriched in KEGG pathways including viral
myocarditis, systemic lupus erythematosus, asthma, allograft
rejection, graft-vs.-host disease, type I diabetes mellitus,
intestinal immune network for immunoglobulin A production,
autoimmune thyroid disease, antigen processing and presentation and
hematopoietic cell lineage (Table
IV).
| Table III.Most significant GO-biological
process terms enriched by differentially expressed genes
(n=15). |
Table III.
Most significant GO-biological
process terms enriched by differentially expressed genes
(n=15).
| GO ID | Biological
process | Count | P-value |
|---|
| GO:0007229 | Integrin-mediated
signaling pathway | 9 |
5.01×10⁻⁶ |
| GO:0007010 | Cytoskeleton
organization | 20 |
9.05×10⁻⁶ |
| GO:0030036 | Actin cytoskeleton
organization | 14 |
1.45×10⁻⁵ |
| GO:0030029 | Actin
filament-based process | 14 |
2.88×10⁻⁵ |
| GO:0006955 | Immune
response | 24 |
7.43×10⁻⁵ |
| GO:0006952 | Defense
response | 22 |
1.12×10⁻⁴ |
| GO:0022604 | Regulation of cell
morphogenesis | 9 |
4.51×10⁻⁴ |
| GO:0007242 | Intracellular
signaling cascade | 33 |
4.52×10⁻⁴ |
| GO:0045321 | Leukocyte
activation | 12 |
5.23×10⁻⁴ |
| GO:0045596 | Negative regulation
of cell differentiation | 11 |
8.13×10⁻⁴ |
| GO:0008360 | Regulation of cell
shape | 6 |
8.53×10⁻⁴ |
| GO:0001775 | Cell
activation | 12 |
2.06×10⁻³ |
| GO:0006928 | Cell motion | 16 |
2.36×10⁻³ |
| GO:0035023 | Regulation of Rho
protein signal transduction | 7 |
2.42×10⁻³ |
| GO:0051056 | Regulation of small
GTPase mediated signal transduction | 11 |
2.56×10⁻³ |
| Table IV.Most significant KEGG terms enriched
by differentially expressed genes (n=15). |
Table IV.
Most significant KEGG terms enriched
by differentially expressed genes (n=15).
| KEGG ID | KEGG term | Count | P-value |
|---|
| hsa04810 | Regulation of actin
cytoskeleton | 14 |
9.87×10⁻⁵ |
| hsa04670 | Leukocyte
transendothelial migration | 9 |
1.13×10⁻³ |
| hsa04666 | Fc-ε R-mediated
phagocytosis | 8 |
1.43×10⁻³ |
| hsa04520 | Adherens
junction | 7 |
2.38×10⁻³ |
| hsa05221 | Acute myeloid
leukemia | 6 |
3.57×10⁻³ |
| hsa05416 | Viral
myocarditis | 6 |
8.45×10⁻³ |
| hsa04330 | Notch signaling
pathway | 5 |
9.52×10⁻³ |
| hsa05200 | Pathways in
cancer | 13 |
1.32×10⁻² |
| hsa04142 | Lysosome | 7 |
1.78×10⁻² |
| hsa04640 | Hematopoietic cell
lineage | 6 |
1.84×10⁻² |
| hsa04630 | Jak-STAT signaling
pathway | 8 |
2.03×10⁻² |
| hsa04510 | Focal adhesion | 9 |
2.66×10⁻² |
| hsa05211 | Renal cell
carcinoma | 5 |
3.59×10⁻² |
| hsa04144 | Endocytosis | 8 |
4.57×10⁻² |
| hsa04062 | Chemokine signaling
pathway | 8 |
4.91×10⁻² |
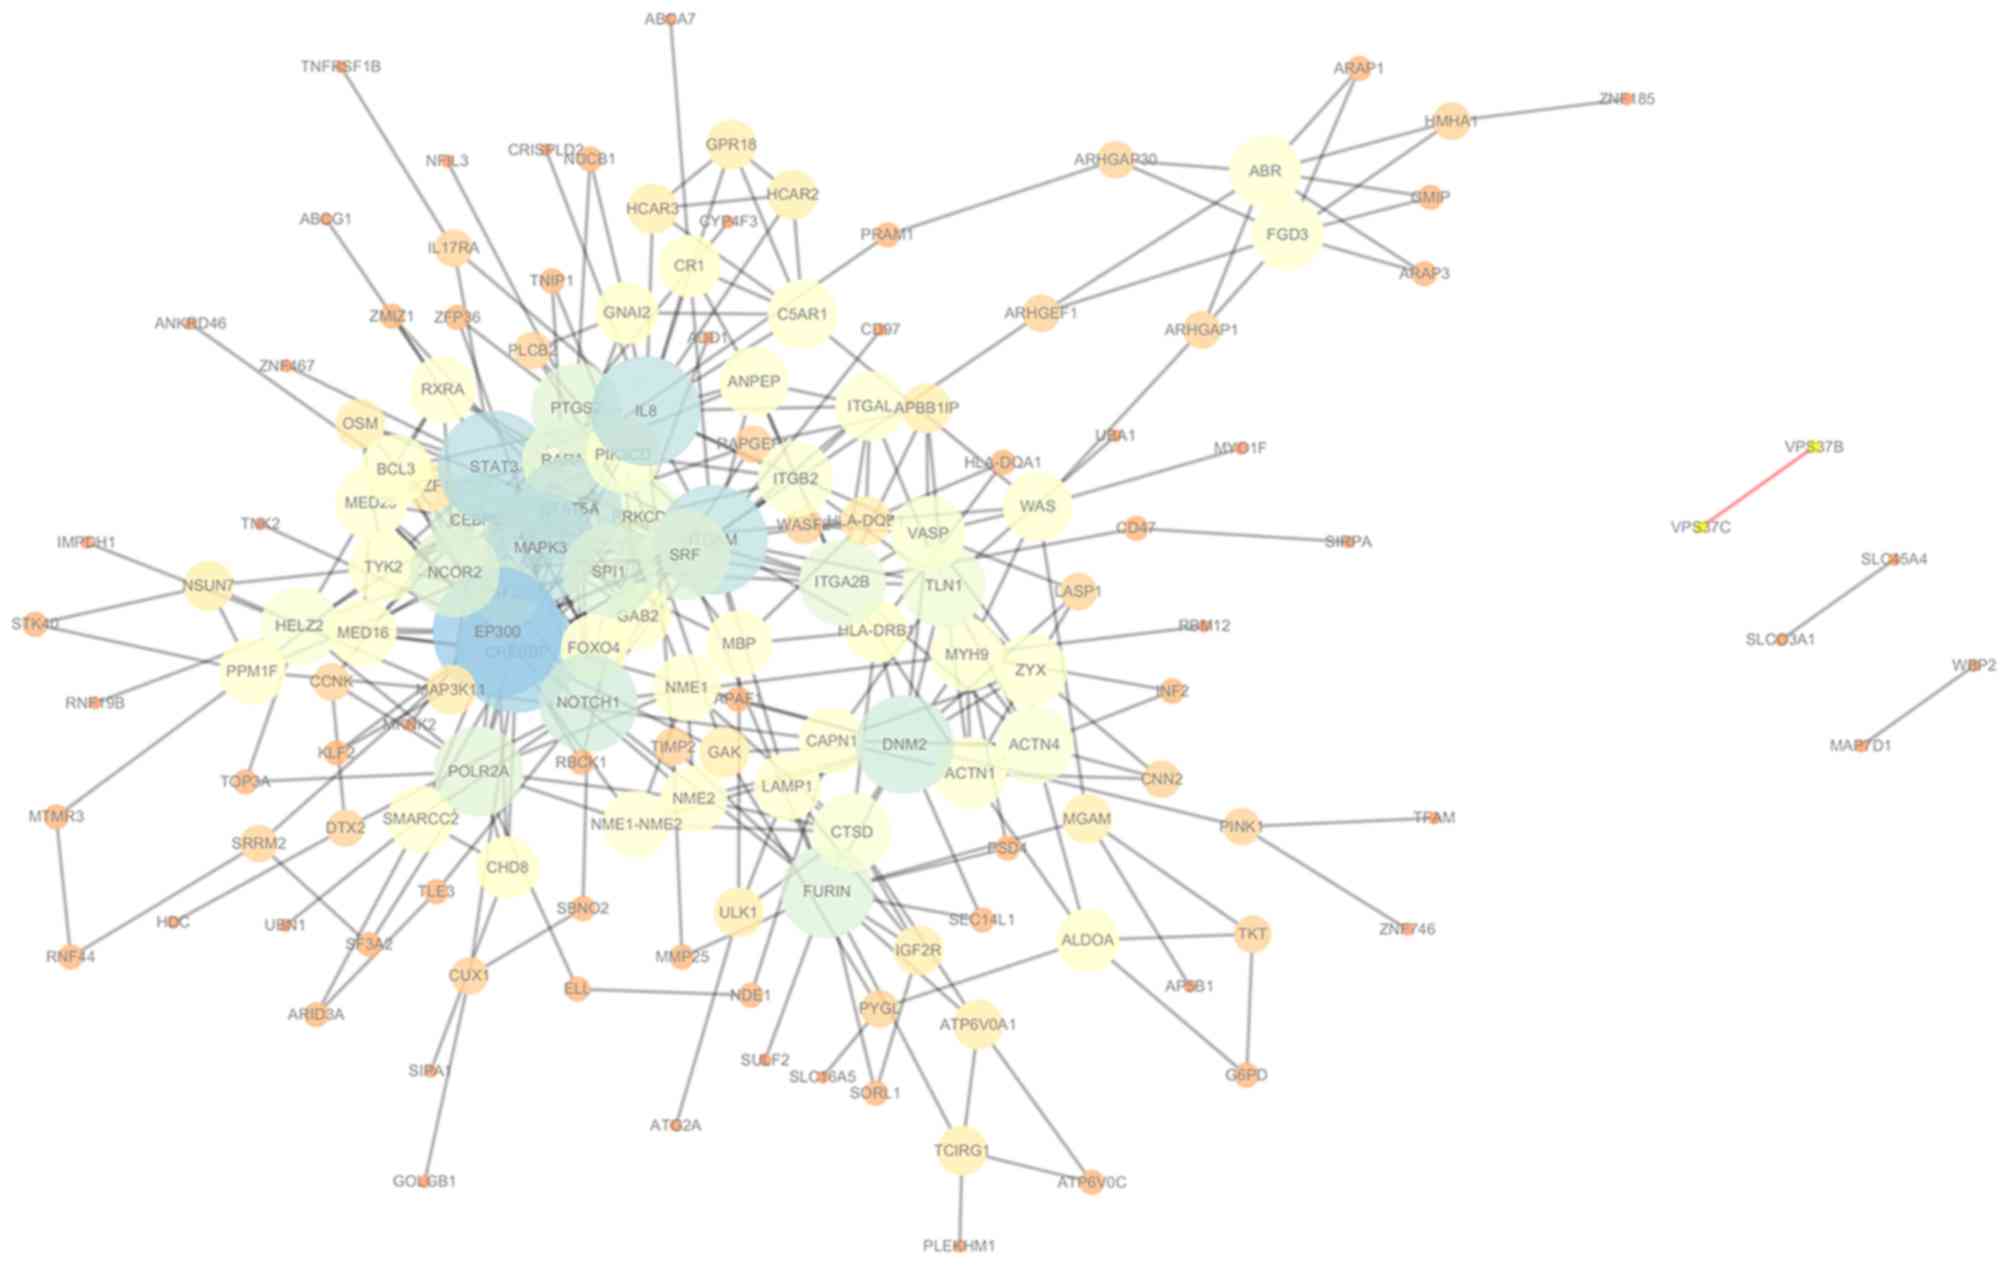
PPI analysis
The PPI network generated using the STRING database
included 155 nodes and 400 edges (Fig.
1). Topological structure analysis performed by Cytoscape
software revealed the degree of genes in the PPI network. Nodes
with a higher degree are more connected with other nodes, and they
are considered to contribute to the stability of the network and
are designated as hub nodes. In the present study, genes with a
higher degree included adenovirus early region 1A binding protein
p300 (EP300), CREB-binding protein (CREBBP), signal transducer and
activator of transcription (STAT)3 and STAT5A of the STAT protein
family, interleukin 8 (IL8) and integrin α M (ITGAM).
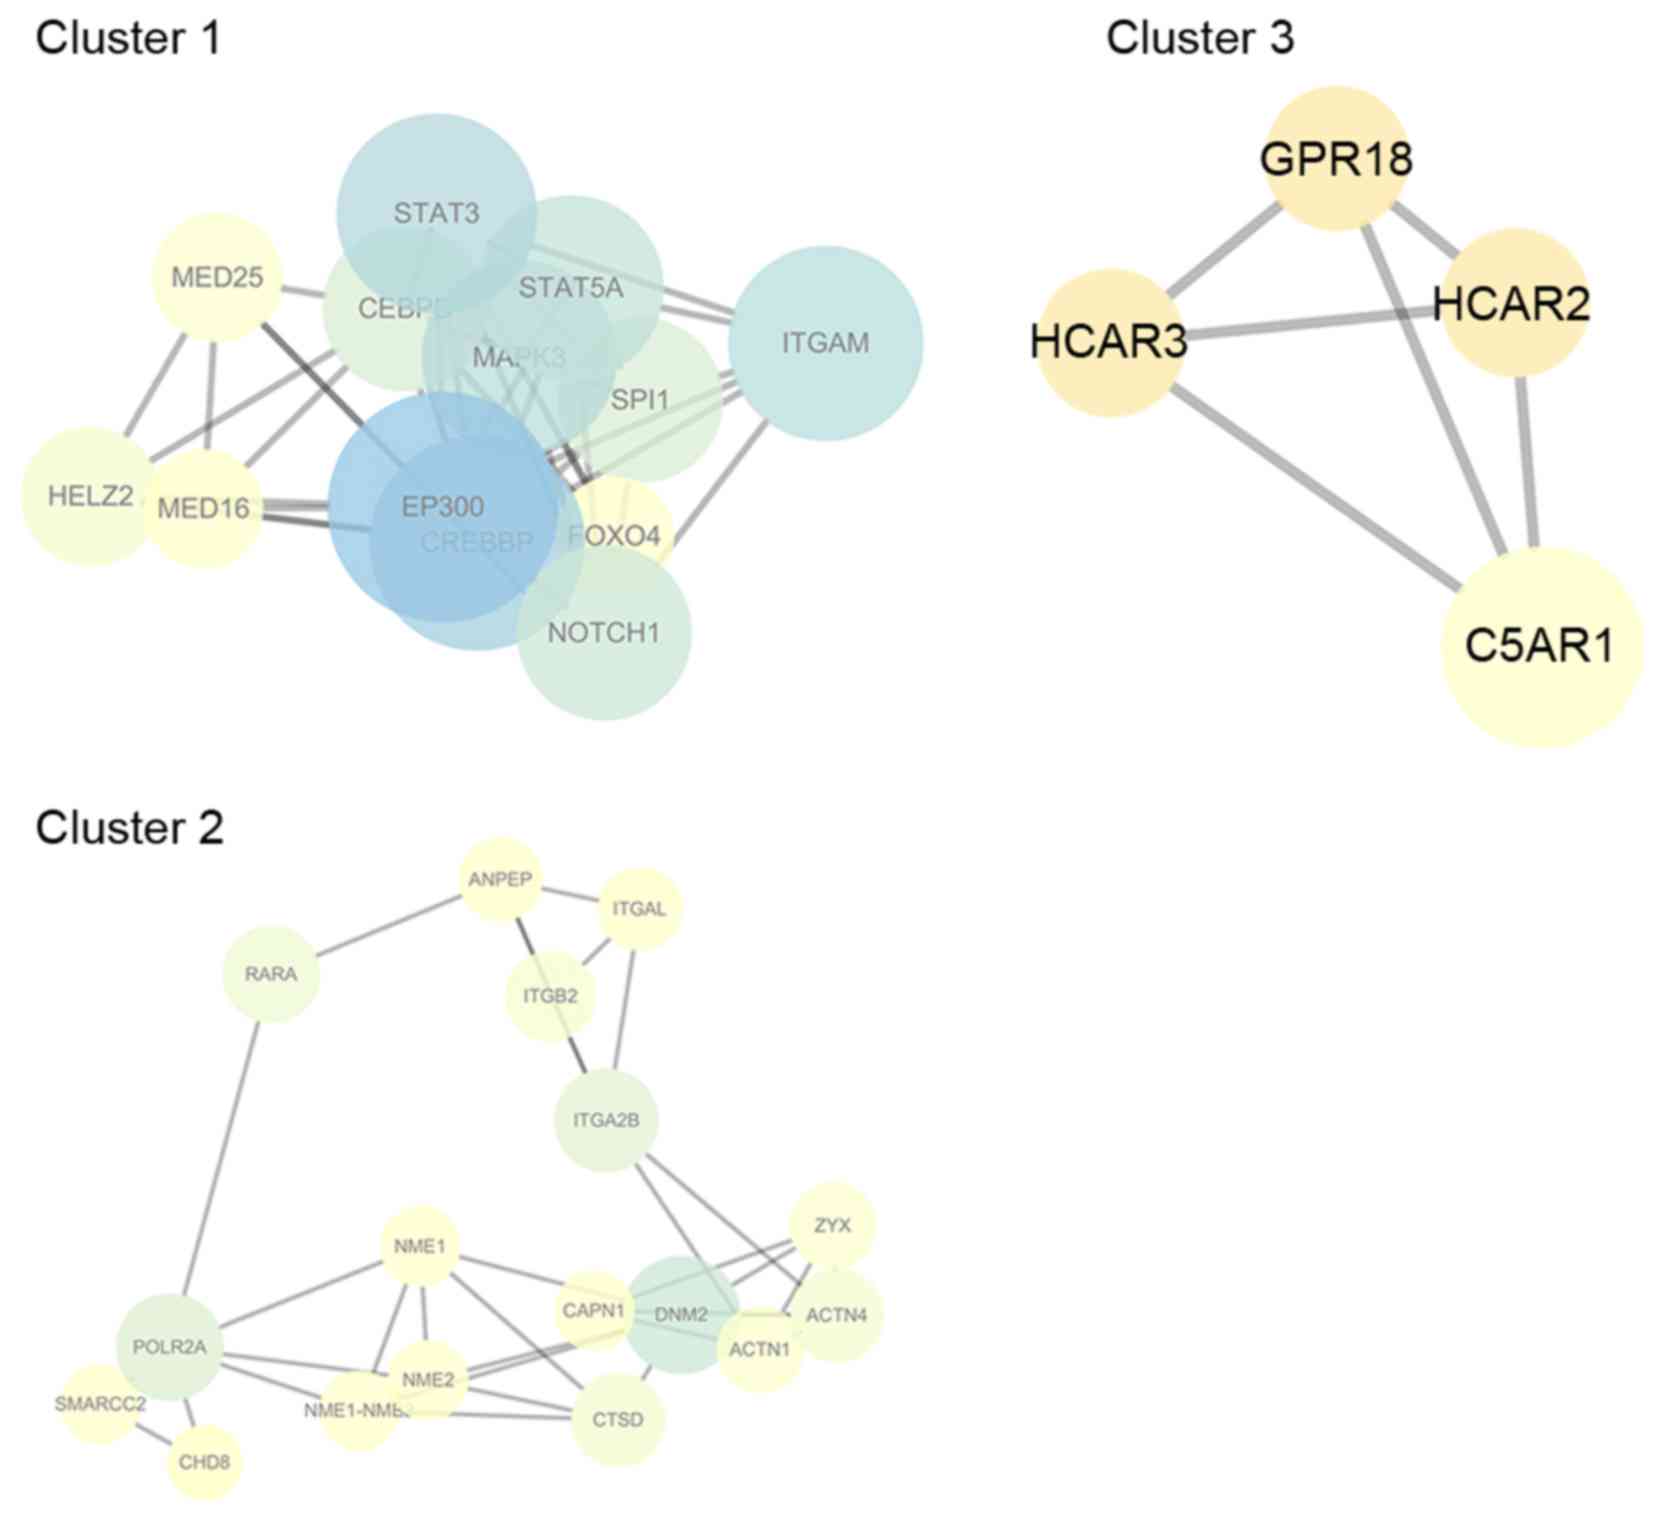
A total of 3 modules with a score of >4 were
identified using the MCODE plugin (Fig. 2). Cluster 1 exhibited the highest
score, and DEGs, such as EP300, CREBBP, STAT3, STAT5A and ITGAM
were included. Enrichment analysis demonstrated that the GO-BP
terms enriched by these genes were associated with regulation of
transcription, biosynthesis, hormone stimuli responses and cell
differentiation (Table V). DEGs in
cluster 2 primarily included ITGAM, retinoic acid receptor α,
integrin subunit α 2B and DNA-directed RNA polymerase II subunit
RPB1 (Fig. 2), which were enriched
in GO-BP terms associated with cell adhesion and apoptosis
(Table V). DEGs in cluster 3
included C5 anaphylatoxin chemotactic receptor 1, GPR18,
hydroxycarboxylic acid receptor (HCAR) 2 and HCAR3 (Fig. 2), which were enriched in the
G-protein signaling pathway (Table
V).
| Table V.Significant GO-biological process
terms enriched by differentially expressed genes in clusters. |
Table V.
Significant GO-biological process
terms enriched by differentially expressed genes in clusters.
| A, Cluster 1 |
|---|
|
|---|
| GO ID | Biological
process | Count | P-value |
|---|
| GO:0045941 | Positive regulation
of transcription | 8 |
6.02×10⁻⁸ |
| GO:0010628 | Positive regulation
of gene expression | 8 |
7.38×10⁻⁸ |
| GO:0045935 | Positive regulation
of nucleobase, nucleoside, nucleotide and nucleic acid metabolic
process | 8 |
1.21×10⁻⁷ |
| GO:0051173 | Positive regulation
of nitrogen compound metabolic process | 8 |
1.50×10⁻⁷ |
| GO:0010557 | Positive regulation
of macromolecule biosynthetic process | 8 |
1.66×10⁻⁷ |
| GO:0031328 | Positive regulation
of cellular biosynthetic process | 8 |
2.29×10⁻⁷ |
| GO:0009891 | Positive regulation
of biosynthetic process | 8 |
2.52×10⁻⁷ |
| GO:0006357 | Regulation of
transcription from RNA polymerase II promoter | 8 |
3.43×10⁻⁷ |
| GO:0045893 | Positive regulation
of transcription, DNA-dependent | 7 |
7.40×10⁻⁷ |
| GO:0051254 | Positive regulation
of RNA metabolic process | 7 |
7.77×10⁻⁷ |
| GO:0010604 | Positive regulation
of macromolecule metabolic process | 8 |
1.05×10⁻⁶ |
| GO:0006350 | Transcription | 10 |
2.11×10⁻⁶ |
| GO:0045944 | Positive regulation
of transcription from RNA polymerase II promoter | 6 |
6.09×10⁻⁶ |
| GO:0006355 | Regulation of
transcription, DNA-dependent | 9 |
9.79×10⁻⁶ |
| GO:0051252 | Regulation of RNA
metabolic process | 9 |
1.16×10⁻⁵ |
|
| B, Cluster 2 |
|
| GO ID | Biological
process | Count | P-value |
|
| GO:0007155 | Cell adhesion | 6 |
4.95×10⁻⁴ |
| GO:0022610 | Biological
adhesion | 6 |
4.98×10⁻⁴ |
| GO:0007229 | Integrin-mediated
signaling pathway | 3 |
2.31×10⁻³ |
| GO:0007160 | Cell-matrix
adhesion | 3 |
3.70×10⁻³ |
| GO:0031589 | Cell-substrate
adhesion | 3 |
4.47×10⁻³ |
| GO:0042981 | Regulation of
apoptosis | 5 |
7.67×10⁻³ |
| GO:0043067 | Regulation of
programmed cell death | 5 |
7.94×10⁻³ |
| GO:0010941 | Regulation of cell
death | 5 |
8.05×10⁻³ |
| GO:0051017 | Actin filament
bundle formation | 2 |
2.15×10⁻² |
| GO:0007159 | Leukocyte
adhesion | 2 |
2.86×10⁻² |
| GO:0006338 | Chromatin
remodeling | 2 |
5.64×10⁻² |
| GO:0051271 | Negative regulation
of cell motion | 2 |
6.33×10⁻² |
| GO:0007015 | Actin filament
organization | 2 |
7.20×10⁻² |
|
| C, Cluster 3 |
|
| GO ID | Biological
process | Count | P-value |
|
| GO:0007186 | G-protein coupled
receptor protein signaling pathway | 2 |
8.30×10⁻² |
|
| GO, Gene
Ontology. |
Discussion
In the present study, a total of 257 DEGs were
identified in blood samples from patients with CRPS when compared
with healthy controls. Pathway enrichment analysis demonstrated
that the identified DEGs were primarily enriched in immune
response, cell motion, adhesion and angiogenesis signaling
pathways. In the PPI network, EP300 displayed the highest degree
and was present in cluster 1. Additional DEGs in cluster 1 with
relatively high degrees were STAT3, CREBBP, STAT5A, ITGAM, notch
homolog 1, CCAAT/enhancer binding protein β and mitogen-activated
protein kinase 3.
Goebel et al (14) demonstrated that intravenous
immunoglobulin (IVIG) is effective for the reduction of pain in
patients with CRPS, which suggests that the immune response may be
important in the development of CRPS. Subsequent studies indicated
that neuroautoimmunity and neurogenic inflammation contribute to
CRPS. Cooper et al (15)
demonstrated that infiltrating leukocytes reacted to autoantibodies
that bind to autoantigens located on the surface of neuronal and
glial cell targets, and were closely associated with
neuroautoimmune responses. In addition, the development of
autoantibodies against the β2 adrenergic receptor and
muscarinic-2 receptor were identified in patients with CRPS
(16).
HLA-DQB1, HLA-DRB4 and HLA-DRB1, which belong to
class II of the HLA family, are expressed by a subgroup of immune
cells, including B cells, activated T cells and macrophages
(17). Kemler et al
(18) discovered increased
expression of HLA-DQB1 among CRPS patients. In addition, a previous
study demonstrated that HLA is associated with CRPS whereby two
members of the HLA family (HLA-DQ8 and HLA-B62) were observed to be
differentially expressed in different subtypes of CRPS (19). Furthermore, genes in class I of the
HLA family were observed to be associated with the development of
CRPS (20). HLA-DR2 and HLA-DR13
have been reported to be associated with CRPS (21,22).
However, studies in HLA-DRB4 and DRB1 have not focused on their
roles in CRPS. Therefore, further research to determine how HLA may
be involved in CRPS may provide additional important information.
Changes in the expression levels of the HLA family indicates that
CRPS may be associated with inflammation regulation (19). Additionally, CRPS may be important
to genes closely associated with HLA instead of HLA genes
themselves (20).
EP300 and its paralog CREBBP are transcriptional
coactivators that regulate gene transcription by connecting
DNA-binding and transcription factors, relaxing chromatin through
its intrinsic histone acetyltransferase activity and modifying
specific transcription factors (23). EP300 and CREBBP have been
implicated in a large number of diseases. Lunning et al
(24) demonstrated that mutations
in EP300 and CREBBP are present in germinal center B-cell
lymphomas. Kishimoto et al (25) demonstrated that EP300 and CREBBP
may be involved in the pathogenesis of follicular lymphoma.
Notably, Seltzer et al (26) indicated that EP300 and CREBBP were
associated with postnatal microcephaly. That EP300 and CREBBP have
a high degree in the PPI network found by our study may add to the
myriad of roles of EP300 and CREBBP in disease.
STAT3 and STAT5 belong to the STAT protein family,
which was first discovered as part of the cytokine signaling
pathway (27). These proteins
demonstrate a significant effect on the immune response and in the
process of oncogenesis (27).
STAT3A serves multiple roles in cytokine signaling pathways
(27). STAT3-knock out mice were
incapable of completing gastrulation (28), and conditional STAT3-knock out
promotes apoptosis (29). In
addition, STAT3 is involved in the differentiation of
CD4+ cells to Th17 cells, which protect against invading
bacteria and fungi and are involved in the autoimmune response
(30,31). Furthermore, STAT3 is a recognized
oncogene (32). Similarly, STAT5
serves an important role in the differentiation of CD4+
cells into Treg cells, which are involved in reducing the immune
response and protecting against autoimmune disease (31,33).
STAT5 expression deficiency was found to closely associated with
tumorigenesis by changing the function of natural killer cells to
tumor promotion (34). This
implies that STAT may be the potential therapeutic target for CRPS
(31).
In conclusion, the results of the present study
provided additional evidence in support of the hypothesis that
neuroautoimmunity is an important factor for the pathogenesis of
CRPS. And significant genes such as HLA-DQB1, HLA-DRB4, HLA-DRB1
from the HLA family, EP300 and its paralog CREBBP, STAT3 and STAT5
from the STAT family were identified by differentially expressed
gene and topological analyses, and module identification of the PPI
network constructed from these genes. However, further experiments
such as western blotting are required to confirm the changes of
expression levels of these genes. Additionally, to fully elucidate
the mechanism behind how change in the expression levels of these
genes lead to CRPS, further studies are required to determine,
which pathways contribute to CRPS. Due to the small sample size of
the present study the current findings are limited. Therefore,
pooling CRPS samples from different sources in future
investigations will increase the sample size and confirm the
current findings.
References
|
1
|
Palmer G: Complex regional pain syndrome.
Aust Prescr. 38:82–86. 2015. View Article : Google Scholar : PubMed/NCBI
|
|
2
|
de Mos M, de Bruijn AG, Huygen FJ,
Dieleman JP, Stricker BH and Sturkenboom MC: The incidence of
complex regional pain syndrome: A population-based study. Pain.
129:12–20. 2007. View Article : Google Scholar : PubMed/NCBI
|
|
3
|
Stanton-Hicks M, Jänig W, Hassenbusch S,
Haddox JD, Boas R and Wilson P: Reflex sympathetic dystrophy:
Changing concepts and taxonomy. Pain. 63:127–133. 1995. View Article : Google Scholar : PubMed/NCBI
|
|
4
|
Bruggeman AW, Oerlemans MH and Frölke JP:
Warm and cold complex regional pain syndromes: Differences beyond
skin temperature? Neurology. 73:1711–1712. 2009. View Article : Google Scholar : PubMed/NCBI
|
|
5
|
Bruehl S: Complex regional pain syndrome.
BMJ. 351:h27302015. View Article : Google Scholar : PubMed/NCBI
|
|
6
|
Bussa M, Guttilla D, Lucia M, Mascaro A
and Rinaldi S: Complex regional pain syndrome type I: A
comprehensive review. Acta Anaesthesiol Scand. 59:685–697. 2015.
View Article : Google Scholar : PubMed/NCBI
|
|
7
|
Goebel A and Blaes F: Complex regional
pain syndrome, prototype of a novel kind of autoimmune disease.
Autoimmun Rev. 12:682–686. 2013. View Article : Google Scholar : PubMed/NCBI
|
|
8
|
Oaklander AL and Fields HL: Is reflex
sympathetic dystrophy/complex regional pain syndrome type I a
small-fiber neuropathy? Ann Neurol. 65:629–638. 2009. View Article : Google Scholar : PubMed/NCBI
|
|
9
|
Barad MJ, Ueno T, Younger J, Chatterjee N
and Mackey S: Complex regional pain syndrome is associated with
structural abnormalities in pain-related regions of the human
brain. J Pain. 15:197–203. 2014. View Article : Google Scholar : PubMed/NCBI
|
|
10
|
Jin EH, Zhang E, Ko Y, Sim WS, Moon DE,
Yoon KJ, Hong JH and Lee WH: Genome-wide expression profiling of
complex regional pain syndrome. PLoS One. 8:e794352013. View Article : Google Scholar : PubMed/NCBI
|
|
11
|
Huang DW, Sherman BT and Lempicki RA:
Systematic and integrative analysis of large gene lists using DAVID
Bioinformatics resources. Nat Protoc. 4:44–57. 2009. View Article : Google Scholar : PubMed/NCBI
|
|
12
|
da Huang W, Sherman BT and Lempicki RA:
Bioinfromatics enrichment tools: Paths toward the comprehensive
functional analysis of large gene lists. Nucleic Acids Res.
37:1–13. 2009. View Article : Google Scholar : PubMed/NCBI
|
|
13
|
Szklarczyk D, Franceschini A, Wyder S,
Forslund K, Heller D, Huerta-Cepas J, Simonovic M, Roth A, Santos
A, Tsafou KP, et al: STRING v10: Protein-protein interaction
networks, integrated over the tree of life. Nucleic Acids Res.
43:D447–D452. 2015. View Article : Google Scholar : PubMed/NCBI
|
|
14
|
Goebel A: Immunoglobulin responsive
chronic pain. J Clin Immunol. 30:(Suppl 1). S103–S108. 2010.
View Article : Google Scholar : PubMed/NCBI
|
|
15
|
Cooper MS and Clark VP: Neuroinflammation,
neuroautoimmunity, and the co-morbidities of complex regional pain
syndrome. J Neuroimmune Pharmacol. 8:452–469. 2013. View Article : Google Scholar : PubMed/NCBI
|
|
16
|
Kohr D, Singh P, Tschernatsch M, Kaps M,
Pouokam E, Diener M, Kummer W, Birklein F, Vincent A, Goebel A, et
al: Autoimmunity against the β\2 adrenergic receptor and
muscarinic-2 receptor in complex regional pain syndrome. Pain.
152:2690–2700. 2011. View Article : Google Scholar : PubMed/NCBI
|
|
17
|
Klein J and Sato A: The HLA system. First
of two parts. N Engl J Med. 343:702–709. 2000. View Article : Google Scholar : PubMed/NCBI
|
|
18
|
Kemler MA, van de Vusse AC, van den
Berg-Loonen EM, Barendse GA, van Kleef M and Weber WE: HLA-DQ1
associated with reflex sympathetic dystrophy. Neurology.
53:1350–1351. 1999. View Article : Google Scholar : PubMed/NCBI
|
|
19
|
van Rooijen DE, Roelen DL, Verduijn W,
Haasnoot GW, Huygen FJ, Perez RS, Perez RS, Claas FH, Marinus J,
van Hilten JJ and van den Maagdenberg AM: Genetic HLA associations
in complex regional pain syndrome with and without dystonia. J
Pain. 13:784–789. 2012. View Article : Google Scholar : PubMed/NCBI
|
|
20
|
van de Beek WJ, Roep BO, van der Slik AR,
Giphart MJ and van Hilten BJ: Susceptibility loci for complex
regional pain syndrome. Pain. 103:93–97. 2003. View Article : Google Scholar : PubMed/NCBI
|
|
21
|
Mailis A and Wade J: Profile of Caucasian
women with possible genetic predisposition to reflex sympathetic
dystrophy: A pilot study. Clin J Pain. 10:210–217. 1994. View Article : Google Scholar : PubMed/NCBI
|
|
22
|
van Hilten JJ, van de Beek WJ and Roep BO:
Multifocal or generalized tonic dystonia of complex regional pain
syndrome: A distinct clinical entity associated with HLA-DR13. Ann
Neurol. 48:113–116. 2000. View Article : Google Scholar : PubMed/NCBI
|
|
23
|
Wang F, Marshall CB and Ikura M:
Transcriptional/epigenetic regulator CBP/p300 in tumorigenesis:
Structural and functional versatility in target recognition. Cell
Mol Life Sci. 70:3989–4008. 2013. View Article : Google Scholar : PubMed/NCBI
|
|
24
|
Lunning MA and Green MR: Mutation of
chromatin modifiers; an emerging hallmark of germinal center B-cell
lymphomas. Blood Cancer J. 5:e3612015. View Article : Google Scholar : PubMed/NCBI
|
|
25
|
Kishimoto W and Nishikori M: Molecular
pathogenesis of follicular lymphoma. J Clin Exp Hematop. 54:23–30.
2014. View Article : Google Scholar : PubMed/NCBI
|
|
26
|
Seltzer LE and Paciorkowski AR: Genetic
disorders associated with postnatal microcephaly. Am J Med Genet C
Semin Med Genet. 166C:140–155. 2014. View Article : Google Scholar : PubMed/NCBI
|
|
27
|
Lim CP and Cao X: Structure, function, and
regulation of STAT proteins. Mol Biosyst. 2:536–550. 2006.
View Article : Google Scholar : PubMed/NCBI
|
|
28
|
Takeda K, Noguchi K, Shi W, Tanaka T,
Matsumoto M, Yoshida N, Kishimoto T and Akira S: Targeted
disruption of the mouse Stat3 gene leads to early embryonic
lethality. Proc Natl Acad Sci USA. 94:3801–3804. 1997. View Article : Google Scholar : PubMed/NCBI
|
|
29
|
Takeda K, Kaisho T, Yoshida N, Takeda J,
Kishimoto T and Akira S: Stat3 activation is responsible for
IL-6-dependent T cell proliferation through preventing apoptosis:
Generation and characterization of T cell-specific Stat3-deficient
mice. J Immunol. 161:4652–4660. 1998.PubMed/NCBI
|
|
30
|
Laurence A and O'Shea JJ: T(H)-17
differentiation: Of mice and men. Nat Immunol. 8:903–905. 2007.
View Article : Google Scholar : PubMed/NCBI
|
|
31
|
Ross JA, Nagy ZS, Cheng H, Stepkowski SM
and Kirken RA: Regulation of T cell homeostasis by JAKs and STATs.
Arch Immunol Ther Exp (Warsz). 55:231–245. 2007. View Article : Google Scholar : PubMed/NCBI
|
|
32
|
Bromberg JF, Wrzeszczynska MH, Devgan G,
Zhao Y, Pestell RG, Albanese C and Darnell JE Jr: Stat3 as an
oncogene. Cell. 98:295–303. 1999. View Article : Google Scholar : PubMed/NCBI
|
|
33
|
Yao Z, Kanno Y, Kerenyi M, Stephens G,
Durant L, Watford WT, Laurence A, Robinson GW, Shevach EM, Moriggl
R, et al: Nonredundant roles for Stat5a/b in directly regulating
Foxp3. Blood. 109:4368–4375. 2007. View Article : Google Scholar : PubMed/NCBI
|
|
34
|
Gotthardt D, Putz EM, Grundschober E,
Prchal-Murphy M, Straka E, Kudweis P, Heller G, Bago-Horvath Z,
Witalisz-Siepracka A, Cumaraswamy AA, et al: STAT5 is a key
regulator in NK cells and acts as a molecular switch from tumor
surveillance to tumor promotion. Cancer Discov. 6:414–429. 2016.
View Article : Google Scholar : PubMed/NCBI
|