Introduction
Hepatocellular carcinoma (HCC) is one of the most
lethal malignancies worldwide, and is the third most common cause
of cancer-associated mortality. Previous epidemiological studies
revealed that ~626,000 new diagnoses of HCC are made annually
(1). Despite improved therapeutic
modalities, the prognosis for patients with HCC remains poor,
primarily owing to difficulties in early diagnosis and the high
rates of recurrence and metastasis following curative resection;
54–62% of patients develop recurrence within 5 years of surgery,
and the overall 5-year survival rate of patients with HCC is
<20% (2).
Circulating tumor cells (CTCs) are tumor cells that
are found in the peripheral blood of patients with malignant
disease, and are increasingly being recognized as a major cause of
recurrence and metastasis (3).
Therefore, early detection of CTCs may facilitate prognostic
evaluations and contribute to effective therapeutic regimens in
patients with HCC. However, the number of CTCs in peripheral blood
is extremely low, with only a few cells/ml, compared with the
billions of leukocytes and erythrocytes that may be found (4). Advances in molecular technologies and
the discovery of novel tumor markers are making it possible to
detect these rare cells with higher sensitivity and specificity.
Although reverse transcription-polymerase chain reaction (RT-PCR)
and nested-primer RT-PCR may be very sensitive, they sometimes
yield false positive results (5).
By contrast, quantitative RT-PCR (RT-qPCR) may measure very low
expression levels of tumor marker genes with precise and
reproducible results, and therefore may be a powerful tool to
detect CTCs in peripheral blood mononuclear cell (PBMC) samples
(6).
Albumin and α-fetoprotein (AFP) are the most
commonly used tumor markers for the detection of CTCs in patients
with HCC. However, they are non-specific and may occasionally be
observed in the peripheral blood of patients with nonmalignant
liver diseases, including cirrhosis or hepatitis. Previous reports
have revealed that the positive detection rates for these markers
using RT-PCR or nested RT-PCR range between 23.4 and 72.1%
(7,8). Cancer-testis antigens (CTAs) have
recently been identified as specific tumor markers for CTCs
(9,10). CTAs belong to a superfamily of
proteins that are solely expressed in tumors and in the testes, but
not in normal tissues (11,12).
Members of this superfamily include: Fetal and adult
testis-expressed 1 (FATE1), melanoma-associated antigen C2
(MAGEC2), L antigen 1 (LAGE1), MAGEA1, MAGEA3, NY-ESO-1, sperm
protein associated with the nucleus on the X chromosome (SPANX) A1,
SPANXC and synovial sarcoma X breakpoint 1 (SSX1).
Placenta-specific antigen 1 (PLAC1) exhibits a similar expression
pattern as CTAs, and is expressed in a variety of tumors and in the
placenta, but rarely in normal tissues (13).
In the present study, the effectiveness of RT-qPCR
for detecting CTCs in patients with HCC was assessed by evaluating
the mRNA expression levels of nine CTAs and PLAC1 in PBMC samples
from 51 preoperative patients with HCC. In addition, immunomagnetic
beads were used to enrich the PBMC samples for tumor cells to
identify the presence of CTCs morphologically. By using RT-qPCR,
CTCs were detected in ~70% of patients with HCC, indicating that
this technique may by enhanced by magnetic-activated cell sorting
(MACS).
Materials and methods
Ethical approval and informed
consent
The experiments of the present study were approved
by the ethics committee of Beijing Ditan Hospital (Capital Medical
University, Beijing, China) and written informed consent was
obtained from patients prior to enrollment in the study.
Cell lines and cell culture
The QGY7703 human HCC cell line was used in the
present study as it expresses the nine target CTAs and PLAC1 genes
at moderate levels, as determined by our preliminary experiment
(data not shown). The QGY7703 cell line was purchased from the
Institute of Biochemistry and Cell Biology (Shanghai, China). Cells
were cultured in RPMI-1640 medium (Gibco; Thermo Fisher Scientific,
Inc., Waltham, MA, USA) supplemented with 10% fetal calf serum
(FBS; Hyclone; GE Healthcare Life Sciences, Logan, UT, USA), 2 mmol
glutamine and antibiotics (penicillin 100 U/ml and streptomycin 100
µg/ml), at 37°C in a humidified atmosphere containing 5%
CO2.
Patient characteristics and peripheral
blood sample preparation
Peripheral blood (10–15 ml) was collected from 51
preoperative patients with HCC, 10 patients with liver cirrhosis
and 20 healthy donors. Clinicopathological characteristics of the
patients and the controls are summarized in Table I. Samples were mixed with heparin
to prevent coagulation, and were diluted with 10 ml RPMI-1640
medium supplemented with 10% FBS, 2 mmol glutamine and antibiotics.
The samples were placed on a Ficoll-Hypaque layer (Thermo Fisher
Scientific, Inc.) and PBMCs were collected by density gradient
centrifugation at 670 × g and room temperature for 20 min.
 | Table I.Clinical parameters of the 51 patients
with hepatocellular carcinoma and the controls. |
Table I.
Clinical parameters of the 51 patients
with hepatocellular carcinoma and the controls.
| Clinicopathological
characteristics | Hepatocellular
carcinoma, n=51 | Cirrhosis donors,
n=10 | Healthy donors,
n=20 |
|---|
| Sex |
|
|
|
| Male | 35 | 7 | 13 |
|
Female | 16 | 3 | 7 |
| Age (years) |
|
|
|
|
<40 | 6 | 1 | 3 |
| ≥40 | 45 | 9 | 17 |
| AFP (ng/ml) |
|
|
|
|
<400 | 34 | – | – |
| ≥400 | 17 | – | – |
| Tumor size (cm) |
|
|
|
|
<3 | 40 | NA | NA |
| ≥3 | 11 | NA | NA |
| Invasion of main
portal vein |
|
|
|
| Yes | 3 | NA | NA |
| No | 48 | NA | NA |
| TNM stage |
|
|
|
| I and
II | 33 | NA | NA |
| III and
IV | 18 | NA | NA |
| Hepatitis B
virus |
|
|
|
|
Positive | 41 | 8 | 0 |
|
Negative | 10 | 2 | 20 |
| Grade |
|
|
|
| Well
differentiated | 6 | NA | NA |
|
Moderately differentiated | 38 | NA | NA |
| Poorly
differentiated | 7 | NA | NA |
| Modus operandi |
|
|
|
|
Excision | 46 | NA | NA |
|
Orthotopic liver
transplantation | 5 | NA | NA |
Total RNA extraction and cDNA
synthesis
Total RNA was isolated from 1×10⁷
cultured QGY7703 cells and PBMC samples using an RNeasy kit (Qiagen
GmbH, Hilden, Germany) and treated with RNase-free DNase I (Qiagen
GmbH), following the manufacturer's protocol. First strand cDNA was
reverse transcribed from total RNA (2 µg) using random hexamers
[d(N)6] (10 pmol/µl; 2 µl) and Superscript II Reverse
Transcriptase (200 U/µl; 1 µl) at 50°C for 50 min (Thermo Fisher
Scientific, Inc.), according to manufacturer's protocol.
Preparation of recombinant plasmids as
copy number standards for RT-qPCR
Human FATE1, MAGEC2, LAGE1, MAGEA1, MAGEA3,
NY-ESO-1, SPANXA1, SPANXC and SSX1 cDNAs were amplified from human
testis cDNA by qPCR; PLAC1 cDNA was amplified from placenta cDNA by
PCR. Human testis (from patients with advanced prostate cancer
following castration therapy) and placenta (from patients following
normal delivery) samples were obtained from Beijing Ditan Hospital.
Amplification reactions were carried out using cDNA (1 µl), forward
and reverse primers (10 pM each), 2X PCR Master Mix (12.5 µl;
Invitrogen; Thermo Fisher Scientific, Inc.), and double-distilled
H2O to a final volume of 25 µl. PCR products were
purified using the Wizard® SV Gel and PCR Clean-Up
System (Promega Corporation, Madison, WI, USA) and cloned into a
pGEM-T Easy Vector system (Promega Corporation), following the
manufacturer's protocol. Recombinant plasmids were confirmed by DNA
sequencing. Briefly, plasmids were linearized by digestion with an
EcoRI/Nco1 restriction endonuclease at 37°C for 4 h (Takara Bio,
Inc., Otsu, Japan) before being purified by 1.5% agarose gel
electrophoresis and the Wizard® SV Gel and PCR Clean-Up
System (Promega Corporation), and quantified using a
spectrophotometer at a wavelength of 260 nm. The plasmid copy
numbers (copies/ml) were calculated using the following formula:
[plasmid concentration (g/ml) × 6.023×10²³]/(number of
base pairs in the plasmid × 660). The number of base pairs in the
plasmid includes the plasmid vector and the gene insert. These were
used as the copy number standards for subsequent RT-qPCR
analyses.
RT-qPCR and construction of standard
curves
RT-qPCR primers were designed to specifically
amplify the target cDNA fragments containing at least one intron,
while avoiding contamination from genomic DNA. Primer sequences and
TaqMan probes are listed in Table
II; the housekeeping gene GAPDH was used as an internal
control. Five 10-fold dilutions of the resulting constructs,
ranging from 1×10⁴ to 1×10⁸ copies
µl−1, were used to construct the standard curves for
GAPDH, LAGE, NY-ESO-1, MAGEA1, MAGEA3, HCA587, FATE, SPANXA1,
SPANXC, PLAC1 and SSX-1. Absolute quantification of mRNA using
RT-qPCR was performed, which employed standard curves for
quantification (14).
| Table II.List of primer sequences and TaqMan
probes. |
Table II.
List of primer sequences and TaqMan
probes.
| Gene | Primer sequence
(5′-3′) | Expected size
(bp) | Probe (5′-3′) |
|---|
| FATE1 | F:
GCCAAGGGGAAAACCAAGAG | 152 |
CAAAAAGCTGCTGGCTCTGCTTCAGC |
|
| R:
TCGGGTGGCAGTCATATTCC |
|
|
| MAGEC2 | F:
AGGGACCTCCCACCATAGAGA | 130 |
CCGGCCTGTACTGCGCTGCC |
|
| R:
CCTCCTCTGCTGTGCTGACTT |
|
|
| LAGE1 | F:
CCGCCTGCTTCAGTTGC | 167 |
ACGATGCCTTTCTCGTCGCCCAT |
|
| R:
CTGCAGCAGTCAGTCGGATA |
|
|
| MAGEA1 | F:
AGAGGAGCACCAAGGAGAAGA | 74 |
CTGCCTGTGGGTCTTCATTGCCCA |
|
| R:
GGCAGCAGGCAGGAGTGT |
|
|
| MAGEA3 | F:
GGAGCACTGAAGGAGAAGATCTG | 142 |
TGGGTCTCCATTGCCCAGCTCC |
|
| R:
TGACTCTGGTCAGGGCAACA |
|
|
| NY-ESO-1 | F:
TGCTTGAGTTCTACCTCGCCA | 137 | AG
GATGCCCCACCGCTTCCC |
|
| R:
TATGTTGCCGGACACAGTGAA |
|
|
| SPANXA1 | F:
GCCACTGACATTGAAGAACCAA | 115 |
ATACAATGGACAAACAATCCAGTGCCGG |
|
| R:
GGGTCTCCGGCATCATCTC |
|
|
| SPANXC | F:
CCGCCTGCTTCAGTTGC | 167 |
TCTGAGTCCTCGACCATACTAGTGGTTCGC |
|
| R:
CTGCAGCAGTCAGTCGGATA |
|
|
| SSX1 | F:
GTCACCAACTGCTGCCAAC | 153 |
TGCCATGAACGGAGACGACACCTTT |
|
| R:
TTGCTTCTCTTCTCTGATGCTTT |
|
|
| PLAC1 | F:
CAAGTTCCTTCTTCCCTTTGGAA | 120 |
CAGCTGCCTTCACCAGTGAGCACAA |
|
| R:
CGTCCAGTGAGGATTTCTTCTTC |
|
|
| GAPDH | F:
GAAGGTGAAGGTCGGAGTC | 226 |
CAAGCTTCCCGTTCTCAGCC |
|
| R:
GAAGATGGTGATGGGATTTC |
|
|
TaqMan probes were labeled at the 5′ end with the
6-carboxyfluorescein fluorophore, and at the 3′ end with the
fluorescence quencher tetramethylrhodamine. qPCR reactions were
prepared as follows: 1 µl cDNA (~100 ng total RNA) or plasmid DNA
(containing 104-108 copies of the target
sequence) was mixed with 7.5 pM of each forward and reverse
primers, 6.25 pM TaqMan probe and 2X qPCR buffer to a final volume
of 25 µl. A positive control containing 10 copies of plasmid DNA
was prepared. To test for potential contaminants, two reactions
were prepared that contained either 1 µl water or 1 µl reverse
transcriptase without RNA. qPCR was performed at 50°C for 2 min and
95°C for 10 min, followed by 40 cycles of 92°C for 15 sec and 60°C
for 1 min, using an ABI PRISM 7700 Sequence Detection System
(Applied Biosystems; Thermo Fisher Scientific, Inc.). Each
experiment was performed in triplicate.
Sensitivity of RT-qPCR and standard
RT-PCR for the detection of MAGEA1 and SSX1 cDNA in different
ratios of HCC cells to normal PBMC
HCC to normal PBMC ratios of 10−2,
10−3, 10−4, 10−5 and
10−6 were prepared by mixing 105,
104, 103, 102 and 101
QGY7703 cells, respectively, with 107 normal PBMCs from
healthy individuals. A control with only normal PBMCs was
additionally prepared. The cells were recovered by Ficoll-Hypaque
density gradient centrifugation (670 × g for 20 min at room
temperature) and total RNA was extracted as aforementioned. The
expression levels of MAGEA1 and SSX1 cDNA in each of the six
samples were measured by RT-qPCR and standard RT-PCR. Amplification
reactions for standard RT-PCR were performed using cDNA (1 µl),
forward and reverse primers (10 pM each), 2X PCR Master Mix (12.5
µl; Thermo Fisher Scientific, Inc.) and double-distilled
H2O to a final volume of 25 µl. The following optimal
thermal cycling conditions were used: 94°C for 10 min, followed by
35 cycles of 94°C for 25 sec, 54°C for 25 sec and 72°C for 25 sec;
followed by 72°C for 8 min. The housekeeping gene GAPDH was used as
a control. The optimal thermal cycling conditions for GAPDH were
the same for SSX1 and MAGEA1 except that the annealing temperature
was 57°C for GAPDH. The same forward and reverse primers were used
in RT-qPCR and standard RT-PCR.
Enrichment of HCC cells in PBMC
samples by depletion of CD45+ cells by MACS
PBMC samples were acquired from 19 HCC patients that
were identified to have positive expression levels of the tested
CTAs by RT-qPCR. PBMC samples from 10 patients with liver cirrhosis
were additionally used, along with the 10 healthy donors as
control. Cells (~1×10⁷) were washed with PBS and
incubated with anti-CD45 antibody-coated immunomagnetic microbeads
(Miltenyi Biotec GmbH; Bergisch Gladbach, Germany) at 4°C for 15
min. The cells were subsequently separated on an autoMACS Column
(Miltenyi Biotec GmbH) using the sensitive depletion mode for
gentle separation to ensure cellular integrity. The CD45-negative
fraction, which is effectively enriched in HCC tumor cells due to
the depletion of PBMCs, was eluted and cells were collected onto
slides using a cytospin device; slides were air dried before being
stored at −20°C until required.
Immunocytochemistry of cytokeratin to
detect HCC cells in enriched PBMC samples
Slides were fixed in 4% paraformaldehyde for 20 min
at room temperature and examined for the presence of
cytokeratin-positive cells by immunocytochemistry. Following
permeabilization with 0.3% Triton-X-100 for 10 min at room
temperature, and treatment with antigen retrieval solution for 30
min at 80°C (Beyotime Institute of Biotechnology, Haimen, China),
the slides were incubated in 3% H2O2 for 20
min and rinsed with distilled water and PBS. Blocking was performed
using 5% normal goat serum (Shanghai Yanjin Biotechnology Co.,
Ltd., Shanghai, China) at room temperature for 15 min. This was
followed by incubation with the mouse anti-cytokeratin, clone
CK3-6H5 primary antibody (1:50; cat. no. 130-098-802; Miltenyi
Biotec GmbH) overnight at 4°C. The next day, the slides were rinsed
and incubated with the biotinylated horse anti-mouse immunoglobulin
G (1:500; cat. no. orb153695; Biorbyt, Ltd., Cambridge, UK) at room
temperature for 30 min. The signal was visualized with
peroxidase-conjugated streptavidin and 3,3′-diaminobenzidine (DAB).
The slides were subsequently examined and photographed using an
Olympus BX53 fluorescence microscope (Olympus Corporation, Tokyo,
Japan). DAB staining was analyzed by Image-Pro Plus 6.0 software
(Media Cybernetics, Inc., Rockville, MD, USA). Unenriched QGY7703
cells were used as the positive control; healthy PBMCs were used as
the negative control.
Hematoxylin and eosin (H&E)
staining of PBMC samples enriched in HCC tumor cells
Slides were fixed in 4% paraformaldehyde and stained
with H&E according to routine protocols at room temperature
(~25°C). Briefly, slides were washed with distilled water and
stained with hematoxylin solution for 5–10 min, followed by soaking
the stained slides in distilled water for 10 min to remove excess
dye. Subsequently, after soaking in 95% ethanol for 5 sec, slides
were stained with eosin staining solution for 2 min, which was
followed by dehydration with graded alcohol and clearing in xylene.
Finally, slides were sealed with neutral gum. The mounted slides
were examined and photographed using an Olympus BX53 fluorescence
microscope (Olympus Corporation). Cell morphology was assessed by a
chief pathologist who was blinded to the study. Unenriched QGY7703
cells were used as the positive control and healthy PBMCs were used
as the negative control. Experiments were repeated three times.
Results
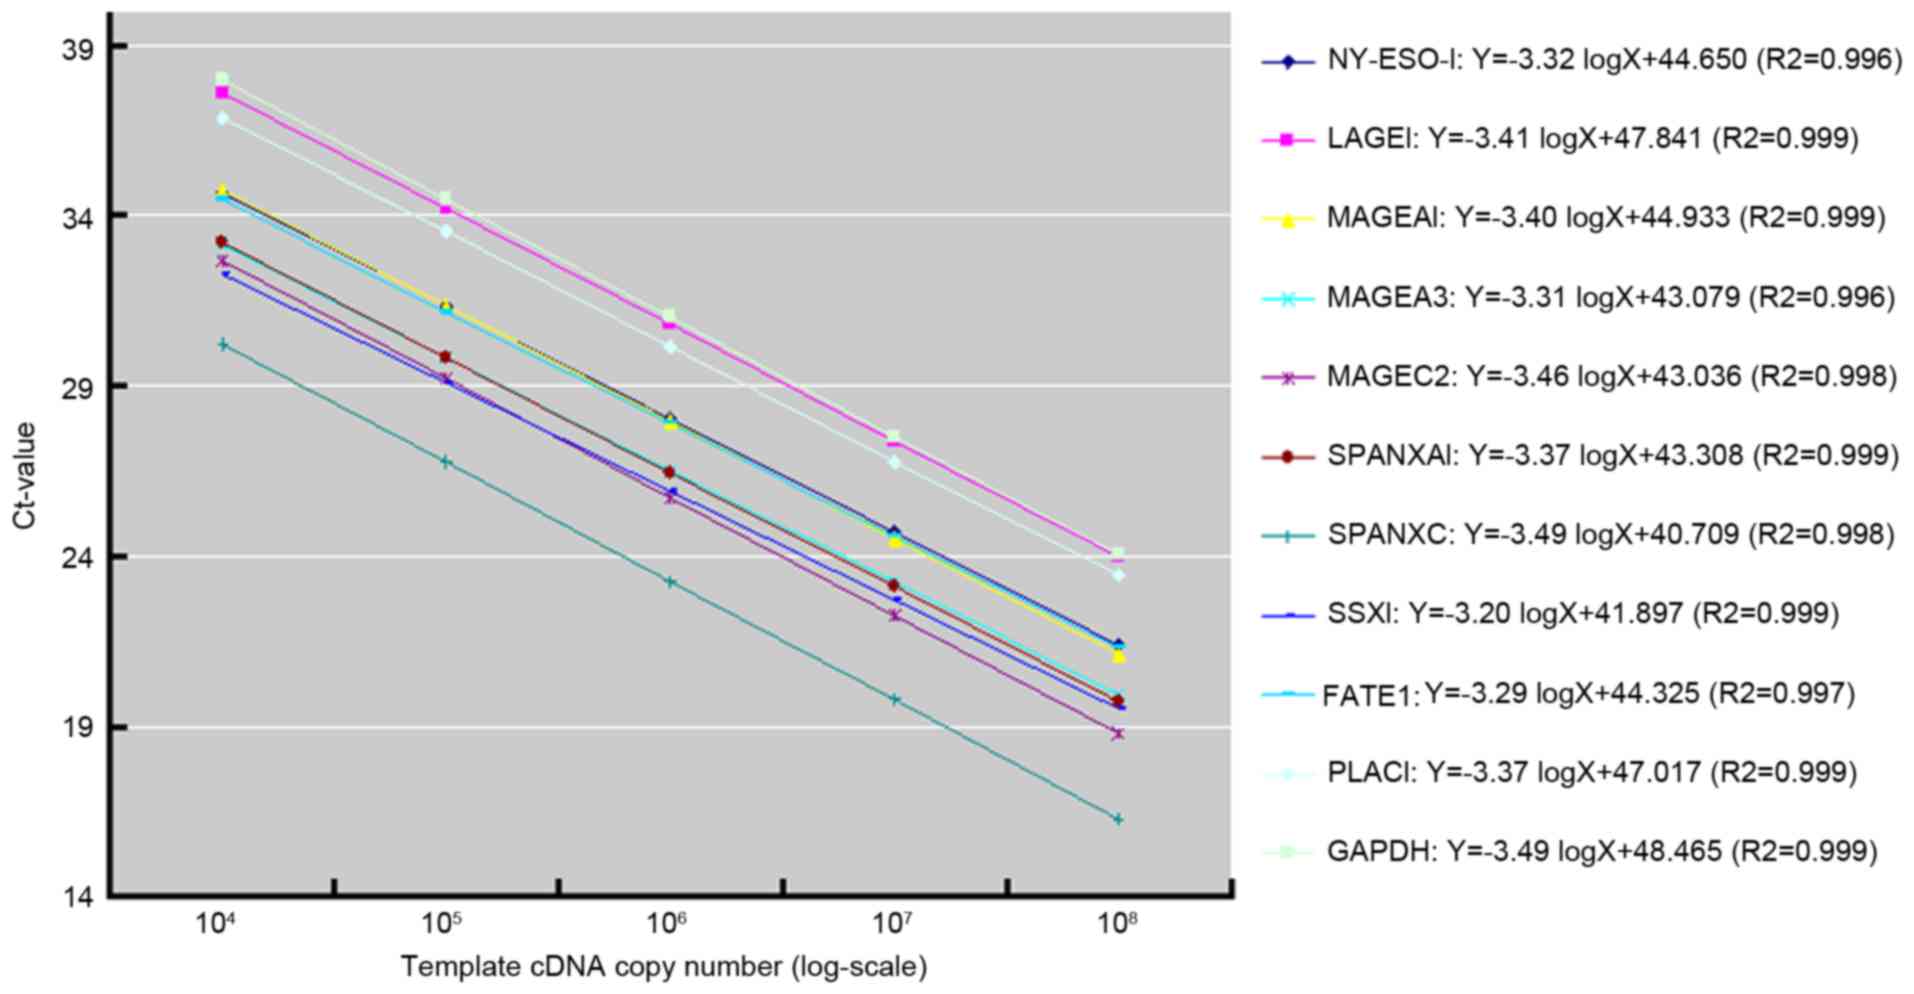
Standard curves for RT-qPCR
Standard curves for the nine CTAs, PLAC1 and GAPDH
cDNAs were constructed using gene-specific recombinant plasmids as
copy number standards (Fig. 1).
The reducible amplification curves of the 11 standard curves
exhibited similar slopes (between −3.20 and −3.49), confirming that
the RT-qPCR protocol had acceptable reproducibility and specificity
for the detection of the nine CTAs and PLAC1. However, the y-axis
intercepts (cycle thresholds) ranged between 40.71 and 48.47,
indicating variations in amplification sensitivities and
efficiencies between the different cDNAs.
Sensitivity of the RT-qPCR assay
Using defined ratios of QGY7703 cells and normal
PBMCs, the present study was able to detect as few as 10 CTCs among
107 PBMCs using RT-qPCR to measure the expression levels
of SSX1 and MAGEA1 cDNA in HCC cells (Fig. 2). In contrast, standard RT-PCR was
only able to detect as low as 103 CTCs in 107
PBMCs. This result demonstrated that RT-qPCR was ~100X more
sensitive than RT-PCR for the detection of CTCs through CTA cDNA
expression analysis in PBMCs.
Expression rates of CTA and PLAC1
cDNAs in peripheral blood samples from patients with HCC
The overall positive detection rate for the 10
tested cDNAs (nine CTAs and PLAC1) in PBMC samples from 51 patients
with HCC was 70.6% (36/51 patients detected positive for ≥1 target
cDNA). However, most of the patients only exhibited between 1 and 3
of these 10 markers. By contrast, none of the tested cDNAs were
detected in PBMC samples from the 10 patients with cirrhosis and
the 20 healthy patients. The individual positive detection rates
were as follows: MAGEA3, 43.1% (22/51); SSX1, 39.2% (20/51);
MAGEA1, 25.5% (13/51); NY-ESO-1, 19.6% (10/51); PLAC1, 19.6%
(10/51); LAGE1, 17.6% (9/51); MAGEC2, 7.8% (4/51); SPANXC, 7.8%
(4/51); SPANXA1, 2.0% (1/51); and FATE1, 0% (0/51). Six of the
genes (MAGEA3, SSX1, MAGEA1, NY-ESO-1, PLAC1 and LAGE1)
demonstrated high positive rates in the PBMCs of patients with HCC
and were selected for further analysis. The expression levels of
these six cDNAs, relative to GAPDH, were as follows: MAGEA3,
1/103-1/107; SSX1,
1/103.5-1/106.5; MAGEA1,
1/102.5-1/106.5; NY-ESO-1,
1/103.5-1/106; PLAC1,
1/104-1/105.5; and LAGE1,
1/102-1/105.5.
HCC cell enrichment in PBMC and
detection by immunocytochemistry and H&E staining
A total of 19 PBMC samples that tested positive for
CTA and PLAC1 cDNAs by RT-qPCR were randomly selected for tumor
cell enrichment through the depletion of leukocytes by MACS.
H&E staining and immunocytochemistry with an anti-cytokeratin
antibody were used to detect HCC cells. A total of 12/19 (63.2%)
samples exhibited intact tumor cells (Fig. 3), of which HCC cells were
identified using both techniques (10/12 samples) or were only
detected using one of the two techniques (2/12 samples). By
contrast, HCC cells were not observed by either technique in PBMC
samples from patients with cirrhosis or normal individuals.
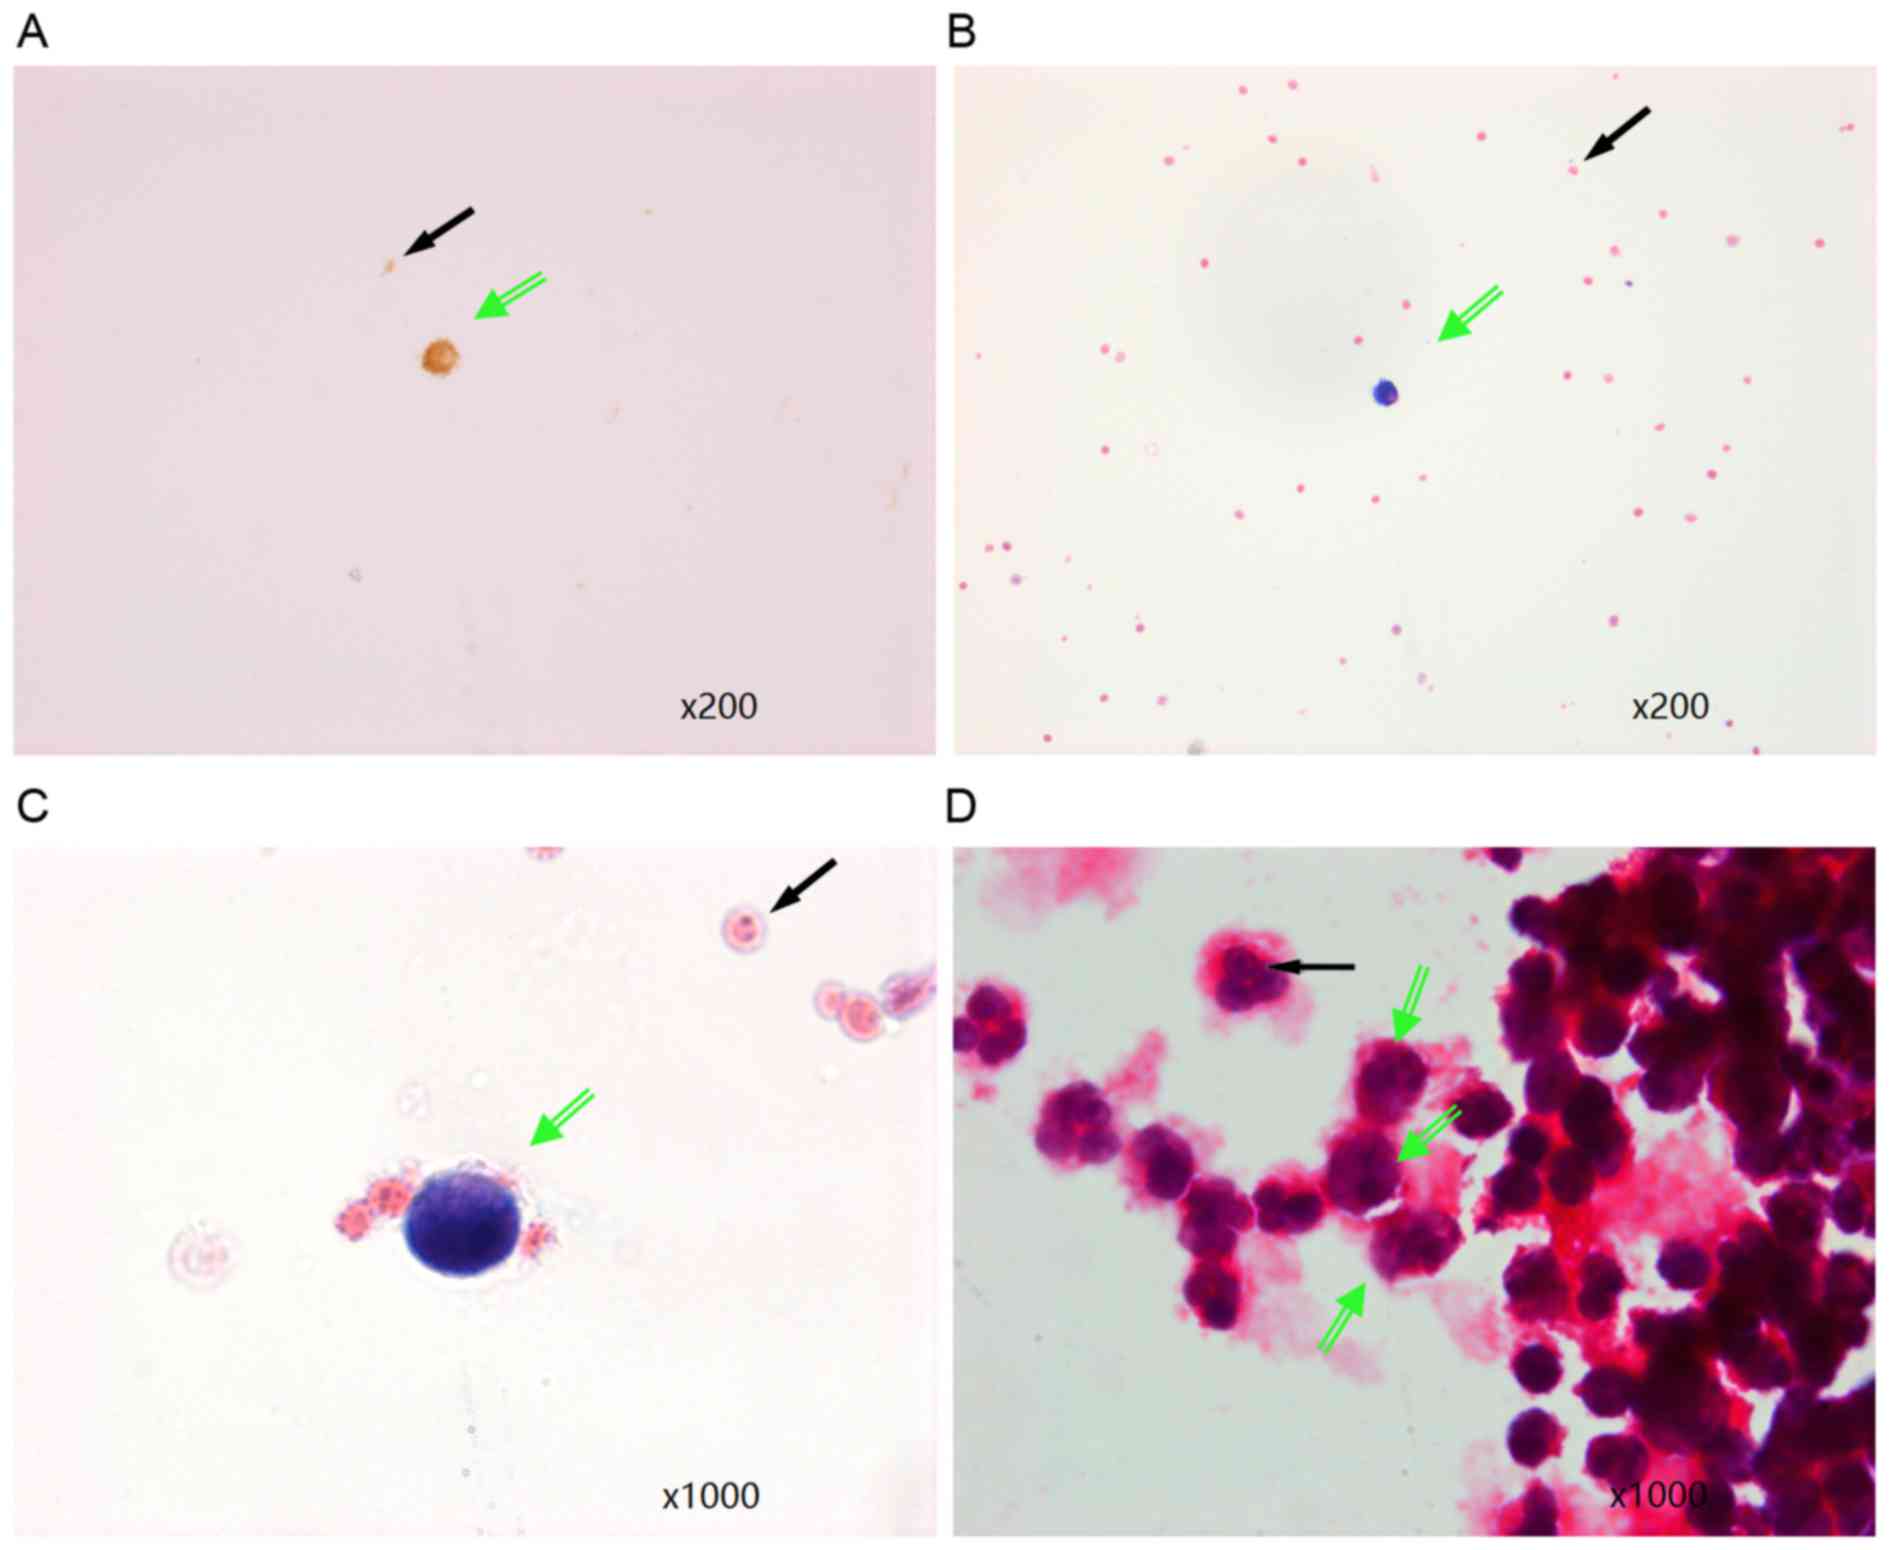 | Figure 3.Visualization of HCC cells in
peripheral blood samples enriched for HCC cells by
magnetic-activated cell sorting. (A) Immunocytochemistry staining
of a cytokeratin-positive tumor cell (green arrow) and leukocytes
(black arrow) in peripheral blood from a patient with HCC.
Magnification, ×200. H&E staining at magnifications of (B) ×200
and (C) ×1,000 demonstrating tumor cells characterized by large,
dark blue and heterogeneously stained nuclei with scant cytoplasm
around the nuclei (green arrow). The sizes of the nuclei are
approximately five times greater than those of leukocytes (black
arrow). (D) H&E staining demonstrating that HCC tumor cells
(green arrows), characterized by large, heterogeneously stained
nuclei, are clearly different from other leukocytes (black arrow).
Magnification, ×1,000. H&E, hematoxylin and eosin; HCC,
hepatocellular carcinoma. |
Discussion
CTCs contribute to recurrence and metastasis and are
often an indication of advanced stage cancer and poor prognosis
(15). Recent reports (10,12)
have demonstrated that by examining CTA expression levels, CTCs may
be detected in the blood with greater specificity compared with
traditional techniques, such as AFP evaluation, RT-PCR or
nested-primer RT-PCR. To determine whether RT-qPCR was able to
detect CTCs in patients with HCC with greater sensitivity and
specificity than standard RT-PCR, the present study evaluated the
expression levels of 10 CTC marker cDNAs (nine CTAs and PLAC1) by
RT-qPCR in blood samples collected from 51 preoperative patients
with HCC. In addition, anti-CD45 antibody coated immunomagnetic
beads were used to enrich PBMC samples for tumor cells to establish
the potential value of this technique for prognostic evaluation of
patients with HCC.
Results from the present study revealed that RT-qPCR
of CTA cDNAs was able to detect 10 tumor cells per 107
PBMCs, demonstrating that this technique was ~100X more sensitive
than standard RT-PCR for the detection of CTCs. Of the 10 tested
tumor markers, MAGEA3, SSX1, MAGEA1, NY-ESO-1, PLAC1 and LAGE1
cDNAs had positive detection rates >10%; the overall positive
detection rate was 70.6%. However, the expression levels of these
six cDNAs varied among the 51 patients with HCC that were examined;
most patients tested positive for only 1–3 of the 10 CTC marker
cDNAs. In contrast, all patients with cirrhosis and healthy
individuals that were examined tested negative for the 10
cDNAs.
Enrichment of tumor cells by MACS, combined with
H&E staining and morphological assessment, additionally emerged
as a potential method for detecting CTCs in patients with HCC;
positive identification of intact tumor cells was achieved in 63.2%
(12/19) of patients that had been identified as positive by
RT-qPCR. This result suggested that the two techniques may be
combined as a valuable prognostic tool; however, comparable studies
on alternative methods for identifying intact tumor cells in HCC
are limited.
In conclusion, the present study demonstrated that
the use of RT-qPCR to evaluate the expression rates of CTAs and
PLAC1 in PBMC samples may offer a highly sensitive and specific
technique to detect CTCs in the peripheral blood of patients with
HCC. Furthermore, the accuracy of this method may be enhanced by
MACS tumor cell enrichment.
Acknowledgements
The present study was supported by the Navigating
Plan of Research Fund of Beijing Ditan Hospital, Capital Medical
University (grant no. DTQH201405) and the Beijing Municipal
Administration of Hospitals Incubating Program (grant no.
PX2016043).
References
|
1
|
Parkin DM, Bray F, Ferlay J and Pisani P:
Global cancer statistics, 2002. CA Cancer J Clin. 55:74–108. 2005.
View Article : Google Scholar : PubMed/NCBI
|
|
2
|
Parkin DM: Global cancer statistics in the
year 2000. Lancet Oncol. 2:533–543. 2001. View Article : Google Scholar : PubMed/NCBI
|
|
3
|
Elshimali YI and Grody WW: The clinical
significance of circulating tumor cells in the peripheral blood.
Diagn Mol Pathol. 15:187–194. 2006. View Article : Google Scholar : PubMed/NCBI
|
|
4
|
Hosokawa M, Hayata T, Fukuda Y, Arakaki A,
Yoshino T, Tanaka T and Matsunaga T: Size-selective microcavity
array for rapid and efficient detection of circulating tumor cells.
Anal Chem. 82:6629–6635. 2010. View Article : Google Scholar : PubMed/NCBI
|
|
5
|
Samija I, Lukac J, Kusić Z, Situm M and
Samija M: Detection of disseminated melanoma cells by
reverse-transcription-polymerase chain reaction. Coll Antropol.
31:1187–1194. 2007.PubMed/NCBI
|
|
6
|
Schefe JH, Lehmann KE, Buschmann IR, Unger
T and Funke-Kaiser H: Quantitative real-time RT-PCR data analysis:
Current concepts and the novel ‘gene expression's CT difference’
formula. J Mol Med (Berl). 84:901–910. 2006. View Article : Google Scholar : PubMed/NCBI
|
|
7
|
Morimoto O, Nagano H, Miyamoto A, Fujiwara
Y, Kondo M, Yamamoto T, Ota H, Nakamura M, Wada H, Damdinsuren B,
et al: Association between recurrence of hepatocellular carcinoma
and alpha-fetoprotein messenger RNA levels in peripheral blood.
Surg Today. 35:1033–1041. 2005. View Article : Google Scholar : PubMed/NCBI
|
|
8
|
Yao F, Guo JM, Xu CF, Lou YL, Xiao BX,
Zhou WH, Chen J, Hu YR, Liu Z and Hong GF: Detecting AFP mRNA in
peripheral blood of the patients with hepatocellular carcinoma,
liver cirrhosis and hepatitis. Clin Chim Acta. 361:119–127. 2005.
View Article : Google Scholar : PubMed/NCBI
|
|
9
|
Lu Y, Wu LQ, Lü ZH, Wang XJ and Yang JY:
Expression of SSX-1 and NY-ESO-1 mRNA in tumor tissues and its
corresponding peripheral blood expression in patients with
hepatocellular carcinoma. Chin Med J (Engl). 120:1042–1046.
2007.PubMed/NCBI
|
|
10
|
Mou DC, Cai SL, Peng JR, Wang Y, Chen HS,
Pang XW, Leng XS and Chen WF: Evaluation of MAGE-1 and MAGE-3 as
tumour-specific markers to detect blood dissemination of
hepatocellular carcinoma cells. Br J Cancer. 86:110–116. 2002.
View Article : Google Scholar : PubMed/NCBI
|
|
11
|
Zendman AJ, Ruiter DJ and Van Muijen GN:
Cancer/testis-associated genes: Identification, expression profile,
and putative function. J Cell Physiol. 194:272–288. 2003.
View Article : Google Scholar : PubMed/NCBI
|
|
12
|
Peng JR, Chen HS, Mou DC, Cao J, Cong X,
Qin LL, Wei L, Leng XS, Wang Y and Chen WF: Expression of
cancer/testis (CT) antigens in Chinese hepatocellular carcinoma and
its correlation with clinical parameters. Cancer Lett. 219:223–232.
2005. View Article : Google Scholar : PubMed/NCBI
|
|
13
|
Koslowski M, Sahin U, Mitnacht-Kraus R,
Seitz G, Huber C and Türeci O: A placenta-specific gene ectopically
activated in many human cancers is essentially involved in
malignant cell processes. Cancer Res. 67:9528–9534. 2007.
View Article : Google Scholar : PubMed/NCBI
|
|
14
|
Bustin SA: Absolute quantification of mRNA
using real-time reverse transcription polymerase chain reaction
assays. J Mol Endocrinol. 25:169–193. 2000. View Article : Google Scholar : PubMed/NCBI
|
|
15
|
Walzer N and Kulik LM: Hepatocellular
carcinoma: Latest developments. Curr Opin Gastroenterol.
24:312–319. 2008. View Article : Google Scholar : PubMed/NCBI
|