Introduction
Hepatocellular carcinoma (HCC), also called
malignant hepatoma, often presents with several symptoms, including
bloating (resulting from fluid in the abdomen), loss of appetite,
easy bruising (owing to blood clotting abnormalities) and feeling
tired (1). The main causes of HCC
consist of cirrhosis, which is commonly induced by alcoholism and
viral hepatitis (2). In addition,
chronic hepatitis B/C infection may induce the immune system to
attack liver cells, further accelerating the development of HCC
(3). Liver transplantation is a
good option for patients with HCC; however, patients may wait for a
long period of time before a suitable donor is identified (4). The 5-year overall survival rate of
patients with HCC remains low, and the disease is difficult to
overcome (5). It is imperative to
investigate the molecular mechanisms of HCC to develop new methods
for the prevention and therapy of HCC.
An increasing number of studies on the genes, miRNAs
and the underlying molecular mechanisms of HCC have greatly
advanced understanding in this field. Tissue factor pathway
inhibitor 2 (TFPI2) has been revealed to be a crucial tumor
suppressor gene that regulates tumor growth and metastasis and is
silenced in HCC (6). In male
patients, a phenomenon has been identified that indicates that the
androgen pathway may be able to activate microRNA (miRNA) miR-216a
in a ligand-dependent manner; a process that may also be enhanced
by hepatitis B virus X protein (7). A previous study demonstrated that
paired box 5 is a functional tumor suppressor in HCC and activates
p53 and p21 signaling (8).
Although previous studies have provided important insights
concerning the molecular mechanisms of HCC, the understanding of
HCC is still lacking.
The present study aimed to explore the underlying
molecular mechanisms of the genes and miRNAs involved in HCC, to
advance our understanding of this process and to improve clinical
treatments. The RNA-sequencing (RNA-seq) data set GSE25599 was
downloaded from the Gene Expression Omnibus (GEO) database
(http://www.ncbi.nlm.nih.gov/geo) and
used for alignment analysis, followed by subsequent correlational
analysis, screening for differently expressed genes (DEGs) and
differentially expressed splicing variants, and cluster analysis of
the identified DEGs. In addition, gene ontology (GO) function and
Kyoto Encyclopedia of Genes and Genomes (KEGG) pathway-enrichment
analyses were conducted for the DEGs, followed by predictions of
transcription factor (TF) and miRNA target genes, and the
construction of a protein-protein interaction (PPI) network.
Materials and methods
Sequence data
RNA-seq data set GSE25599 was acquired from the GEO
database (9), and single-end
sequencing was performed using the GPL9052 Illumina Genome Analyzer
platform (Illumina, Inc., San Diego, CA, USA). Included in the
GSE25599 data set were the following two profiles: GSM629264 (3
runs: SRR074999, SRR075000 and SRR075001) and GSM629265 (3 runs:
SRR075002, SRR07500 and SRR075004), which were derived from HCC
tissue and adjacent non-cancerous tissue, respectively.
Quality evaluation of sequencing
data
The quality of the sequencing data was determined
using statistical approaches, as described below, to analyze base
distribution and quality fluctuation of each circle of sequencing
reads.
Detection of base quality
The Phred Quality (Q) scores are related to
sequencing error rate and are also affected by various other
factors, including sequencer type, sequencing reagents and samples.
Q scores were calculated using the formula: Q=−10log2E,
where, E is the sequencing error rate.
Detection of guanine-cytosine (GC)
content distribution
RNA-seq analysis was conducted following the
principle of random fragmentation (10). To ensure that the sequencing depth
was relatively homogeneous, the GC content should be equivalent for
each sequencing cycle.
Filtering of sequencing data
Analytical accuracy was improved by filtering the
‘dirty’ raw reads with the following steps: i) Remove adaptor
sequences from reads; ii) remove reads with >20% ‘N’ bases
(where N is any base A, T, C or G); ii) remove low-quality reads;
that is, whole reads with Q-score ≤20 in which >50% of bases are
N. By using this method, clean reads were obtained and used for
subsequent analyses.
Sequence alignment
TopHat version 2.0.11 (http://ccb.jhu.edu/software/tophat/index.shtml) was
used to align clean reads to the human reference genome assembly
GRCh37 release 66 (Homo_sapiens.GRCh37.66), which was obtained from
the Ensembl Genome Browser database (ENSG00000169857; http://www.ensembl.org/index.html). TopHat
runtime parameters were set as follows:
‘-G’=Homo_sapiens.GRCh37.66.gtf;‘-segment-length’=20;‘-read-realign-edit-dist’=0
and ‘-no-coverage-search’. The remaining parameters were set to
default. Alignment to the reference genome was subsequently
performed to identify the origin of the sequence read.
Assessment of gene expression
Detection of gene expression levels
Gene expression values were analyzed by Cufflinks
software version 1.2.1 (http://cufflinks.cbcb.umd.edu). Based on the sequence
alignment results of among the different groups, the reads per
kilobase of transcript per million mapped reads (RPKM) value was
calculated to assess the expression quantity using the following
formula:
RPKM=total exon readsmapped reads
(millions) x exon length (kb)
Correlational analysis
The correlation of gene expression levels between
samples was calculated by Pearson's correlation coefficient (r).
The calculation of r between two variables, × and y, is defined as
the covariance of the two variables divided by the product of their
standard deviations (11):
r=∑i(xi–x¯)(yi–y¯)∑i(xi–x¯)2∑i(yi–y¯)2
If r was close to 1, it indicated that the
expression pattern between the two samples exhibited high
similarity.
Screening of DEGs
The Cuffdiff program was used to calculate gene
expression values and to further estimate the alternatively spliced
transcripts of the fragment based on its length. DEGs were screened
in HCC tissues compared with adjacent non-cancerous tissues using
the following thresholds: |log2(FC)| >1, where FC is
fold change; P-value <0.01; q-value (an adjusted P-value)
<0.01, and fragments per kilobase of transcript per million
mapped reads (FPKM) >4; in addition, DEGs identified from
repetitive sequences were removed.
Screening of differentially expressed splicing
variants
As with the aforementioned screening of DEGS,
differentially expressed splicing variants were screened using
Cuffdiff with the thresholds of P-value <0.05 and q-value
<0.05.
Cluster analysis of DEGs
Distance calculations were applied for cluster
analysis of DEGs using the ‘hcluster’ algorithm, as previously
described (12). Relationships
between samples and genes were evaluated by Spearman's and
Pearson's correlation coefficient analyses.
GO and KEGG pathway enrichment analysis
The Database for Annotation, Visualization and
Integrated Discovery (DAVID version 6.7; http://david.ncifcrf.gov) is an online bioinformatics
tool used to extract biological meaning from a large number of
genes (13). DAVID was used to
analyze GO function and KEGG pathway enrichment of the screened
DEGs. The Benjamini-Hochberg multiple testing procedure, which
controls for false discovery rate, was applied for the correction
of P-values. On the basis of the hypergeometric distribution
principle, GO and KEGG terms that have P-value <0.05 and q-value
<0.05 were considered to indicate a statistically significant
difference.
Prediction of target genes of TFs and miRNAs
The screened DEGs were mapped to gene sets in the
Molecular Signatures Database (version 3.1, http://www.broadinstitute.org/gsea/msigdb/index.jsp)
using the online software tool WebGestalt version 2.0 (http://webgestalt.org). TFs and miRNAs regulating DEGs
were obtained with the hypergeometric statistical method (14). The identified TFs and miRNAs, and
their target genes were used to construct a miRNA-target gene
network and a TF-target gene network, which were visualized with
the open-source Cytoscape software (version 2.8.3, http://www.cytoscape.org).
PPI network analysis
Interaction relationships among DEGs were obtained
by mapping DEGs using the BioGRID (version 3.2.115) protein network
database plugin to construct a PPI network that was visualized with
Cytoscape. The PPI network comprises nodes, which represent a
protein, and links, which represent each pairwise protein
interaction. The degree of a node corresponds to the number of
interactions a protein has, and a node with a high degree was
defined as a ‘hub node’ in the network. TFs and miRNAs that
regulated a hub node were further predicted, and used to construct
a regulatory network of the hub node.
Results
Quality evaluation of sequencing
data
Calculation of the Q scores revealed that the
quality of the sequencing data met the standards for further
analysis. In addition, the GC content distribution was homogeneous,
and the N-base content was within an acceptable range. Table I indicates that the sequencing data
was well filtered for further research.
 | Table I.Quality evaluation chart for
sequencing data. |
Table I.
Quality evaluation chart for
sequencing data.
| Sample | Raw
readsa | Clean
readsb | Clean
basesc | sQ20
(%)d | GC (%)e | Duplication
(%)f |
|---|
| SRR074999 | 21,944,622 | 14,292,579 | 571M | 94.87 | 45.31 | 40.13 |
| SRR075000 | 21,328,051 | 13,254,517 | 530M | 94.04 | 45.53 | 38.28 |
| SRR075001 | 21,532,717 | 13,304,142 | 532M | 93.95 | 45.46 | 38.98 |
| SRR075002 | 20,950,756 | 13,615,048 | 544M | 94.81 | 45.36 | 45.40 |
| SRR075003 | 21,959,501 | 13,835,204 | 553M | 94.17 | 45.37 | 45.11 |
| SRR075004 | 22,011,164 | 13,372,744 | 534M | 93.80 | 45.01 | 42.09 |
Alignment analysis
Sequencing reads mapped into different regions of
the human reference genome GRCh37.66. Most of sequencing reads
mapped into coding sequence exons (CDS_exons), whereas other reads
mapped into different regions, such as 3′ untranslated region
(3′UTR_Exons), 5′UTR_Exons and Introns. However, few novel splicing
sites were obtained in the present study, which may be due to
limited sequencing length.
Analysis of gene expression level
A favorable repetition in the duplicates was
observed (repeatability, R2>0.94), whereas in
different groups the R2 values were much lower
(R2<0.9). Top 10 DEGs between HCC and adjacent
non-cancerous tissues were screened (Table II). Upregulated DEGs with high FC
values included: α-fetoprotein, thrombospondin 4, neurotensin,
preferentially expressed antigen in melanoma and sulfotransferase
family 1C member 2. Downregulated DEGs with high FC values
included: C-type lectin domain family 4 member M, alcohol
dehydrogenase 4, 4-hydroxyphenylpyruvic acid dioxygenase and
synaptotagmin 9. Genes with differentially expressed splicing
variants were also screened (Table
III) and included vesicle-associated membrane protein 4
(VAMP4), phosphatidylinositol glycan anchor biosynthesis class C,
protein disulfide isomerase family A member 4 and growth arrest
specific 5.
| Table II.Top 10 genes list - differentially
expressed genes. |
Table II.
Top 10 genes list - differentially
expressed genes.
| Gene | Locus | Control | Case |
Log2(FC) | Regulation |
|---|
| AFP |
4:74296854–74321891 | 10.953 | 6573.840 | 9.230 | Up |
| THBS4 |
5:79287133–79379477 | 0.177 | 77.892 | 8.780 | Up |
| NTS |
12:86268072–86276767 | 0.866 | 315.600 | 8.509 | Up |
| PRAME |
22:22890122–2290900 | 0.0255 | 4.051 | 7.311 | Up |
| SULT1C2 |
2:108905094–108926371 | 0.465 | 69.951 | 7.234 | Up |
| PEG10 |
7:94285636–94299007 | 1.427 | 213.887 | 7.227 | Up |
| NQO1 |
16:69740898–69760854 | 1.418 | 206.101 | 7.183 | Up |
| AGR2 |
7:16831434–16873057 | 0.997 | 113.695 | 6.834 | Up |
| GPC3 |
X:132669772–133119922 | 5.825 | 566.919 | 6.605 | Up |
| NLRP1 |
17:5402747–5487832 | 3.232 | 289.985 | 6.488 | Up |
| CLEC4M |
19:7804878–7834490 | 271.072 | 1.483 | −7.514 | Down |
| ADH4 |
4:100010007–100274184 | 612.703 | 3.122 | −7.617 | Down |
| HPD |
12:122277432–122326517 | 833.459 | 4.560 | −7.514 | Down |
| RP11-7M8.2.1 |
12:122277432–122326517 | 186.722 | 1.029 | −7.503 | Down |
| SYT9 |
11:7260098–7490273 | 4.716 | 0.027 | −7.450 | Down |
| CYP2E1 |
10:135192694–135383462 | 4030.920 | 22.780 | −7.467 | Down |
|
CTD-2195M18.1.1 |
5:6582248–6588612 | 27.817 | 0.159 | −7.455 | Down |
| CPS1 |
2:211342405–211543831 | 2827.010 | 17.092 | −7.367 | Down |
| GLYAT |
11:58476536–58499447 | 150.288 | 0.955 | −7.298 | Down |
| HSD11B1 |
1:209834708–209908295 | 520.703 | 3.393 | −7.262 | Down |
| Table III.Top 10 genes list - genes with
significant differentially expressed splicing variants. |
Table III.
Top 10 genes list - genes with
significant differentially expressed splicing variants.
| Gene | Locus | Sqrt (JS) | P-value | q-value | Significant |
|---|
| VAMP4 |
1:171669299–171711387 | 0.328 |
5.05×10⁻³ |
4.79×10⁻² | Yes |
| PIGC |
1:171810620–172437971 | 0.198 |
2.50×10⁻⁴ |
3.93×10⁻³ | Yes |
| PDIA4 |
7:148700153–148725733 | 0.833 |
5.00×10⁻⁵ |
9.03×10⁻⁴ | Yes |
| GAS5 |
1:173831289–173866494 | 0.244 |
5.00×10⁻⁵ |
9.03×10⁻⁴ | Yes |
| RARRES2 |
7:150035407–150038763 | 0.287 |
5.00×10⁻⁵ |
9.03×10⁻⁴ | Yes |
| ABCF2 |
7:150904922–150924316 | 0.160 |
1.00×10⁻⁴ |
1.72×10⁻³ | Yes |
| MRPS14 |
1:174968299–174992561 | 0.174 |
5.00×10⁻⁵ |
9.03×10⁻⁴ | Yes |
| SLC7A2 |
8:17354596–17428082 | 0.436 |
5.00×10⁻⁵ |
9.03×10⁻⁴ | Yes |
| INTS10 |
8:19674650–19709594 | 0.494 |
4.40×10⁻³ |
4.34×10⁻² | Yes |
GO and KEGG enrichment analysis
The screened DEGs were enriched in various GO terms:
Upregulated DEGs enriched in GO terms, including membrane-enclosed
lumen, organelle lumen and intracellular organelle lumen, whereas
downregulated DEGs enriched in GO terms, such as extracellular
region part, oxidation reduction and response to wounding (Table IV). In addition, KEGG pathway
enrichment analysis revealed that these upregulated DEGs also
enriched in cell cycle, DNA replication and glutathione metabolism
pathways, whereas the downregulated DEGs enriched in complement and
coagulation cascades, fatty acid metabolism and PPAR signaling
pathways (Table IV).
| Table IV.Top 5 significant GO terms. |
Table IV.
Top 5 significant GO terms.
| Category | GO ID | Term | Count | Ratio | P-value | q-value | Regulation |
|---|
| GOTERM_CC_FAT | GO:0031974 | Membrane-enclosed
lumen | 201 | 17.12 |
2.13×10⁻¹³ |
1.18×10⁻¹⁰ | Up |
| GOTERM_CC_FAT | GO:0043233 | Organelle
lumen | 197 | 16.78 |
4.37×10⁻¹³ |
1.21×10⁻¹⁰ | Up |
| GOTERM_CC_FAT | GO:0070013 | Intracellular
organelle lumen | 193 | 16.44 |
6.82×10⁻¹³ |
1.26×10⁻¹⁰ | Up |
| GOTERM_CC_FAT | GO:0005829 | Cytosol | 151 | 12.86 |
1.70×10⁻¹¹ |
2.35×10⁻⁹ | Up |
| GOTERM_CC_FAT | GO:0031981 | Nuclear lumen | 159 | 13.54 |
6.46×10⁻¹¹ |
7.13×10⁻⁹ | Up |
| GOTERM_CC_FAT | GO:0044421 | Extracellular
region part | 158 | 11.84 |
6.91×10⁻²¹ |
3.08×10⁻¹⁸ | Down |
| GOTERM_BP_FAT | GO:0055114 | Oxidation
reduction | 117 |
8.77 |
6.75×10⁻²⁰ |
2.36×10⁻¹⁶ | Down |
| GOTERM_BP_FAT | GO:0009611 | Response to
wounding | 102 |
7.65 |
6.01×10⁻¹⁹ |
1.05×10⁻¹⁵ | Down |
| GOTERM_CC_FAT | GO:0005615 | Extracellular
space | 120 |
9.00 |
5.67×10⁻¹⁸ |
1.26×10⁻¹⁵ | Down |
| GOTERM_CC_FAT | GO:0005576 | Extracellular
region | 251 | 18.82 |
3.79×10⁻¹⁶ |
4.95×10⁻¹⁴ | Down |
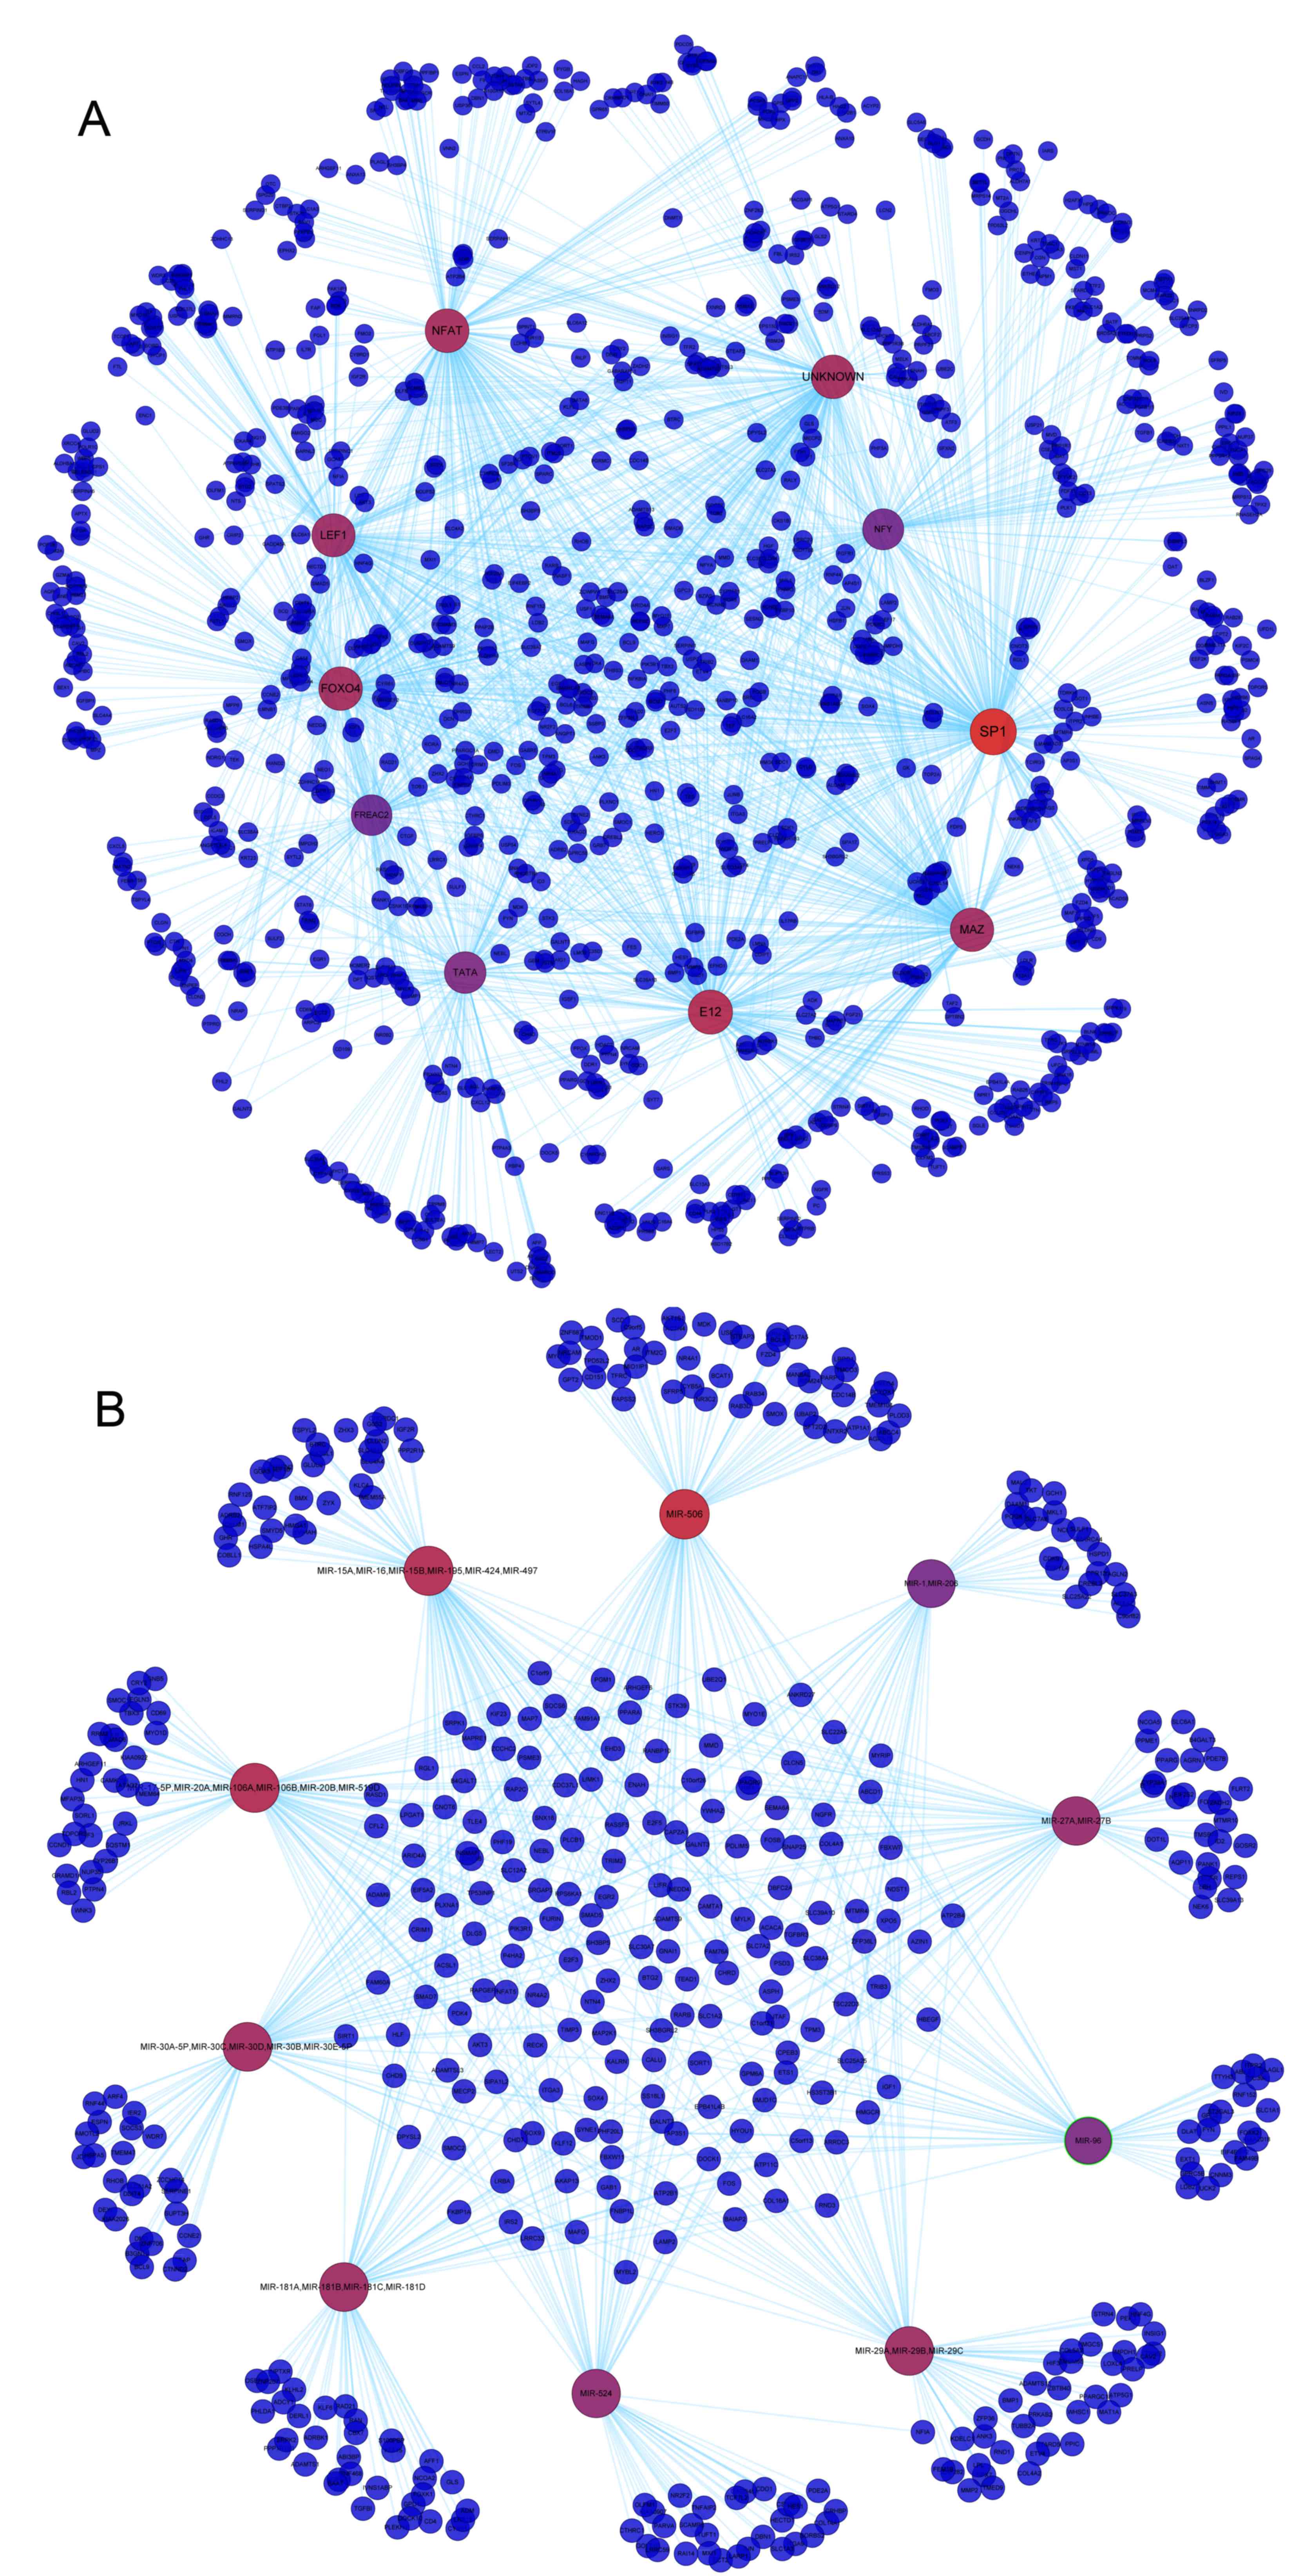
Prediction of TF and miRNA target
genes
The predicted TF-target gene network (Fig. 1A) demonstrated that TFs, including
specificity protein 1 (SP1), nuclear factor of activated T cells
and forkhead box, may be able to regulate large numbers of target
genes. For example, SP1 was revealed to target various genes,
including cingulin (CGN), reversion-inducing cysteine-rich protein
with Kazal motifs, protein kinase AMP-activated non-catalytic
subunit β2 and chromosome segregation 1-like. In the predicted
miRNA-target gene network (Fig.
1B), miRNAs, including miR-506, miR-17-5P and miR-15A, were
also demonstrated to regulate several target genes. For example,
target genes of miR-506 included CGN, ankyrin repeat domain 27 and
3′-phosphoadenosine 5′-phosphosulfate synthase 2.
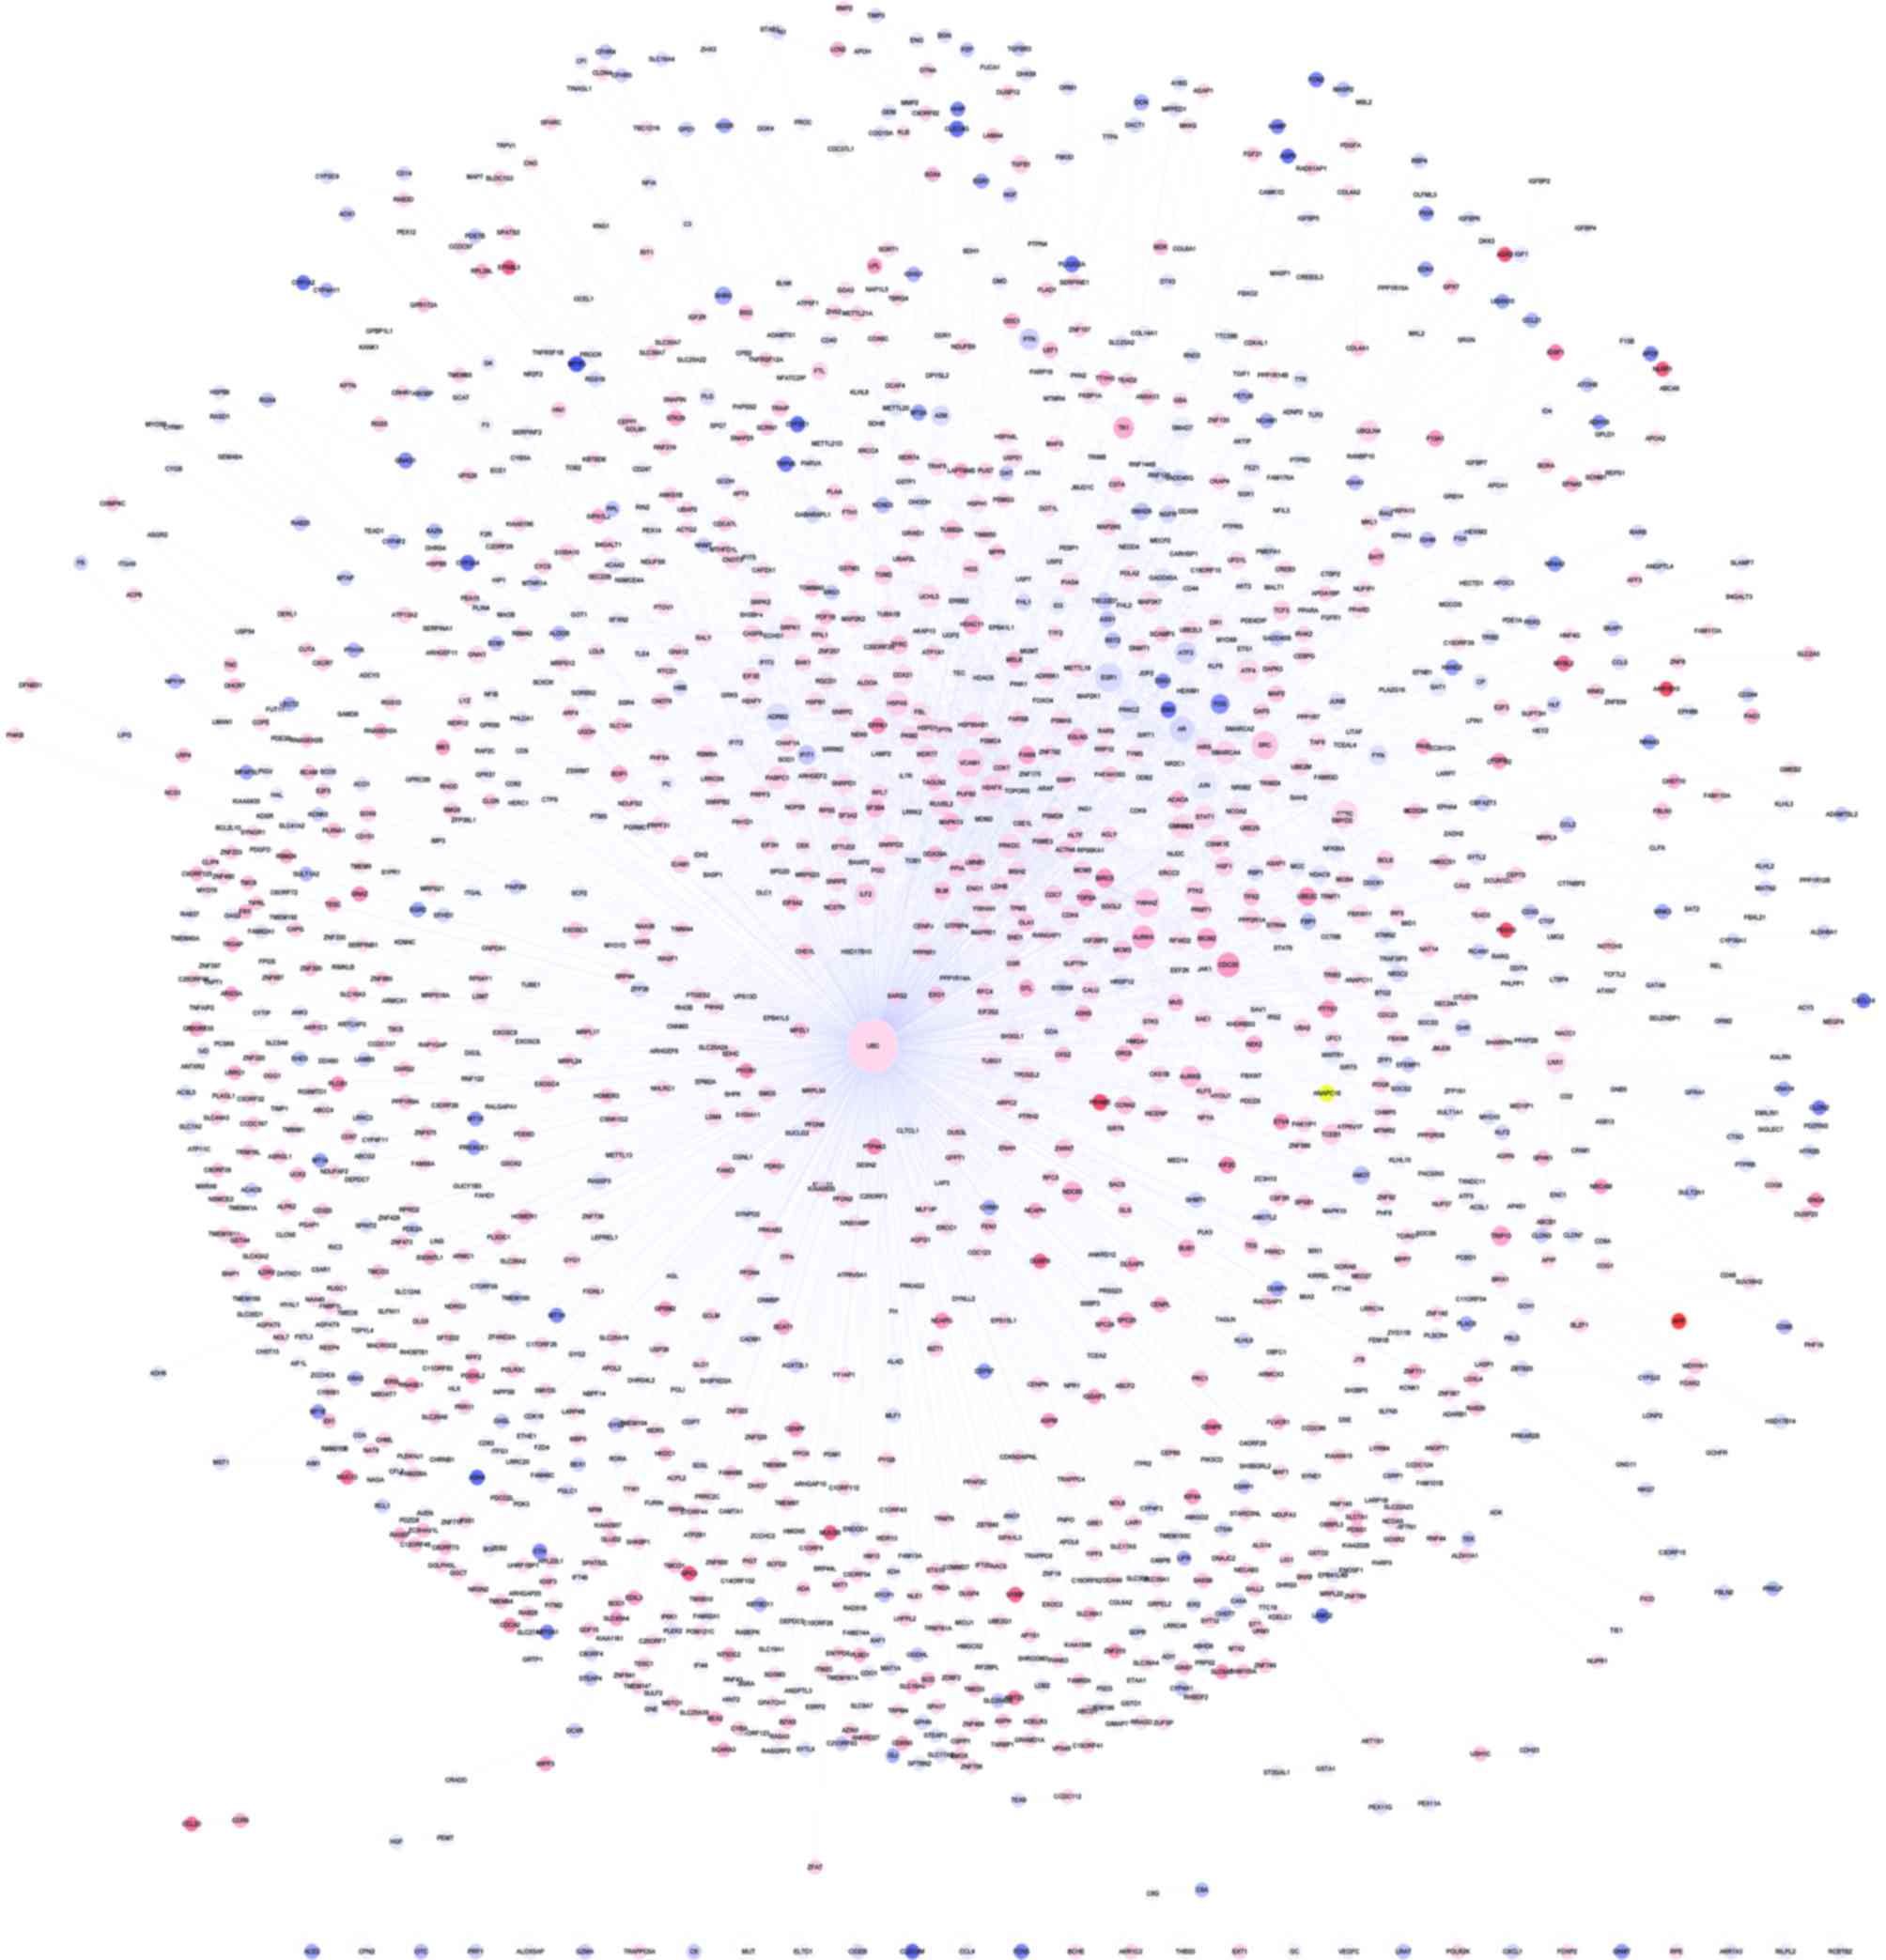
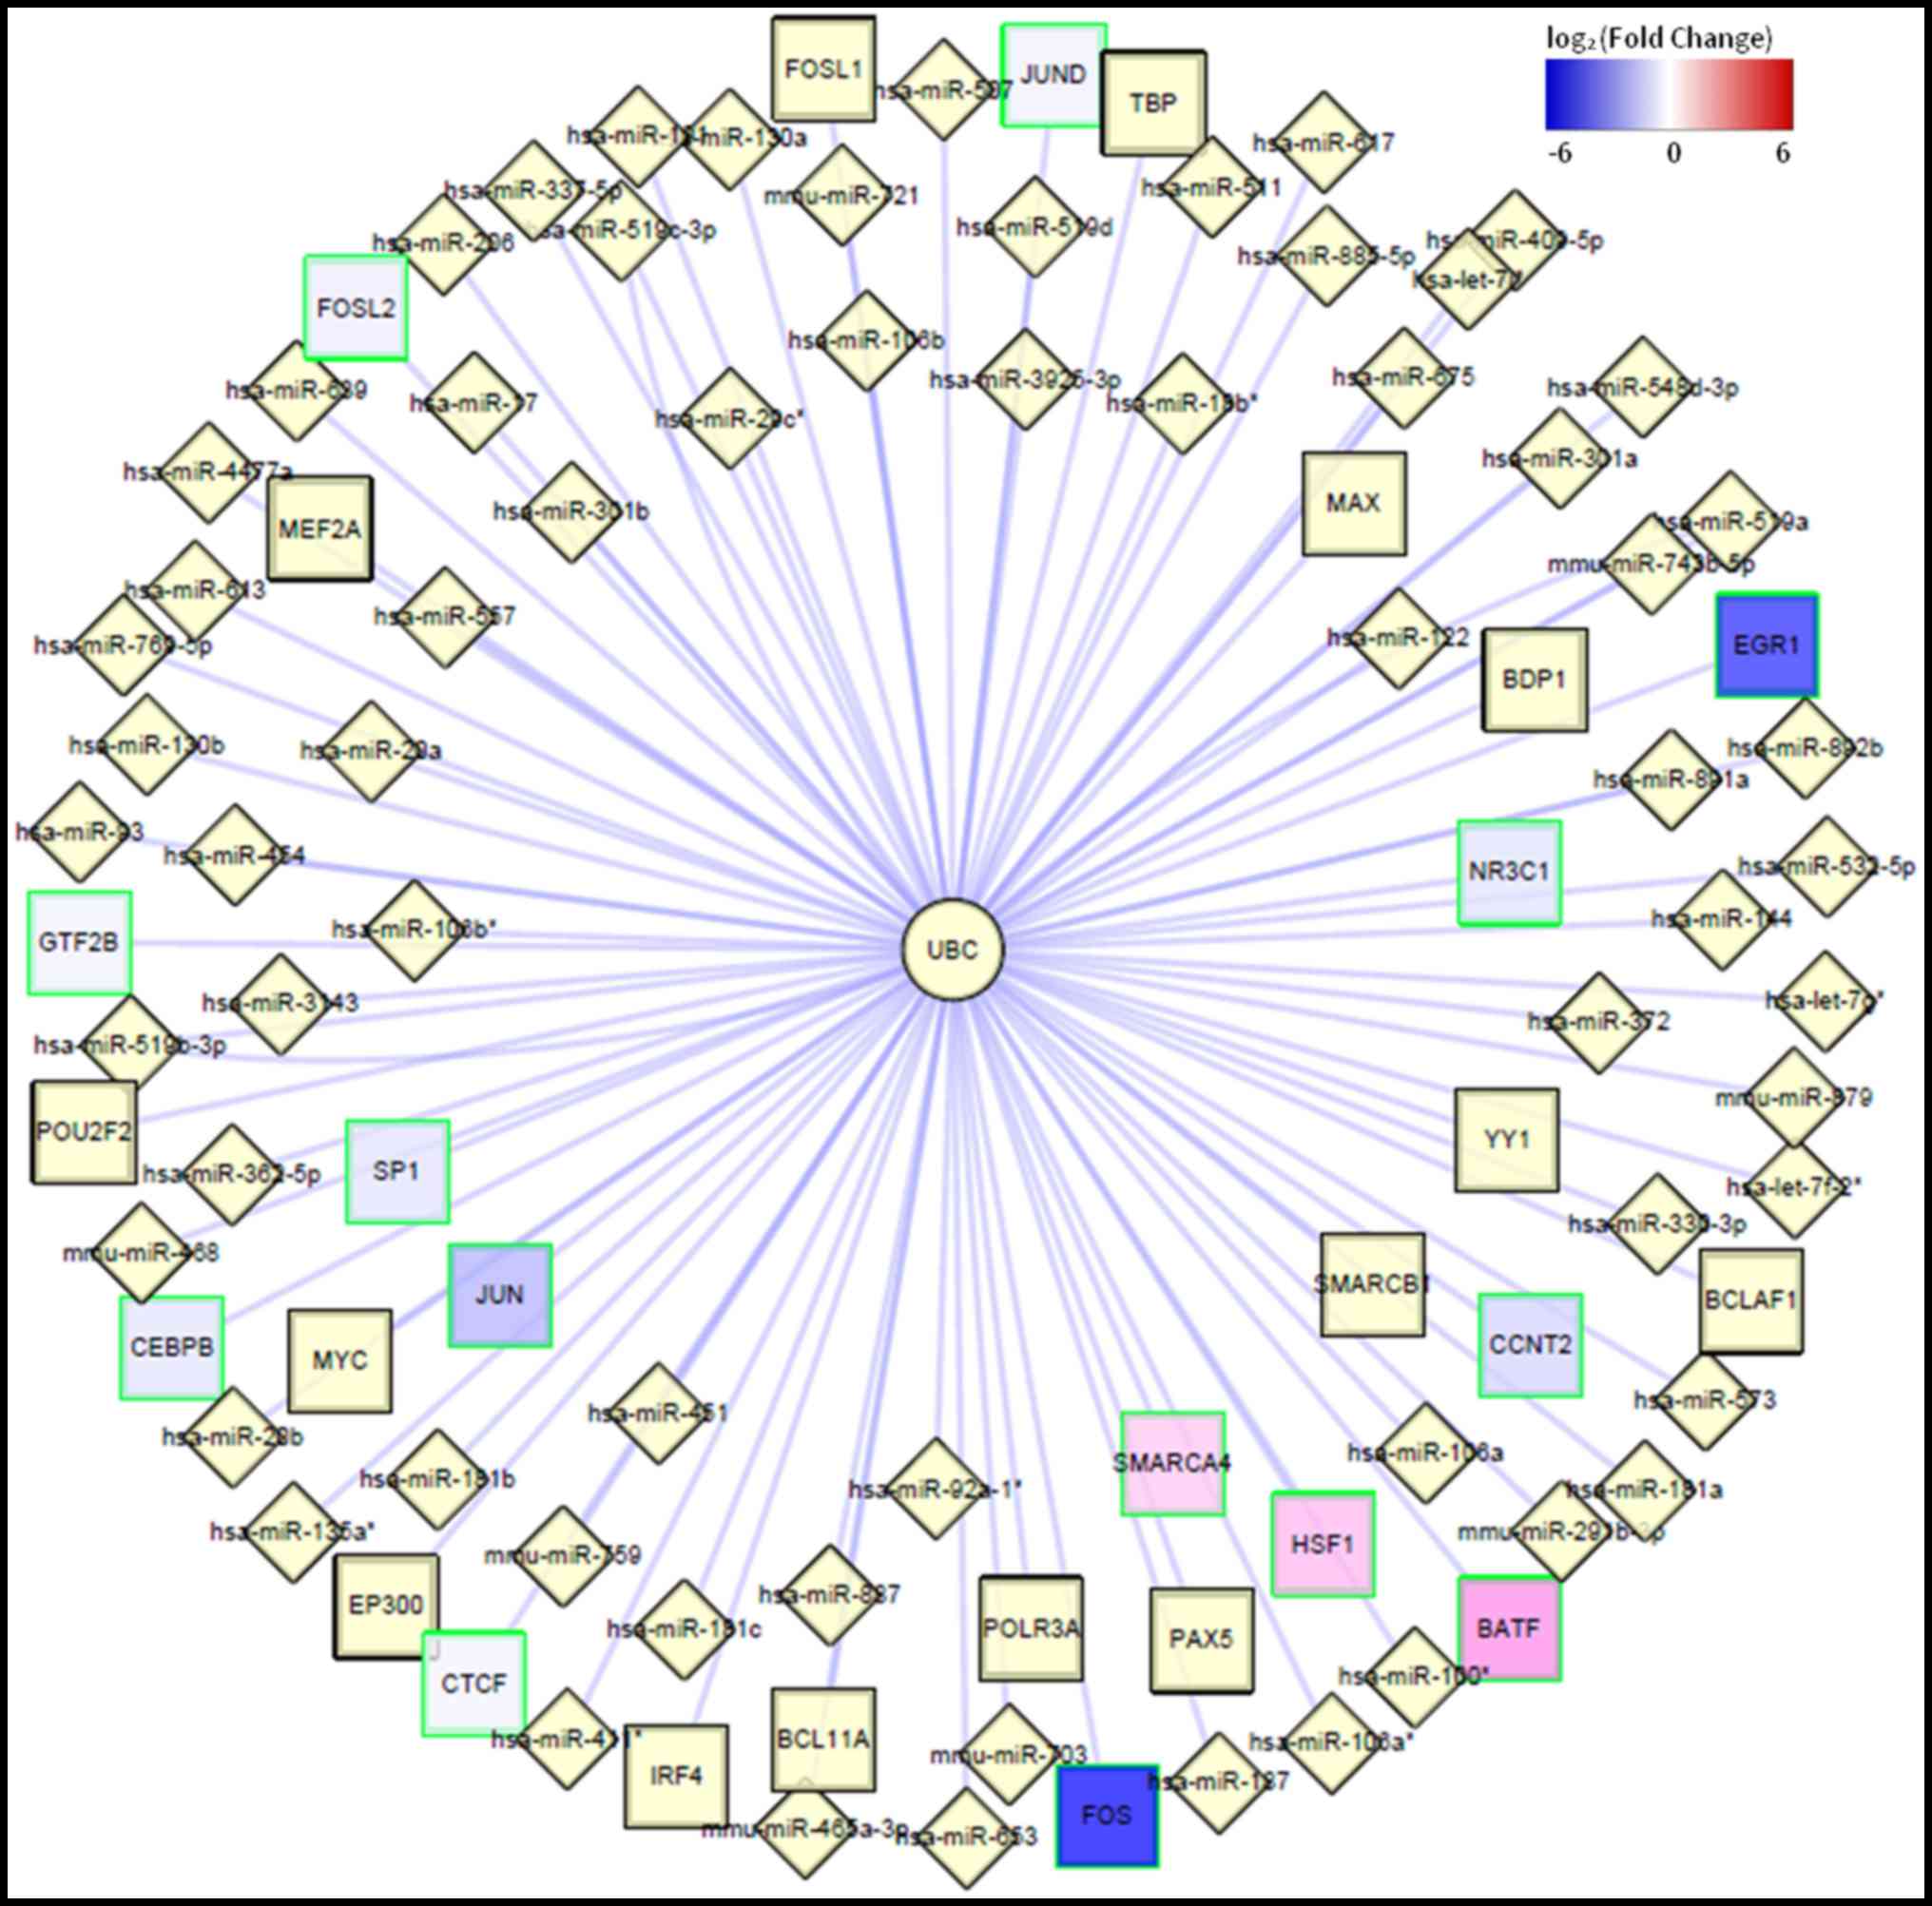
PPI network analysis
A PPI network was constructed for the identified
DEGs (Fig. 2), which placed
ubiquitin C (UBC) as the hub node with the highest degree
(degree=1,465). A regulatory network of the UBC gene was also
constructed (Fig. 3), which
predicted that UBC was regulated by a number of TFs that have also
been identified as DEGs, including SP1, proto-oncogene c-Jun (JUN),
FBJ murine osteosarcoma viral oncogene homolog (FOS), FOS-like
antigen 2 (FOSL2) and SWI/SNF related matrix-associated
actin-dependent regulator of chromatin, subfamily a member 4
(SMARCA4). A number of miRNAs were also predicted to regulate UBC
expression, including miR-30, miR-181 and miR-106a (Fig. 3).
Discussion
HCC is a highly prevalent and lethal disease, which
has proven to be difficult to treat (15). In the present study, the GSE25599
RNA-seq data set was downloaded from the GEO repository to
investigate the molecular mechanisms of HCC. RNA-seq reads mainly
mapped into CDS_Exons. Upregulated and downregulated DEGs between
HCC and adjacent non-cancerous tissues were screened. In addition,
several genes with significant differentially expressed splicing
variants, such as VAMP4, were obtained. The screened DEGs mainly
enriched in GO terms, such as membrane-enclosed lumen, organelle
lumen and extracellular region part, and KEGG pathways, such as
cell cycle and fatty acid metabolism pathways. Similarly, previous
studies have demonstrated that cell cycle and fatty acid metabolism
are closely associated with HCC pathogenesis (16–18).
Ubiquitination is associated with several biological
processes, including cell cycle regulation, DNA repair, protein
degradation and kinase modification (19). Ubiquitination of the disheveled
protein has previously been reported to serve an important role in
the development of several types of cancers, including liver cancer
(20–22). In the present study, UBC exhibited
the highest degree and was identified as the hub node of the
constructed PPI network and the regulatory network, which suggested
that UBC may serve an important role in HCC pathogenesis via
interactions with a large number of genes. It may be a crucial
target gene for HCC treatment. In addition, a previous study
demonstrated that during the regulatory progress,
ubiquitin-conjugating enzyme 9 (UBC9) is inhibited by miR-30
(23). Similarly, the present
study predicted UBC to be regulated by miR-30, suggesting that UBC
might be regulated by miR-30 in HCC.
The results from the present study suggested that
the role of UBC in HCC may be regulated by a number of TFs, such as
SP1, FOS, FOSL2, JUN and SMARCA4. SP1 has previously been
demonstrated to bind to the GC-rich motifs of many gene promoters
(24), including UBC. It has also
been reported to be involved in cell differentiation, cell growth
and apoptosis (25), and an
interaction between UBC and SP1 has been reported (26). FOS and FOSL2 are two members of FOS
gene family, which encode leucine zipper proteins that may be able
to dimerize with member proteins of the JUN family to form the
adaptor protein 1 (AP1) TF complex (27). AP1 has been demonstrated to
modulate liver cancer initiation (28). A previous study reported that the
expression of FOS is elevated in human hepatoma compared with
adjacent tissues (29), suggesting
that JUN, FOS and FOSL2 may be involved in the molecular mechanisms
of HCC pathogenesis. In addition, the present study predicted that
FOS and miR-181a regulated UBC in HCC. A previous study
demonstrated that miR-181a may repress the inflammatory response in
dendritic cells by targeting FOS (30); therefore, it has been inferred that
FOS and miR-181a may also affect HCC-related inflammatory response.
SMARCA4 is a member of the SWI/SNF family of chromatin-remodeling
complexes, which exhibit helicase and ATPase activity, and regulate
the transcription of several genes (31). SMARCA4 has been demonstrated to
regulate the expression of CD44 by binding to breast cancer 1, and
to promote cell proliferation though Notch-dependent proliferation
signals (32). It has also been
reported to be a tumor suppressor gene, and its loss promotes the
development of small cell carcinoma of the ovary (33); SMARCA4 mutations have been
identified in HCC (34). Results
of the present study suggested that downregulated FOSL and SMARCA4
expression may participate in the development of HCC.
In conclusion, UBC may serve a crucial role in HCC
pathogenesis, a role that may be regulated by SP1, FOS, JUN, FOSL2
and SMARCA4, which may be promising target genes for HCC treatment.
A number of miRNAs, including miR-30 and miR-181, may also
participate in the development of HCC; however, these results need
to be investigated through biochemical studies.
References
|
1
|
Butt Z, Mallick R, Mulcahy MF, Benson AB,
Cella D and Kaiser K: Pain and other symptoms in patients with
hepatocellular carcinoma (HCC): A qualitative analysis. J. Clin
Oncol. 2013.
|
|
2
|
Hashimoto E and Tokushige K: Prevalence,
gender, ethnic variations, and prognosis of NASH. J Gastroenterol.
46 Suppl 1:63–69. 2011. View Article : Google Scholar : PubMed/NCBI
|
|
3
|
Simonetti J, Bulkow L, McMahon BJ, Homan
C, Snowball M, Negus S, Williams J and Livingston SE: Clearance of
hepatitis B surface antigen and risk of hepatocellular carcinoma in
a cohort chronically infected with hepatitis B virus. Hepatology.
51:1531–1537. 2010. View Article : Google Scholar : PubMed/NCBI
|
|
4
|
Schwartz M, Roayaie S and Uva P: Treatment
of HCC in patients awaiting liver transplantation. Am J Transplant.
7:1875–1881. 2007. View Article : Google Scholar : PubMed/NCBI
|
|
5
|
Huang Q, Lin B, Liu H, Ma X, Mo F, Yu W,
Li L, Li H, Tian T, Wu D, et al: RNA-Seq analyses generate
comprehensive transcriptomic landscape and reveal complex
transcript patterns in hepatocellular carcinoma. PLoS One.
6:e261682011. View Article : Google Scholar : PubMed/NCBI
|
|
6
|
Wong CM, Ng YL, Lee JM, Wong CC, Cheung
OF, Chan CY, Tung EK, Ching YP and Ng IO: Tissue factor pathway
inhibitor-2 as a frequently silenced tumor suppressor gene in
hepatocellular carcinoma. Hepatology. 45:1129–1138. 2007.
View Article : Google Scholar : PubMed/NCBI
|
|
7
|
Chen PJ, Yeh SH, Liu WH, Lin CC, Huang HC,
Chen CL, Chen DS and Chen PJ: Androgen pathway stimulates
MicroRNA-216a transcription to suppress the tumor suppressor in
lung cancer-1 gene in early hepatocarcinogenesis. Hepatology.
56:632–643. 2012. View Article : Google Scholar : PubMed/NCBI
|
|
8
|
Liu W, Li X, Chu ES, Go MY, Xu L, Zhao G,
Li L, Dai N, Si J, Tao Q, et al: Paired box gene 5 is a novel tumor
suppressor in hepatocellular carcinoma through interaction with p53
signaling pathway. Hepatology. 53:843–853. 2011. View Article : Google Scholar : PubMed/NCBI
|
|
9
|
Barrett T, Wilhite SE, Ledoux P,
Evangelista C, Kim IF, Tomashevsky M, Marshall KA, Phillippy KH,
Sherman PM, Holko M, et al: NCBI GEO: Archive for functional
genomics data sets-update. Nucleic Acids Res. 41(Database Issue):
D991–D995. 2013. View Article : Google Scholar : PubMed/NCBI
|
|
10
|
Auer PL and Doerge RW: Statistical design
and analysis of RNA sequencing data. Genetics. 185:405–416. 2010.
View Article : Google Scholar : PubMed/NCBI
|
|
11
|
Lin LI: A concordance correlation
coefficient to evaluate reproducibility. Biometrics. 45:255–268.
1989. View
Article : Google Scholar : PubMed/NCBI
|
|
12
|
Hansen P and Delattre M: Complete-link
cluster analysis by graph coloring. J American Statistical
Association. 73:397–403. 1978. View Article : Google Scholar
|
|
13
|
da W Huang, Sherman BT and Lempicki RA:
Systematic and integrative analysis of large gene lists using DAVID
bioinformatics resources. Nat Protoc. 4:44–57. 2008. View Article : Google Scholar
|
|
14
|
Goldberg DS and Roth FP: Assessing
experimentally derived interactions in a small world. Proc Natl
Acad Sci USA. 100:4372–4376. 2003; View Article : Google Scholar : PubMed/NCBI
|
|
15
|
Lam VW, Laurence JM, Johnston E, Hollands
MJ, Pleass HC and Richardson AJ: A systematic review of two-stage
hepatectomy in patients with initially unresectable colorectal
liver metastases. HPB. 15:483–491. 2013. View Article : Google Scholar : PubMed/NCBI
|
|
16
|
Ockner RK, Kaikaus RM and Bass NM:
Fatty-acid metabolism and the pathogenesis of hepatocellular
carcinoma: Review and hypothesis. Hepatology. 18:669–676. 1993.
View Article : Google Scholar : PubMed/NCBI
|
|
17
|
Cheng J, Imanishi H, Amuro Y and Hada T:
NS-398, a selective cyclooxygenase 2 inhibitor, inhibited cell
growth and induced cell cycle arrest in human hepatocellular
carcinoma cell lines. Int J Cancer. 99:755–761. 2002. View Article : Google Scholar : PubMed/NCBI
|
|
18
|
Zhou L, Wang Q, Yin P, Xing W, Wu Z, Chen
S, Lu X, Zhang Y, Lin X and Xu G: Serum metabolomics reveals the
deregulation of fatty acids metabolism in hepatocellular carcinoma
and chronic liver diseases. Anal Bioanal Chem. 403:203–213. 2012.
View Article : Google Scholar : PubMed/NCBI
|
|
19
|
Hochstrasser M: Ubiquitin, proteasomes,
and the regulation of intracellular protein degradation. Curr Opin
Cell Biol. 7:215–223. 1995. View Article : Google Scholar : PubMed/NCBI
|
|
20
|
Chan DW, Chan CY, Yam JW, Ching YP and Ng
IO: Prickle-1 negatively regulates Wnt/beta-catenin pathway by
promoting Dishevelled ubiquitination/degradation in liver cancer.
Gastroenterology. 131:1218–1227. 2006. View Article : Google Scholar : PubMed/NCBI
|
|
21
|
Hoeller D, Hecker CM and Dikic I:
Ubiquitin and ubiquitin-like proteins in cancer pathogenesis. Nat
Rev Cancer. 6:776–788. 2006. View
Article : Google Scholar : PubMed/NCBI
|
|
22
|
Bertrand MJ, Milutinovic S, Dickson KM, Ho
WC, Boudreault A, Durkin J, Gillard JW, Jaquith JB, Morris SJ and
Barker PA: cIAP1 and cIAP2 facilitate cancer cell survival by
functioning as E3 ligases that promote RIP1 ubiquitination. Mol
Cell. 30:689–700. 2008. View Article : Google Scholar : PubMed/NCBI
|
|
23
|
Sureban SM, Qu D and Houchen CW:
Epigenetic Variations of Stem Cell Markers in CancerEpigenetics and
Cancer. Springer; pp. 115–128. 2013, View Article : Google Scholar
|
|
24
|
Magan N, Szremska AP, Isaacs RJ and
Stowell KM: Modulation of DNA topoisomerase II alpha promoter
activity by members of the Sp (specificity protein) and NF-Y
(nuclear factor Y) families of transcription factors. Biochem J.
374:723–729. 2003. View Article : Google Scholar : PubMed/NCBI
|
|
25
|
Marin M, Karis A, Visser P, Grosveld F and
Philipsen S: Transcription factor Sp1 is essential for early
embryonic development but dispensable for cell growth and
differentiation. Cell. 89:619–628. 1997. View Article : Google Scholar : PubMed/NCBI
|
|
26
|
Wang YT, Chuang JY, Shen MR, Yang WB,
Chang WC and Hung JJ: Sumoylation of specificity protein 1 augments
its degradation by changing the localization and increasing the
specificity protein 1 proteolytic process. J Mol Biol. 380:869–885.
2008. View Article : Google Scholar : PubMed/NCBI
|
|
27
|
Bossis G, Malnou CE, Farras R,
Andermarcher E, Hipskind R, Rodriguez M, Schmidt D, Muller S,
Jariel-Encontre I and Piechaczyk M: Down-regulation of c-Fos/c-Jun
AP-1 dimer activity by sumoylation. Mol Cell Biol. 25:6964–6979.
2005. View Article : Google Scholar : PubMed/NCBI
|
|
28
|
Min L, Ji Y, Bakiri L, Qiu Z, Cen J, Chen
X, Chen L, Scheuch H, Zheng H, Qin L, et al: Liver cancer
initiation is controlled by AP-1 through SIRT6-dependent inhibition
of survivin. Nat Cell Biol. 14:1203–1211. 2012. View Article : Google Scholar : PubMed/NCBI
|
|
29
|
Wang Z, Xiang Q, Li D and Li S:
Correlation between gene expression and chromatin conformation of
c-fos and N-ras in human liver and hepatoma. Chin Med Sci J. 6:6–8.
1991.PubMed/NCBI
|
|
30
|
Wu C, Gong Y, Yuan J, Zhang W, Zhao G, Li
H, Sun A, Kai Hu, Zou Y and Ge J: microRNA-181a represses
ox-LDL-stimulated inflammatory response in dendritic cell by
targeting c-Fos. J Lipid Res. 53:2355–2363. 2012. View Article : Google Scholar : PubMed/NCBI
|
|
31
|
Wilson BG and Roberts CW: SWI/SNF
nucleosome remodellers and cancer. Nat Rev Cancer. 11:481–492.
2011. View
Article : Google Scholar : PubMed/NCBI
|
|
32
|
Medina PP, Romero OA, Kohno T, Montuenga
LM, Pio R, Yokota J and Sanchez-Cespedes M: Frequent
BRG1/SMARCA4-inactivating mutations in human lung cancer cell
lines. Hum Mutat. 29:617–622. 2008. View Article : Google Scholar : PubMed/NCBI
|
|
33
|
Ramos P, Karnezis AN, Hendricks WP, Wang
Y, Tembe W, Zismann VL, Legendre C, Liang WS, Russell ML, Craig DW,
et al: Loss of the tumor suppressor SMARCA4 in small cell carcinoma
of the ovary, hypercalcemic type (SCCOHT). Rare Dis. 2:e9671482014.
View Article : Google Scholar : PubMed/NCBI
|
|
34
|
Guichard C, Amaddeo G, Imbeaud S, Ladeiro
Y, Pelletier L, Maad IB, Calderaro J, Bioulac-Sage P, Letexier M,
Degos F, et al: Integrated analysis of somatic mutations and focal
copy-number changes identifies key genes and pathways in
hepatocellular carcinoma. Nat Genet. 44:694–698. 2012. View Article : Google Scholar : PubMed/NCBI
|