Introduction
Prostate cancer (CaP), as the most common genital
neoplasm, holds the highest incidence among men in the majority of
western countries (1). CaP growth
is driven by androgens; therefore, the conventional treatment
option is to lower the levels of male sex hormones (2). Current treatment strategies for CaP
include surgery, external beam radiotherapy, brachytherapy,
chemotherapy and androgen-deprivation therapy (ADT) (2,3). ADT
often involves surgically removing the testicles or using drugs to
block the androgens from affecting the body (4). Unfortunately, ADT has a limited role
in preventing majority of patients progressing to
castration-resistant prostate cancer (CRPC) and patients with
metastatic prostate cancer progress to resistance of ADT (4,5).
However, previous studies have been unable to identity a mainstay
cancer therapy. Thus, the mortality of patients with CRPC continues
to be very high (6).
Previous studies have investigated novel molecular
therapeutic targets in CRPC and the influence that tumor metastasis
has on the biological processes. Activation of the androgen
receptor (AR) may stimulate tumor progression and proliferation in
prostate cancer (7), Koivisto
et al (8) determined that
the activity of cytochrome P450 (CYP) may increase AR gene
amplification and continuous production of testosterone; therefore,
the serum androgen levels following castration can still contribute
to prostate cancer cell growth and resistance. Seruga et al
(9) determined that there are
three core genes, including human epidermal growth factor receptor
2, transforming growth factor β (TGF-β) and the kinase of SRC
family that are able to activate AR transduction pathways without
androgen to stimulate. Chaux et al (10) suggested that the loss or mutation
of tensin homolog have been implicated in unlike properties of
aggressive prostate cancer, including increasing the risk of
biochemical relapse, reducing the time to metastasis and increasing
the death rate in high-risk cohorts of men. However, the molecular
mechanisms with oncogenes or tumor suppressors that modulate the
levels of critical proteins remain unclear and their relevance in
human disease and therapy require further investigation.
In order to provide novel mechanistic insights
associated with possible endogenous metastatic pathways in an
androgen-deprived environment, the present study used the data from
the gene expression profile available provided by Sun et al
(11) that used the microarray of
human prostate cancer xenograft model-LuCaP35 to analyze the gene
expression changes between 5 non-castrated and 5 castrated men. The
current study identified 201 upregulated differentially expressed
genes (DEGs) and 161 downregulated DEGs using a stricter threshold
of false discovery rate (FDR)<0.05 and |log2
fold-change (FC)|>1.5. The visual protein-to-protein interaction
(PPI) network was constructed using Cytoscape and the modules were
identified with the Mcode plugin. The present study used Gene
Ontology (GO) and Kyoto Encyclopedia of Genes and Genomes (KEGG)
pathway to analyze the potential interactions and functions of
DEGs. In conclusion, the present study identified key genes which
may have the potential to be biomarkers of tumorigenesis in
patients with CRPC.
Materials and methods
Microarray data
The transcription profile of GSE33316 was downloaded
from the National Center for Biotechnology Information Gene
Expression Omnibus (GEO) database (http://www.ncbi.nlm.nih.gov/geo/) (11). The data used a human prostate
cancer xenograft model-LuCaP35, included 5 controlled samples from
non-castrated men (GSM823844, GSM823848, GSM823849, GSM823850,
GSM823853) and 5 samples from castrated men (GSM823845, GSM823846,
GSM823847, GSM823851, GSM823852).
Differentially expressed gene
analysis
The series matrix file was downloaded and a
log2 transformation was performed. All sample data was
normalized using the limma package in R software version 3.3.0
(https://www.r-project.org/) (12). The DEGs were obtained with
thresholds of |logFC|>1.5 and P<0.05, using linear models and
empirical Bayes methods for assessing differential expression in
microarray experiments. Finally, a clustering analysis was
performed using the DEGs and a heatmap of different groups
including castrated and non-castrated was constructed (Fig. 1).
Construction of PPI network and module
analysis
In order to predict protein interactions, which
include physical and functional associations the present study used
the Search Tool for the Retrieval of Interacting Genes (STRING) to
construct the PPI network for DEGs (minimum required interaction
score >0.4) (13). In addition,
Cytoscape software version 3.4.0 (http://cytoscape.org/download_old_versions.html) was
used for visualization of the PPI networks. Following the
construction of the PPI network, a module analysis of the network
was performed using the Mcode plugin (degree cut-off ≥2 and the
nodes with edges ≥2-core) (14).
Additionally, the Network Analyzer was used to compute the basic
properties of the PPI network, including average clustering
coefficient distribution, closeness centrality, average
neighborhood connectivity, node degree distribution, shortest path
length distribution, and topological coefficients (15).
GO terms and KEGG pathway
analysis
KEGG pathways were investigated by KEGG Orthology
Based Annotation System 2.0 online biological tools (16). To analyze the function of DEGs a
gene ontology (GO) enrichment analysis was performed using Database
for Annotation, Visualization and Integrated Discovery method
(17), with a FDR<0.05 and
count >2 as threshold.
BiNGO, is a useful tool to determine which GO
categories are statistically overrepresented in a set of genes or a
subgraph of a biological network (18), the present study used the
visualization of the results of enriched GO terms and the output
the predominant functional themes of a given gene set in the GO
hierarchy. The findings are presented in a directed acyclic
graph.
Results
Identification of DEGs
Using microarray expression profiling from GEO
database, the present study identified the significant DEGs in
castrated samples compared with the non-castrated samples. There
were 161 downregulated DEGs and 201 upregulated DEGs, respectively
accounting for 44.48 and 55.52% of all DEGs (Fig. 1; Table
I). The upregulated genes were more numerous compared with the
downregulated genes. A heat map for the expression of the DEGs is
presented in Fig. 1. The results
of hierarchical clustering analysis indicated that the castrated
group and non-castrated group were separated by the clustering the
of the DEGs, which indicated that the sectionalization was
reasonable and the data may be directly used for further
analysis.
 | Table I.Top 10 upregulated and downregulated
genes. |
Table I.
Top 10 upregulated and downregulated
genes.
| A, Upregulated |
|---|
|
|---|
| Gene symbol | logFC | Adjusted P-value |
|---|
| F3 | 4.863582313 |
2.91×10⁻³ |
| HAGLROS | 4.847973534 |
9.32×10⁻⁶ |
| GIMAP7 | 4.839624566 |
4.72×10⁻³ |
| CEL | 4.793641494 |
5.79×10⁻⁴ |
| GPAT3 | 4.585119916 |
3.68×10⁻³ |
| FAM3D | 4.358475955 |
2.36×10⁻³ |
| PDGFRL | 3.929026478 |
1.09×10⁻³ |
| RGS2 | 3.899872367 |
3.01×10⁻³ |
| UPK3A | 3.868345004 |
5.79×10⁻⁴ |
| SI | 3.843651777 |
7.42×10⁻⁴ |
|
| B,
Downregulated |
|
| Gene symbol | logFC | Adjusted
P-value |
|
| MYBPC1 | −4.622857598 |
7.75×10⁻³ |
| LAMA1 | −4.215584491 |
1.45×10⁻³ |
| S100P | −4.16482084 |
9.77×10⁻³ |
| LEFTY1 | −4.151682649 |
8.22×10⁻³ |
| DEFB1 | −3.863896718 |
1.59×10⁻³ |
| LOX | −3.400271316 |
1.06×10⁻³ |
| DHRS2 | −3.381711553 |
2.59×10⁻³ |
| CCK | −3.328128227 |
1.53×10⁻³ |
| KRT19 | −3.323100902 |
6.53×10⁻³ |
| ANGPYL4 | −3.29177361 |
9.74×10⁻³ |
Construction of the PPI network using
STRING
The STRING database was used to predict the
interaction relationship between 362 DEGs (combined score >0.4).
There were 306 nodes and 767 interactions analyzed in the PPI
network. The top 30 hub genes are presented in Fig. 2, including amyloid β precursor
protein (APP), ERBB4, polo like kinase 1 (PLK1), protein kinase C α
(PRKCA), actin, alpha 2, smooth muscle, aorta and cyclin A2. The
visualization of the PPI network used Cytoscape and is shown in
Fig. 3.
Network module analysis
The topology parameter of the PPI network was based
on the following six properties: i) Average clustering coefficient
distribution; ii) closeness centrality; iii) neighborhood
connectivity distribution; iv) node degree distribution; v)
shortest path length distribution; and vi) topological coefficients
(Fig. 4). This analysis revealed
that the constructed network is stable and reliable. A total of 10
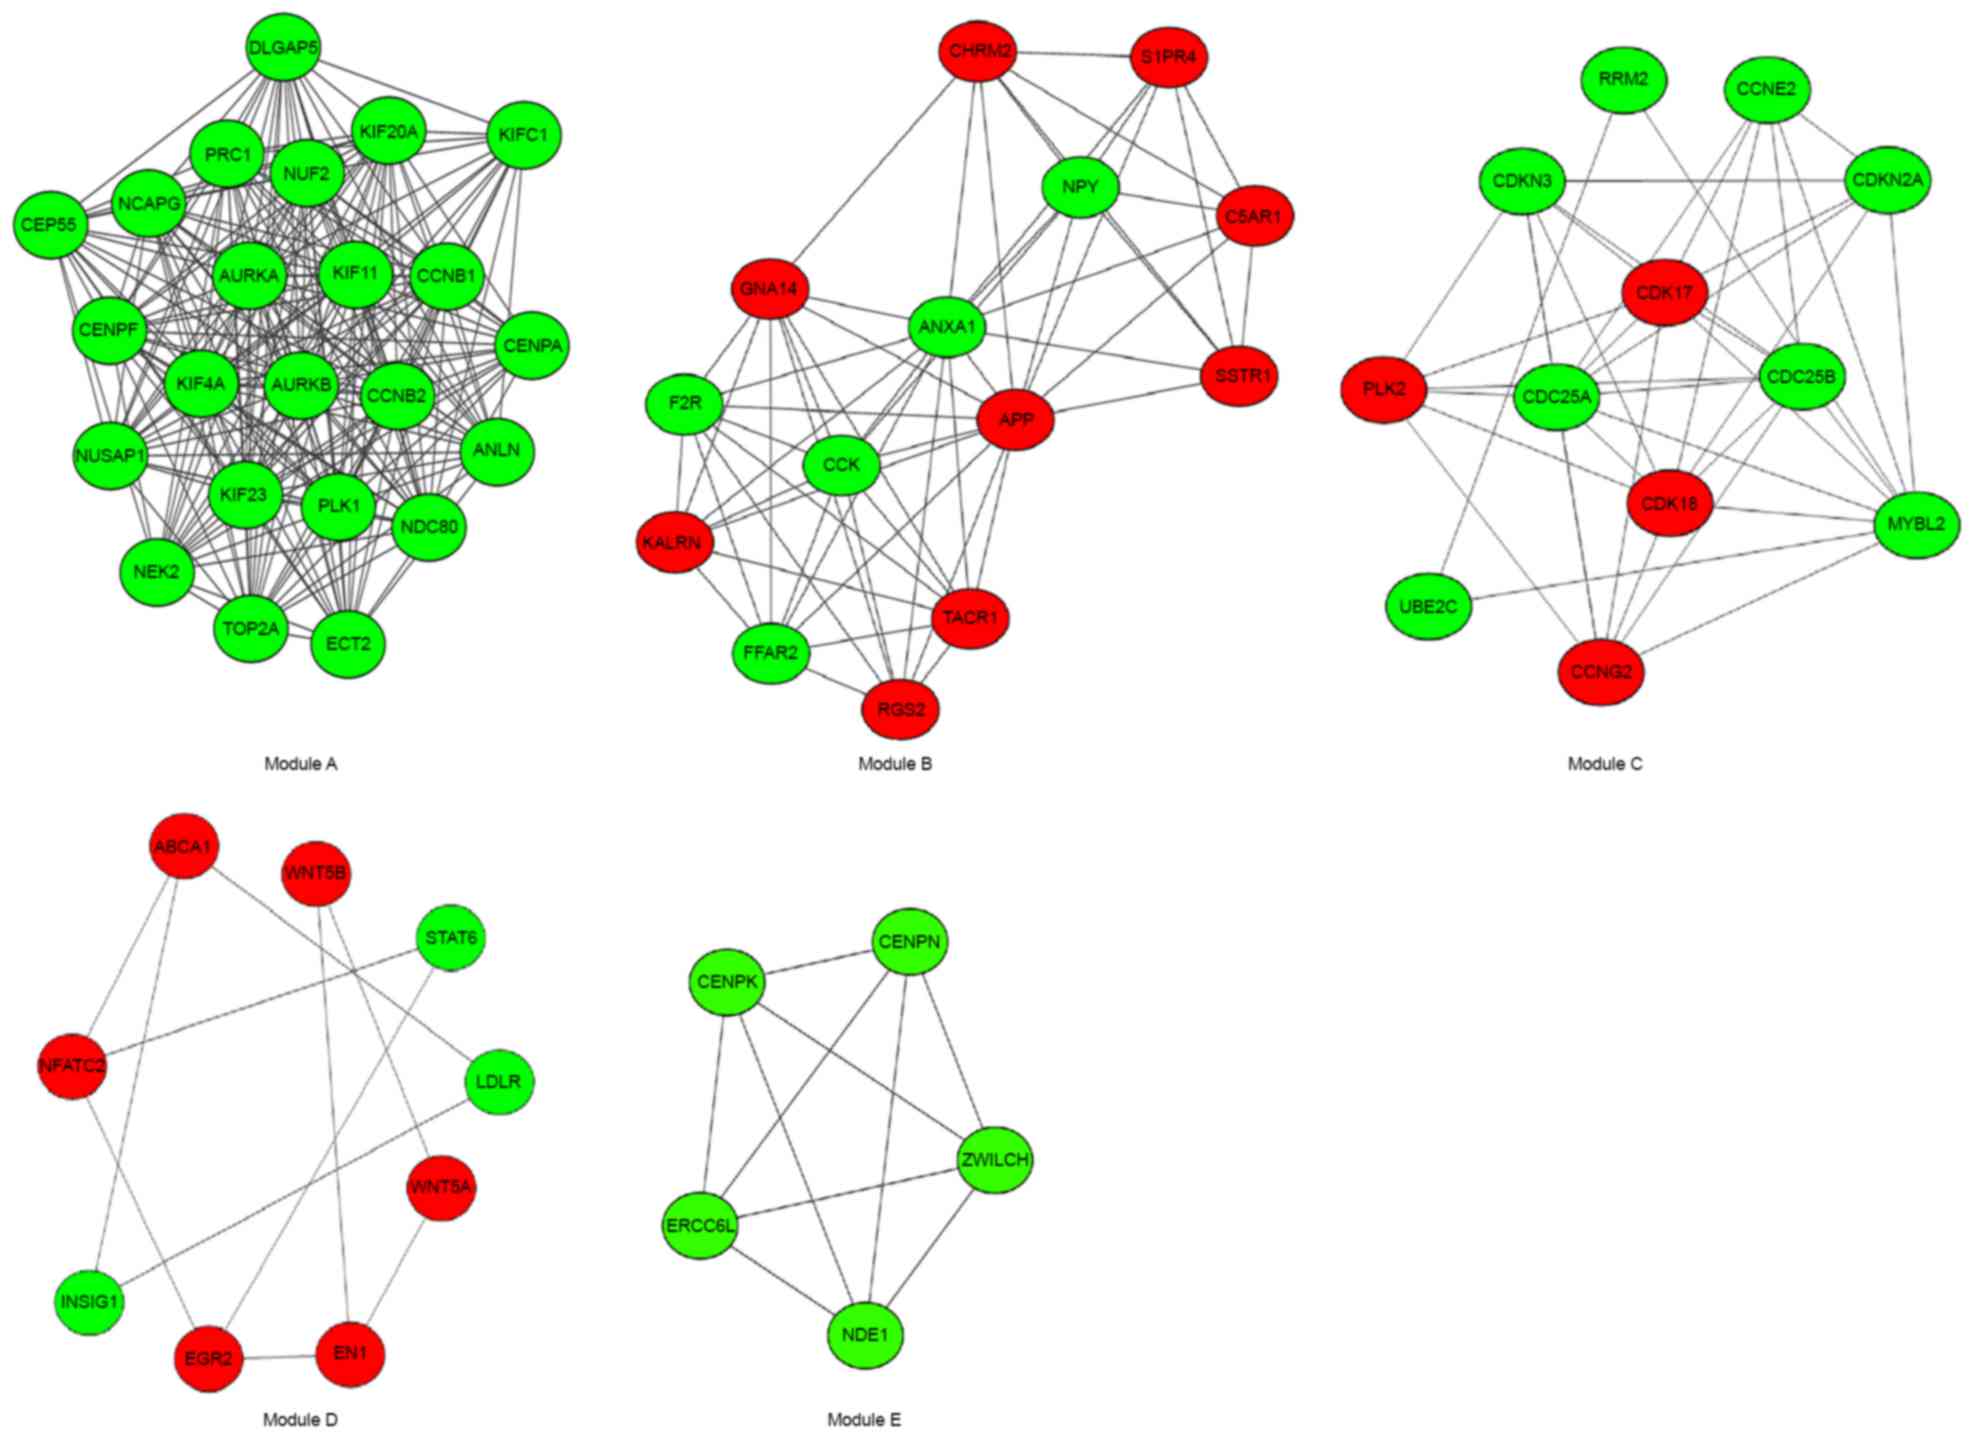
modules were identified in the PPI network and the top 5 modules
were investigated further (Fig.
5), which included 23, 14, 12, 9 and 5 genes (Table II). Additionally, the DEGs in the
top 5 modules were enriched in the significant pathways presented
in Table III. Module A had 23
nodes and 222 interactions. All the DEGs were downregulated in this
module. There were 5 enriched KEGG pathways in this module, which
involved cyclin B1 (CCNB1) and CCNB2, PLK1 and aurora kinase A
(AURKA).
| Table II.The modules of networks. |
Table II.
The modules of networks.
| Module name | Nodes | Edges | Cluster scores |
|---|
| A | 23 | 222 | 20.182 |
| B | 14 | 57 | 8.769 |
| C | 12 | 39 | 7.091 |
| D | 9 | 11 | 5.75 |
| E | 5 | 10 | 5.00 |
| Table III.KEGG pathways of the modules in the
present study. |
Table III.
KEGG pathways of the modules in the
present study.
| A, Module A |
|---|
|
|---|
| KEGG pathways | Genes | P-value |
|---|
| hsa04114: Oocyte
meiosis | CCNB2, CCNB1, PLK1,
AURKA |
1.59×10⁻⁶ |
| hsa04914:
Progesterone-mediated oocyte maturation | CCNB2, CCNB1,
PLK1 |
4.49×10⁻⁵ |
| hsa04110: Cell
cycle | CCNB2, CCNB1,
PLK1 |
8.87×10⁻⁵ |
| hsa04068: FoxO
signaling pathway | CCNB2, CCNB1,
PLK1 |
1.11×10⁻⁴ |
| hsa04115: p53
signaling pathway | CCNB2, CCNB1 |
1.10×10⁻³ |
|
| B, Module B |
|
| KEGG pathways | Genes | P-value |
|
| hsa04080:
Neuroactive ligand-receptor interaction | CHRM2, SSTR1, F2R,
TACR1, C5AR1, S1PR4 |
5.31×10⁻⁶ |
| hsa04024: cAMP
signaling pathway | CHRM2, SSTR1, NPY,
RGS2, FFAR2 |
1.70×10⁻⁵ |
| hsa04020: Calcium
signaling pathway | GNA14, CHRM2,
TACR1, F2R |
2.02×10⁻⁴ |
| hsa04610:
Complement and coagulation cascades | C5AR1, F2R |
7.29×10⁻³ |
| hsa04810:
Regulation of actin cytoskeleton | CHRM2, F2R |
4.61×10⁻³ |
| hsa04151: PI3K-Akt
signaling pathway | CHRM2, F2R |
1.03×10⁻² |
|
| C, Module C |
|
| KEGG pathways | Genes | P-value |
|
| hsa04115: p53
signaling pathway | RRM2, CCNG2,
CDKN2A, CCNE2 |
5.94×10⁻⁶ |
| hsa04110: Cell
cycle | CDC25B, CDKN2A,
CDC25A, CCNE2 |
5.46×10⁻⁵ |
| hsa05206: MicroRNAs
in cancer | CDC25B, CDKN2A,
CDC25A, CCNE2 |
1.44×10⁻³ |
| hsa04914:
Progesterone-mediated oocyte maturation | CDC25A, CDC25B |
1.14×10⁻² |
| hsa04068: FoxO
signaling pathway | PLK2, CCNG2 |
2.05×10⁻² |
| hsa05203: Viral
carcinogenesis | CDKN2A, CCNE2 |
4.42×10⁻² |
|
| D, Module D |
|
| KEGG pathways | Genes | P-value |
|
| hsa05166: HTLV-I
infection | EGR2, WNT5A, WNT5B,
NFATC2 |
1.11×10⁻³ |
| hsa04310: Wnt
signaling pathway | WNT5A, WNT5B,
NFATC2 |
2.08×10⁻³ |
| hsa05161: Hepatitis
B | EGR2, STAT6,
NFATC2 |
2.20×10⁻³ |
| hsa04360: Axon
guidance | WNT5A, WNT5B,
NFATC2 |
3.70×10⁻³ |
| hsa05217: Basal
cell carcinoma | WNT5A, WNT5B |
4.41×10⁻³ |
| hsa04916:
Melanogenesis | WNT5A, WNT5B |
1.36×10⁻² |
| hsa04550: Signaling
pathways regulating pluripotency of stem cells | WNT5A, WNT5B |
2.59×10⁻² |
| hsa04390: Hippo
signaling pathway | WNT5A, WNT5B |
3.00×10⁻² |
| hsa04150: mTOR
signaling pathway | WNT5A, WNT5B |
3.01×10⁻² |
| hsa05205:
Proteoglycans in cancer | WNT5A, WNT5B |
5.00×10⁻² |
Module B had 14 nodes and 57 interactions. There
were 9 upregulated DEGs, including cholinergic receptor muscarinic
2 (CHRM2), sphingosine-1-phosphate receptor 4 (S1PR4), complement
component 5a receptor 1 (C5AR1), somatostatin receptor 1 (SSTR1),
APP, tachykinin receptor 1 (TACR1), regulator of G protein
signaling 2 (RGS2), G protein subunit α 14 and kalirin RhoGEF
kinase, and 5 downregulated DEGs, including coagulation factor II
thrombin receptor (F2R), free fatty acid receptor 2,
cholecystokinin, annexin A1 and neuropeptide Y. For the DEGs in
this module, 6 enriched KEGG pathways were identified. The DEGs
involved in these pathways were CHRM2, SSTR1, F2R and TACR1.
Module C had 12 nodes and 39 interactions. In this
module, the number of upregulated genes was reduced compared with
the downregulated genes, 4 and 8, respectively. A total of 6
enriched KEGG pathways were identified, which involved cell
division cycle 25, cyclin dependent kinase inhibitor 2A, cyclin E2
and ribonucleotide reductase regulatory subunit M2.
Module D had 9 nodes and 11 interactions. The number
of upregulated genes was higher compared with the downregulated
genes, 8 and 4, respectively. There were 10 enriched KEGG pathways
identified in this module. The DEGs, including Wnt family member 5A
(WNT5A) and WNT5B, signal transducer and activator of transcription
6 (STAT6), nuclear factor of activated T-cells 2 and early growth
response 2 (EGR2) were screened in these pathways.
Module E had 5 nodes and 10 interactions. It
consists of downregulated genes, nudE neurodevelopment protein 1,
centromere protein K, zwilch kinetochore protein, centromere
protein N and ERCC excision repair 6 like, spindle assembly
checkpoint helicase; however, no significantly enriched KEGG
pathways were identified in this module.
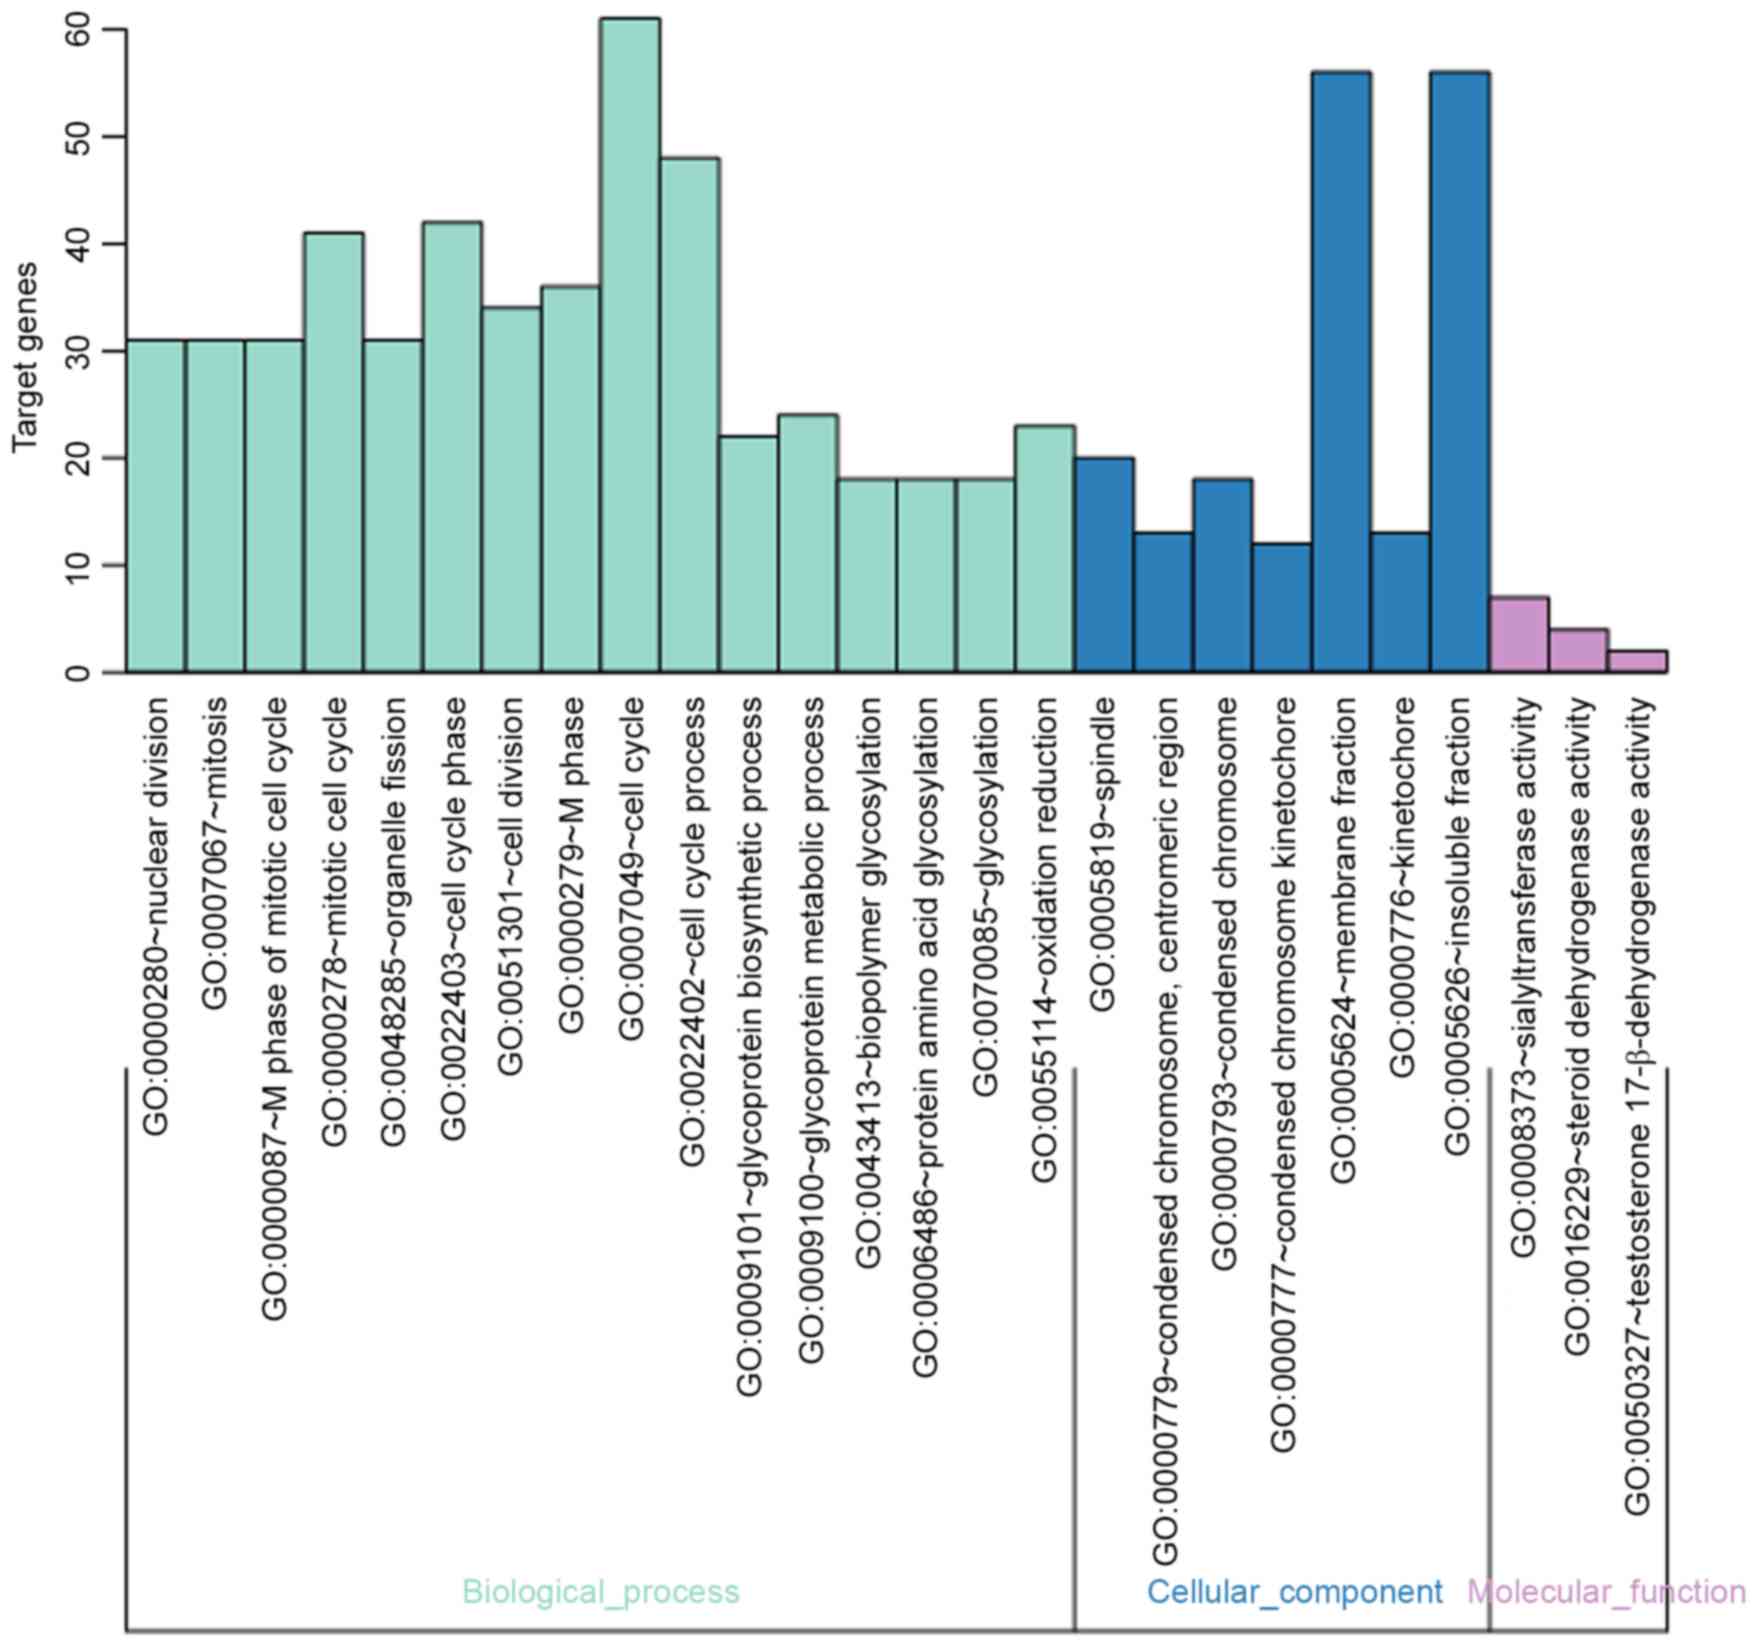
Functional analysis
Three types of functions including the biological
processes (BP), cellular components (CC) and molecular functions
(MF) of DEGs were annotated and classified by a comprehensive GO
analysis. The present study identified a total of 26 GO terms based
on the DEGs of modules with a FDR<0.05 and count >2 as
threshold and then these terms were sorted by P-value. From the GO
terms, 16 enriched GO terms in BP, 7 enriched GO terms in CC and 3
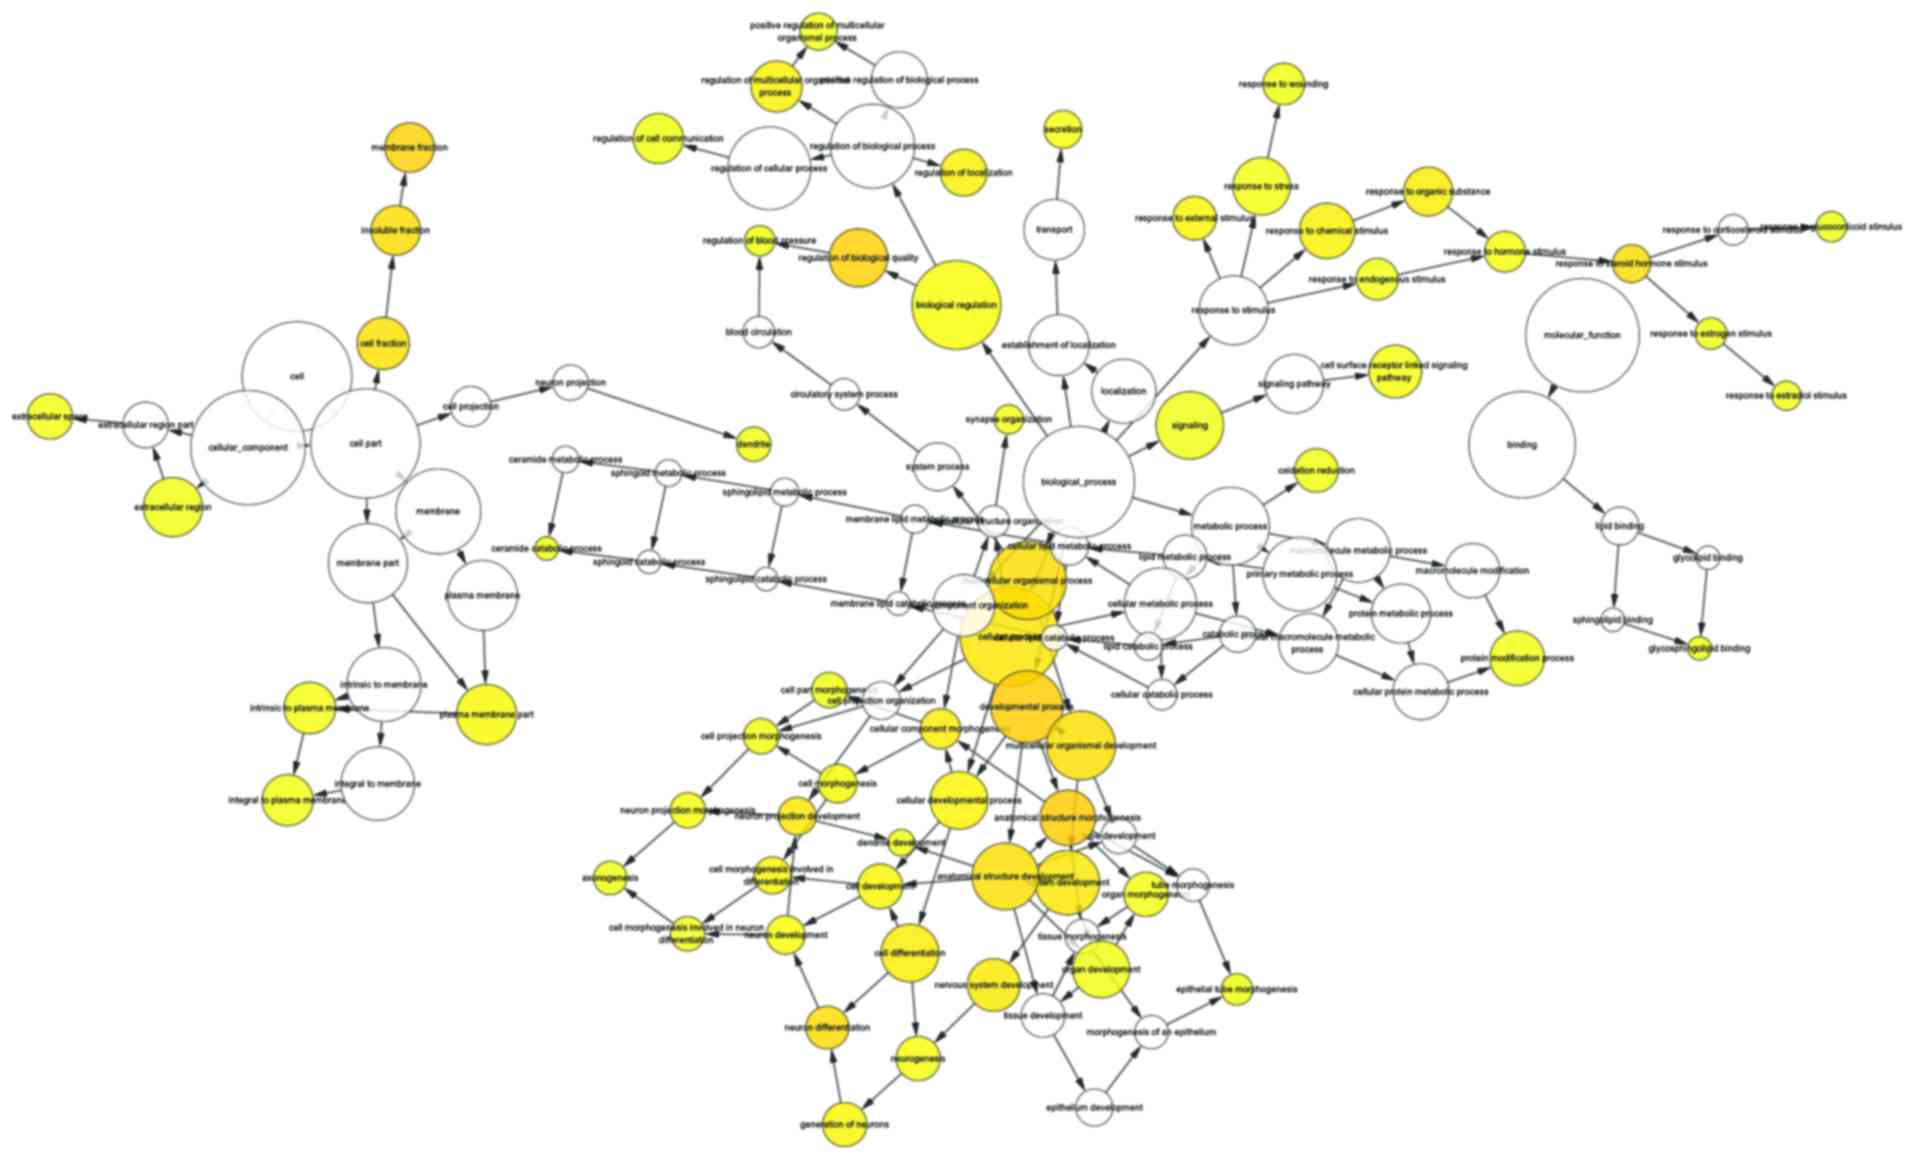
enriched GO terms enriched in MF were identified (Fig. 6; Table IV). An acyclic graph was
constructed and directed using the BiNGO tool to depict the visual
interactions of functions based on the enrichment levels of the GO
terms (Fig. 7).
| Table IV.Enriched GO functions for the
DEGs. |
Table IV.
Enriched GO functions for the
DEGs.
| A, Biological
processes |
|---|
|
|---|
| GO Term | Function | Count | FDR | Examples of
DEGs |
|---|
| GO:0000280 | Nuclear
division | 31 |
3.83×10⁻⁶ | CCNB1, CCNB2, PLK1,
AURKB, CCNG2 |
| GO:0007067 | Mitosis | 31 |
3.97×10⁻⁶ | KIF23, CCNA2,
CCNB2, PLK1, CDCA2 |
| GO:0000087 | M phase of mitotic
cell cycle | 31 |
5.90×10⁻⁶ | KIF23, KIFC1,
KIF22, NEK2, HAUS1 |
| GO:0000278 | Mitotic cell
cycle | 41 |
8.90×10⁻⁶ | CDKN1A, CCNB2,
PLK2, PLK1, RNF2 |
| GO:0048285 | Organelle
fission | 31 |
9.98×10⁻⁶ | NDC80, UBE2C,
CDC25A, CCNB1, CCNB2 |
| GO:0022403 | Cell cycle
phase | 42 |
7.08×10⁻⁵ | BCAT1, KIF23,
KIF22, KIFC1, PRC1 |
| GO:0051301 | Cell division | 34 |
9.05×10⁻⁵ | CCNE2, SPC25, NDE1,
CDKN2A, NCAPG |
| GO:0000279 | M phase | 36 |
1.25×10⁻⁴ | CCNA2, ERCC6L,
KIF11, DLGAP5, NUF2 |
| GO:0007049 | Cell cycle | 61 |
4.66×10⁻⁴ | CCNB2, PLK2, RGS2,
MAPK13, PLK1 |
| GO:0022402 | Cell cycle
process | 48 |
1.36×10⁻³ | BCAT1, KIF23,
KIF22, KIFC1, PRC1 |
| GO:0009101 | Glycoprotein
biosynthetic process | 22 |
1.56×10⁻³ | GALNT3, ST6GAL1,
ST6GAL2, LDLR, FUT8 |
| GO:0009100 | Glycoprotein
metabolic process | 24 |
7.23×10⁻³ | GALNT3, ST6GAL1,
ST8SIA1, CHST3, ABCG1 |
| GO:0043413 | Biopolymer
glycosylation | 18 |
1.72×10⁻² | GALNT3, ST6GAL1,
ABCG1, MPDU1, B3GNT3 |
| GO:0006486 | Protein amino acid
glycosylation | 18 |
1.73×10⁻² | COG7, ST3GAL4,
B3GNT7, ST3GAL6, MPDU1 |
| GO:0070085 | Glycosylation | 18 |
1.73×10⁻² | GALNT3, ST6GAL1,
ST6GAL2, ALG1, ST3GAL1 |
| GO:0055114 | Oxidation
reduction | 23 |
3.15×10⁻² | DHRS9,
ACADL, GMPR, ALDH1A1, AKR1C3 |
|
| B, Cellular
components |
|
| Term | Function | Count | FDR | Examples of
DEGs |
|
| GO:0005819 | Spindle | 20 |
5.53×10⁻³ | KIF23, NDE1, APP,
PLK1, SKA1 |
| GO:0000779 | Condensed
chromosome, centromeric region | 13 |
1.02×10⁻² | CENPN, NUF2, CENPF,
NDC80, AURKB |
| GO:0000793 | Condensed
chromosome | 18 |
1.36×10⁻² | CENPN, NEK2, SKA1,
CENPF, CHEK1, |
| GO:0000777 | Condensed
chromosome kinetochore | 12 |
1.61×10⁻² | SPC25, CENPN, NDE1,
CENPA, NUF2, |
| GO:0005624 | Membrane
fraction | 56 |
4.37×10⁻² | NPR3, RGS16, CCNB2,
APP, CHRM2 |
| GO:0000776 | Kinetochore | 13 |
4.48×10⁻² | KIF22, CENPN, NUF2,
CENPF, CENPK |
| GO:0005626 | Insoluble
fraction | 56 |
4.12×10⁻² | CYP2J2, CADM1,
CCNB2, NPR3, RGS16 |
|
| C, Molecular
functions |
|
| Term | Function | Count | FDR | Examples of
DEGs |
|
| GO:0008373 | Sialyltransferase
activity | 7 |
4.14×10⁻² | ST6GAL1, ST6GAL2,
ST3GAL4, ST3GAL6 |
| GO:0016229 | Steroid
dehydrogenase activity | 4 |
1.89×10⁻² | AKR1C3, HSD11B2,
DHRS9, HSD17B6 |
| GO:0050327 | Testosterone
17-beta-dehydrogenase activity | 2 |
2.62×10⁻² | AKR1C3,
HSD17B6 |
Discussion
CaP is the most common non-cutaneous carcinoma among
elderly men, and ~180,890 men have been estimated to have been
diagnosed in the USA by 2016 (1).
ADT as the primary therapeutic strategy for advanced stage of
prostate carcinoma has been the conventional treatment since 1942;
however, the disease frequently relapses and progresses into CRPC
with adaptive responses of androgen receptors (4,7,19).
Therefore, the present study aimed to outline potential prognostic
biomarkers or therapeutic targets for CRPC.
In the present study, ~362 DEGs were identified from
the gene expression profile analysis. Due to gene-gene interactions
it is more accurate to predict the associations of protein
functions compared with a single gene and the present study
identified 306 interacting genes and constructed a PPI network
using the STRING online tool. Accordingly, to show all DEGs, a
network of PPI interactions was generated. The DEGs in the PPI
network exhibited higher enrichment, indicating a higher degree of
modularization; therefore, the present study divided the DEGs into
10 modules for investigating the interactions using Mcode and the
top 5 modules were selected for further investigation.
Additionally, the GO analysis demonstrated that the function of
DEGs in different cluster modules were associated with androgen
metabolism and cell cycle. The KEGG pathway analysis was performed
to identify the altered pathways in the functional modules.
Finally, aldo-keto reductase 3 (AKR1C3), CCNB2, RGS2, nuclear
factor of activated T-cells (NFATc2) and PRKCA were significantly
enriched in CRPC development.
AKR1C3 is a member of aldo-keto reductase
superfamily, which includes ~40 types of proteins and enzymes.
These enzymes use NADH or NADPH as cofactors to convert aldehydes
and ketones into the relevant alcohols with catalyzed reaction
(20). Byrns et al
(21) showed that AKR1C3
overexpression was associated with the high risk of breast and
ovarian cancer. Azzarello et al (22) determined that the high expression
of AKR1C3 may be a predictor for poor prognosis in patients with
renal cell carcinoma, papillary urothelial carcinoma, and Wilms'
tumor. The GO enrichment performed by the present study
demonstrated that AKR1C3 was associated with biological processes
and molecular functions, such as cellular process, oxidation
reduction, steroid dehydrogenase activity and testosterone
17-β-dehydrogenase activity. Therefore, it possible that AKR1C3 is
an important enzyme mediated in the progression of CaP into the
development of CRPC. Additionally, AKR1C3 is the upregulated DEG in
this gene expression profile; therefore, knocking-down the
expression of AKR1C3 may lower the androgen sensitivity of CRPC
cells.
CCNB2 was identified as the core gene of module A.
CCNB2 is a B-type cyclin of the cyclin family. CCNB2 and B1,
associated with p34cdc2/cyclin B complex, are essential components
of the cell cycle regulatory machinery (23). In the module A, enriched KEGG
pathways revealed that CCNB2 was associated with pathways,
including cell cycle, FoxO and p53 signaling pathways. In addition,
through comparison of functions between GO enrichments and the
DEGs, the present study identified that CCNB2, a key enzyme
mediating in the progress of oxidation reduction, was associated
with the cell cycle. The epithelial-mesenchymal transition (EMT)
has a crucial role in the developmental process during which
prostate cancer cells acquire migrating and invasive phenotype
(11,24). Additionally, EMT may promote cancer
metastasis and mediate the resistance to ADT in prostate cancer
(25). Shiota et al
(26) identified TGF-β as an EMT
inducer that leads AR to acquire castration resistance. A previous
study revealed that in the FoxO signaling pathway, CCNB2 may bind
TGF-β-RII and may be involved in transforming growth factor
b-mediated cell cycle control (27). Therefore, the present study
suggested that CCNB2 may be a co-regulator of TGF-β, mediating the
development of tumor metastasis and therapeutic resistance;
therefore, the effective treatment strategy for CRPC may involve
altering the expression of CCNB2. CCNB2 has interactive
associations with PLK1 and AURKA in module A, revealing that CCNB2
may also be involved in CRPC by mediating PLK1 and AURKA.
G-protein coupled receptors are important in the
physiology of the prostate; therefore, they may be a potential
alternative or combinatorial therapeutic targets in the growth
processes of tumor cells and AR-mediated signaling pathways
(28). The present study
identified RGS2 as a differentially expressed gene enriched in the
cAMP signaling pathway of module B. In addition, RGS2 has a crucial
role in cell cycle according to the GO enrichment analysis. The
cell cycle is a succession of events which take place at the
cellular level resulting in division and duplication (29) and thus it indicated that RGS2 may
associate with the division and metabolism in tumor cells. The
expression of RGS2 is upregulated in the castrated samples of the
present study, its overexpression may induce a change for the
sensitivity of AR. Therefore, a knockdown of the expression of RGS2
may suppress the growth of tumor cells and block the progression
from androgen dependence to castration resistance. In module B,
RGS2 has interactive associations with CHRM2, SSTR1, F2R, TACR1,
C5AR1 and S1PR4, indicating that RGS2 may also be involved in CRPC
by mediating these genes.
NFATc2, a member of NFAT family, was identified as a
central regulator in activation of gene transcription during immune
response (30). However, the
present study determined that NFATc2 was a core gene enriched in
the Wnt signaling pathway of module D for prostate cancer. NFATc2
may activate in response to the Wnt signaling pathway stimulation
and activate β-catenin expression (31). Additionally, β-catenin is a
cofactor of AR that may amplify AR signaling to regulate androgen
synthesis (32). Therefore, it was
hypothesized that NFATc2 may be a key regulator correlated with
CRPC. In addition, NFATc2 has interactive associations with EGR2,
STAT6, Wnt5A and Wnt5B in module D, revealing that NFATc2 may also
be involved in CRPC by mediating these genes.
PRKCA is a member of protein kinase C (PKC) family
that may be activated by calcium and the second messenger
diacylglycerol (33). Using the
PPI network constructed by the present study PRKCA was identified
as a hub gene with 11 interactions. Tirado et al (34) determined that PRKCA may modulate
caveolin-1 to promote resistance to chemotherapy-induced apoptosis
in Ewing's sarcoma. Lønne et al (35) showed that PKCa expression may be a
marker for breast cancer aggressiveness. In addition, Lichner et
al (36) demonstrated that
PRKCA may reduce cell proliferation and migration of prostate
cancer. However, to the best of our knowledge, there is no
experimental study reporting PRKCA to be associated with CRPC.
Nonetheless, the PPI network constructed in the present study has
indicated that PRKCA may have interactive associations with CRPC,
these findings require conformation by future studies.
In summary, based on the gene expression profile
analysis in GEO database, the present study identified the DEGs
between non-castrated and castrated samples. There were 362 DEGs
identified by comprehensive bioinformatics analysis, including
AKR1C3, CCNB2, RGS2, NFATc2 and PRKCA, which may have a fundamental
role in the development of CRPC and predicted to be involved in the
cell cycle pathway. Those findings may be potential biomarkers for
the exploration of the biological mechanisms of CRPC and may be
used as potential targets for therapeutic intervention or diagnosis
of CRPC.
However, the primary limitation of the present study
is that as the DEGs remain to be verified by experiments;
therefore, further analyses are required to determine the
mechanisms in process of malignant progression in CaP. Future
studies will aim to use polymerase chain reaction or western
blotting to verify expression levels of the key genes in samples
between non-castrated and castrated men.
References
|
1
|
Siegel RL, Miller KD and Jemal A: Cancer
statistics, 2016. CA Cancer J Clin. 66:7–30. 2016. View Article : Google Scholar : PubMed/NCBI
|
|
2
|
Guinney J, Wang T, Laajala TD, Winner KK,
Bare JC, Neto EC, Khan SA, Peddinti G, Airola A, Pahikkala T, et
al: Prediction of overall survival for patients with metastatic
castration-resistant prostate cancer: Development of a prognostic
model through a crowdsourced challenge with open clinical trial
data. Lancet Oncol. 18:132–142. 2017. View Article : Google Scholar : PubMed/NCBI
|
|
3
|
Schmid S, Omlin A, Blum D, Strasser F,
Gillessen S and Rothermundt C: Assessment of anticancer-treatment
outcome in patients with metastatic castration-resistant prostate
cancer-going beyond PSA and imaging, a systematic literature
review. Ann Oncol. 26:2221–2247. 2015. View Article : Google Scholar : PubMed/NCBI
|
|
4
|
Chandrasekar T, Yang JC, Gao AC and Evans
CP: Mechanisms of resistance in castration-resistant prostate
cancer (CRPC). Transl Androl Urol. 4:365–380. 2015.PubMed/NCBI
|
|
5
|
Damber JE and Aus G: Prostate cancer.
Lancet. 371:1710–1721. 2008. View Article : Google Scholar : PubMed/NCBI
|
|
6
|
Ferlay J, Steliarova-Foucher E,
Lortet-Tieulent J, Rosso S, Coebergh JW, Comber H, Forman D and
Bray F: Cancer incidence and mortality patterns in Europe:
Estimates for 40 countries in 2012. Eur J Cancer. 49:1374–1403.
2013. View Article : Google Scholar : PubMed/NCBI
|
|
7
|
McCrea E, Sissung TM, Price DK, Chau CH
and Figg WD: Androgen receptor variation affects prostate cancer
progression and drug resistance. Pharmacol Res. 114:152–162. 2016.
View Article : Google Scholar : PubMed/NCBI
|
|
8
|
Koivisto P, Kononen J, Palmberg C, Tammela
T, Hyytinen E, Isola J, Trapman J, Cleutjens K, Noordzij A,
Visakorpi T and Kallioniemi OP: Androgen receptor gene
amplification: A possible molecular mechanism for androgen
deprivation therapy failure in prostate cancer. Cancer Res.
57:314–319. 1997.PubMed/NCBI
|
|
9
|
Seruga B, Ocana A and Tannock IF: Drug
resistance in metastatic castration-resistant prostate cancer. Nat
Rev Clin Oncol. 8:12–23. 2011. View Article : Google Scholar : PubMed/NCBI
|
|
10
|
Chaux A, Peskoe SB, Gonzalez-Roibon N,
Schultz L, Albadine R, Hicks J, De Marzo AM, Platz EA and Netto GJ:
Loss of PTEN expression is associated with increased risk of
recurrence after prostatectomy for clinically localized prostate
cancer. Mod Pathol. 25:1543–1549. 2012. View Article : Google Scholar : PubMed/NCBI
|
|
11
|
Sun Y, Wang BE, Leong KG, Yue P, Li L,
Jhunjhunwala S, Chen D, Seo K, Modrusan Z, Gao WQ, et al: Androgen
deprivation causes epithelial-mesenchymal transition in the
prostate: Implications for androgen-deprivation therapy. Cancer
Res. 72:527–536. 2012. View Article : Google Scholar : PubMed/NCBI
|
|
12
|
Gentleman R, Carey V, Huber W, Irizarry R
and Dudoit S: Bioinformatics and computational biology solutions
using R and Bioconductor. 746718470. Springer; New York, NY: 2005,
View Article : Google Scholar
|
|
13
|
Franceschini A, Szklarczyk D, Frankild S,
Kuhn M, Simonovic M, Roth A, Lin J, Minguez P, Bork P, von Mering C
and Jensen LJ: STRING v9.1: Protein-protein interaction networks,
with increased coverage and integration. Nucleic Acids Res.
41(Database issue): D808–D815. 2013. View Article : Google Scholar : PubMed/NCBI
|
|
14
|
Saito R, Smoot ME, Ono K, Ruscheinski J,
Wang PL, Lotia S, Pico AR, Bader GD and Ideker T: A travel guide to
Cytoscape plugins. Nat Methods. 9:1069–1076. 2012. View Article : Google Scholar : PubMed/NCBI
|
|
15
|
Assenov Y, Ramírez F, Schelhorn SE,
Lengauer T and Albrecht M: Computing topological parameters of
biological networks. Bioinformatics. 24:282–284. 2008. View Article : Google Scholar : PubMed/NCBI
|
|
16
|
Xie C, Mao X, Huang J, Ding Y, Wu J, Dong
S, Kong L, Gao G, Li CY and Wei L: KOBAS 2.0: A web server for
annotation and identification of enriched pathways and diseases.
Nucleic Acids Res. 39(Web Server issue): W316–W322. 2011.
View Article : Google Scholar : PubMed/NCBI
|
|
17
|
da W Huang, Sherman BT and Lempicki RA:
Systematic and integrative analysis of large gene lists using DAVID
bioinformatics resources. Nat Protoc. 4:44–57. 2009.PubMed/NCBI
|
|
18
|
Maere S, Heymans K and Kuiper M: BiNGO: A
cytoscape plugin to assess overrepresentation of gene ontology
categories in biological networks. Bioinformatics. 21:3448–3449.
2005. View Article : Google Scholar : PubMed/NCBI
|
|
19
|
Merseburger AS, Alcaraz A and von Klot CA:
Androgen deprivation therapy as backbone therapy in the management
of prostate cancer. Onco Targets Ther. 9:7263–7274. 2016.
View Article : Google Scholar : PubMed/NCBI
|
|
20
|
Penning TM, Burczynski ME, Jez JM, Hung
CF, Lin HK, Ma H, Moore M, Palackal N and Ratnam K: Human
3alpha-hydroxysteroid dehydrogenase isoforms (AKR1C1-AKR1C4) of the
aldo-keto reductase superfamily: Functional plasticity and tissue
distribution reveals roles in the inactivation and formation of
male and female sex hormones. Biochem J. 351:67–77. 2000.
View Article : Google Scholar : PubMed/NCBI
|
|
21
|
Byrns MC, Duan L, Lee SH, Blair IA and
Penning TM: Aldo-keto reductase 1C3 expression in MCF-7 cells
reveals roles in steroid hormone and prostaglandin metabolism that
may explain its over-expression in breast cancer. J Steroid Biochem
Mol Biol. 118:177–187. 2010. View Article : Google Scholar : PubMed/NCBI
|
|
22
|
Azzarello JT, Lin HK, Gherezghiher A,
Zakharov V, Yu Z, Kropp BP, Culkin DJ, Penning TM and Fung KM:
Expression of AKR1C3 in renal cell carcinoma, papillary urothelial
carcinoma, and Wilms' tumor. Int J Clin Exp Pathol. 3:147–155.
2009.PubMed/NCBI
|
|
23
|
Bellanger S, de Gramont A and
Sobczak-Thépot J: Cyclin B2 suppresses mitotic failure and DNA
re-replication in human somatic cells knocked down for both cyclins
B1 and B2. Oncogene. 26:7175–7184. 2007. View Article : Google Scholar : PubMed/NCBI
|
|
24
|
Kalluri R and Weinberg RA: The basics of
epithelial-mesenchymal transition. J Clin Invest. 119:1420–1428.
2009. View
Article : Google Scholar : PubMed/NCBI
|
|
25
|
Thiery JP, Acloque H, Huang RY and Nieto
MA: Epithelial-mesenchymal transitions in development and disease.
Cell. 139:871–890. 2009. View Article : Google Scholar : PubMed/NCBI
|
|
26
|
Shiota M, Itsumi M, Takeuchi A, Imada K,
Yokomizo A, Kuruma H, Inokuchi J, Tatsugami K, Uchiumi T, Oda Y and
Naito S: Crosstalk between epithelial-mesenchymal transition and
castration resistance mediated by Twist1/AR signaling in prostate
cancer. Endocr Relat Cancer. 22:889–900. 2015. View Article : Google Scholar : PubMed/NCBI
|
|
27
|
Liu JH, Wei S, Burnette PK, Gamero AM,
Hutton M and Djeu JY: Functional association of TGF-beta receptor
II with cyclin B. Oncogene. 18:269–275. 1999. View Article : Google Scholar : PubMed/NCBI
|
|
28
|
Weng J, Wang J, Hu X, Wang F, Ittmann M
and Liu M: PSGR2, a novel G-protein coupled receptor, is
overexpressed in human prostate cancer. Int J Cancer.
118:1471–1480. 2006. View Article : Google Scholar : PubMed/NCBI
|
|
29
|
Kohrman AQ and Matus DQ: Divide or
conquer: Cell cycle regulation of invasive behavior. Trends Cell
Biol. 27:12–25. 2017. View Article : Google Scholar : PubMed/NCBI
|
|
30
|
Vihma H, Pruunsild P and Timmusk T:
Alternative splicing and expression of human and mouse NFAT genes.
Genomics. 92:279–291. 2008. View Article : Google Scholar : PubMed/NCBI
|
|
31
|
Esufali S and Bapat B: Cross-talk between
Rac1 GTPase and dysregulated Wnt signaling pathway leads to
cellular redistribution of beta-catenin and TCF/LEF-mediated
transcriptional activation. Oncogene. 23:8260–8271. 2004.
View Article : Google Scholar : PubMed/NCBI
|
|
32
|
Yang F, Li X, Sharma M, Sasaki CY, Longo
DL, Lim B and Sun Z: Linking beta-catenin to androgen-signaling
pathway. J Biol Chem. 277:11336–11344. 2002. View Article : Google Scholar : PubMed/NCBI
|
|
33
|
Coussens L, Parker PJ, Rhee L, Yang-Feng
TL, Chen E, Waterfield MD, Francke U and Ullrich A: Multiple,
distinct forms of bovine and human protein kinase C suggest
diversity in cellular signaling pathways. Science. 233:859–866.
1986. View Article : Google Scholar : PubMed/NCBI
|
|
34
|
Tirado OM, Maccarthy CM, Fatima N, Villar
J, Mateo-Lozano S and Notario V: Caveolin-1 promotes resistance to
chemotherapy-induced apoptosis in Ewing's sarcoma cells by
modulating PKCalpha phosphorylation. Int J Cancer. 126:426–436.
2010. View Article : Google Scholar : PubMed/NCBI
|
|
35
|
Lønne GK, Cornmark L, Zahirovic IO,
Landberg G, Jirström K and Larsson C: PKCalpha expression is a
marker for breast cancer aggressiveness. Mol Cancer. 9:762010.
View Article : Google Scholar : PubMed/NCBI
|
|
36
|
Lichner Z, Ding Q, Samaan S, Saleh C,
Nasser A, Al-Haddad S, Samuel JN, Fleshner NE, Stephan C, Jung K
and Yousef GM: miRNAs dysregulated in association with Gleason
grade regulate extracellular matrix, cytoskeleton and androgen
receptor pathways. J Pathol. 237:226–237. 2015. View Article : Google Scholar : PubMed/NCBI
|