Introduction
Gliomas are common primary tumors of the central
nervous system. According to the World Health Organization
classification, grade I and II gliomas are benign tumors, whereas
grade III gliomas are a class of malignant brain solid tumor with a
median patient survival rate of 2–5 years (1). These represent 10% of primary brain
tumors (2), which can infiltrate
the surrounding brain parenchyma. Using standard therapeutic
protocols, patients with malignant glioma have different
pathological appearances and clinical outcomes. Treatments include
surgery, radiation therapy, and chemotherapy, however, there is no
specialized treatment available. There are insufficient molecular
targets relevant in the choice of therapy, and their role in
clinical trials requires validation. Novel therapeutic methods
based on the specific mechanism of high grade glioma carcinogenesis
are required to improve treatment efficiency and avoid the side
effects of traditional treatment.
In order to better understand the mechanisms
underlying complicated diseases, building and analyzing biological
networks associated with the intractable diseases are becoming an
efficient approach. Instead of individual genetic determinants,
network approaches provide an insight into the pathogenesis of
complex diseases by examining interacting gene sets and pathways
(3,4). The network analysis of expression
profile data has been able to identify genes modules associated
with tumorigenesis. In addition, this method can be used to
understand the mechanisms underlying gliomagenesis at the system
and gene level.
Weighted gene co-expression network analysis (WGCNA)
was been widely used to examine the changes of transcriptome
expression patterns in various diseases, which identifies clusters
(modules) of highly correlated genes, and summarizes clusters using
the module eigengene or an intramodular hub gene (5–8).
Correlation networks facilitate network-based gene screening
methods, which can be used to identify candidate biomarkers or
therapeutic targets. These methods have been successfully applied
in complex biological contexts, including cancer, mouse genetics,
yeast and genetics, and the analysis of brain imaging data
(7). In addition, the algorithm of
WGCNA can simplify the problems of multiple testing, which are
unavoidable in standard gene-centric methods of microarray
expression profiling data analysis; consequently it is a useful
systematic analysis method, which focuses on the coherence function
of network modules (9).
The Cancer Genome Atlas (TCGA) project has provided
a comprehensive means to improve the ability to diagnose, treat and
prevent cancer through an improved understanding of the genetic
basis of the disease. By the end of 2015, TCGA had analyzed the
genomic, epigenomic and gene expression profiles of >10,000
specimens from >25 types of tumor (10). This substantial data provides
opportunities to identify the mechanism and prognostic molecular
signatures of cancer in a comprehensive manner. The lower grade
glioma (LGG) group data in TCGA includes the grade II and grade III
glioma gene expression profiles and relevant clinical data of those
samples. To better understand the mechanism underlying clinical
heterogeneity, the present study combined the LGG micro (mi)RNAseq
and mRNAseq data of TCGA to identify the relevant network of
tumorigenesis and prognostic genes in clinical traits.
Materials and methods
Patient characteristics and integrated
mRNA and miRNA profiles
The clinical, and mRNAseq and miRNAseq data for 83
patients with grade III glioma were downloaded from the LGG cohort.
The correspondent normal cohort data were obtained from five TCGA
glioblastoma (GBM) normal control samples. The TCGA-Assembler
download level-3 RNASeqV2 gene expression data, miRNA-seq data of
samples and the clinical information of the patients were used
(DirectoryTraverseResult_Sep-18-2015.rda). The raw count mRNAseq
data of 83 glioma grade III patients and raw read miRNA data of
five GBM normal patients (TCGA-06-AABW-11A-31R-A36H-07,
TCGA-06-0678-11A-32R-A36H-07, TCGA-06-0675-11A-32R-A36H-07,
TCGA-06-0681-11A-41R-A36H-07, TCGA-06-0680-11A-32R-A36H-07 and
TCGA-HW-7493-01A-11R-2027-07), were selected.
Statistical analyses
Expressed data close to zero were eliminated, and
round numbers of all arrays were selected. The normal group were
compared with the grade III glioma group, and the ‘DESeq’ package
in R software (3.3.0; www.r-project.org) was used to identify the
differentially expressed genes (DEGs), miRNAs with a fold change
>2.0, and adjusted P-value of P<0.05.
The WGCNA was used to identify the co-expression
modules (5,7,11).
WGCNA was implemented in the Bioconductor package (bioconductor.org/biocLite.R).
The DEGs were applied to identify the gene modules
of highly correlated genes using WGCNA. A total of 2,036 of the
DEGs were selected and Pearson's correlation was calculated for all
pairs of selected genes. The correlation matrix was converted into
an adjacency matrix with a power function, so that the connection
strength between two genes, xi and xj, was
defined as: aij=|0.5 × (1+cor (xi,
xj))|β. Where xi and xj
represent the expression values of probes, and parameter β was
determined by the criterion that the resulting adjacency matrix
approximately fit a scale-free topological feature according to a
previously proposed model-fitting index (11). The row index u (u=1,…, m)
represents sample measurements. The adjacency matrix was further
transformed into a topological overlap matrix, which captures not
only the direct interaction between two genes, but also their
indirect interactions through all the other genes in the network.
In the present study, two functions of adjacency matrices were
defined. First, the Topological Overlap Matrix (TOM) is defined as
follows:
TOMij=∑uaiuauj+aijmin(ki,kj)+1–aij
ki=∑uaiu
where is the node connectivity. A second function
was used as a distance matrix in the hierarchical clustering of the
transcript units for module detection, and was defined as
follows:
Dissimij=1–TOMij
Using the clusterProfiler package of Bioconductor,
the functions of different module genes were annotated by gene
ontology (GO; www.geneontology.org) and Kyoto Encyclopedia of Genes
and Genomes (KEGG; www.genome.jp/kegg) analysis. Finally, the
co-expression network of DEGs was established and visualized using
Cytoscape software. For clarifying the role of miRNAs in grade III
glioma, the differentially expressed miRNA data and mRNA data were
merged to construct the co-expression network.
In order to identify prognostic mRNA and miRNA
signatures, by combining the clinical data of the patient hub genes
in TCGA, life curves were constructed for those samples with DEGs
by ‘survival’ in R package. All analyses were performed using R
software (version 3.3.0) and Bioconductor (version 3.2).
Results
DEGs
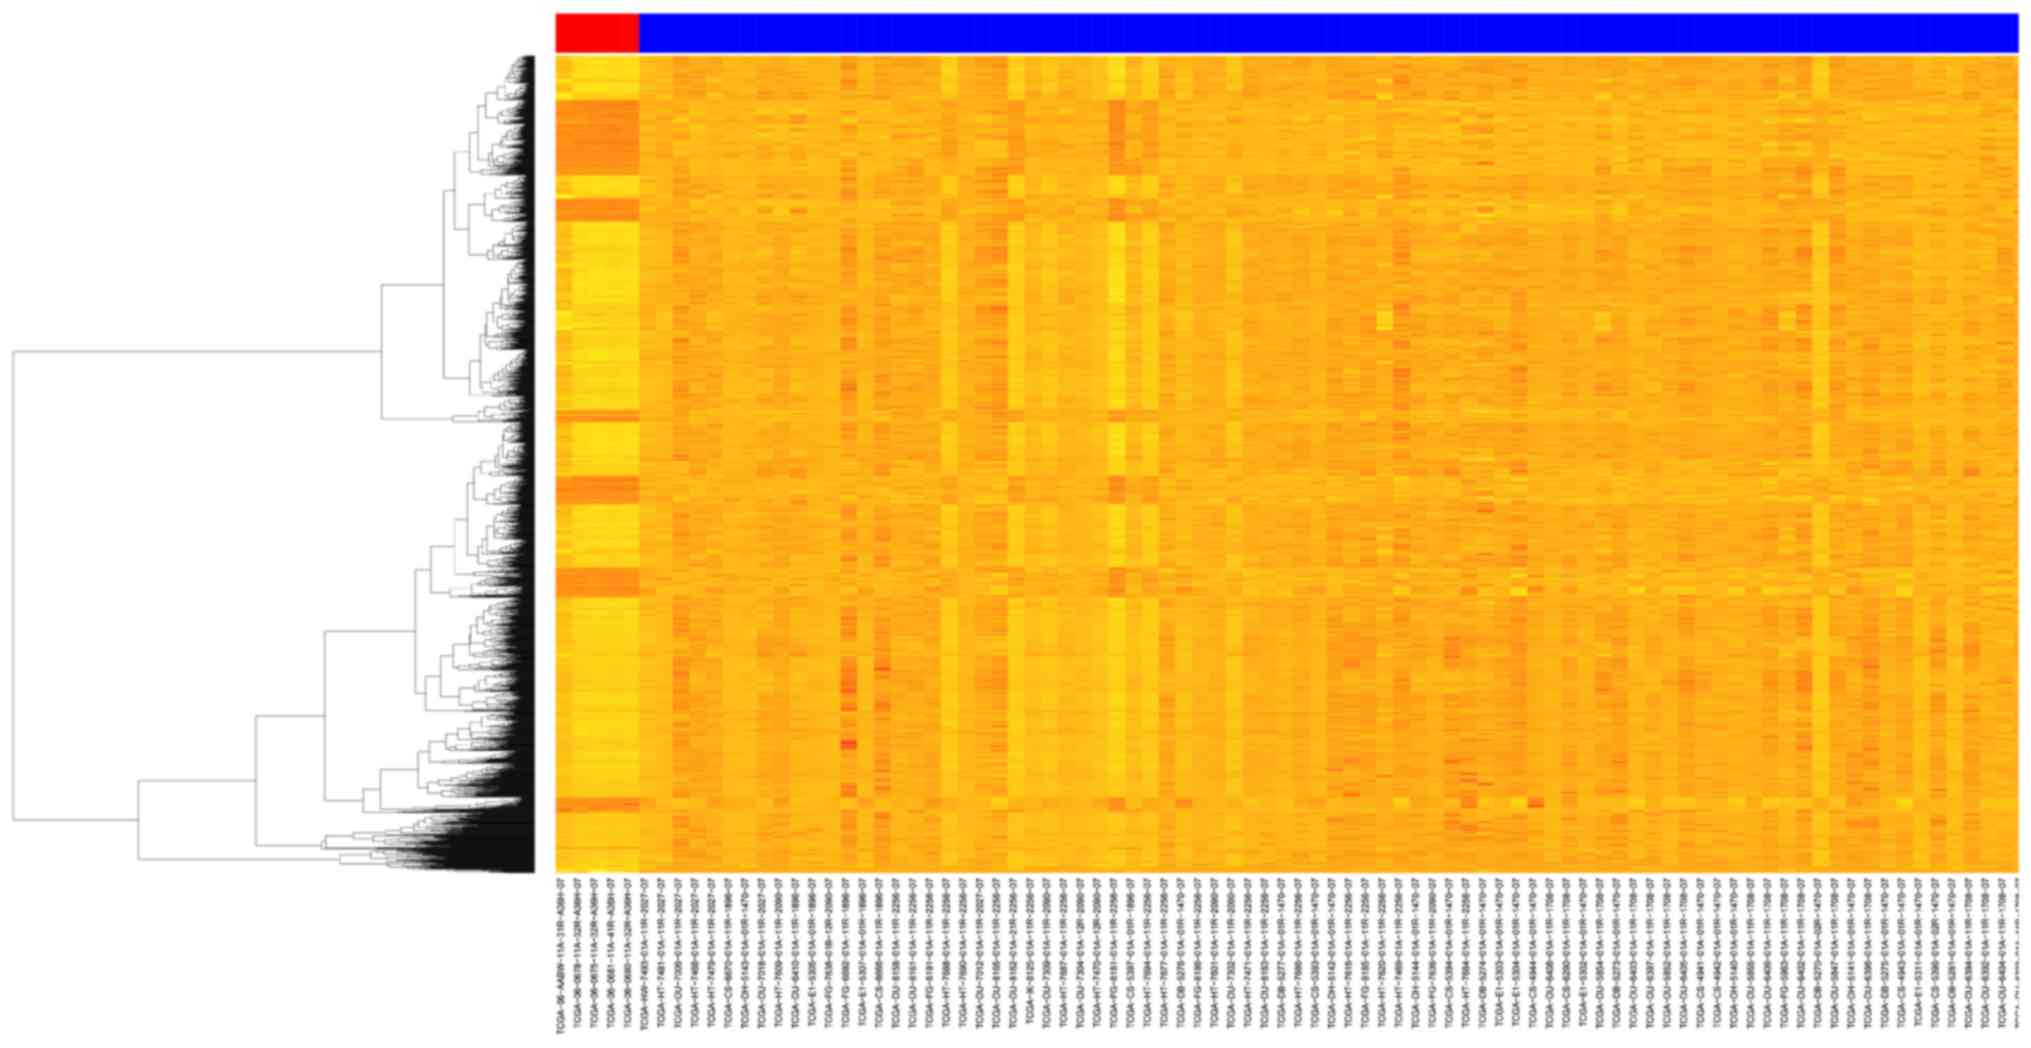
A total of 2,036 differently expressed mRNAs and 50
miRNAs were confirmed using the ‘DESeq’ package in R. The heatmap
constructed using the differently expressed mRNAs is shown in
Fig. 1. The mRNAs with
|log2foldchange|>2 and miRNAs with |log2foldchange|>2 are
shown in Tables I and II.
 | Table I.Differential expression of miRNAs
between the glioma and normal groups. |
Table I.
Differential expression of miRNAs
between the glioma and normal groups.
| ID | log2foldchange | pval | padj |
|---|
| hsa-miR-137 | −3.52 | <0.01 | <0.01 |
| hsa-miR-876 | −3.18 | <0.01 | <0.01 |
| hsa-miR-433 | −2.92 | <0.01 | <0.01 |
| hsa-miR-218–2 | −2.85 | <0.01 | <0.01 |
| hsa-miR-485 | −2.83 | <0.01 | <0.01 |
| hsa-miR-873 | −2.81 | <0.01 | 0.02 |
| hsa-miR-448 | −2.67 | <0.01 | 0.01 |
| hsa-miR-770 | −2.67 | <0.01 | 0.01 |
| hsa-miR-329–2 | −2.66 | <0.01 | 0.03 |
| hsa-miR-329–1 | −2.63 | <0.01 | 0.03 |
| hsa-miR-495 | −2.60 | <0.01 | <0.01 |
| hsa-miR-656 | −2.60 | <0.01 | 0.02 |
| hsa-miR-412 | −2.58 | <0.01 | <0.01 |
| hsa-miR-668 | −2.48 | <0.01 | 0.03 |
| hsa-miR-138–2 | −2.46 | <0.01 | <0.01 |
| hsa-miR-7–3 | −2.45 | <0.01 | 0.02 |
| hsa-miR-139 | −2.43 | <0.01 | <0.01 |
| hsa-miR-129–2 | −2.43 | <0.01 | <0.01 |
| hsa-miR-487b | −2.39 | <0.01 | 0.01 |
| hsa-miR-129–1 | −2.39 | <0.01 | <0.01 |
| hsa-miR-1298 | −2.38 | <0.01 | 0.03 |
| hsa-miR-1224 | −2.37 | <0.01 | 0.02 |
| hsa-miR-380 | −2.36 | <0.01 | 0.04 |
| hsa-miR-889 | −2.33 | <0.01 | 0.01 |
| hsa-miR-432 | −2.27 | <0.01 | 0.01 |
| hsa-miR-490 | −2.26 | <0.01 | 0.03 |
| hsa-miR-1258 | −2.25 | <0.01 | 0.05 |
| hsa-miR-543 | −2.22 | <0.01 | 0.05 |
| hsa-miR-323 | −2.18 | <0.01 | 0.01 |
| hsa-miR-431 | −2.16 | <0.01 | <0.01 |
| hsa-miR-138–1 | −2.03 | <0.01 | 0.03 |
| hsa-miR-410 | −2.00 | <0.01 | 0.05 |
| hsa-miR-10b | 8.59 | <0.01 | <0.01 |
| hsa-miR-891b | 5.35 | <0.01 | 0.05 |
| hsa-miR-181a-2 | 2.49 | <0.01 | <0.01 |
| hsa-miR-92b | 2.13 | <0.01 | 0.03 |
| hsa-miR-27a | 2.05 | <0.01 | 0.05 |
| hsa-miR-23a | 2.015 | <0.01 | 0.05 |
| hsa-miR-374a | 1.91 | <0.01 | 0.05 |
| hsa-miR-25 | 1.68 | <0.01 | 0.05 |
| Table II.Differential expression of mRNAs
between the glioma and normal groups. |
Table II.
Differential expression of mRNAs
between the glioma and normal groups.
| ID | log2FC | pval | padj |
|---|
| INS | −7.90 | <0.01 | 0.05 |
| LOC100129935 | −5.91 | <0.01 | 0.01 |
| TRIM43 | −5.21 | <0.01 | 0.04 |
| FAM153B | −5.13 | <0.01 | <0.01 |
| LOC440896 | −5.09 | <0.01 | <0.01 |
| MSLNL | −5.04 | <0.01 | <0.01 |
| FAM153C | −4.99 | <0.01 | <0.01 |
| FAM153A | −4.94 | <0.01 | <0.01 |
| C6orf127 | −4.87 | <0.01 | <0.01 |
| KRT77 | −4.79 | <0.01 | 0.02 |
| LOC728276 | −4.69 | <0.01 | <0.01 |
| EVPLL | −4.67 | <0.01 | 0.05 |
| LOC100132354 | −4.61 | <0.01 | <0.01 |
| KRTAP17-1 | −4.58 | <0.01 | 0.03 |
| ANXA8 | −4.38 | <0.01 | 0.05 |
| MYH13 | −4.31 | <0.01 | <0.01 |
| CRYGN | −4.29 | <0.01 | 0.03 |
| CRHR2 | −4.22 | <0.01 | <0.01 |
| KIF12 | −4.21 | <0.01 | <0.01 |
| GPR150 | −4.19 | <0.01 | <0.01 |
| KRT33B | −4.17 | <0.01 | <0.01 |
| ADRB3 | −4.14 | <0.01 | <0.01 |
| SLC22A10 | −4.13 | <0.01 | <0.01 |
| KRT3 | −4.10 | <0.01 | 0.02 |
| FSHB | −4.09 | <0.01 | 0.02 |
| MYL2 | −4.07 | <0.01 | 0.01 |
| HOXD9 | 9.01 | <0.01 | 0.04 |
| TLX1 | 8.91 | <0.01 | 0.04 |
| TBX5 | 8.14 | <0.01 | <0.01 |
| HOXD8 | 7.67 | <0.01 | <0.01 |
| PAX1 | 6.94 | <0.01 | <0.01 |
| TOP2A | 6.81 | <0.01 | <0.01 |
| VEPH1 | 6.71 | <0.01 | <0.01 |
| C5orf38 | 6.71 | <0.01 | <0.01 |
| DLGAP5 | 6.57 | <0.01 | <0.01 |
| MYBL2 | 6.46 | <0.01 | <0.01 |
| GSC | 6.38 | <0.01 | 0.03 |
| PBK | 6.28 | <0.01 | <0.01 |
| UBE2C | 6.19 | <0.01 | <0.01 |
| CDC45 | 6.13 | <0.01 | <0.01 |
| NDC80 | 6.04 | <0.01 | <0.01 |
| MELK | 5.98 | <0.01 | <0.01 |
| AURKB | 5.94 | <0.01 | <0.01 |
| ZNF560 | 5.92 | <0.01 | 0.04 |
| RRM2 | 5.84 | <0.01 | <0.01 |
| FAM64A | 5.82 | <0.01 | <0.01 |
| IRX1 | 5.79 | <0.01 | <0.01 |
| CCNB2 | 5.76 | <0.01 | <0.01 |
| MKI67 | 5.69 | <0.01 | <0.01 |
| TSHR | 5.68 | <0.01 | 0.04 |
| KIF20A | 5.66 | <0.01 | <0.01 |
| NCAPG | 5.51 | <0.01 | <0.01 |
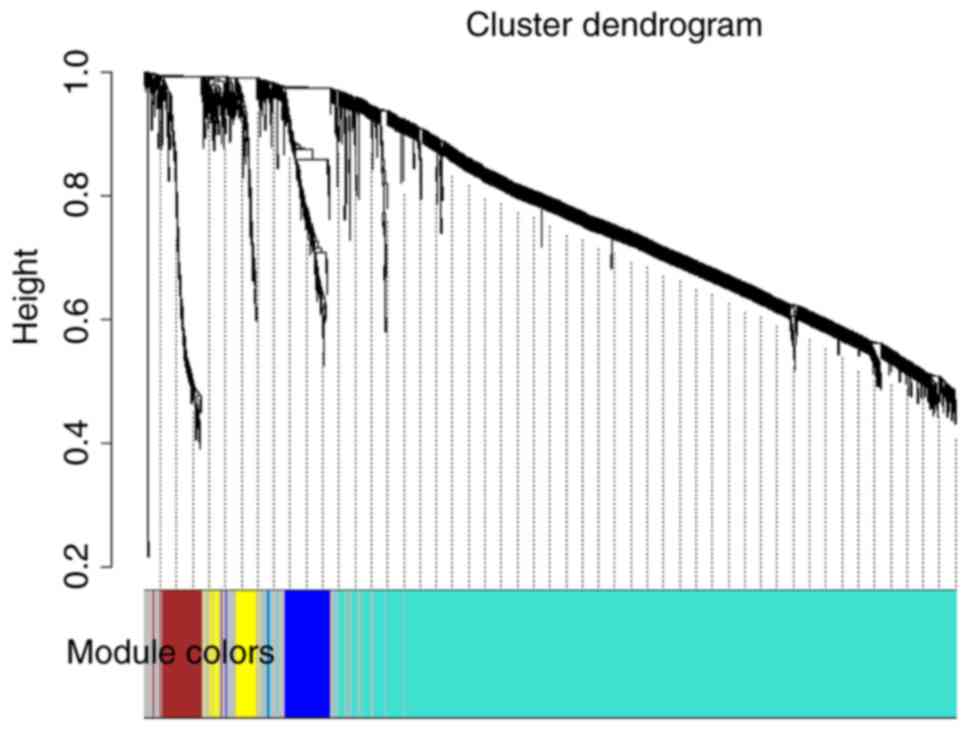
Hub genes
The 2,036 genes were clustered into five modules
(Fig. 2) using WGCNA. In addition,
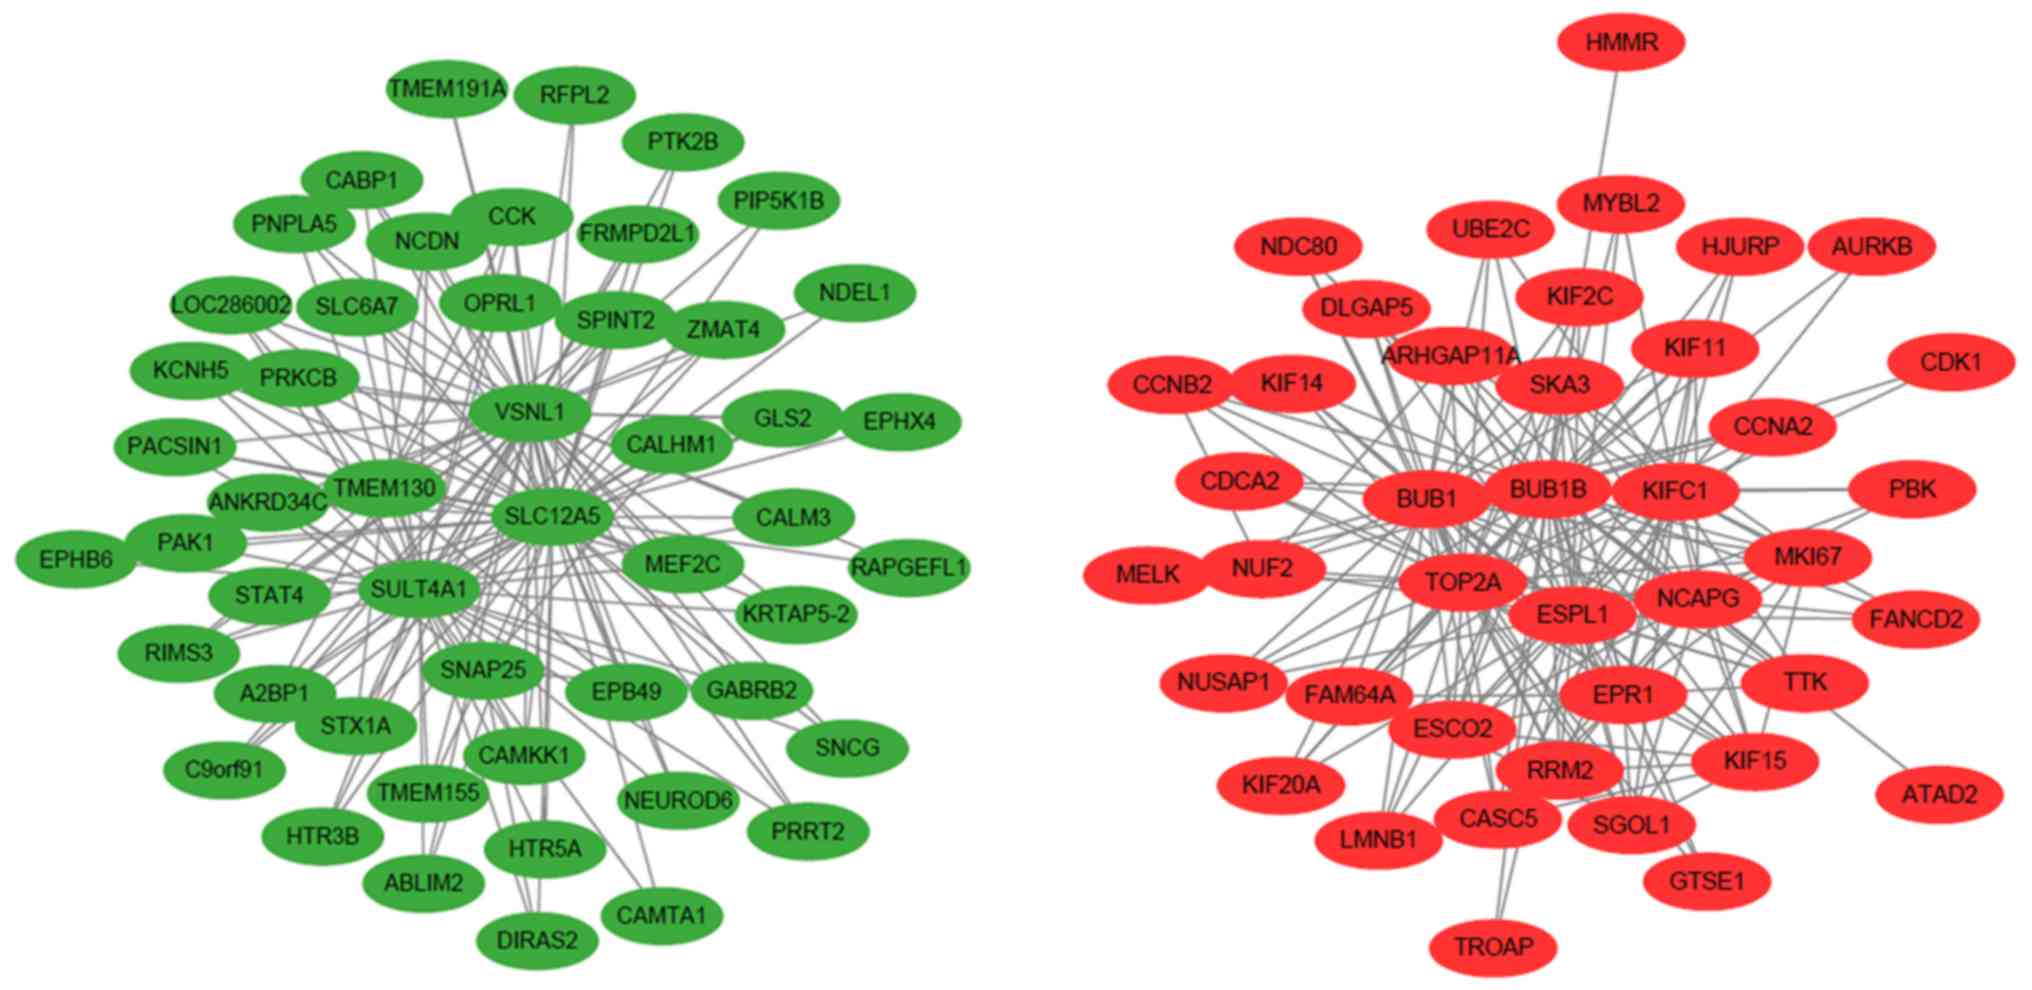
the co-expression network of DEGs was established using WGCNA and
visualized using Cytoscape software. In the network, BUB1B, KIFC1,
TOP2A, BUB1, SLC12A5, ESCO2, ESPL1, EPR1, KIF15, CASC5, SGOL1,
NUSAP1, CCNB2, NUF2, TTK and KIF2C were central in the network
(Fig. 3). It was found that the
network included two centers, with downregulated genes and
upregulated genes constituting the regulatory network,
respectively. BUB1B, KIFC1, TOP2A, BUB1, ESPL1 and EPR1 were at the
center of the upregulated gene network; SLC12A5, VSNL1, SULT4A1,
TMEM130, SNAP25 were central of the downregulated expression gene
network. However, when the data of the differently regulated
mRNAseq and miRNAseq were merged to construct the co-expression
network, SLC12A5, MAL2, VSNL1, A2BP1, EPB49, SULT4A1, TMEM130,
ADAM11, SNAP25, C1orf115, DNM1 and SYT1 were central in the
network, and miR-128 and miR-129 were involved. (Fig. 4). It was hypothesized that the
genes in the center of the network may be hub genes in the
pathological process of high grade LGG.
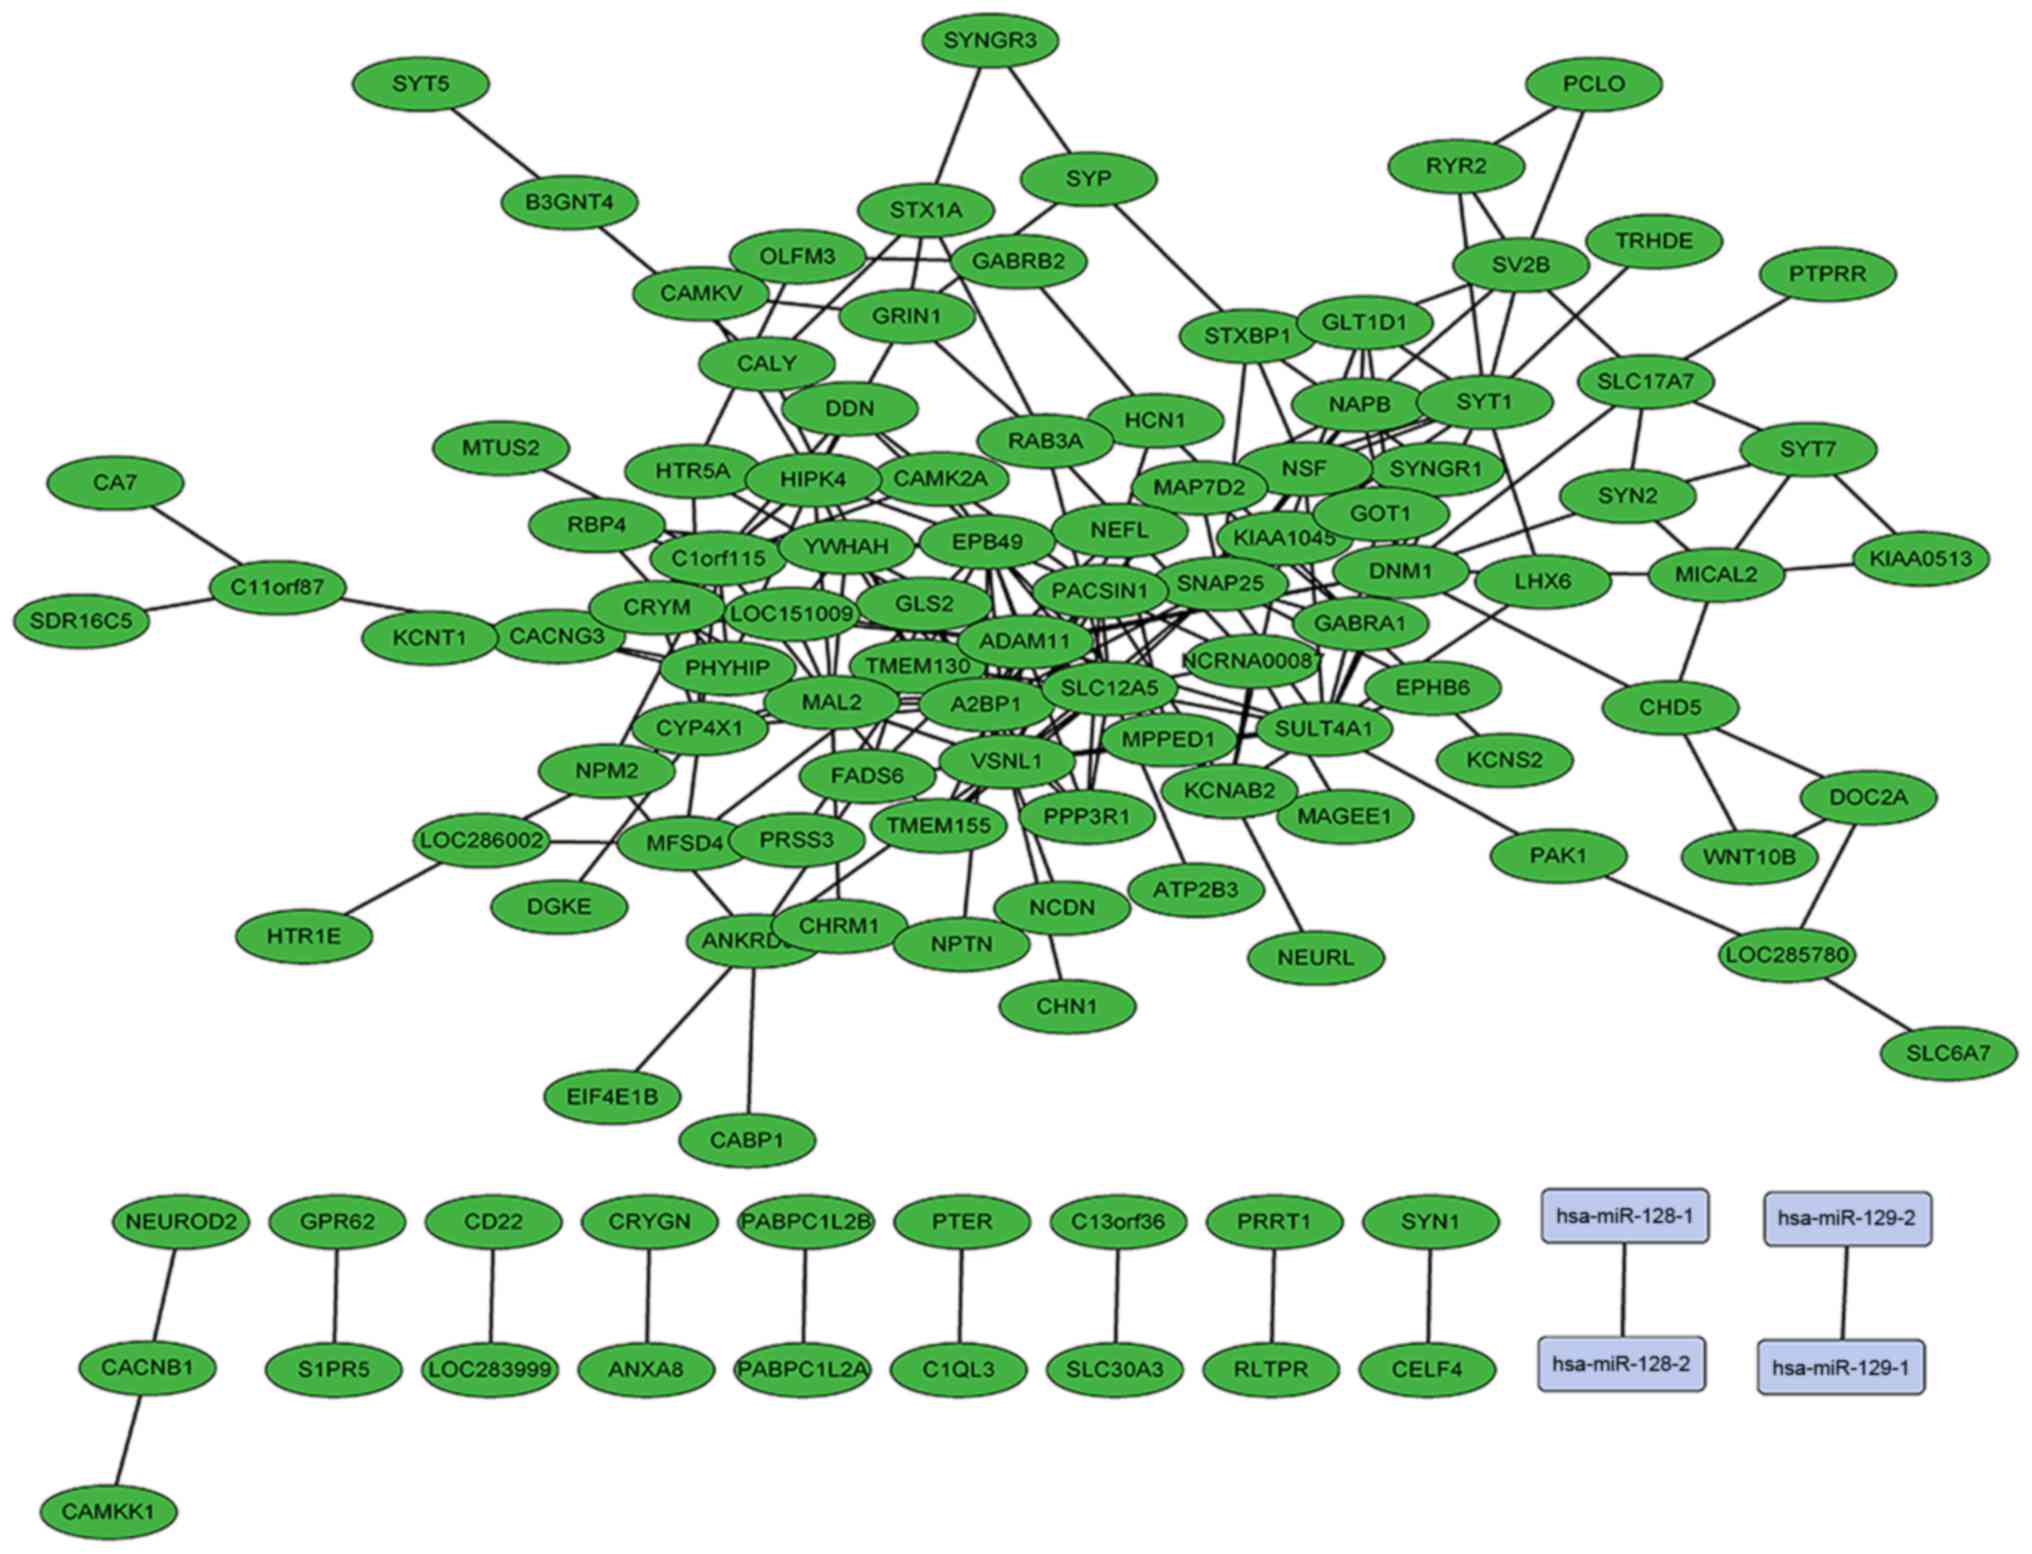 | Figure 4.Network of different expressed mRNAs
and microRNAs constructed using weighted gene co-expression network
analysis in low grade glioma visualized using Cytoscape software.
SLC12A5, MAL2, VSNL1, A2BP1, EPB49, SULT4A1, TMEM130, ADAM11,
SNAP25, C1orf115, DNM1 and SYT1 were central in the network. Green
represents downregulated genes. Lines illustrate the correlations
between genes. miR-128 and miR-129 were involved. miR,
microRNA. |
Functional analysis
The present study identified the top eight GO
biological processes of the five gene modules (Table III), and performed KEGG analysis
(Table IV). The pathway
enrichment analysis combined several physiological and pathological
processes of the nervous system. The genes of the turquoise module
were downregulated in glioma; in addition, GO and KEGG analysis
predicted that these genes were involved in several important
physiological processes in the central nervous system. However, the
brown module included genes, which were upregulated in glioma, and
GO and KEGG analysis showed these were involved in important
pathways, including cell cycle and tumorigenesis.
| Table III.GO enrichment analysis in gene
modules of the top eight significantly enriched biology terms. |
Table III.
GO enrichment analysis in gene
modules of the top eight significantly enriched biology terms.
| Module | P-value | ID | Ontology | Term name |
|---|
| Blue | 0.001965 | GO:0015631 | MF | Tubulin
binding |
| Blue | 0.003507 | GO:0017034 | MF | Rap
guanyl-nucleotide exchange factor activity |
| Blue | 0.008008 | GO:0010008 | CC | Endosome
membrane |
| Blue | 0.009040 | GO:0005768 | CC | Endosome |
| Blue | 0.010111 | GO:0003376 | BP |
Sphingosine-1-phosphate signaling
pathway |
| Blue | 0.010111 | GO:0015693 | BP | Magnesium ion
transport |
| Blue | 0.010111 | GO:0018345 | BP | Protein
palmitoylation |
| Blue | 0.010111 | GO:0031365 | BP | N-terminal protein
amino acid modification |
| Brown | 4.57E-38 | GO:1903047 | BP | Mitotic cell cycle
process |
| Brown | 3.76E-37 | GO:0000278 | BP | Mitotic cell
cycle |
| Brown | 6.10E-37 | GO:0022402 | BP | Cell cycle
process |
| Brown | 1.17E-36 | GO:0007049 | BP | Cell cycle |
| Brown | 6.96E-34 | GO:0007067 | BP | Mitotic nuclear
division |
| Brown | 2.90E-33 | GO:0007059 | BP | Chromosome
segregation |
| Brown | 1.24E-29 | GO:0051301 | BP | Cell division |
| Brown | 4.40E-25 | GO:0005694 | CC | Chromosome |
| Grey | 9.10E-10 | GO:0009888 | BP | Tissue
development |
| Grey | 8.98E-09 | GO:0009887 | BP | Organ
morphogenesis |
| Grey | 1.98E-08 | GO:0005578 | CC | Proteinaceous
extracellular matrix |
| Grey | 2.65E-08 | GO:0048729 | BP | Tissue
morphogenesis |
| Grey | 4.74E-08 | GO:0031012 | CC | Extracellular
matrix |
| Grey | 6.47E-08 | GO:0007389 | BP | Pattern
specification process |
| Grey | 8.30E-08 | GO:0001655 | BP | Urogenital system
development |
| Grey | 1.05E-07 | GO:0060429 | BP | Epithelium
development |
| Turquoise | 5.13E-16 | GO:0007268 | BP | Synaptic
transmission |
| Turquoise | 4.20E-14 | GO:0045202 | CC | Synapse |
| Turquoise | 3.08E-12 | GO:0034220 | BP | Ion transmembrane
transport |
| Turquoise | 3.35E-12 | GO:0006811 | BP | Ion transport |
| Turquoise | 8.37E-11 | GO:0007267 | BP | Cell-cell
signaling |
| Turquoise | 3.69E-10 | GO:0098655 | BP | Cation
transmembrane transport |
| Turquoise | 6.46E-10 | GO:0055085 | BP | Transmembrane
transport |
| Turquoise | 1.53E-09 | GO:0042995 | CC | Cell
projection |
| Yellow | 7.08E-16 | GO:0000184 | BP | Nuclear-transcribed
mRNA catabolic process, nonsense-mediated decay |
| Yellow | 7.60E-15 | GO:0000956 | BP | Nuclear-transcribed
mRNA catabolic process |
| Yellow | 4.44E-14 | GO:0006402 | BP | mRNA catabolic
process |
| Yellow | 1.88E-13 | GO:0006401 | BP | RNA catabolic
process |
| Yellow | 2.09E-13 | GO:0006413 | BP | Translational
initiation |
| Yellow | 2.44E-13 | GO:0006613 | BP | Cotranslational
protein targeting to membrane |
| Yellow | 2.44E-13 | GO:0006614 | BP | SRP-dependent
cotranslational protein targeting to membrane |
| Yellow | 8.38E-13 | GO:0006412 | BP | Translation |
| Table IV.Kyoto Encyclopedia of Genes and
Genomes enrichment analysis of gene modules with the top eight
significantly enriched biology terms. |
Table IV.
Kyoto Encyclopedia of Genes and
Genomes enrichment analysis of gene modules with the top eight
significantly enriched biology terms.
| Module | ID | Description | Gene ratio | P-value |
|---|
| Brown | hsa04110 | Cell cycle | 11/39 | <0.01 |
| Brown | hsa04114 | Oocyte meiosis | 7/39 | <0.01 |
| Brown | hsa04914 |
Progesterone-mediated oocyte
maturation | 6/39 | <0.01 |
| Brown | hsa04115 | p53 signaling
pathway | 5/39 | <0.01 |
| Turquoise | hsa04080 | Synaptic vesicle
cycle | 59/558 | <0.01 |
| Turquoise | hsa04020 | Glutamatergic
synapse | 51/558 | <0.01 |
| Turquoise | hsa04921 | Retrograde
endocannabinoid signaling | 47/558 | <0.01 |
| Turquoise | hsa04024 | Morphine
addiction | 47/558 | <0.01 |
| Turquoise | hsa04010 | GABAergic
synapse | 45/558 | <0.01 |
| Turquoise | hsa04724 | Calcium signaling
pathway | 43/558 | <0.01 |
| Turquoise | hsa04723 | Oxytocin signaling
pathway | 40/558 | <0.01 |
| Turquoise | hsa04728 | Circadian
entrainment | 38/558 | <0.01 |
| Turquoise | hsa04728 | Circadian
entrainment | 38/558 | <0.01 |
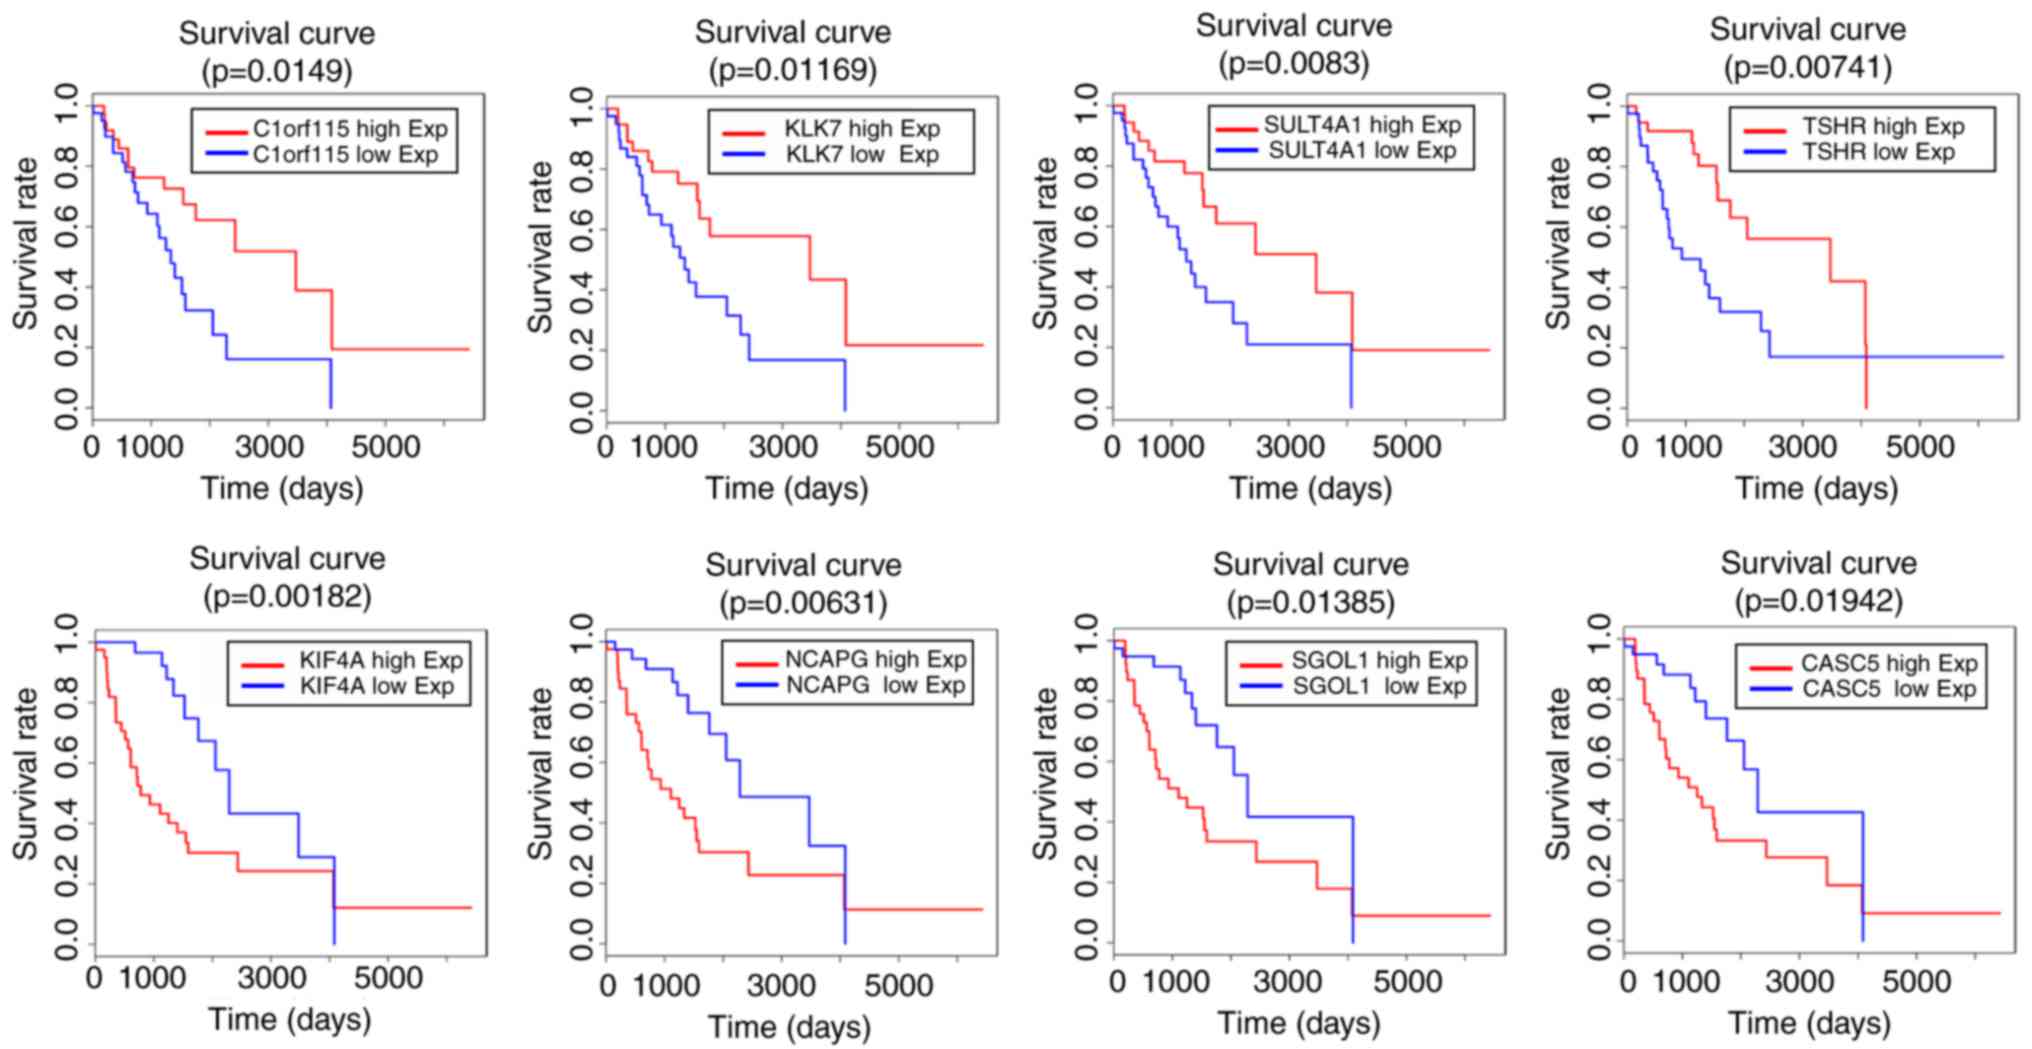
Clinical biomarkers
Finally, the present study identified the gene
symbols associated with clinical outcome (Table V). A total of eight prognostic RNA
signatures were found (Fig. 5).
C1orf115, CACS5, CDC45, DLL3, EPR1, HOXD9, KIF20, KIF4A, KIF14,
KLK7, MELK, NCAPG, PBK, RASL1, SGOL1, SNAP25, SULT4A1, TMEM130,
TSHR and VEPH1 were significantly associated with clinical survival
rates (P<0.05). In addition, certain genes were associated with
LGG patient prognosis (0.05<P<0.1), including A2BP, AURKB,
CRHR2, HIPK4, HJURP, MIK67, MYBL2, RRM2, SPARC, TOP2A and VSNL1.
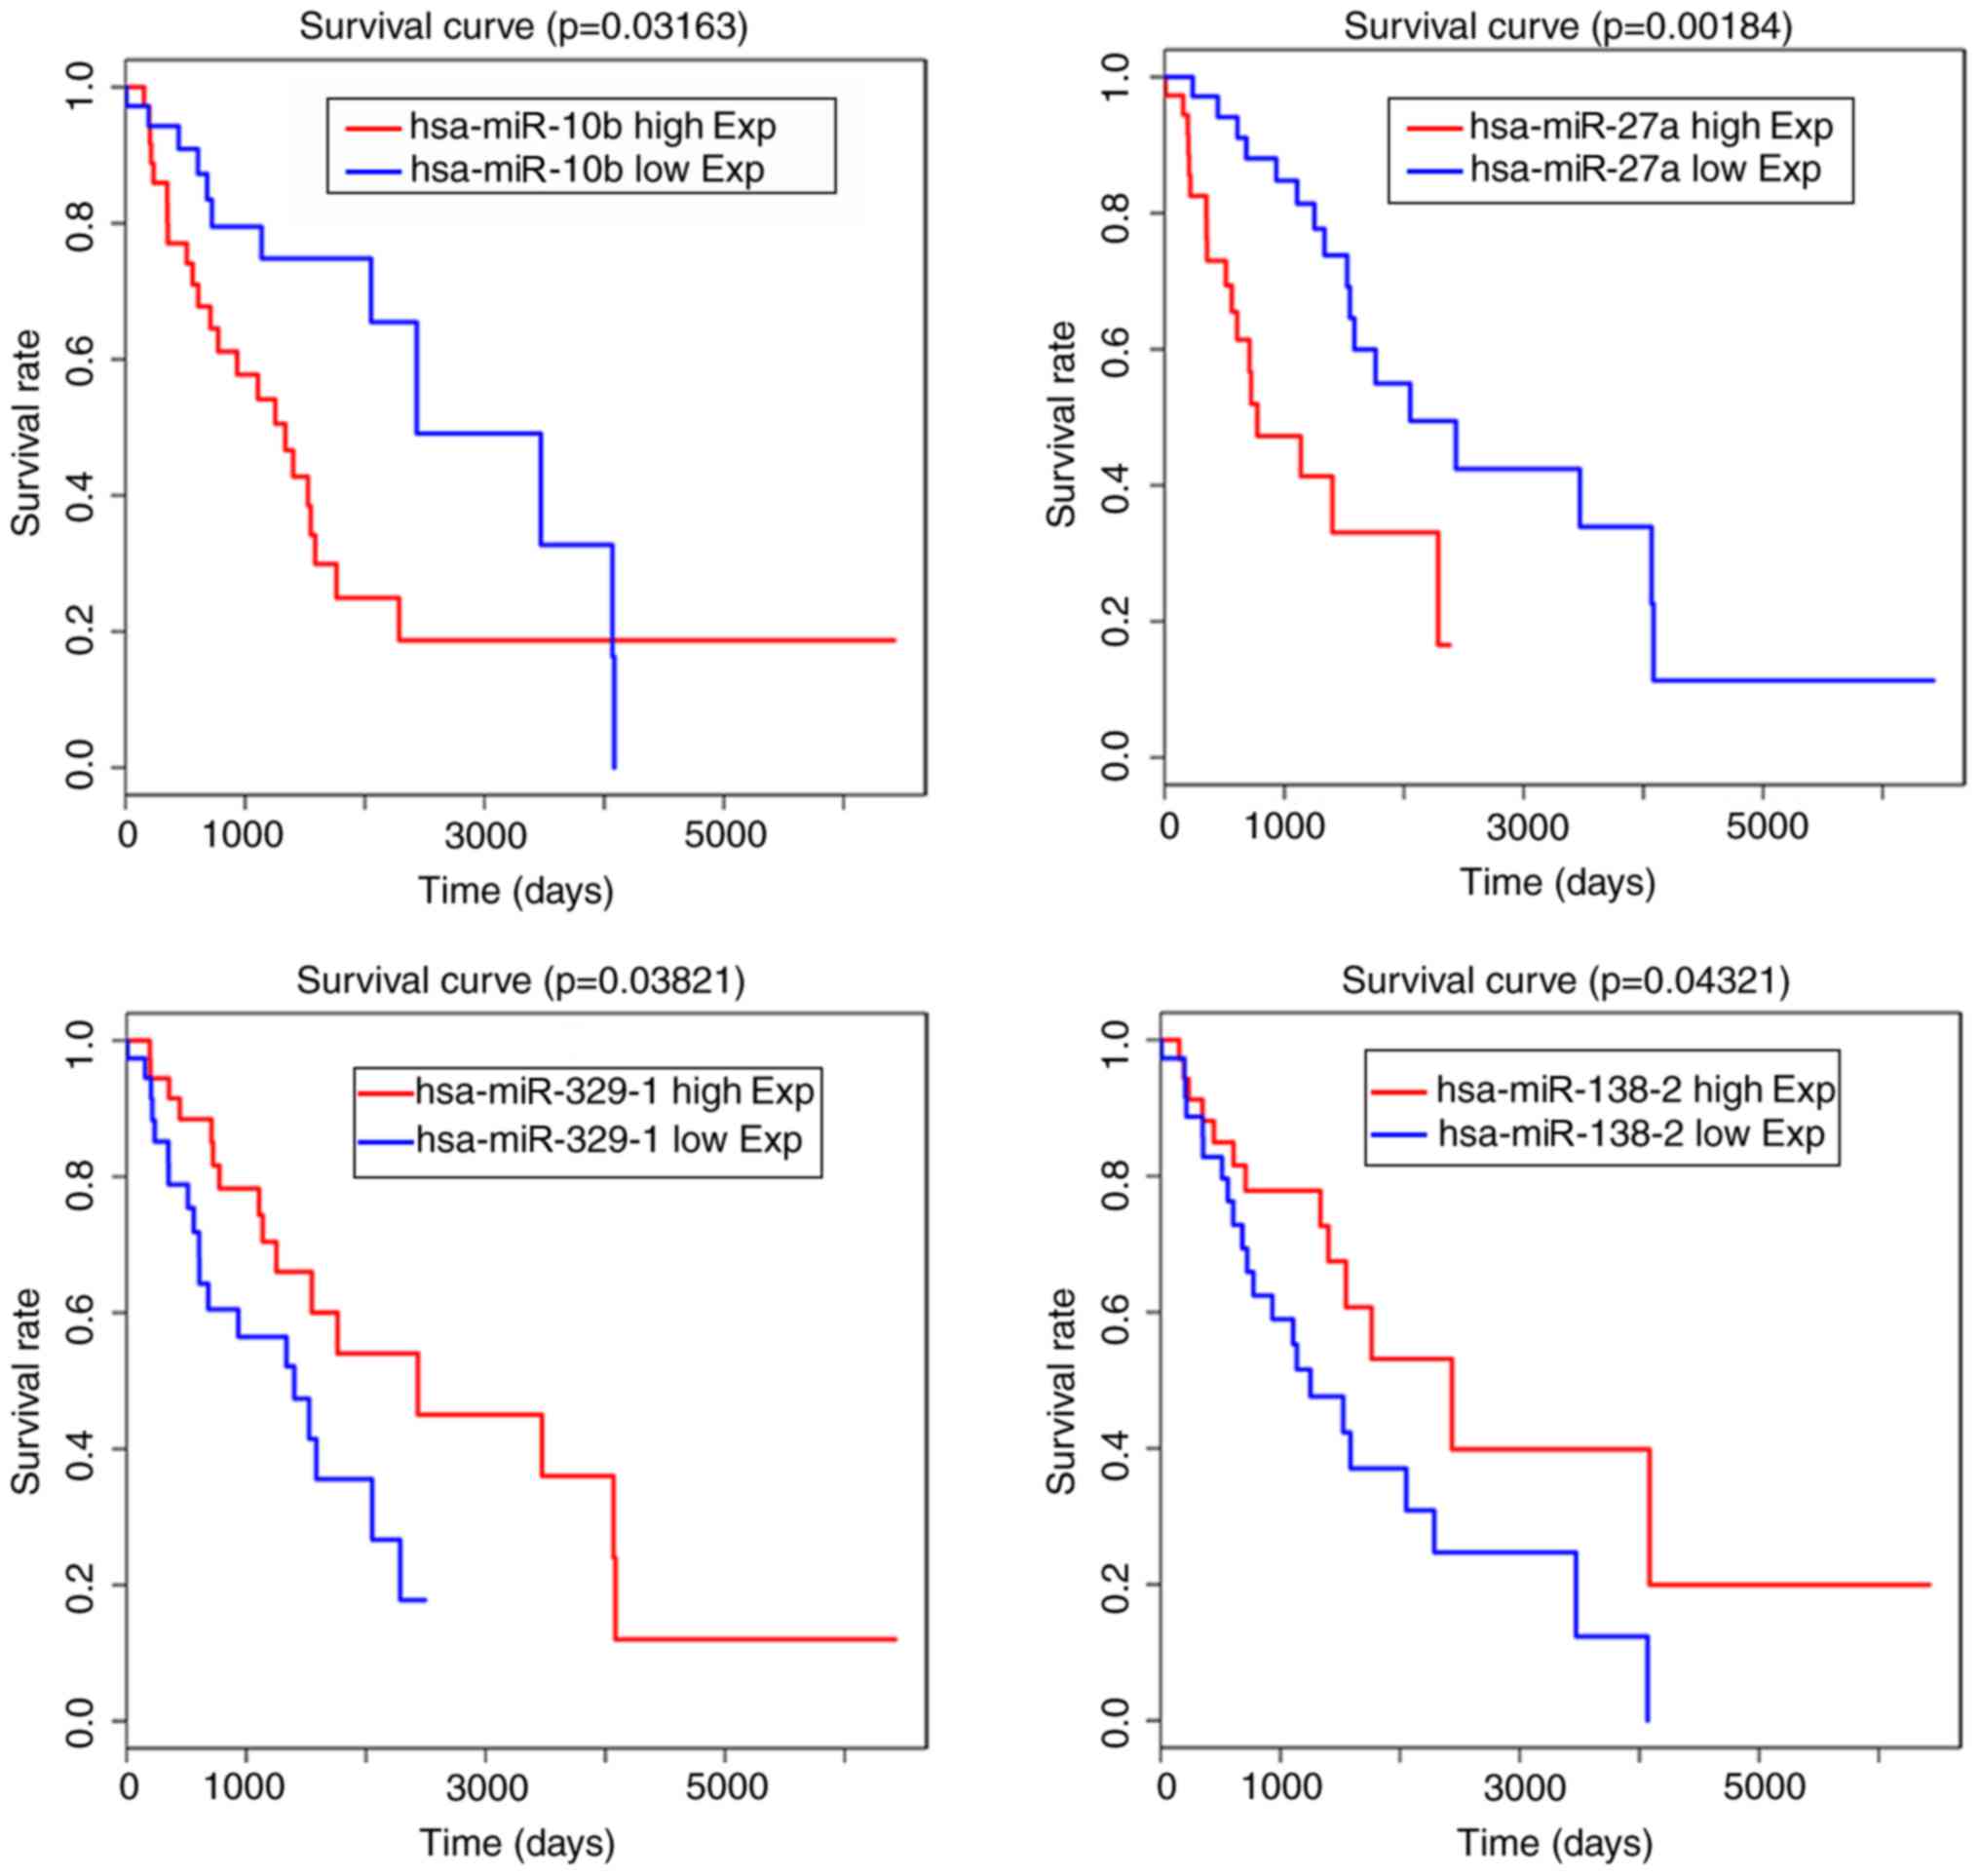
When the miRNAseq data and clinical information of samples were
combined, it was found that has-miR-10b, has-miR-27a,
has-miR-138-2, has-miR-138-1, has-miR-139, has-miR-329-1,
has-miR-412, has-miR-431, has-miR-495 and has-miR-656 were also
closely associated with LGG patient outcome and may be prognostic
miRNA signatures (Table VI). The
survival curves of has-miR-10b, has-miR-27a, has-miR-138-2 and
has-miR-329-1 are shown in Fig.
6.
| Table V.Gene symbols associated with improved
clinical outcome. |
Table V.
Gene symbols associated with improved
clinical outcome.
| Gene | P-value |
|---|
| Downregulated |
|
|
KIF4A | 0.01 |
|
NCAPG | 0.01 |
|
SGOL1 | 0.01 |
|
CASC5 | 0.02 |
|
CDC45 | 0.02 |
|
KIF20A | 0.02 |
|
KIF14 | 0.03 |
|
PBK | 0.03 |
|
EPR1 | 0.04 |
|
MELK | 0.04 |
|
HOXD9 | 0.05 |
|
KIF2C | 0.05 |
|
BUB1B | 0.06 |
|
ESPL1 | 0.06 |
|
RRM2 | 0.06 |
|
HJURP | 0.07 |
|
TOP2A | 0.08 |
|
AURKB | 0.09 |
|
MKI67 | 0.09 |
|
MYBL2 | 0.09 |
| Upregulated |
|
|
C1orf115 | 0.01 |
|
KLK7 | 0.01 |
|
SULT4A1 | 0.01 |
|
TSHR | 0.01 |
|
BMP2 | 0.02 |
|
VEPH1 | 0.02 |
|
RASAL1 | 0.03 |
|
SNAP25 | 0.03 |
|
DLL3 | 0.04 |
|
TMEM130 | 0.04 |
|
HEY2 | 0.05 |
|
A2BP1 | 0.05 |
|
HIPK4 | 0.06 |
|
CRHR2 | 0.08 |
|
SPARC | 0.08 |
|
SLC12A5 | 0.10 |
|
VSNL1 | 0.10 |
| Table VI.miRs associated with improved
clinical outcome. |
Table VI.
miRs associated with improved
clinical outcome.
| miR | P-value |
|---|
| Downregulated |
|
|
has-miR-10b | 0.03 |
|
has-miR-27a | 0.01 |
| Upregulated |
|
|
has-miR-138–2 | 0.04 |
|
has-miR-138–1 | 0.02 |
|
has-miR-139 | 0.02 |
|
has-miR-329–1 | 0.04 |
|
has-miR-412 | 0.07 |
|
has-miR-431 | 0.04 |
|
has-miR-495 | 0.10 |
|
hsa-miR-656 | 0.09 |
In the present study, miR-10b and miR-27a were
expressed at high levels in glioma tissue, and the expression
levels were associated with poor overall survival rates in patients
with high grade gliomas. A number of downregulated miRNAs,
including has-miR-138-2, has-miR-138-1, has-miR-139 and
has-miR-329-1, were also associated with outcome in patients with
glioma.
Discussion
Malignant gliomas are the most common and
life-threatening type of primary intracranial tumor, which include
anaplastic astrocytoma, anaplastic oligodendroglioma and GBM.
Several efforts have been made to identify the key regulatory genes
or molecules in these types of malignant tumor. However, to the
best of our knowledge, few studies have been performed to predict
the prognosis of grade III gliomas, and no reliable biomarkers for
the detection and risk stratification of gliomas have been
identified.
BUB1B/BubR1, a protein that monitors proper spindle
microtubule attachment to the kinetochore, has been found to be a
promising candidate for targeted therapies in GBM (12,13).
In the present study, BUB1B was overexpressed in glioma tissues,
and was associated with the clinical outcome of patients with
glioma (P=0.06). Patients with a high expression of BUB1B had
shorter survival rates. In the co-expression network, BUB1B was
located centrally in the network, and the results suggested that
BUB1B may be a potential target for high grade glioma.
The kinesin motor KIFC1 has been suggested as a
potential chemotherapeutic target due to its importance in the
clustering of multiple centrosomes found in cancer cells (14). However, the function of KIFC1 in
high grade gliomas remain to be elucidated. The present study found
that KIFC1 was upregulated in grade III glioma tissues and located
centrally in the network. Further investigations are required to
annotate its effect on brain tumors.
Topoisomerase 2A (TOP2A) is overexpressed in
proliferating cells (15,16). The expression of TOP2A has been
correlated with aggressive and highly proliferative types of cancer
(17,18). In glioma, the levels of TOP2A have
been reported as a proliferation marker in association with the
Ki-67 index (19). The protein
levels of TOP2A were correlated with survival rates in two previous
studies, which noted that patients with improved survival rates had
lower mean levels of TOP2A (20,21).
The data revealed that temozolomide inhibited the expression of
TOP2A. In the present study, TOP2A was associated with the clinical
outcome of patients with glioma (P=0.08) and may be a hub gene in
gliomagenesis.
As with BUB1B, BUB1 is a major mitotic spindle
assembly checkpoint gene and significantly correlates with glioma
grade and survival rates (22). In
the present study, the patients with overexpression of the BUB1
gene had a shorter survival rate (P=0.1). In colorectal cancer,
mutation of the BUB1 gene was found to be associated with lymph
node metastasis and lower relapse-free survival rates following
surgery (23). Further
investigations may be required to identify whether BUB1 mutations
are important in the glioma process. In addition, the expression of
ESPL1 in human glioma and its possible correlations with
histoclinical features remains to be fully elucidated, however,
evidence suggests that ESPL1 is a candidate oncogene in breast
cancer and lung cancer (24,25).
SLC12A5 has been found have an important oncogenic
role in colorectal carcinogenesis; its overexpression can be an
independent prognostic factor for patients, and the mutation
frequency of SLC12A5 may have potential oncogenic effects in colon
cancer (26,27). However, the functional
characterization of SLC12A5 in brain tumors remains to be fully
elucidated, and few investigations have been performed. The present
study found that patients with a high expression of SLC12A5 showed
improved prognosis (P=0.11). Further investigations are required to
clarify the function of SLC12A5 in glioma and other brain
tumors.
VSNL1 is a known tumor-suppressor gene regulating
cell migration in several types of cancer. It is also downregulated
in GBM (28). The data obtained in
the present study suggested that the overexpression of VSNAL1 may
be associated with increased survival rate (P=0.10). GO annotation
revealed that VSNL1 is involved in several normal neuron
physiological functions. Current data also indicate that VSNAL1 may
be associated with schizophrenia and frontal cortical function
(29).
SULT4A1 encoded protein is a brain-specific
sulfotransferase, which is widely expressed in the majority of
human brain compartments and may be involved in the metabolism of
neurotransmitters (30). The
SULT4A1 gene, located in the frequently deleted 22q13.3 chromosomal
region, is downregulated in ependymoma (31,32).
The present study showed that SULT4A1 was downregulated in the
glioma group (log2foldchange=−3.15; P<0.05). In addition, a high
expression of SULT4A1 was associated with increased survival rates,
compared with a low expression. Therefore, SULT4A1 may be important
in tumorigenesis and as a prognostic molecule in grade III
gliomas.
Few studies have been performed on SNAP25 in glioma.
SNAP-25 is a t-SNARE protein, which is encoded by the SNAP25 gene
in humans (33). SNAP-25 is
considered to account for the specificity of membrane fusion and to
directly execute fusion by forming a tight complex, which brings
the synaptic vesicle and plasma membranes together (34). In the present study, SNAP25 was a
prognostic factor in patients with high grade glioma (P=0.03). The
overexpression of SNAP25 predicted increased survival rates,
compared with glioma patients with a lower expression of
SNAP25.
A2BP1 serves to regulate the alternative splicing of
TPM1 to promote cytoskeletal organization and terminal
differentiation, and the loss of A2BP1 contributes to the
tumorigenesis in GBM by causing compromised terminal
differentiation (35). The present
study found that A2BP1 was downregulated in grade III gliomas, and
that a high expression level of A2BP1 was predictive of longer
survival rates (P=0.05).
In the present study, CASC5 was identified as a
prognostic factor in high grade glioma (P=0.02). CASC5 is a
component of the kinetochore. It is involved in microtubule
attachment to chromosome centromeres and in activation of the
spindle checkpoint during mitosis. The CASC5 gene is upregulated in
the regions of cell proliferation surrounding the ventricles during
fetal brain development (36). In
GBM, the expression level of CASC5 is higher, compared with that in
the normal brain (37).
Current data suggests that the KLK7 protein offers
potential as a prognostic marker of patient survival rates in GBM,
with elevated expression levels of KLK7 associated with poor
patient survival rates (38,39).
By contrast, the present study found that KLK7 was downregulated in
glioma (foldchange=−3.98; P<0.01), and the decline in the
expression of KLK7 was associated with poor patient survival rates
in high grade glioma (P=0.01). Previous evidence suggests that KLK7
is differentially regulated in a variety of tumors, and is
important in the normal physiology of the skin, particularly in
epidermal homeostasis. The majority of evidence indicates that
overexpression of KLK7 is associated with poor patient survival
rates or increased tumor cell proliferation (40). However, the present study revealed
that the expression of KLK7 was downregulated in prostate cancer
and that the low expression was closely correlated with advanced
disease stage, predictive of a poor prognosis (41). Further investigations are required
in the future to identify the role of KLK7 in brain glioma.
The present studies found that BMP2, DLL3 and HEY2
were overexpressed in glioma (42,43).
In addition, the elevation of these neurogenesis-associated genes
was associated with an increase survival rate in patients with high
grade glioma. Current evidence suggests that
neurogenesis-associated genes are expressed at high levels in
patients with glioma, including BMP2 (43), DLL3 and HEY2, which are important
in neurogenesis and may preferentially lead to the terminal
differentiation of malignant cells (42).
The present study also observed that tumors with
higher expression levels of HJURP were associated with poor
prognosis. A previous study demonstrated that the overexpression of
HJURP may be important in the maintenance of highly proliferative
cells in glioma, and may be an independent prognostic factor, or a
potential therapeutic target, for patients with high grade glioma
(44).
According to the results of the present study, the
expression of HOXD9 was markedly increased in high grade glioma,
and the higher expression of HOXD9 was associated with poor
survival rates in patients with glioma. HOXD9 was expressed at a
low level in the normal brain, however, in glioma tissues and
glioma cancer stem cells, expression was higher, compared with that
in normal brain samples. Therefore, HOXD9 may be a novel marker of
cell proliferation and survival rates in glioma, and a potential
therapeutic target (45).
Consistent with the present study, the gene
expression levels of KIF2C, KIF14, MELK and AURKB were higher in
glioma samples, compared with those in normal brain tissues. The
expression of these genes was associated with histopathological
grades or invasiveness of glioma, and may be a candidate prognostic
marker for human glioma (46–48).
It has been shown that the increased expression of
miR-10b in glioma is associated with poorer prognosis (49). In the present study, has-miR-10b,
has-miR-27a, has-miR-138-2, has-miR-138-1, has-miR-139,
has-miR-329-1, has-miR-431, has-miR-495 and has-miR-656 were
associated with the gliomagenesis of high grade gliomas. miR-128
and miR-129 were involved in the co-expression network, however,
they were not associated with the hub genes in the network. miR-128
and miR-129, are important regulators of proliferation and can
promote the apoptosis of glioma (50,51).
The mechanisms underlying the changes of important miRNAs in grade
III glioma require further investigation.
In conclusion, using biostatistics analysis, the
present study provided improved understanding of how to identify
the mechanisms underlying the tumorigenesis of high grade gliomas.
The results predicted that two factors involved in the glioma
deterioration process, the downregulated genes and upregulated
genes, are important. A number of these genes were found to be
closely associated with clinical prognosis.
Acknowledgements
The authors would like to acknowledge TCGA pilot
project (established by NCI and NHGRI), providing the genomic data
and clinical data of LGG. This study was supported by the Lanzhou
Science and Technology Bureau Project (grant no.
2013–3-27,2015-3-86), the Gansu Province Health Industry Research
Project (grant no. GSWSKY-2015-58), the National Natural Science
Foundation of China (grant no. 81501116) and the Doctoral Research
Fund of Lanzhou University Second Hospital (grant no.
ynbskyjj2015-1-02).
References
|
1
|
Barbano R, Palumbo O, Pasculli B, Galasso
M, Volinia S, D'Angelo V, Icolaro N, Coco M, Dimitri L, Graziano P,
et al: A miRNA signature for defining aggressive phenotype and
prognosis in gliomas. PLoS One. 9:e1089502014. View Article : Google Scholar : PubMed/NCBI
|
|
2
|
Pessina F, Navarria P, Cozzi L, Ascolese
AM, Simonelli M, Santoro A, Tomatis S, Riva M, Fava E, Scorsetti M
and Bello L: Value of surgical resection in patients with newly
diagnosed grade III glioma treated in a multimodal approach:
Surgery, chemotherapy and radiotherapy. Ann Surg Oncol.
23:3040–3046. 2016. View Article : Google Scholar : PubMed/NCBI
|
|
3
|
Haas BE, Horvath S, Pietiläinen KH, Cantor
RM, Nikkola E, Weissglas-Volkov D, Rissanen A, Civelek M,
Cruz-Bautista I, Riba L, et al: Adipose co-expression networks
across Finns and Mexicans identify novel triglyceride-associated
genes. BMC Med Genomics. 5:612012. View Article : Google Scholar : PubMed/NCBI
|
|
4
|
Silverman EK and Loscalzo J: Network
medicine approaches to the genetics of complex diseases. Discov
Med. 14:143–152. 2012.PubMed/NCBI
|
|
5
|
Zhang B and Horvath S: A general framework
for weighted gene co-expression network analysis. Stat Appl Genet
Mol Biol. 4:Article172005. View Article : Google Scholar : PubMed/NCBI
|
|
6
|
Chen Y, Zhu J, Lum PY, Yang X, Pinto S,
MacNeil DJ, Zhang C, Lamb J, Edwards S, Sieberts SK, et al:
Variations in DNA elucidate molecular networks that cause disease.
Nature. 452:429–435. 2008. View Article : Google Scholar : PubMed/NCBI
|
|
7
|
Langfelder P and Horvath S: WGCNA: An R
package for weighted correlation network analysis. BMC
Bioinformatics. 9:5592008. View Article : Google Scholar : PubMed/NCBI
|
|
8
|
Voineagu I, Wang X, Johnston P, Lowe JK,
Tian Y, Horvath S, Mill J, Cantor RM, Blencowe BJ and Geschwind DH:
Transcriptomic analysis of autistic brain reveals convergent
molecular pathology. Nature. 474:380–384. 2011. View Article : Google Scholar : PubMed/NCBI
|
|
9
|
Zhao W, Langfelder P, Fuller T, Dong J, Li
A and Hovarth S: Weighted gene coexpression network analysis: State
of the art. J Biopharm Stat. 20:281–300. 2010. View Article : Google Scholar : PubMed/NCBI
|
|
10
|
Cancer Genome Atlas Research Network, .
Weinstein JN, Collisson EA, Mills GB, Shaw KR, Ozenberger BA,
Ellrott K, Shmulevich I, Sander C and Stuart JM: The cancer genome
atlas pan-cancer analysis project. Nat Genet. 45:1113–1120. 2013.
View Article : Google Scholar : PubMed/NCBI
|
|
11
|
Langfelder P and Horvath S: Eigengene
networks for studying the relationships between co-expression
modules. BMC Syst Biol. 1:542007. View Article : Google Scholar : PubMed/NCBI
|
|
12
|
Ding Y, Hubert CG, Herman J, Corrin P,
Toledo CM, Skutt-Kakaria K, Vazquez J, Basom R, Zhang B, Risler JK,
et al: Cancer-specific requirement for BUB1B/BUBR1 in human brain
tumor isolates and genetically transformed cells. Cancer Discov.
3:198–211. 2013. View Article : Google Scholar : PubMed/NCBI
|
|
13
|
Venere M, Miller TE and Rich JN: Mitotic
control of cancer stem cells. Cancer Discov. 3:141–144. 2013.
View Article : Google Scholar : PubMed/NCBI
|
|
14
|
Xiao YX and Yang WX: KIFC1: A promising
chemotherapy target for cancer treatment? Oncotarget.
7:48656–48670. 2016. View Article : Google Scholar : PubMed/NCBI
|
|
15
|
Stevnsner T and Bohr VA: Studies on the
role of topoisomerases in general, gene- and strand-specific DNA
repair. Carcinogenesis. 14:1841–1850. 1993. View Article : Google Scholar : PubMed/NCBI
|
|
16
|
Watt PM and Hickson ID: Structure and
function of type II DNA topoisomerases. Biochem J. 303:681–695.
1994. View Article : Google Scholar : PubMed/NCBI
|
|
17
|
Kasahara K, Fujiwara Y, Sugimoto Y, Nishio
K, Tamura T, Matsuda T and Saijo N: Determinants of response to the
DNA topoisomerase II inhibitors doxorubicin and etoposide in human
lung cancer cell lines. J Natl Cancer Inst. 84:113–118. 1992.
View Article : Google Scholar : PubMed/NCBI
|
|
18
|
Shpitz B, Bomstein Y, Zehavi T, Bernheim
J, Liverant S, Kaufman Z, Buklan G and Klein E: Topoisomerase
IIalpha expression in ductal carcinoma in situ of the breast: A
preliminary study. Hum Pathol. 31:1249–1254. 2000. View Article : Google Scholar : PubMed/NCBI
|
|
19
|
Taniguchi K, Wakabayashi T, Yoshida T,
Mizuno M, Yoshikawa K, Kikuchi A, Nakashima N and Yoshida J:
Immunohistochemical staining of DNA topoisomerase IIalpha in human
gliomas. J Neurosurg. 91:477–482. 1999. View Article : Google Scholar : PubMed/NCBI
|
|
20
|
Arivazhagan A, Kumar DM, Sagar V, Patric
IR, Sridevi S, Thota B, Srividya MR, Prasanna K, Thennarasu K,
Mondal N, et al: Higher topoisomerase 2 alpha gene transcript
levels predict better prognosis in GBM patients receiving
temozolomide chemotherapy: Identification of temozolomide as a
TOP2A inhibitor. J Neurooncol. 107:289–297. 2012. View Article : Google Scholar : PubMed/NCBI
|
|
21
|
Holden JA and Townsend JJ: DNA
topoisomerase II-alpha as a proliferation marker in astrocytic
neoplasms of the central nervous system: Correlation with MIB1
expression and patient survival. Mod Pathol. 12:1094–1100.
1999.PubMed/NCBI
|
|
22
|
Bie L, Zhao G, Cheng P, Rondeau G,
Porwollik S, Ju Y, Xia XQ and McClelland M: The accuracy of
survival time prediction for patients with glioma is improved by
measuring mitotic spindle checkpoint gene expression. PLoS One.
6:e256312011. View Article : Google Scholar : PubMed/NCBI
|
|
23
|
Shichiri M, Yoshinaga K, Hisatomi H,
Sugihara K and Hirata Y: Genetic and epigenetic inactivation of
mitotic checkpoint genes hBUB1 and hBUBR1 and their relationship to
survival. Cancer Res. 62:13–17. 2002.PubMed/NCBI
|
|
24
|
Finetti P, Guille A, Adelaide J, Birnbaum
D, Chaffanet M and Bertucci F: ESPL1 is a candidate oncogene of
luminal B breast cancers. Breast Cancer Res Treat. 147:51–59. 2014.
View Article : Google Scholar : PubMed/NCBI
|
|
25
|
Zhang C, Min L, Zhang L, Ma Y, Yang Y and
Shou C: Combined analysis identifies six genes correlated with
augmented malignancy from non-small cell to small cell lung cancer.
Tumour Biol. 37:2193–2207. 2016. View Article : Google Scholar : PubMed/NCBI
|
|
26
|
Yu C, Yu J, Yao X, Wu WK, Lu Y, Tang S, Li
X, Bao L, Li X, Hou Y, et al: Discovery of biclonal origin and a
novel oncogene SLC12A5 in colon cancer by single-cell sequencing.
Cell Res. 24:701–712. 2014. View Article : Google Scholar : PubMed/NCBI
|
|
27
|
Xu L, Li X, Cai M, Chen J, Li X, Wu WK,
Kang W, Tong J, To KF, Guan XY, et al: Increased expression of
Solute carrier family 12 member 5 via gene amplification
contributes to tumour progression and metastasis and associates
with poor survival in colorectal cancer. Gut. 65:635–646. 2016.
View Article : Google Scholar : PubMed/NCBI
|
|
28
|
Barbagallo D, Condorelli A, Ragusa M,
Salito L, Sammito M, Banelli B, Caltabiano R, Barbagallo G, Zappalà
A, Battaglia R, et al: Dysregulated miR-671-5p/CDR1-AS/CDR1/VSNL1
axis is involved in glioblastoma multiforme. Oncotarget.
7:4746–4759. 2016. View Article : Google Scholar : PubMed/NCBI
|
|
29
|
Braunewell KH, Dwary AD, Richter F, Trappe
K, Zhao C, Giegling I, Schönrath K and Rujescu D: Association of
VSNL1 with schizophrenia, frontal cortical function, and biological
significance for its gene product as a modulator of cAMP levels and
neuronal morphology. Transl Psychiatry. 1:e222011. View Article : Google Scholar : PubMed/NCBI
|
|
30
|
Liyou NE, Buller KM, Tresillian MJ, Elvin
CM, Scott HL, Dodd PR, Tannenberg AE and McManus ME: Localization
of a brain sulfotransferase, SULT4A1, in the human and rat brain:
An immunohistochemical study. J Histochem Cytochem. 51:1655–1664.
2003. View Article : Google Scholar : PubMed/NCBI
|
|
31
|
Modena P, Lualdi E, Facchinetti F, Veltman
J, Reid JF, Minardi S, Janssen I, Giangaspero F, Forni M,
Finocchiaro G, et al: Identification of tumor-specific molecular
signatures in intracranial ependymoma and association with clinical
characteristics. J Clin Oncol. 24:5223–5233. 2006. View Article : Google Scholar : PubMed/NCBI
|
|
32
|
Dubuc AM, Northcott PA, Mack S, Witt H,
Pfister S and Taylor MD: The genetics of pediatric brain tumors.
Curr Neurol Neurosci Rep. 10:215–223. 2010. View Article : Google Scholar : PubMed/NCBI
|
|
33
|
Maglott DR, Feldblyum TV, Durkin AS and
Nierman WC: Radiation hybrid mapping of SNAP PCSK2, and THBD (human
chromosome 20p). Mamm Genome. 7:400–401. 1996. View Article : Google Scholar : PubMed/NCBI
|
|
34
|
Rizo J and Südhof TC: Snares and Munc18 in
synaptic vesicle fusion. Nat Rev Neurosci. 3:641–653. 2002.
View Article : Google Scholar : PubMed/NCBI
|
|
35
|
Hu J, Ho AL, Yuan L, Hu B, Hua S, Hwang
SS, Zhang J, Hu T, Zheng H, Gan B, et al: From the cover:
Neutralization of terminal differentiation in gliomagenesis. Proc
Natl Acad Sci USA. 110:14520–14527. 2013; View Article : Google Scholar : PubMed/NCBI
|
|
36
|
Genin A, Desir J, Lambert N, Biervliet M,
Van Der Aa N, Pierquin G, Killian A, Tosi M, Urbina M, Lefort A, et
al: Kinetochore KMN network gene CASC5 mutated in primary
microcephaly. Hum Mol Genet. 21:5306–5317. 2012. View Article : Google Scholar : PubMed/NCBI
|
|
37
|
Akiyama Y, Komiyama M, Miyata H, Yagoto M,
Ashizawa T, Iizuka A, Oshita C, Kume A, Nogami M, Ito I, et al:
Novel cancer-testis antigen expression on glioma cell lines derived
from high-grade glioma patients. Oncol Rep. 31:1683–1690. 2014.
View Article : Google Scholar : PubMed/NCBI
|
|
38
|
Prezas P, Scorilas A, Yfanti C, Viktorov
P, Agnanti N, Diamandis E and Talieri M: The role of human tissue
kallikreins 7 and 8 in intracranial malignancies. Biol Chem.
387:1607–1612. 2006. View Article : Google Scholar : PubMed/NCBI
|
|
39
|
Drucker KL, Gianinni C, Decker PA,
Diamandis EP and Scarisbrick IA: Prognostic significance of
multiple kallikreins in high-grade astrocytoma. BMC Cancer.
15:5652015. View Article : Google Scholar : PubMed/NCBI
|
|
40
|
Walker F, Nicole P, Jallane A,
Soosaipillai A, Mosbach V, Oikonomopoulou K, Diamandis EP, Magdolen
V and Darmoul D: Kallikrein-related peptidase 7 (KLK7) is a
proliferative factor that is aberrantly expressed in human colon
cancer. Biol Chem. 395:1075–1086. 2014. View Article : Google Scholar : PubMed/NCBI
|
|
41
|
Zhang CY, Zhu Y, Rui WB, Dai J and Shen
ZJ: Expression of kallikrein-related peptidase 7 is decreased in
prostate cancer. Asian J Androl. 17:106–110. 2015. View Article : Google Scholar : PubMed/NCBI
|
|
42
|
Freije WA, Castro-Vargas FE, Fang Z,
Horvath S, Cloughesy T, Liau LM, Mischel PS and Nelson SF: Gene
expression profiling of gliomas strongly predicts survival. Cancer
Res. 64:6503–6510. 2004. View Article : Google Scholar : PubMed/NCBI
|
|
43
|
Zhang X, Wu J, Li X, Fu L, Gao D, Bai H
and Liu X: Effects of recombinant human bone morphogenic protein-2
and hyaluronic acid on invasion of brain glioma in vivo. Zhonghua
Yi Xue Za Zhi. 82:90–93. 2002.(In Chinese). PubMed/NCBI
|
|
44
|
Valente V, Serafim RB, de Oliveira LC,
Adorni FS, Torrieri R, Tirapelli DP, Espreafico EM, Oba-Shinjo SM,
Marie SK, Paçó-Larson ML and Carlotti CG Jr: Modulation of HJURP
(Holliday Junction-Recognizing Protein) levels is correlated with
glioblastoma cells survival. PLoS One. 8:e622002013. View Article : Google Scholar : PubMed/NCBI
|
|
45
|
Tabuse M, Ohta S, Ohashi Y, Fukaya R,
Misawa A, Yoshida K, Kawase T, Saya H, Thirant C, Chneiweiss H, et
al: Functional analysis of HOXD9 in human gliomas and glioma cancer
stem cells. Mol Cancer. 10:602011. View Article : Google Scholar : PubMed/NCBI
|
|
46
|
Bie L, Zhao G, Wang YP and Zhang B:
Kinesin family member 2C (KIF2C/MCAK) is a novel marker for
prognosis in human gliomas. Clin Neurol Neurosurg. 114:356–360.
2012. View Article : Google Scholar : PubMed/NCBI
|
|
47
|
Gu C, Banasavadi-Siddegowda YK, Joshi K,
Nakamura Y, Kurt H, Gupta S and Nakano I: Tumor-specific activation
of the C-JUN/MELK pathway regulates glioma stem cell growth in a
p53-dependent manner. Stem Cells. 31:870–881. 2013. View Article : Google Scholar : PubMed/NCBI
|
|
48
|
Wang Q, Wang L, Li D, Deng J, Zhao Z, He
S, Zhang Y and Tu Y: Kinesin family member 14 is a candidate
prognostic marker for outcome of glioma patients. Cancer Epidemiol.
37:79–84. 2013. View Article : Google Scholar : PubMed/NCBI
|
|
49
|
Zhang X, Cheng J, Fu L and Li Q:
Overexpression of tissue microRNA10b may help predict glioma
prognosis. J Clin Neurosci. 29:59–63. 2016. View Article : Google Scholar : PubMed/NCBI
|
|
50
|
Chen X, Zhang Y, Shi Y, Lian H, Tu H, Han
S, Yin J, Peng B, Zhou B, He X and Liu W: MiR-129 triggers
autophagic flux by regulating a novel Notch-1/E2F7/Beclin-1 axis to
impair the viability of human malignant glioma cells. Oncotarget.
7:9222–9235. 2016. View Article : Google Scholar : PubMed/NCBI
|
|
51
|
Shang C, Hong Y, Guo Y, Liu YH and Xue YX:
miR-128 regulates the apoptosis and proliferation of glioma cells
by targeting RhoE. Oncol Lett. 11:904–908. 2016.PubMed/NCBI
|