Introduction
Ulcerative colitis (UC) is one of 2 major phenotypes
of inflammatory bowel disease (IBD), whose etiology is associated
with a complex interplay between genetics, the immune system and
environmental factors such as enteric microflora (1,2). UC
is associated with chronic colonic inflammation and damage to the
mucosal surface, which commonly induces hematochezia and abdominal
pain (1,2). The incidence of UC has been recorded
as 9 to 20 cases per 100,000 people each year, and the prevalence
rate as 156 to 291 cases per 100,000 people in both North America
and Northern Europe (2). UC is
clinically characterized by alternating periods of remission and
relapse. Colectomy rates associated with postoperative morbidity
and mortality, and the increasing incidence of colorectal cancer in
the chronic intermittent course of UC must be taken into account
when considering treatments (3).
To date, the best treatment strategies for UC includes the early
use of biological agents such as infliximab, more frequent
monitoring when therapy is initiated and maintenance care; these
have increased the number of patients with UC who have achieved
clinical remission and even endoscopic remission (4). In addition, important candidate genes
and causal genetic variants of UC, including ring finger protein
186, caspase recruitment domain family member 9 and PR/SET
domain 1, have been identified by a genome-wide association
study (5). However, the underlying
pathogenesis and pivotal molecular interactions of UC require
further exploration.
Recently, the roles of several key molecules, such
as prostaglandin-endoperoxide synthase 2 (PTGS2; also known as
COX-2), interleukin-23 receptor, mucin-2 and C-X-C chemokine
receptor type 3, have been examined in UC to some extent (6–9).
However, the pathogenesis of UC involves a number of biological
processes, such as gene expression alteration, and transcriptional
and post-transcriptional dysregulation. Studies of the molecular
interactions based on differentially expressed genes (DEGs) by
hypergeometric method are popular and provide a certain level of
confidence for exploration of UC pathogenesis. Therefore, the
present study used an integrated analysis approach that combined
gene expression profiling, functional enrichments, protein-protein
interactions (PPIs), transcriptional and post-transcriptional
regulation, and drug-gene associations to identify biological
molecular interactions in UC. This study may provide novel insight
into the molecular targets involved in the pathogenesis and
treatment of UC.
Materials and methods
Data resources
A total of 12 microarray data sets were downloaded
from the Gene Expression Omnibus database (http://www.ncbi.nlm.nih.gov/geo), which included
GSE3365 (10), GSE36807 (11), GSE37283 (12), GSE38713 (13), GSE42911, GSE47908 (14), GSE48634 (15), GSE48959 (16), GSE59071 (17), GSE6731 (18), GSE71730 (19), and GSE9452 (20) (Table
I). The microarray data sets were selected according to
following criteria: i) Expression profiling by array contain that
compare samples from patients with UC and normal group; ii) samples
in the UC group were obtained from patients whom did not receive
any interventions or treatments; and iii) DEGs were statistically
significantly different between the UC group and the normal control
group, with a threshold of P<0.05 indicating a statistically
significant difference and |log2(FC)|>1, where FC is
fold change.
 | Table I.Characteristics of the expression
profiling microarray data sets analyzed in this study. |
Table I.
Characteristics of the expression
profiling microarray data sets analyzed in this study.
|
|
|
| Ulcerative
colitis | Normal
controls |
|---|
|
|
|
|
|
|
|---|
| GEO accession | Country | Sample source | Age (year,
mean) | Sex (M/F) | n | Age (year,
mean) | Sex (M/F) | n |
|---|
| GSE3365 | USA | PBMCs | 46.7 | 8/18 | 26 | 44.1 | 24/18 | 42 |
| GSE36807 | UK | Colon mucosa | N/A | 7/8 | 15 | N/A | N/A | 7 |
| GSE37283 | USA | Colon mucosa | N/A | N/A | 15 | N/A | N/A | 5 |
| GSE38713 | Spain | Colon mucosa | 42.4 | 7/16 | 23 | 41.6 | 5/8 | 13 |
| GSE42911 | USA | Colon mucosa | 11.3 | 2/2 | 4 | 13.8 | 2/4 | 6 |
| GSE47908 | Denmark | Colon mucosa | N/A | N/A | 45 | N/A | N/A | 15 |
| GSE48634 | UK | Colon mucosa | 48.3 | 16/8 | 24 | 45.3 | 15/11 | 26 |
| GSE48959 | Belgium | Colon mucosa | 55.3 | 13/14 | 27 | 57.7 | 5/5 | 10 |
| GSE59071 | Belgium | Colon mucosa | 44.9 | 55/42 | 97 | 69.6 | 5/6 | 11 |
| GSE6731 | USA | Colon mucosa | N/A | N/A | 8 | N/A | N/A | 4 |
| GSE71730 | USA | PBMCs | 12 | 11/4 | 15 | 12 | 1/9 | 10 |
| GSE9452 | Denmark | Colon mucosa | 46 | 2/6 | 8 | 35 | 4/14 | 18 |
Data set preprocessing and DEG
identification
Expression profiling microarrays were preprocessed
by background correction and normalization, followed by statistical
analysis to identify the DEGs between the UC group and the control
group, which was conducted using the limma package in R (http://www.bioconductor.org/packages/release/bioc/html/limma.html)
(21), a commonly used
bioinformatics method to identify DEGs. Each DEG had to meet both
P<0.05 and |log2(FC)| >1. The identified DEGs from each data
set were overlapped for further bioinformatics analysis.
Functional enrichment and analysis of
DEGs
Functional enrichment was classified into two
groups, Gene ontology (GO) function annotation and Kyoto
Encyclopedia of Genes and Genomes (KEGG) pathway enrichment
analysis. The Database for Annotation, Visualization and Integrated
Discovery (DAVID; version 6.7; www.david.ncifcrf.gov) provides a comprehensive set of
GO function annotation and pathway enrichment analysis to
understand the biological meanings of large lists of genes
(22). In this study, DAVID was
used to explore the functional enrichments of DEGs including GO and
KEGG. P<0.05 indicated significant functional annotations and
pathways.
Construction and visualization of PPI
networks among DEGs
PPIs are reflected as interactions between DEGs,
which indicate upstream and/or downstream associations, including
direct (physical) and indirect (functional) ones. In the present
study, the online server Search Tool for the Retrieval of
Interacting Genes (STRING; version 10; www.string-db.org/) was used to explore these
interactions (23). DEG pairs were
identified by a combined score of >0.4, which was used to
evaluate the level of interactions between DEGs with the following
scoring system: i) <0.4, low confidence; ii) 0.4 to 0.7, medium;
iii) >0.7, high (24). These
DEGs were subsequently chosen to construct PPI networks, which were
further visualized with Cytoscape v3.4.0 software used for
visualizing bimolecular interaction networks (25).
Regulation and drug-gene associations
of DEGs
The biological function of a gene is regulated at
the transcriptional and post-transcriptional level by transcription
factors (TFs) and micro RNAs (miRNAs), respectively. Genes
associated with disease, drug-gene associations, TF targets and
miRNA targets of DEGs were predicted using the Web-based Gene Set
Analysis Toolkit (WebGestalt 2013; www.webgestalt.org/webgestalt_2013/) (26). The present study explored these
enrichment analyses using a hypergeometric statistical method and
the top 10 results are presented based on significance level
(P<0.05). The regulatory networks were constructed and
visualized by Cytoscape v3.4.0 software (25).
Results
Microarray data sets and
identification of DEGs
A total of 12 expression data sets were used in the
present study, which comprised 307 samples from patients with UC
and 167 samples from healthy control patients; all patients were
from Western populations (Table
I). Following screening and overlapping of data sets, 233 DEGs
were identified, including 173 upregulated and 60 downregulated
DEGs. The DEGs were revealed to be associated with a number of
diseases, such as inflammation, infection, fibrosis, chronic
disease, immune system diseases, necrosis, respiratory tract
infections, virus diseases, rupture and bronchiolitis (Table II).
| Table II.Top 10 diseases associated with the
identified differentially expressed genes. |
Table II.
Top 10 diseases associated with the
identified differentially expressed genes.
| Disease | Gene count | Genes | P-value |
|---|
| Inflammation | 48 | MMP9, LCN2, CXCL3,
SELL, S100A8, CXCL2, CD274, PECAM1, IL1B, TNC, ICAM1, NAMPT, CXCL9,
IDO1, IL33, SPP1, PLAU, TIMP1, IL1RN, S100A9, CASP1, MMP12, CXCL13,
CCL20, FPR1, CXCL6, MMP1, PI3, ANXA1, PLA2G2A, SOCS3, ENTPD1,
CXCL10, PTGS2, CXCL11, SERPINA1, MMP3, GBP1, STAT1, CXCL1, OSMR,
NFKBIZ, LY96, TNIP3, IL13RA2, NOS2, CCL11 and CHI3L1 |
1.58×10−48 |
| Infection | 39 | CCL19, IFI44, SELL,
CXCL2, TRIM22, CD274, IL1B, GZMK, ICAM1, IFITM1, CXCL9, IDO1,
DMBT1, DEFA5, IL1RN, S100A9, CASP1, APOL1, CD55, CXCL13, IFITM3,
CCL20, DEFA6, CR2, IFIT3, PSMB9, FCGR3B, PI3, FCGR3A, SOCS3, PTPRC,
HLA-DMA, PTGS2, CXCL10, STAT1, CXCL1, LY96, NOS2 and CCL11 |
5.52×10⁻³³ |
| Fibrosis | 27 | MMP9, GREM1,
SERPINB3, COL1A1, MMP1, S100A8, LOXL2, TNC, PI3,
CXCL9, THY1, SLC26A3, CXCL10, IL33, SPP1, MMP7, SERPINA1, MMP3,
TIMP1, SPARC, TGM2, COL1A2, S100A9, ENPP2, IL13RA2, NOS2 and
CHI3L1 |
5.67×10⁻³¹ |
| Chronic
disease | 31 | MMP9, UGT1A1,
MMP12, SERPINB3, LCN2, MGP, MMP1, CD274, RHOH, FCGR3B, IL1B, NCF2,
ICAM1, MS4A1, FCGR3A, ADH1C, NAMPT, CXCL9, ENTPD1, CXCL10, PTGS2,
SPP1, MMP7, SERPINA1, MMP3, TIMP1, IL1RN, S100A9, NOS2, APOL1 and
CHI3L1 |
3.37×10⁻³⁰ |
| Immune system
diseases | 37 | CDKN2B, CCL19,
SELL, CD274, IL1B, NCF2, ICAM1, IGHM, CXCL9, IDO1, IL33, CD79A,
SPP1, IL1RN, DPP10, POU2AF1, CXCL13, BIRC3, CCL20, DEFA6, PADI2,
CR2, PRDM1, RHOH, FCGR3B, FCGR3A, MS4A1, PTPRC, HLA-DMA, CXCL10,
CXCL11, BCL2A1, ABCB1, CCL11, NOS2, CHI3L1 and TRIM29 |
3.22×10⁻²⁶ |
| Necrosis | 28 | MMP9, BIRC3, CCL20,
CXCL3, MMP1, CXCL2, IL1B, ICAM1, FCGR3A, PI3, SOCS3, NAMPT, IDO1,
CXCL10, IL33, UBD, MMP3, BCL2A1, STAT1, CXCL1, NFKBIZ, LY96, IL1RN,
STEAP4, CASP1, TNIP3, NOS2 and CCL11 |
1.85×10⁻²⁵ |
| Respiratory tract
infections | 24 | MMP9, DPP10,
CXCL13, CCL19, IGKC, IFITM3, CXCL3, CXCL6, CD274, PECAM1, IL1B,
NCF2, ICAM1, CXCL9, PTGS2, CXCL10, SERPINA1, CXCL1, IL1RN, S100A9,
CASP1, NOS2, IL13RA2 and CCL11 |
2.64×10⁻²³ |
| Virus diseases | 30 | CXCL13, CD55,
CCL19, CCL20, CXCL3, DEFA6, IFI44, SELL, CR2, TRIM22, CD274, PSMB9,
IL1B, ICAM1, FCGR3A, IFITM1, SOCS3, PTPRC, CXCL9, HLA-DMA, IDO1,
CXCL10, CXCL11, DEFA5, GBP1, ABCB1, STAT1, CXCL1, CASP1 and
APOL1 |
6.81×10⁻²³ |
| Rupture | 20 | MMP9, MMP12, MMP10,
COL1A1, MGP, MMP1, IL1B, TNC, PI3, COL12A1, MMP7, DEFA5, MMP3,
TIMP1, PLAU, VWF, IL1RN, COL1A2, IL13RA2 and CHI3L1 |
2.04×10⁻²² |
| Bronchiolitis | 22 | DPP10, CXCL13,
CCL19, CXCL3, CXCL6, SELL, CXCL2, PECAM1, NCF2, ICAM1, SOCS3,
CXCL9, IDO1, PTGS2, MMP7, STAT1, CXCL1, IL1RN, CASP1, IL13RA2, NOS2
and CCL11 |
9.64×10⁻²² |
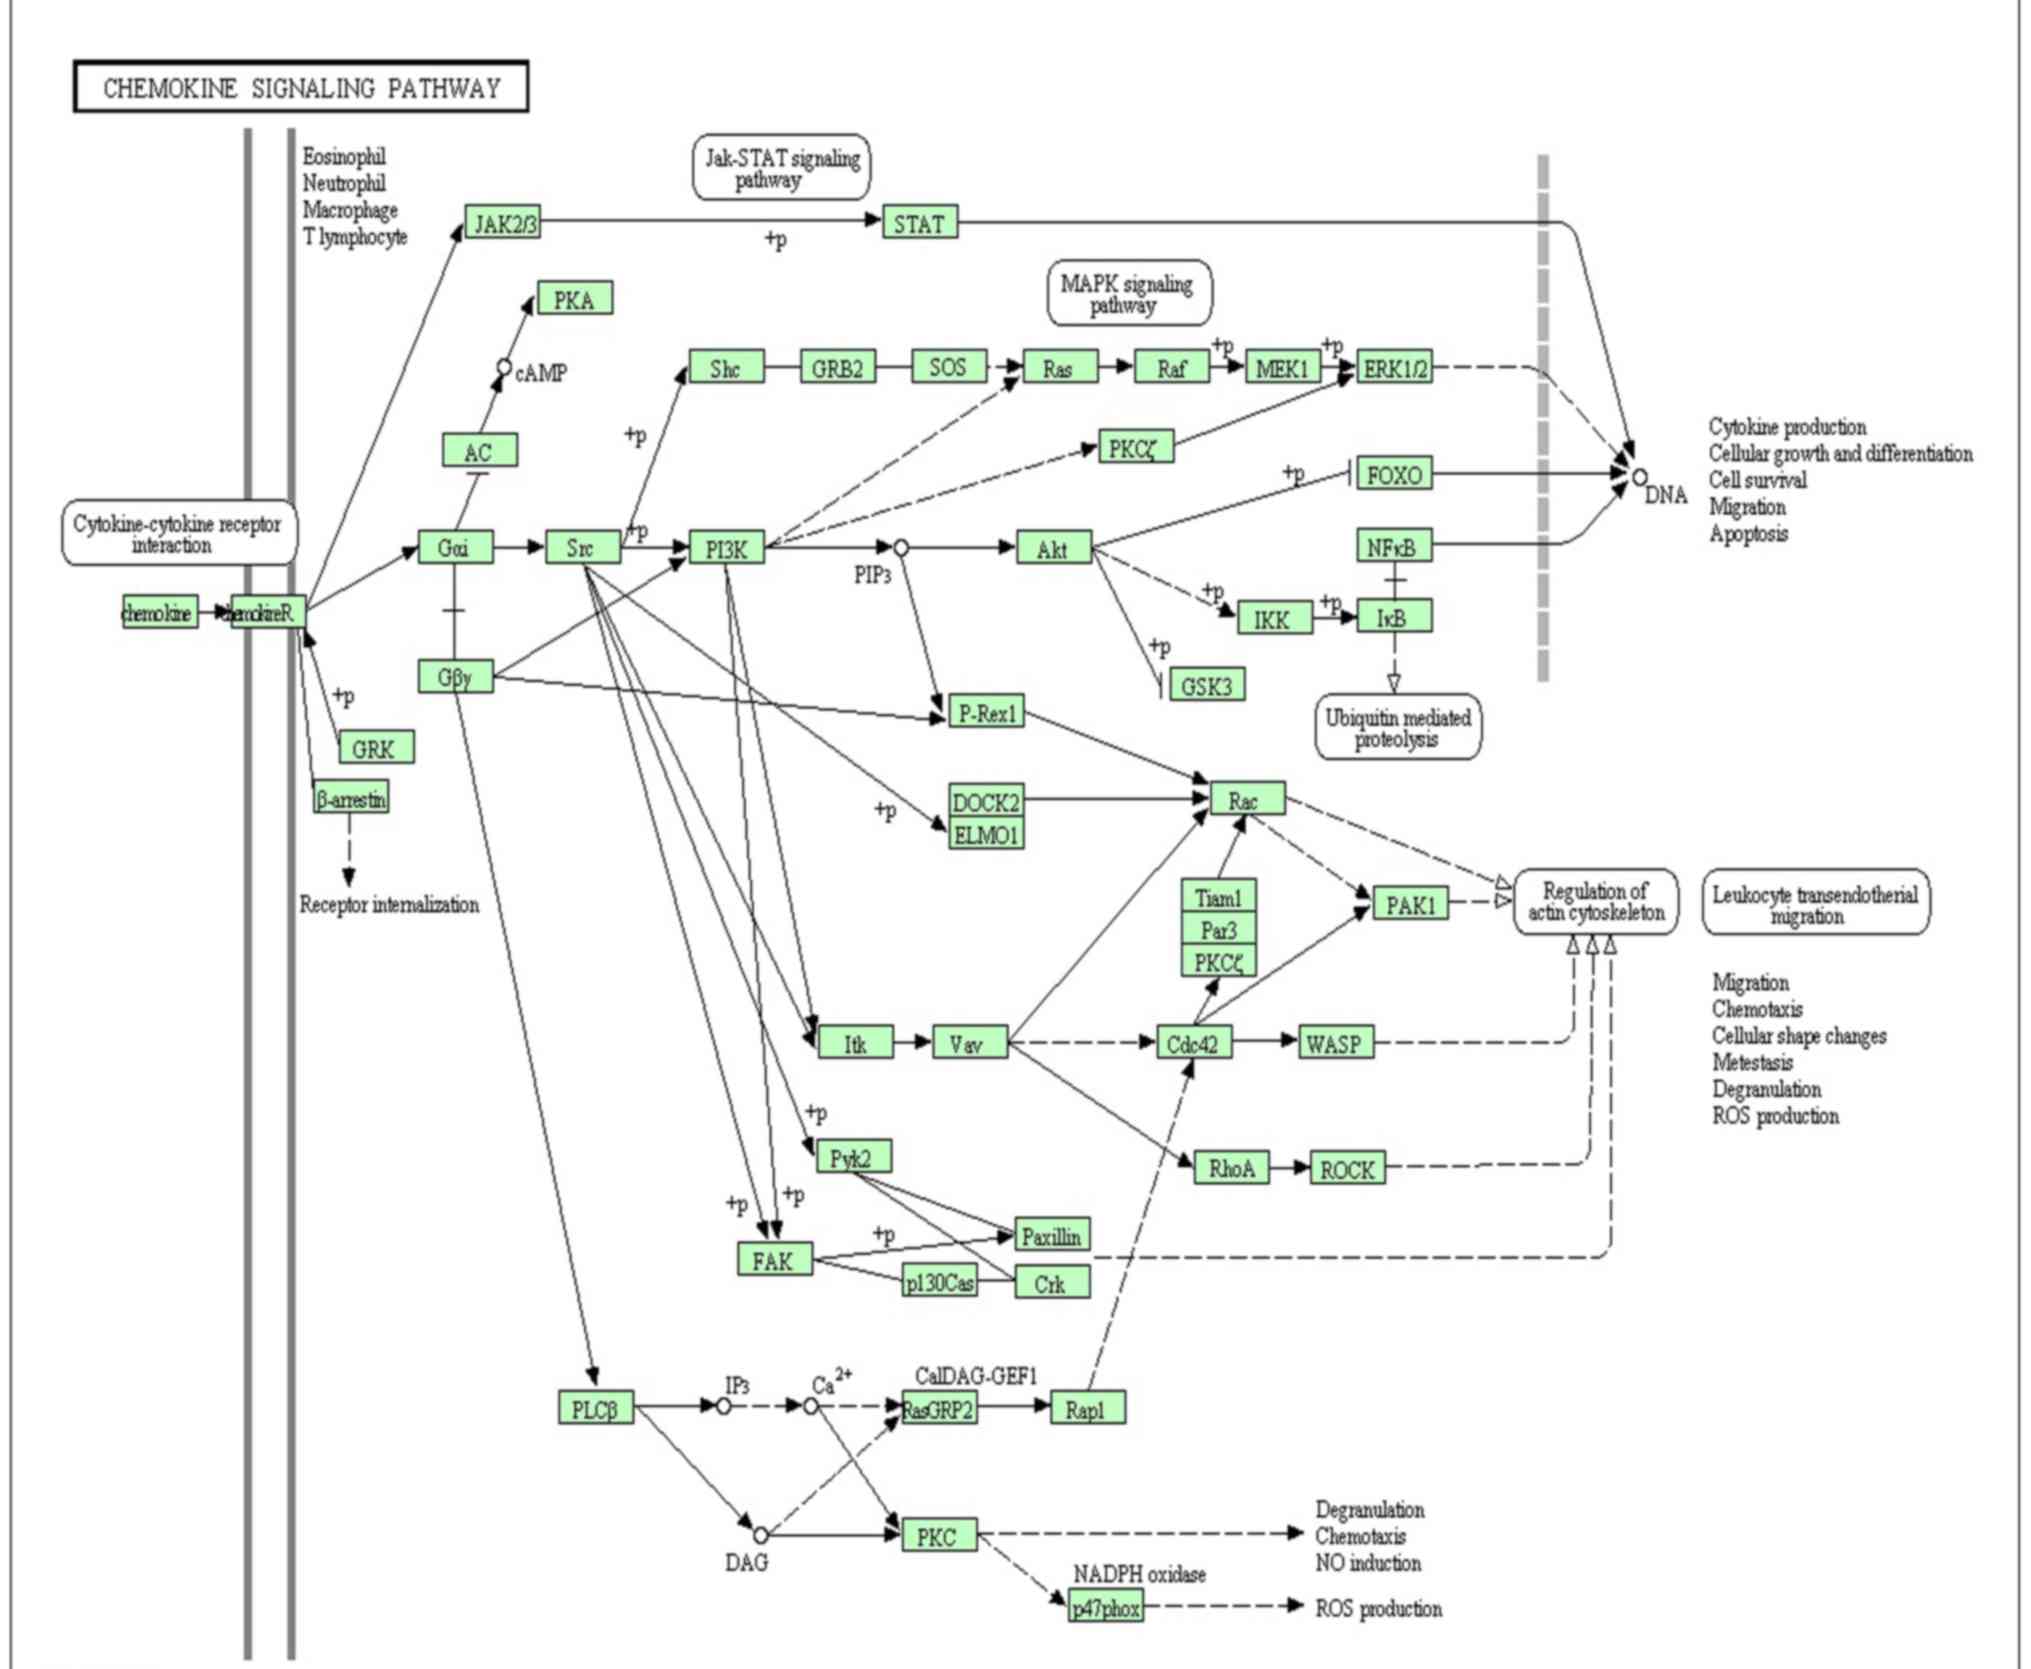
Functional enrichment and analysis of
DEGs
Functional analyses demonstrated that 185 GO
functions (P<0.05) and 11 KEGG pathways (P<0.05) were
significantly enriched by the upregulated DEGs, whereas 12 GO
functions (P<0.05) and 6 KEGG pathways (P<0.05) were
significantly enriched by the downregulated DEGs. Top 5 GO terms
and top 5 KEGG pathways of the upregulated and downregulated DEGS
are provided in Tables III and
IV, respectively. Notably, the
chemokine signaling pathway was enriched by 13 DEGs (Fig. 1), which has been previously
verified as important pathway in UC (9,27,28).
| Table III.Top 5 GO functions of upregulated and
downregulated differentially expressed genes. |
Table III.
Top 5 GO functions of upregulated and
downregulated differentially expressed genes.
| Category | GO ID | Term | Gene count | P-value |
|---|
| Up | GO:0006955 | Immune
response | 49 |
1.18×10⁻²⁵ |
| Up | GO:0006952 | Defense
response | 41 |
3.55×10⁻²⁰ |
| Up | GO:0006954 | Inflammatory
response | 31 |
2.28×10⁻¹⁹ |
| Up | GO:0009611 | Response to
wounding | 37 |
9.35×10⁻¹⁹ |
| Up | GO:0006935 | Chemotaxis | 17 |
2.95×10⁻¹¹ |
| Down | GO:0055085 | Transmembrane
transport | 8 |
9.09×10−04 |
| Down | GO:0042493 | Response to
drug | 5 |
3.05×10−03 |
| Down | GO:0007584 | Response to
nutrient | 4 |
7.02×10−03 |
| Down | GO:0031667 | Response to
nutrient levels | 4 |
1.765×10−02 |
| Down | GO:0009725 | Response to hormone
stimulus | 5 |
1.902×10−02 |
| Table IV.Top 5 Kyoto Encyclopedia of Genes and
Genomes pathways of upregulated and downregulated differentially
expressed genes. |
Table IV.
Top 5 Kyoto Encyclopedia of Genes and
Genomes pathways of upregulated and downregulated differentially
expressed genes.
| Category | Term | Gene count | P-value |
|---|
| Up | hsa04610:Complement
and coagulation cascades | 9 |
1.59×10−05 |
| Up | hsa04062:Chemokine
signaling pathway | 13 |
5.37×10−05 |
| Up |
hsa04512:ECM-receptor interaction | 8 |
4.55×10−04 |
| Up |
hsa04060:Cytokine-cytokine receptor
interaction | 13 |
1.231×10−03 |
| Up | hsa04621:NOD-like
receptor signaling pathway | 6 |
3.553×10−03 |
| Down | hsa00910:Nitrogen
metabolism | 3 |
2.866×10−03 |
| Down | hsa00830:Retinol
metabolism | 3 |
1.519×10−02 |
| Down | hsa00980:Metabolism
of xenobiotics by cytochrome P450 | 3 |
1.8555×10−02 |
| Down | hsa00982:Drug
metabolism | 3 |
1.9741×10−02 |
| Down | hsa03320:PPAR
signaling pathway | 3 |
2.4136×10−02 |
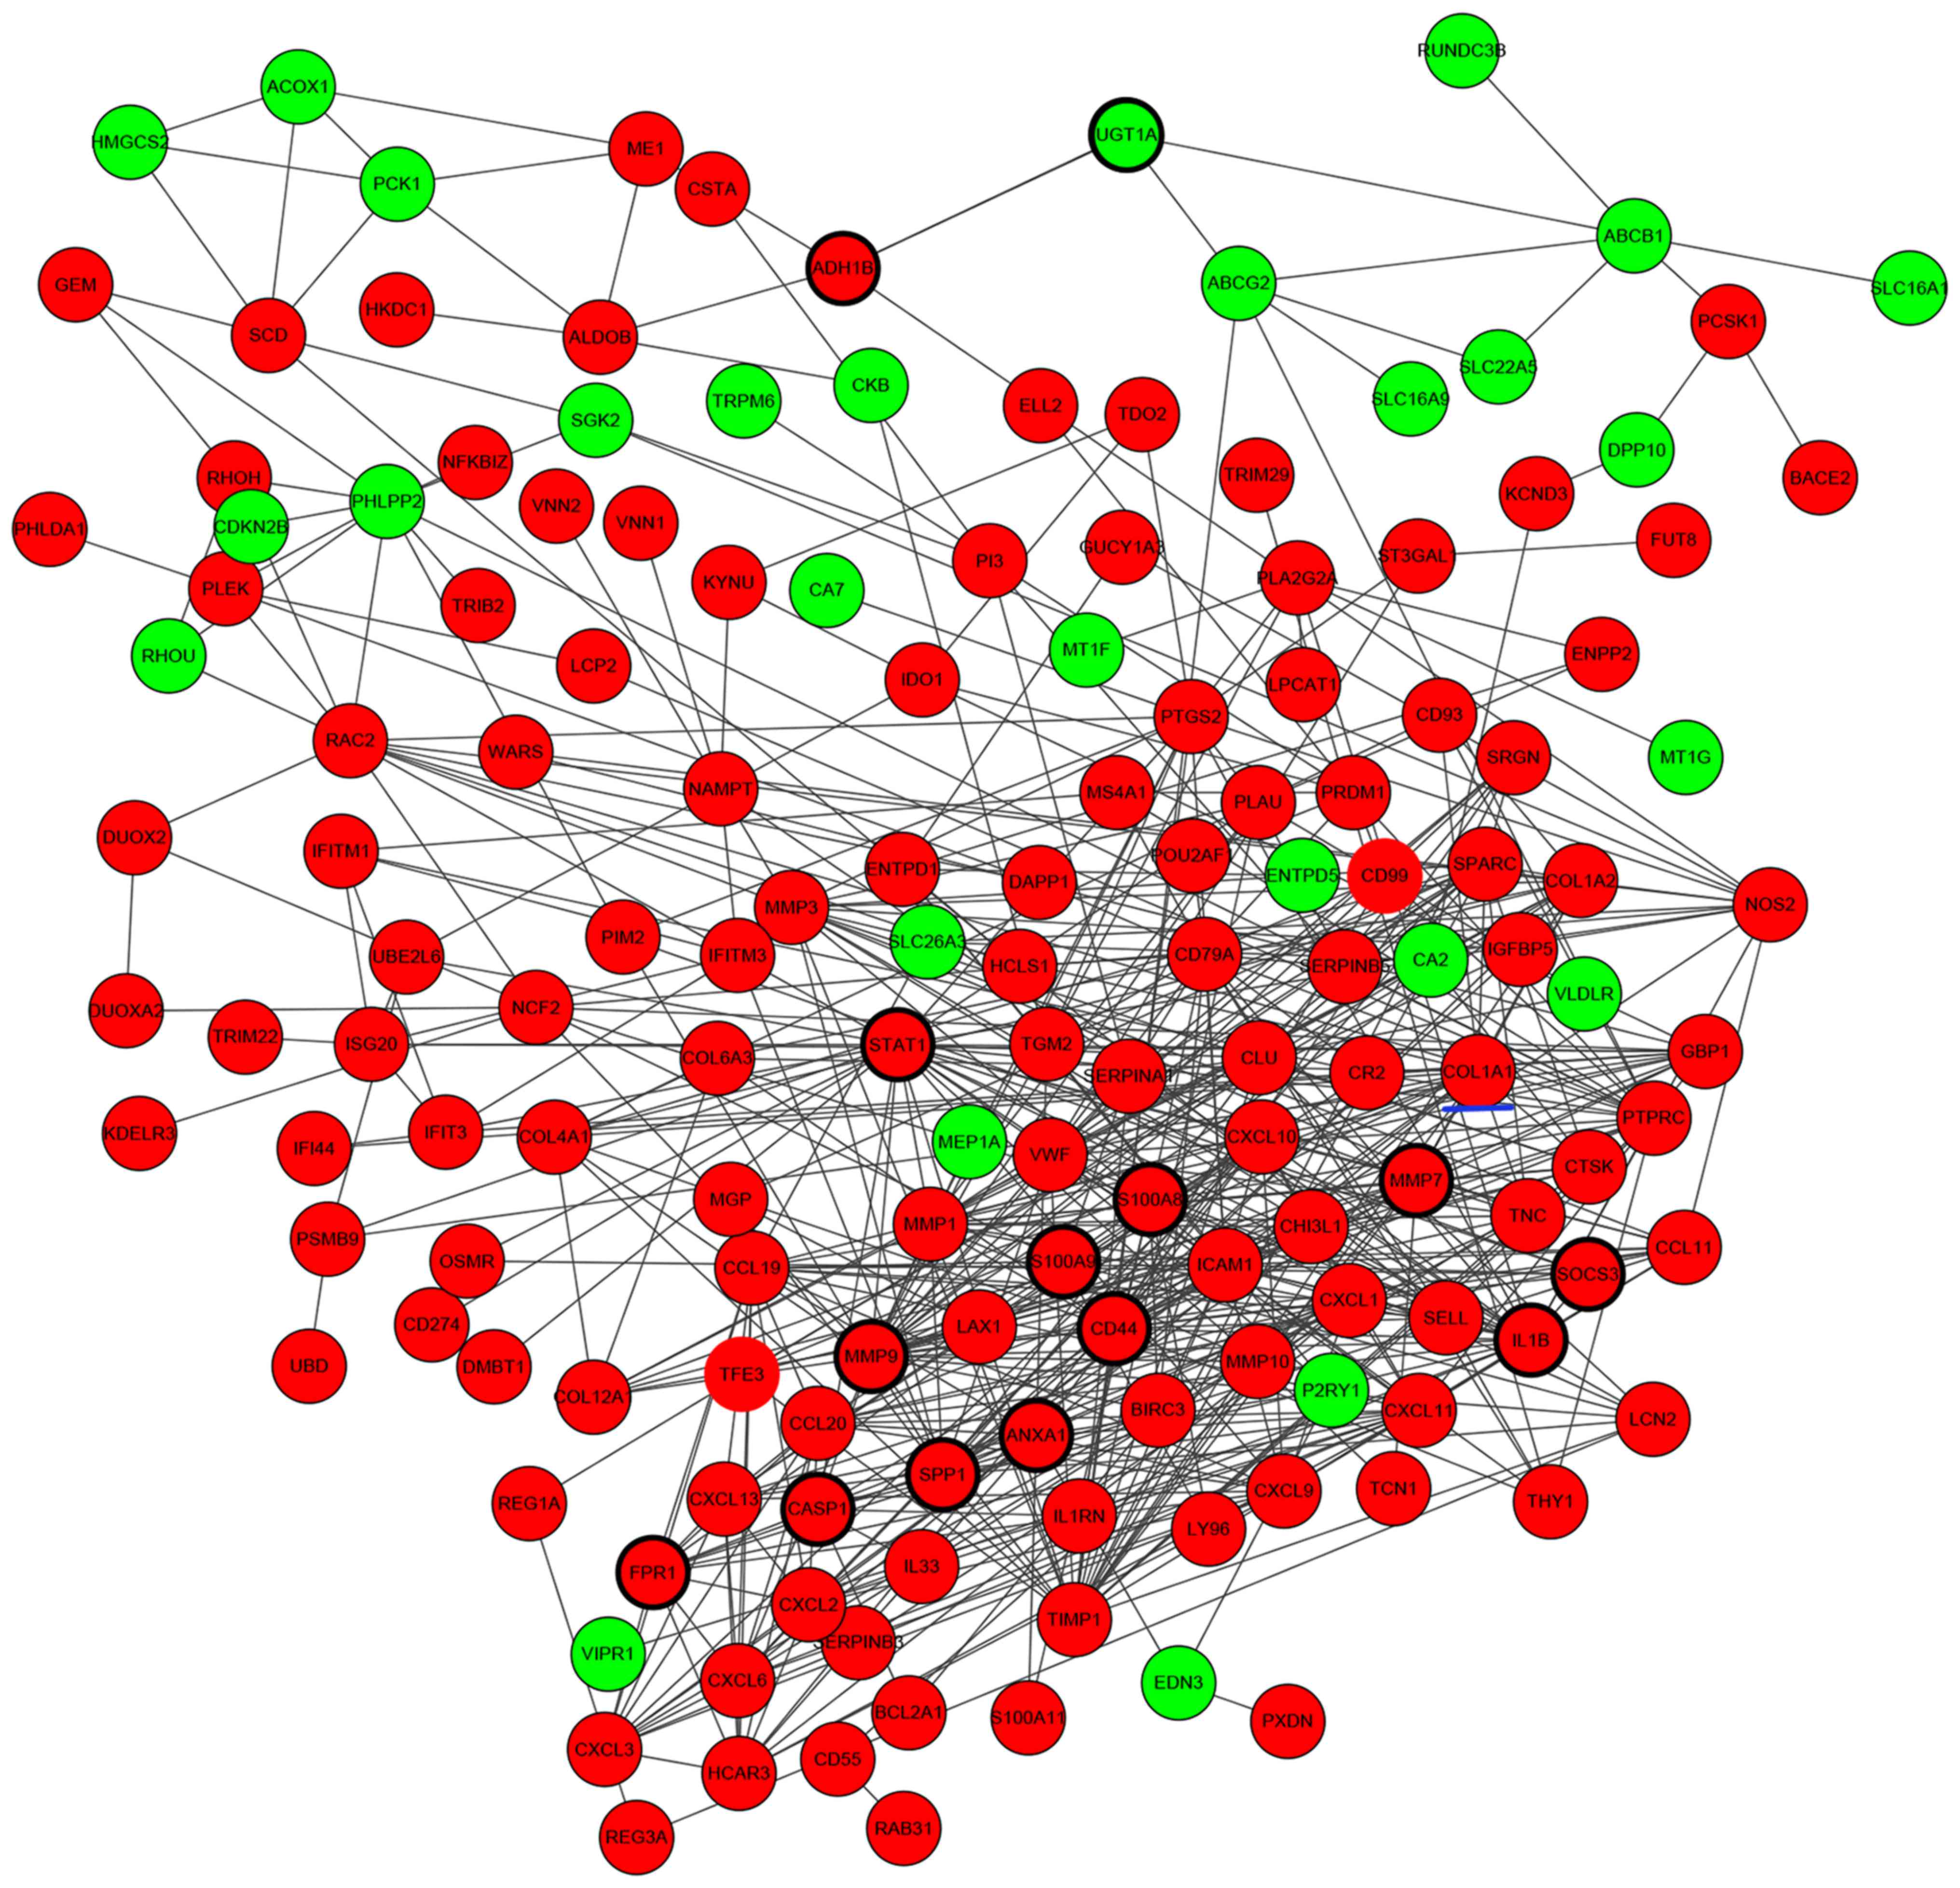
Construction of PPI networks
associated with DEGs
PPIs between DEGs were investigated by STRING, and a
total of 608 protein-protein interactions were identified. Based on
these protein-protein pairs, PPI networks were constructed
involving 173 upregulated DEGs and 60 downregulated DEGs (Fig. 2). In this network, S100
calcium-binding protein A9 (S100A9), UDP-glucuronosyltransferase 1A
(UGT1A), CD44, caspase 1 (CASP1), signal transducer and activator
of transcription 1 (STAT1), secreted phosphoprotein 1 (SPP1),
N-formyl peptide receptor 1 (FPR1), S100A8, interleukin 1β
(IL1B), suppressor of cytokine signaling 3 (SOCS3), matrix
metalloproteinase (MMP) 9, MMP7, annexin A1 (ANXA1) and alcohol
dehydrogenase 1B (class I), β-polypeptide had higher node degrees
and were defined as hub genes of PPI networks (Fig. 2).
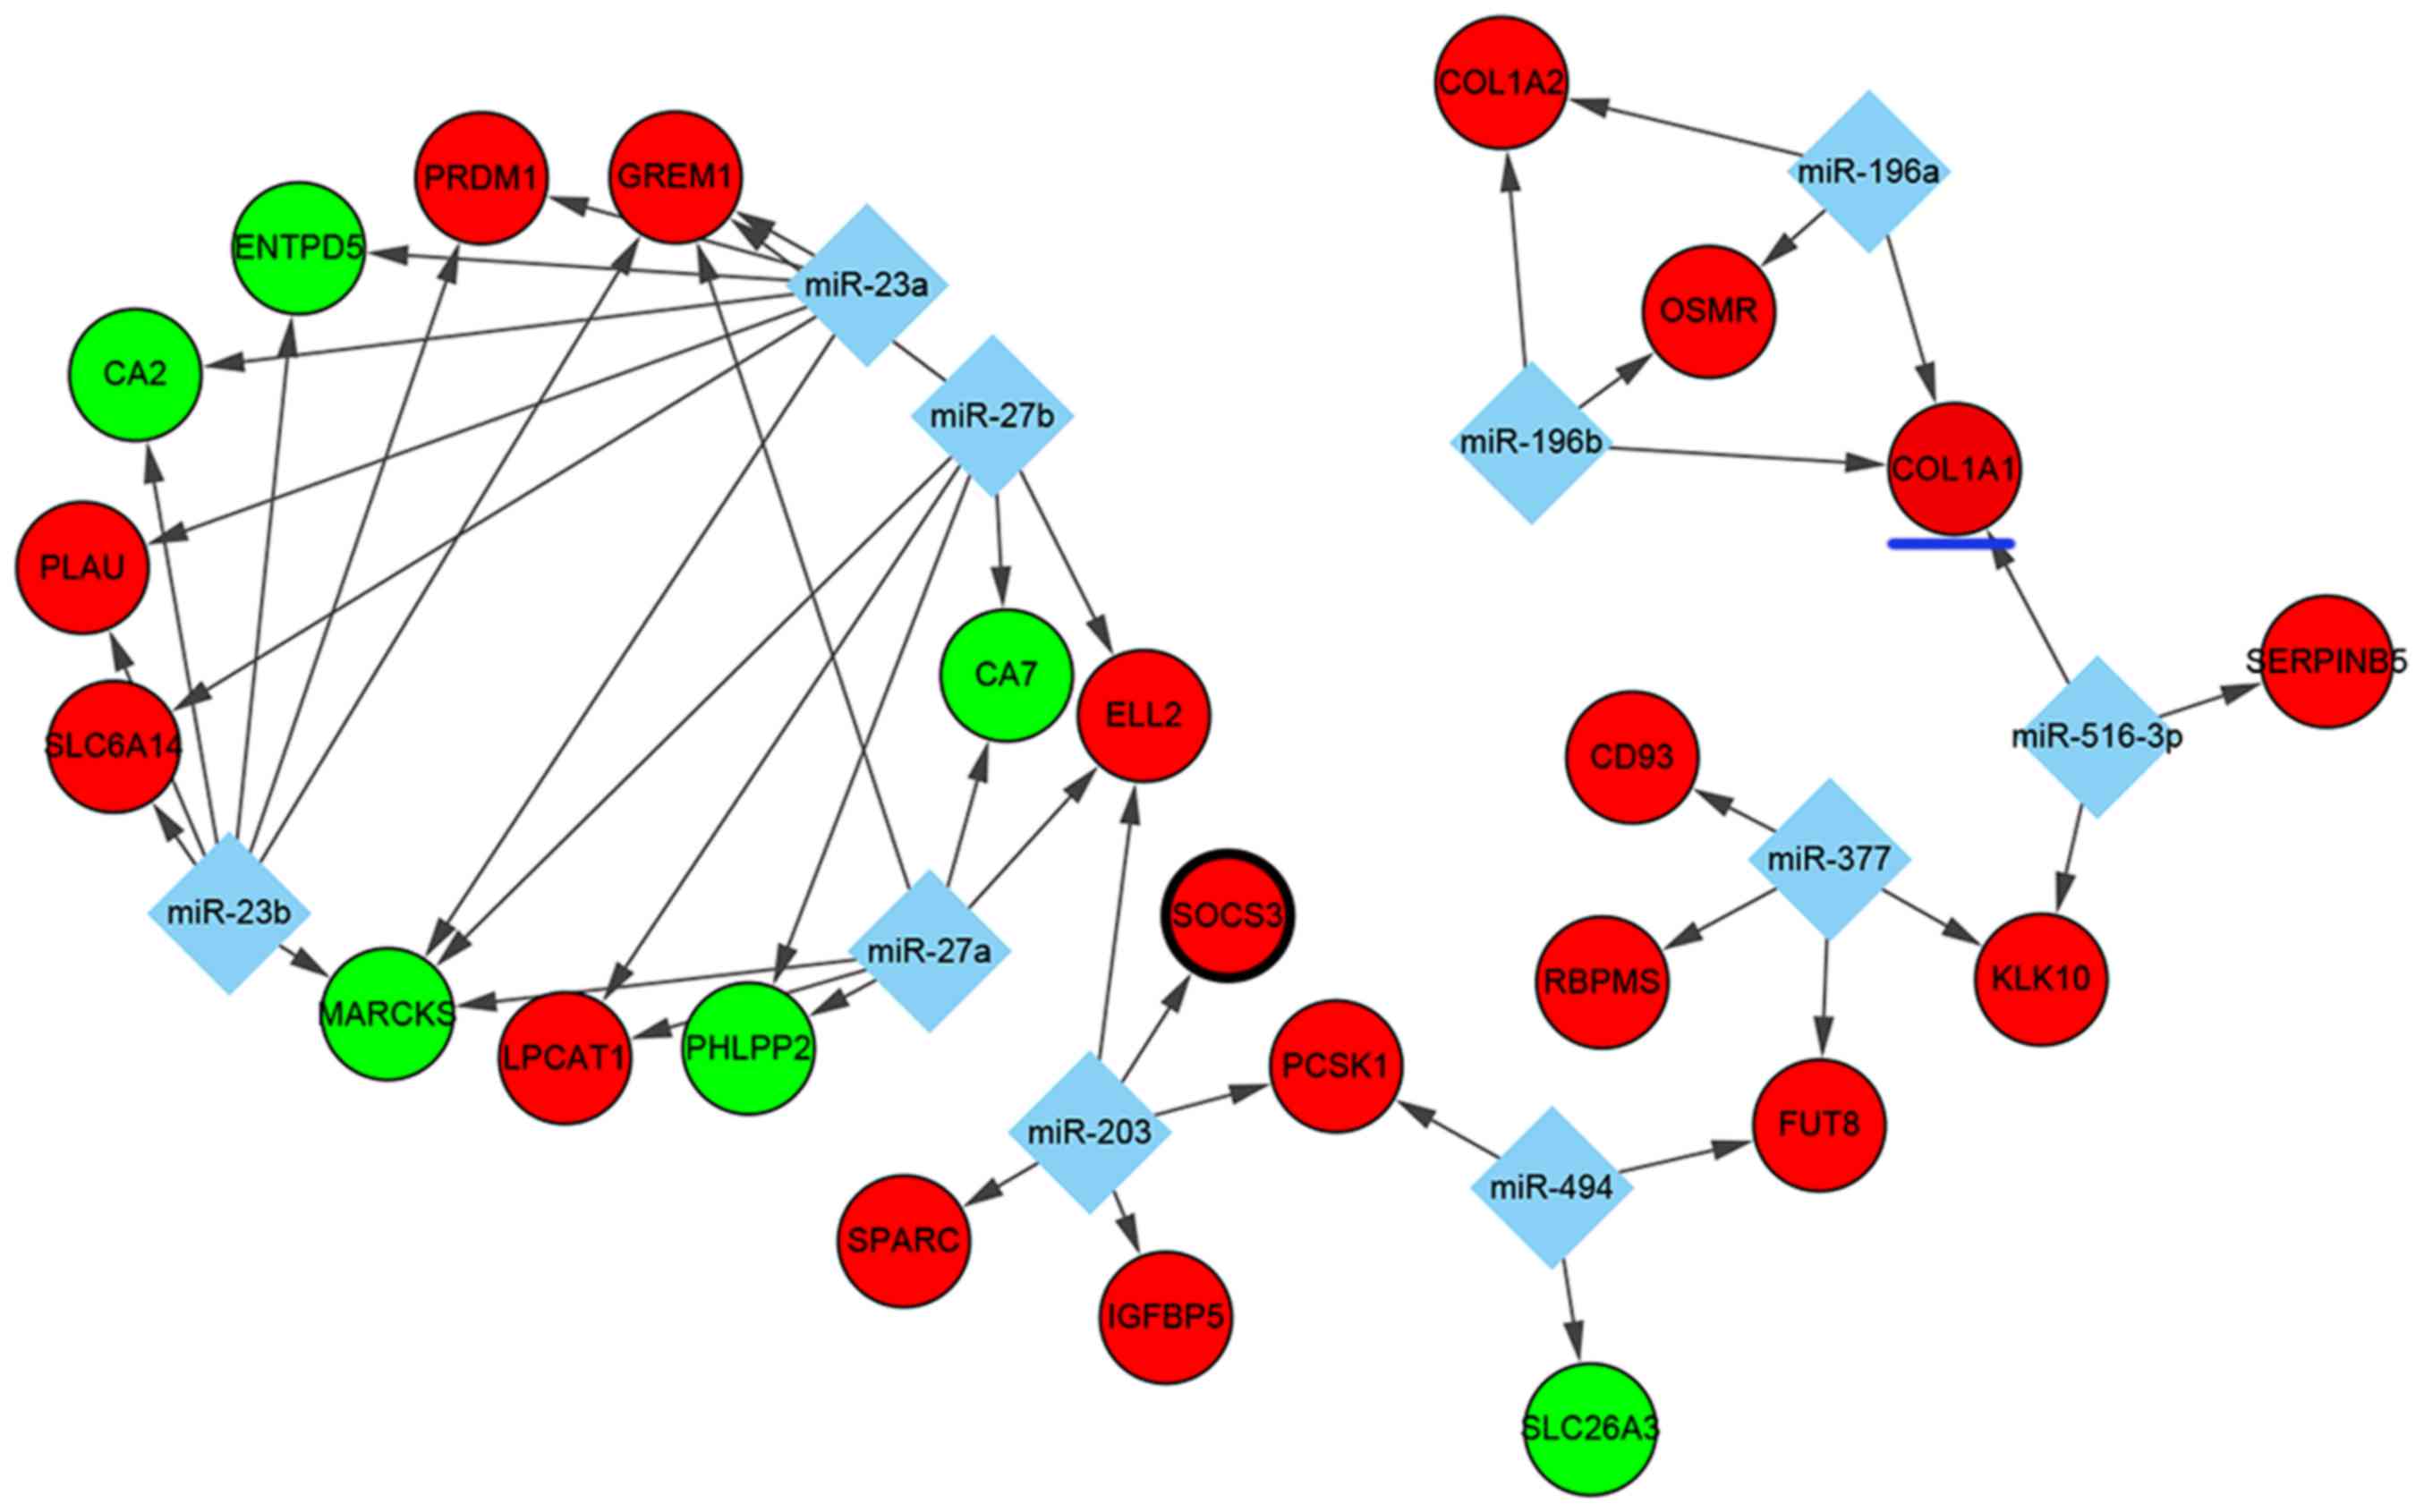
Regulatory networks of DEGs
As for TF-targeted and miRNA-targeted DEGs, which
serve pivotal roles in transcriptional and post-transcriptional
regulation, a number of significant regulators of DEGs were
identified in UC. Based on the WebGestalt data, the top 10 miRNAs
(miR) including miR-516-3p, miR-203, miR-27a, miR-27b, miR-494,
miR-196a, miR-196b, miR-23a, miR-23b and miR-377 were predicted to
regulate some DEGs. In this interaction network, 10 miRNAs
involving 47 miRNA-DEG regulatory pairs were constructed, which
included 6 downregulated DEGs and 18 upregulated DEGs (Fig. 3). Among the DEGs, the expression of
MARCKS and GREM1 were predicted to be co-regulated by miR-27a,
miR-27b, miR-23a and miR-23b, whereas the overexpression of KLK10
was predicted to be co-regulated by miR-377 and miR-516-3p.
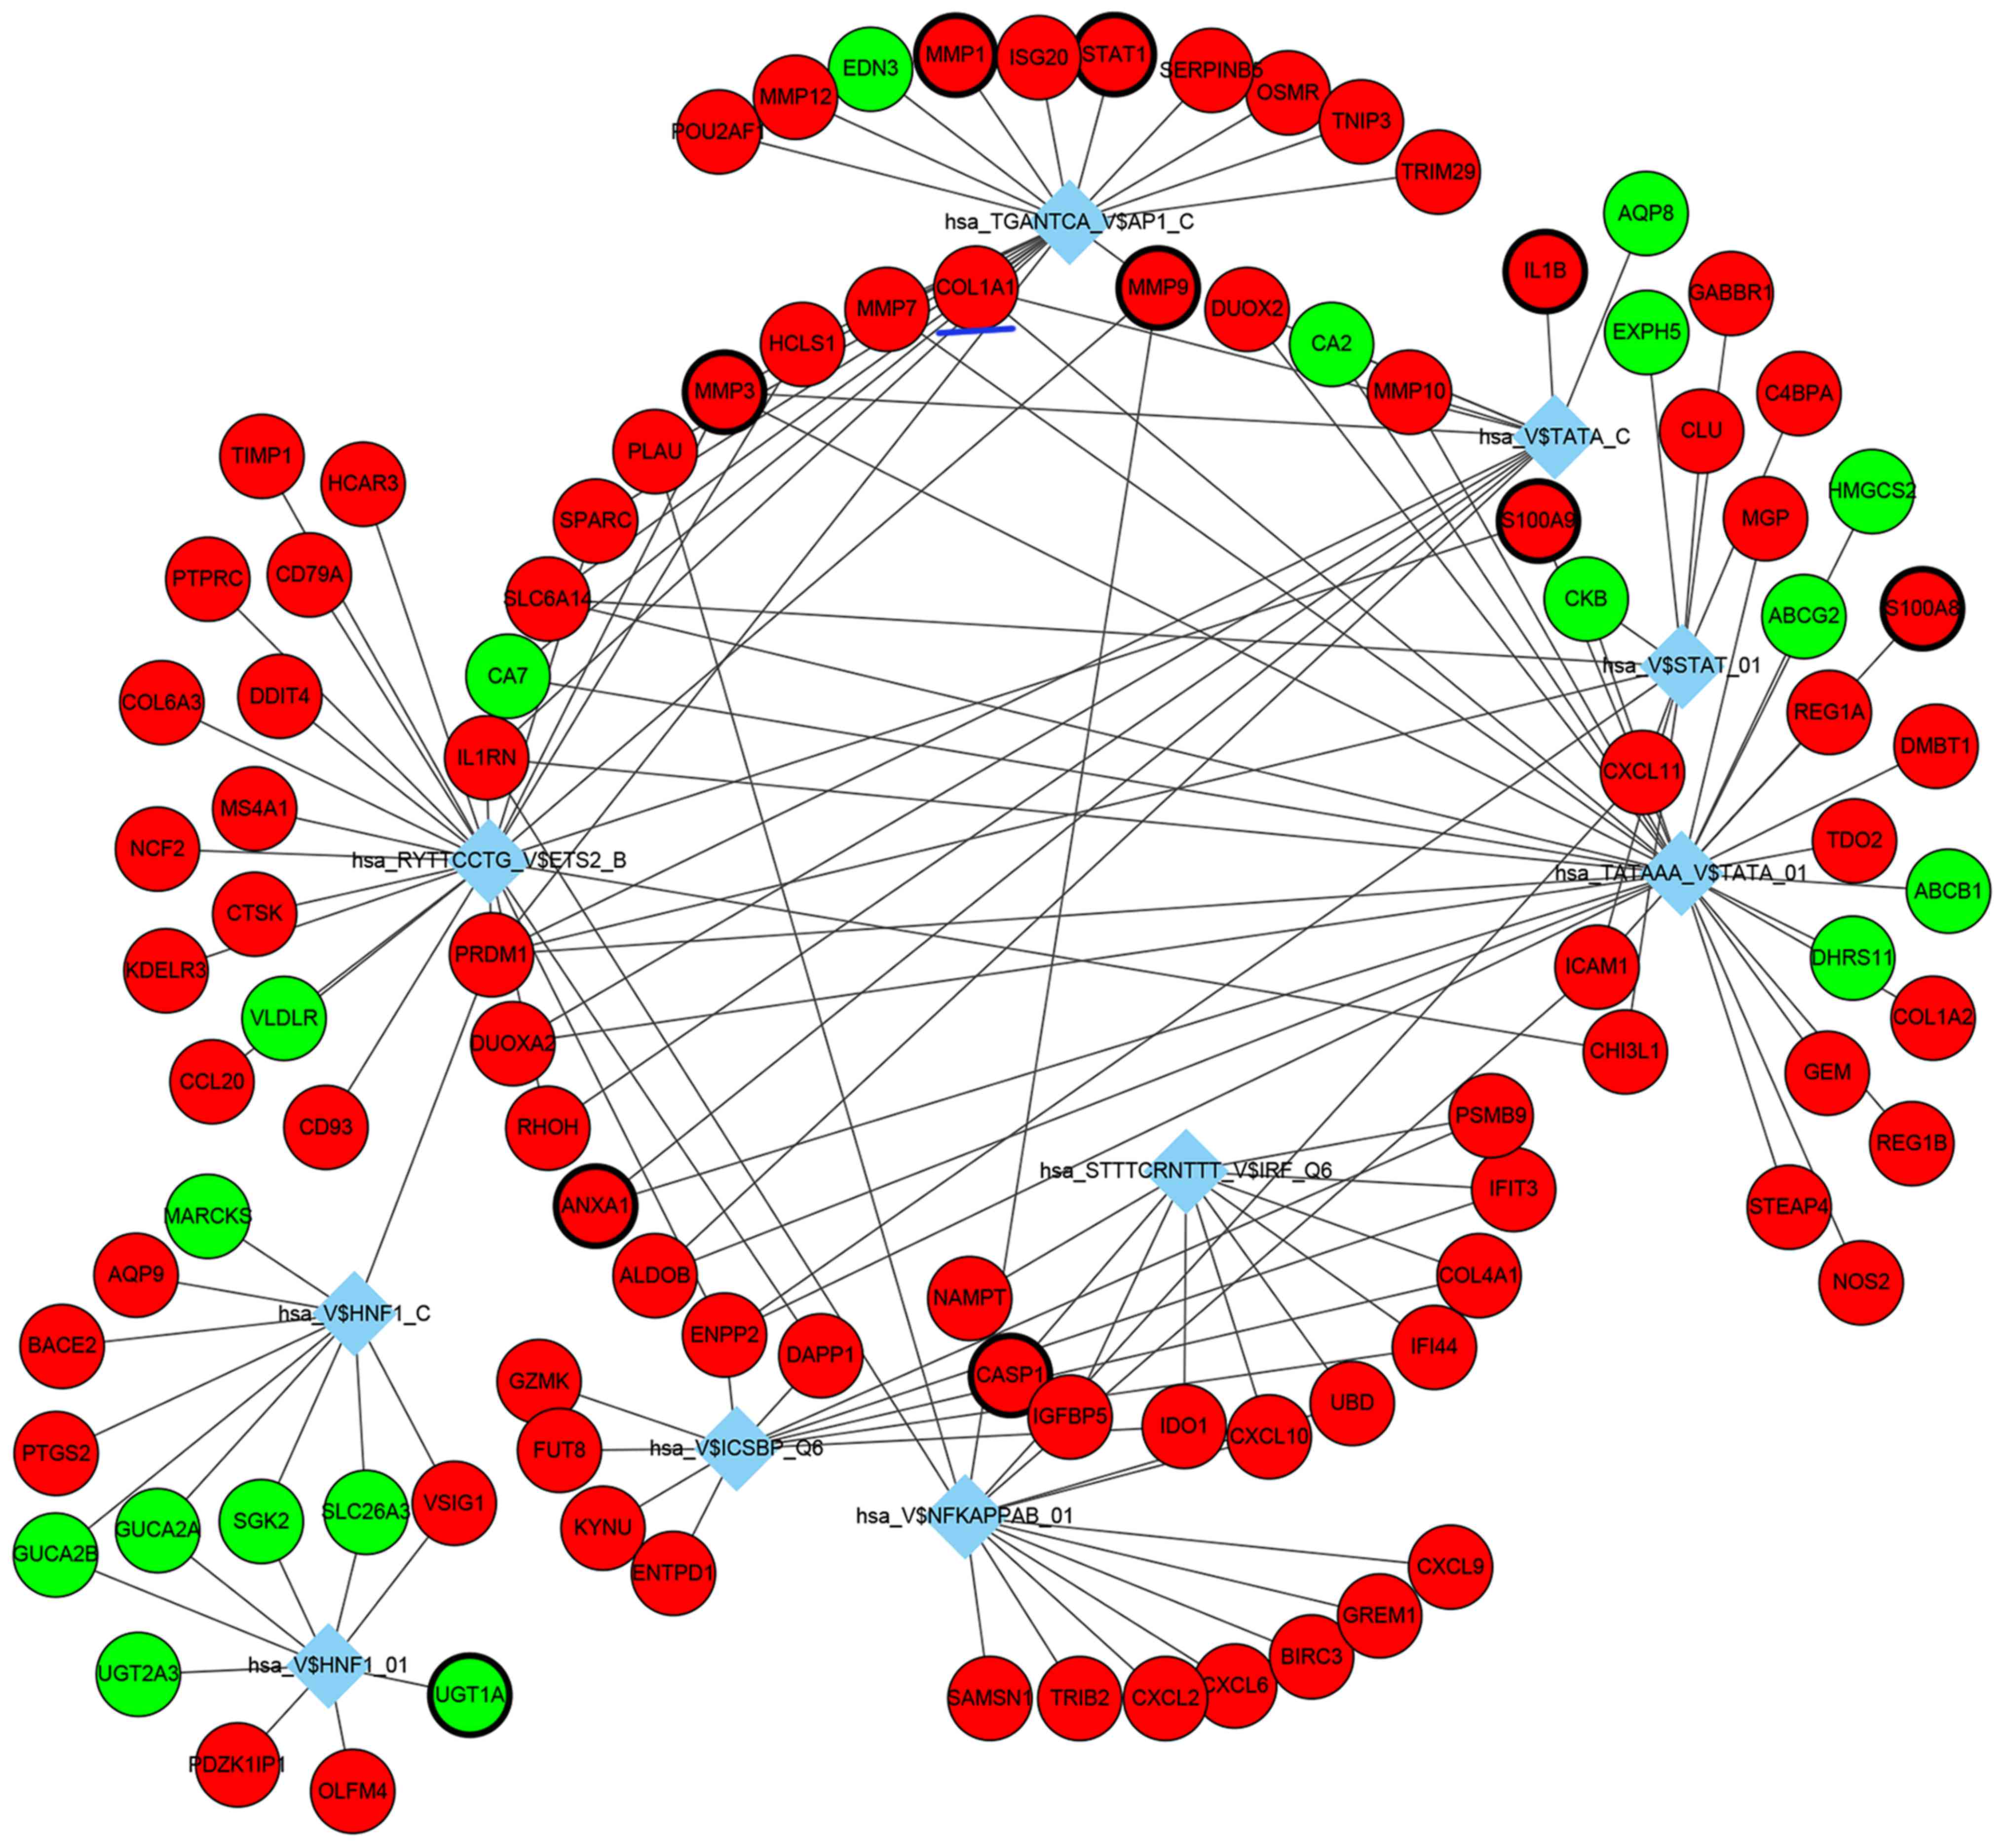
TF-DEG regulatory networks were also analyzed, the
top 10 identified TF-DEG interactions are presented in Fig. 4. Among these identified TFs,
TATA-binding protein 1 (TBP1; hsa_TATAAA_V$TATA_01), nuclear
factor-κB (hsa_V$NFKAPPAB_01) and ETS proto-oncogene 2 (ETS2;
hsa_RYTTCCTG_V$ETS2_B) exhibited the highest degree and were
considered as important TFs in the present study, which may be
potentially important in the underlying pathogenesis of UC.
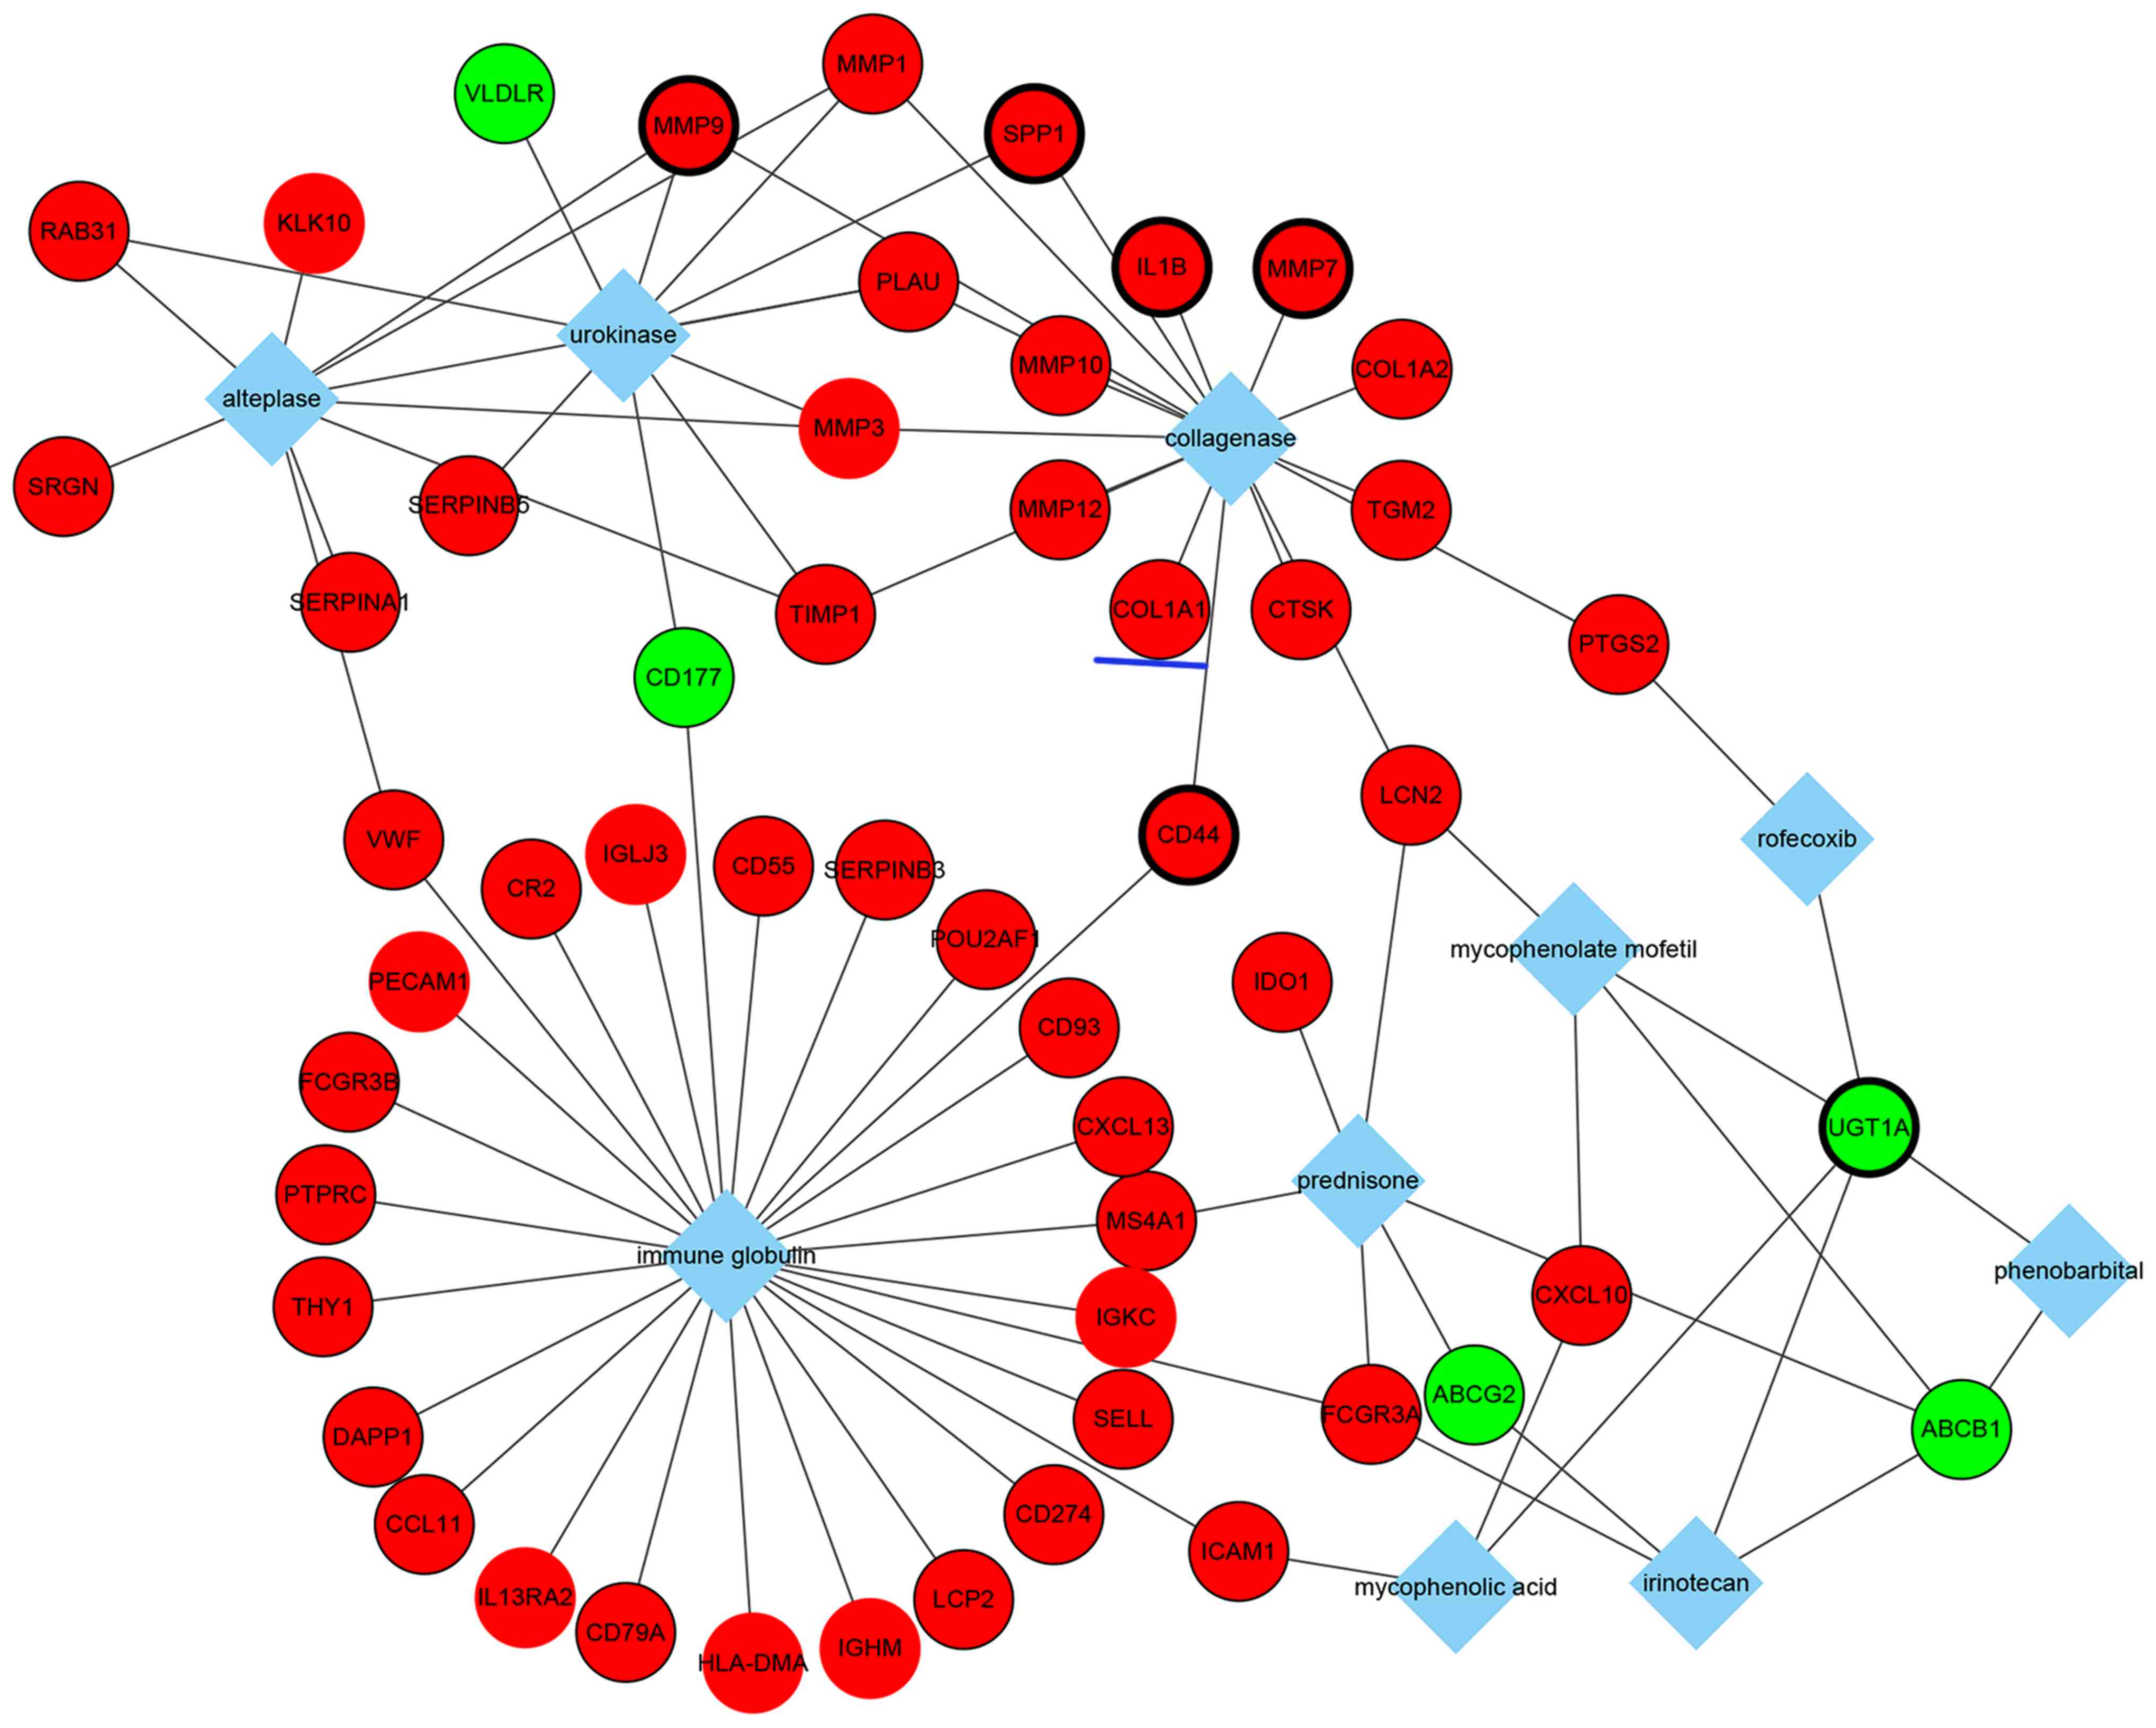
In addition, the top 10 drugs associated with DEGs
were identified (Fig. 5). Notably,
these drugs included mycophenolate mofetil and prednisone, which
are immunosuppressive drugs used for UC treatment in clinical
practice. These results may provide some considerations for
choosing medicine therapy for patients with UC. Moreover, the
results suggested that these two immunosuppressive drugs may be
associated with corresponding DEGs, such as the common genes,
lipocalin 2 and ATP-binding cassette, sub-family B
(MDR/TAP), member 1 (Fig.
5).
Overall, a number of molecular interactions were
identified and predicted from DEGs. For example, collagen type I α1
(COL1A1) is an upregulated gene in patients with UC, and is
associated with fibrosis and collagenase, which suggested that
patients with UC with increased COL1A1 expression may be more
likely to develop fibrosis and collagenase therapy may be effective
in this group of patients (Fig.
5). COL1A1 is a profibrotic gene that was demonstrated to be
co-regulated by three transcription factors (Fig. 4), including TBP1
(hsa_TATAAA_V$TATA_01), TBPC (hsa_V$TATA_C) and activator protein 1
(AP1; hsa_TGANTCA_V$AP1_C), and three miRNAs (Fig. 3), such as miR-196a, miR-196b and
miR-516-3p. GO analysis revealed that COL1A1 may serve a role in
responses to nutrient levels, extracellular stimuli, organic
substances and hormone stimuli (Table
V). Additionally, COL1A1 was significantly associated with the
ECM-receptor interaction pathway and the focal adhesion pathway
(Table VI).
| Table V.GO analysis of collagen type 1
α1. |
Table V.
GO analysis of collagen type 1
α1.
| GO ID | Term | P-value | Fold
enrichment | FDR |
|---|
| GO:0031667 | Response to
nutrient levels |
1.25×10−07 | 5.723 |
2.10×10−04 |
| GO:0010033 | Response to organic
substance |
3.12×10−07 | 2.932 |
5.25×10−04 |
| GO:0009991 | Response to
extracellular stimulus |
5.22×10−07 | 5.124 |
8.78×10−04 |
| GO:0007584 | Response to
nutrient |
6.70×10−07 | 6.543 |
1.13×10−03 |
| GO:0009719 | Response to
endogenous stimulus |
1.74×10−05 | 3.305 |
2.93×10−02 |
| GO:0009725 | Response to hormone
stimulus |
1.77×10−05 | 3.456 |
2.98×10−02 |
| Table VI.Kyoto Encyclopedia of Genes and
Genomes pathway analysis of collagen type 1 α1. |
Table VI.
Kyoto Encyclopedia of Genes and
Genomes pathway analysis of collagen type 1 α1.
| Term | P-value | Fold
enrichment | FDR |
|---|
| hsa04512:
ECM-receptor interaction |
1.52×10−03 | 4.612 |
1.71×10−02 |
| hsa04510: Focal
adhesion |
4.39×10−02 | 5.168 |
4.36×10−02 |
Discussion
Data from the present study indicated that numerous
genes are differently expressed in UC tissue compared with normal
control tissue. For a better understanding of these DEGs, the
mechanisms of UC need to be identified via integrated
bioinformatics methods. Hence, the present study established an
integrated analysis based on a combination of gene expression
profiling, PPIs, transcriptional and post-transcriptional
regulation data and drug-gene associations. For example, compared
with non-UC controls, S100A9 was demonstrated to have a
significantly increased expression in UC tissue; increased S100A9
expression has been previously linked to colonic mucosal immune and
defense responses (12,29–32).
In addition, S100A9 expression was able to distinguish UC from
diarrhea-predominant irritable bowel syndrome and correlated with
the UC disease activity index (31). S100A9 was also reported to be
upregulated in Crohn's disease (29). Similarly, the matrix
metallopeptidase 9 (MMP9) gene was also upregulated in UC
tissue in the present study. Notably, in a previous study of
experimental UC (33), the
increased activity of MMP9 was demonstrated to diminish
significantly by treatment with mesalamine, which is an effective
drug in patients with UC. ANXA1, a phospholipid-binding protein,
exhibited increased expression when patients with UC were under
antitumor necrosis factor (TNF)-α therapy (34). Furthermore, following
administration of ANXA1 receptor antagonists, experimental colitis
in TNF receptor 1−/− mice was exacerbated (35). ANXA1 may be able to stimulate
epithelial cell migration for restitution and wound healing process
(36). Another study revealed that
ANXA1 expression was upregulated in intestinal epithelial cells of
biopsies from patients with active UC when received medically
induced remission (34). The
increase of ANXA1 expression was diffuse and was associated with
the degree of mucosal inflammation and the rate of cell turnover at
any given time. These data suggested that ANXA1 expression serves a
crucial role in the early recovery of colitis (34–37).
In agreement with the results of previous studies (38–40),
aquaporin 9 (AQP9), C-X-C motif chemokine ligand (CXCL) 2 and
nicotinamide phosphoribosyltransferase (NAMPT) were previously
revealed to be differently expressed and discriminated between
patients with UC and healthy controls. In addition, the expressions
of CXCL9 and S100A8 have been demonstrated to be upregulated in UC,
which involved cytokine-cytokine receptor pathway dysregulation
(39). High SOCS3 expression in
intestinal epithelial cells of patients with UC in remission was
reported to increase the risk of relapse by regulating
IL-22-induced expression of deleted in malignant brain tumors 1
(DMBT1) and c-Myc, as well as proliferation and migration of
intestinal epithelial cells (38).
Many of the upregulated genes were enriched in the
GO subcategories of immune response and inflammatory response.
Immune system homeostasis maintains the appropriate reactions to
commensal bacteria and against pathogenic invasion; the
pathogenesis of UC has been closely associated with immune
disorders, which manifest as chronic nonspecific intestinal
inflammation (41). A previous
study identified AQP9, CXCL2 and NAMP expressions were associated
with the inflammatory response (40). Hair and enhancer of split 1 was
previously reported to promote the IL-22-mediated antimicrobial
response and encoding antimicrobial peptides, such as regenerating
islet-derived protein (REG) 1A, REG3A and REG3G which are involved
in STAT3-dependent transcription in UC (42). These peptides were observed in the
GO subcategory of ‘inflammatory response’ in the present study. The
nucleotide-binding oligomerization domain (NOD)-like receptor
signaling pathway and the Toll-like receptor (TLR) signaling
pathway have both been previously reported to be associated with UC
(43), and both were enriched in
upregulated genes in this study. Numerous clinical and experimental
studies have shown that the intestinal microbes are important for
the initiation and progression of UC, and are involved in the
activation of pattern recognition receptor signaling through
members of the TLR-like and NOD-like families (44,45).
TFs and miRNAs are important regulators of the
accuracy of gene expression at the stage of transcription and
post-transcription, respectively. Therefore, TFs and miRNAs with
their targets were used to construct an integrated regulation
network in a cooperative manner in the present study. For example,
COL1A1 was demonstrated to be associated with three TFs and three
miRNAs. In addition, COL1A1 expression was previously reported to
be increased in inflammation-driven intestinal fibrosis of UC
(46), which was consistent with
the predictions by the present study of the genes associated with
the disease. Intestinal fibrosis is a common complication of IBDs,
occurring in 5% of UC patients (47). Notably, COL1A1 expression in the
present study also exhibited a significant relationship with
collagenase in the analysis of genes associated with drug.
PTGS2 serves a key role in regulating the
inflammatory response upon luminal pathogen stimulation through the
Toll-like receptors. Carriers of PTGS2 polymorphisms were reported
to have an increased risk of UC (48–50),
which suggested that PTGS2 may be a better biomarker to diagnosis
UC; and a previous study revealed that PTGS2 expression was
significantly different between patients with UC-related neoplasm
and UC controls (51). Data from
the present study indicated that PTGS2 was regulated by miR-101 and
TF hepatocyte nuclear factor 1 (HNF1; hsa_V$HNF1_C); however,
further experimentation is required to confirm these
relationships.
In conclusion, the present study used a novel
integrated analysis method to predict molecular interactions that
regulate DEGs in patients with UC. The integrated analysis
identified a series of molecules such as TFs and miRNAs, which may
serve an important role in the pathogenesis of UC. In addition,
these findings may provide potential biomarkers for diagnosing UC,
and target drugs were identified for providing more precise therapy
according to relevant DEGs.
References
|
1
|
Podolsky DK: Inflammatory bowel disease. N
Engl J Med. 347:417–429. 2002. View Article : Google Scholar : PubMed/NCBI
|
|
2
|
Ordas I, Eckmann L, Talamini M, Baumgart
DC and Sandborn WJ: Ulcerative colitis. Lancet. 380:1606–1619.
2012. View Article : Google Scholar : PubMed/NCBI
|
|
3
|
Jess T, Loftus EV Jr, Velayos FS, Harmsen
WS, Zinsmeister AR, Smyrk TC, Schleck CD, Tremaine WJ, Melton LJ
III, Munkholm P and Sandborn WJ: Risk of intestinal cancer in
inflammatory bowel disease: A population-based study from olmsted
county, Minnesota. Gastroenterology. 130:1039–1046. 2006.
View Article : Google Scholar : PubMed/NCBI
|
|
4
|
Colombel JF, Narula N and Peyrin-Biroulet
L: Management strategies to improve outcomes of patients with
inflammatory bowel diseases. Gastroenterology. 152:351–361.e5.
2017. View Article : Google Scholar : PubMed/NCBI
|
|
5
|
Venema WT Uniken, Voskuil MD, Dijkstra G,
Weersma RK and Festen EA: The genetic background of inflammatory
bowel disease: From correlation to causality. J Pathol.
241:146–158. 2017. View Article : Google Scholar : PubMed/NCBI
|
|
6
|
Sivanesan D, Beauchamp C, Quinou C, Lee J,
Lesage S, Chemtob S, Rioux JD and Michnick SW: IL23R (interleukin
23 receptor) variants protective against inflammatory bowel
diseases (IBD) display loss of function due to impaired protein
stability and intracellular trafficking. J Biol Chem.
291:8673–8685. 2016. View Article : Google Scholar : PubMed/NCBI
|
|
7
|
Alipour M, Zaidi D, Valcheva R, Jovel J,
Martínez I, Sergi C, Walter J, Mason AL, Wong GK, Dieleman LA, et
al: Mucosal barrier depletion and loss of bacterial diversity are
primary abnormalities in paediatric ulcerative colitis. J Crohns
Colitis. 10:462–471. 2016. View Article : Google Scholar : PubMed/NCBI
|
|
8
|
Spisni E, Valerii MC, De Fazio L, Cavazza
E, Borsetti F, Sgromo A, Candela M, Centanni M, Rizello F and
Strillacci A: Cyclooxygenase-2 silencing for the treatment of
colitis: A combined in vivo strategy based on RNA interference and
engineered Escherichia coli. Mol Ther. 23:278–289. 2015. View Article : Google Scholar : PubMed/NCBI
|
|
9
|
Ostvik AE, Granlund AV, Bugge M, Nilsen
NJ, Torp SH, Waldum HL, Damås JK, Espevik T and Sandvik AK:
Enhanced expression of CXCL10 in inflammatory bowel disease:
Potential role of mucosal Toll-like receptor 3 stimulation. Inflamm
Bowel Dis. 19:265–274. 2013. View Article : Google Scholar : PubMed/NCBI
|
|
10
|
Burczynski ME, Peterson RL, Twine NC,
Zuberek KA, Brodeur BJ, Casciotti L, Maganti V, Reddy PS, Strahs A,
Immermann F, et al: Molecular classification of Crohn's disease and
ulcerative colitis patients using transcriptional profiles in
peripheral blood mononuclear cells. J Mol Diagn. 8:51–61. 2006.
View Article : Google Scholar : PubMed/NCBI
|
|
11
|
Montero-Meléndez T, Llor X,
Garcia-Planella E, Perretti M and Suárez A: Identification of novel
predictor classifiers for inflammatory bowel disease by gene
expression profiling. PLoS One. 8:e762352013. View Article : Google Scholar : PubMed/NCBI
|
|
12
|
Pekow J, Dougherty U, Huang Y, Gometz E,
Nathanson J, Cohen G, Levy S, Kocherginsky M, Venu N, Westerhoff M,
et al: Gene signature distinguishes patients with chronic
ulcerative colitis harboring remote neoplastic lesions. Inflamm
Bowel Dis. 19:461–470. 2013. View Article : Google Scholar : PubMed/NCBI
|
|
13
|
Planell N, Lozano JJ, Mora-Buch R,
Masamunt MC, Jimeno M, Ordás I, Esteller M, Ricart E, Piqué JM,
Panés J and Salas A: Transcriptional analysis of the intestinal
mucosa of patients with ulcerative colitis in remission reveals
lasting epithelial cell alterations. Gut. 62:967–976. 2013.
View Article : Google Scholar : PubMed/NCBI
|
|
14
|
Bjerrum JT, Nielsen OH, Riis LB, Pittet V,
Mueller C, Rogler G and Olsen J: Transcriptional analysis of
left-sided colitis, pancolitis, and ulcerative colitis-associated
dysplasia. Inflamm Bowel Dis. 20:2340–2352. 2014. View Article : Google Scholar : PubMed/NCBI
|
|
15
|
Smith PJ, Levine AP, Dunne J, Guilhamon P,
Turmaine M, Sewell GW, O'Shea NR, Vega R, Paterson JC, Oukrif D, et
al: Mucosal transcriptomics implicates under expression of BRINP3
in the pathogenesis of ulcerative colitis. Inflamm Bowel Dis.
20:1802–1812. 2014. View Article : Google Scholar : PubMed/NCBI
|
|
16
|
van der Goten J, Vanhove W, Lemaire K, Van
Lommel L, Machiels K, Wollants WJ, De Preter V, De Hertogh G,
Ferrante M, Van Assche G, et al: Integrated miRNA and mRNA
expression profiling in inflamed colon of patients with ulcerative
colitis. PLoS One. 9:e1161172014. View Article : Google Scholar : PubMed/NCBI
|
|
17
|
Vanhove W, Peeters PM, Staelens D,
Schraenen A, Van Der Goten J, Cleynen I, De Schepper S, Van Lommel
L, Reynaert NL, Schuit F, et al: Strong upregulation of AIM2 and
IFI16 inflammasomes in the Mucosa of patients with active
inflammatory bowel disease. Inflamm Bowel Dis. 21:2673–2682. 2015.
View Article : Google Scholar : PubMed/NCBI
|
|
18
|
Wu F, Dassopoulos T, Cope L, Maitra A,
Brant SR, Harris ML, Bayless TM, Parmigiani G and Chakravarti S:
Genome-wide gene expression differences in Crohn's disease and
ulcerative colitis from endoscopic pinch biopsies: Insights into
distinctive pathogenesis. Inflamm Bowel Dis. 13:807–821. 2007.
View Article : Google Scholar : PubMed/NCBI
|
|
19
|
Gurram B, Salzman NH, Kaldunski ML, Jia S,
Li BU, Stephens M, Sood MR and Hessner MJ: Plasma-induced
signatures reveal an extracellular milieu possessing an
immunoregulatory bias in treatment-naive paediatric inflammatory
bowel disease. Clin Exp Immunol. 184:36–49. 2016. View Article : Google Scholar : PubMed/NCBI
|
|
20
|
Olsen J, Gerds TA, Seidelin JB, Csillag C,
Bjerrum JT, Troelsen JT and Nielsen OH: Diagnosis of ulcerative
colitis before onset of inflammation by multivariate modeling of
genome-wide gene expression data. Inflamm Bowel Dis. 15:1032–1038.
2009. View Article : Google Scholar : PubMed/NCBI
|
|
21
|
Ritchie ME, Phipson B, Wu D, Hu Y, Law CW,
Shi W and Smyth GK: limma powers differential expression analyses
for RNA-sequencing and microarray studies. Nucleic Acids Res.
43:e472015. View Article : Google Scholar : PubMed/NCBI
|
|
22
|
da W Huang, Sherman BT and Lempicki RA:
Bioinformatics enrichment tools: Paths toward the comprehensive
functional analysis of large gene lists. Nucleic Acids Res.
37:1–13. 2009. View Article : Google Scholar : PubMed/NCBI
|
|
23
|
Szklarczyk D, Franceschini A, Wyder S,
Forslund K, Heller D, Huerta-Cepas J, Simonovic M, Roth A, Santos
A, Tsafou KP, et al: STRING v10: Protein-protein interaction
networks, integrated over the tree of life. Nucleic Acids Res.
43(Database issue): D447–D452. 2015. View Article : Google Scholar : PubMed/NCBI
|
|
24
|
von Mering C, Jensen LJ, Snel B, Hooper
SD, Krupp M, Foglierini M, Jouffre N, Huynen MA and Bork P: STRING:
Known and predicted protein-protein associations, integrated and
transferred across organisms. Nucleic Acids Res. 33(Database
issue): D433–D437. 2005. View Article : Google Scholar : PubMed/NCBI
|
|
25
|
Shannon P, Markiel A, Ozier O, Baliga NS,
Wang JT, Ramage D, Amin N, Schwikowski B and Ideker T: Cytoscape: A
software environment for integrated models of biomolecular
interaction networks. Genome Res. 13:2498–2504. 2003. View Article : Google Scholar : PubMed/NCBI
|
|
26
|
Wang J, Duncan D, Shi Z and Zhang B:
WEB-based GEne SeT AnaLysis Toolkit (WebGestalt): Update 2013.
Nucleic Acids Res. 41:W77–W83. 2013. View Article : Google Scholar : PubMed/NCBI
|
|
27
|
Li Y, Deuring J, Peppelenbosch MP, Kuipers
EJ, de Haar C and van der Woude CJ: STAT1, STAT6 and adenosine
3′,5′-cyclic monophosphate (cAMP) signaling drive SOCS3 expression
in inactive ulcerative colitis. Mol Med. 18:1412–1419. 2012.
View Article : Google Scholar : PubMed/NCBI
|
|
28
|
Christophi GP, Rong R, Holtzapple PG,
Massa PT and Landas SK: Immune markers and differential signaling
networks in ulcerative colitis and Crohn's disease. Inflamm Bowel
Dis. 18:2342–2356. 2012. View Article : Google Scholar : PubMed/NCBI
|
|
29
|
Holgersen K, Kutlu B, Fox B, Serikawa K,
Lord J, Hansen AK and Holm TL: High-resolution gene expression
profiling using RNA sequencing in patients with inflammatory bowel
disease and in mouse models of colitis. J Crohn's Colitis.
9:492–506. 2015. View Article : Google Scholar : PubMed/NCBI
|
|
30
|
Harris RA, Nagy-Szakal D, Mir SA, Frank E,
Szigeti R, Kaplan JL, Bronsky J, Opekun A, Ferry GD, Winter H, et
al: DNA methylation-associated colonic mucosal immune and defense
responses in treatment-naïve pediatric ulcerative colitis.
Epigenetics. 9:1131–1137. 2014. View Article : Google Scholar : PubMed/NCBI
|
|
31
|
Shiotani A, Kusunoki H, Kimura Y, Ishii M,
Imamura H, Tarumi K, Manabe N, Kamada T, Hata J and Haruma K: S100A
expression and interleukin-10 polymorphisms are associated with
ulcerative colitis and diarrhea predominant irritable bowel
syndrome. Dig Dis Sci. 58:2314–2323. 2013. View Article : Google Scholar : PubMed/NCBI
|
|
32
|
Miao YL, Xiao YL, Du Y and Duan LP: Gene
expression profiles in peripheral blood mononuclear cells of
ulcerative colitis patients. World J Gastroenterol. 19:3339–3346.
2013. View Article : Google Scholar : PubMed/NCBI
|
|
33
|
Deng X, Tolstanova G, Khomenko T, Chen L,
Tarnawski A, Szabo S and Sandor Z: Mesalamine restores angiogenic
balance in experimental ulcerative colitis by reducing expression
of endostatin and angiostatin: Novel molecular mechanism for
therapeutic action of mesalamine. J Pharmacol Exp Ther.
331:1071–1078. 2009. View Article : Google Scholar : PubMed/NCBI
|
|
34
|
Vong L, Ferraz JG, Dufton N, Panaccione R,
Beck PL, Sherman PM, Perretti M and Wallace JL: Up-regulation of
Annexin-A1 and lipoxin A(4) in individuals with ulcerative colitis
may promote mucosal homeostasis. PLoS One. 7:e392442012. View Article : Google Scholar : PubMed/NCBI
|
|
35
|
Sena AA, Pedrotti LP, Barrios BE, Cejas H,
Balderramo D, Diller A and Correa SG: Lack of TNFRI signaling
enhances annexin A1 biological activity in intestinal inflammation.
Biochem Pharmacol. 98:422–431. 2015. View Article : Google Scholar : PubMed/NCBI
|
|
36
|
Babbin BA, Lee WY, Parkos CA, Winfree LM,
Akyildiz A, Perretti M and Nusrat A: Annexin I regulates SKCO-15
cell invasion by signaling through formyl peptide receptors. J Biol
Chem. 281:19588–19599. 2006. View Article : Google Scholar : PubMed/NCBI
|
|
37
|
Leoni G, Alam A, Neumann PA, Lambeth JD,
Cheng G, McCoy J, Hilgarth RS, Kundu K, Murthy N, Kusters D, et al:
Annexin A1, formyl peptide receptor, and NOX1 orchestrate
epithelial repair. J Clin Invest. 123:443–454. 2013. View Article : Google Scholar : PubMed/NCBI
|
|
38
|
Xu AT, Li Y, Zhao D, Shen J, Xu XT, Qiao
YQ, Zhu MM, Wang TR, Cui Y, Ai LY, et al: High suppressor of
cytokine signaling-3 expression impairs STAT3-dependent protective
effects of interleukin-22 in ulcerative colitis in remission.
Inflamm Bowel Dis. 21:241–250. 2015. View Article : Google Scholar : PubMed/NCBI
|
|
39
|
Fang K, Grisham MB and Kevil CG:
Application of comparative transcriptional genomics to identify
molecular targets for pediatric IBD. Front Immunol. 6:1652015.
View Article : Google Scholar : PubMed/NCBI
|
|
40
|
Mesko B, Poliska S, Szegedi A, Szekanecz
Z, Palatka K, Papp M and Nagy L: Peripheral blood gene expression
patterns discriminate among chronic inflammatory diseases and
healthy controls and identify novel targets. BMC Med Genomics.
3:152010. View Article : Google Scholar : PubMed/NCBI
|
|
41
|
Huang Y and Chen Z: Inflammatory bowel
disease related innate immunity and adaptive immunity. Am J Transl
Res. 8:2490–2497. 2016.PubMed/NCBI
|
|
42
|
Murano T, Okamoto R, Ito G, Nakata T,
Hibiya S, Shimizu H, Fujii S, Kano Y, Mizutani T, Yui S, et al:
Hes1 promotes the IL-22-mediated antimicrobial response by
enhancing STAT3-dependent transcription in human intestinal
epithelial cells. Biochem Biophys Res Commun. 443:840–846. 2014.
View Article : Google Scholar : PubMed/NCBI
|
|
43
|
Clavel T and Haller D: Bacteria- and
host-derived mechanisms to control intestinal epithelial cell
homeostasis: Implications for chronic inflammation. Inflamm Bowel
Dis. 13:1153–1164. 2007. View Article : Google Scholar : PubMed/NCBI
|
|
44
|
Yadav V, Varum F, Bravo R, Furrer E, Bojic
D and Basit AW: Inflammatory bowel disease: Exploring gut
pathophysiology for novel therapeutic targets. Transl Res.
176:38–68. 2016. View Article : Google Scholar : PubMed/NCBI
|
|
45
|
Geremia A, Biancheri P, Allan P, Corazza
GR and Di Sabatino A: Innate and adaptive immunity in inflammatory
bowel disease. Autoimmun Rev. 13:3–10. 2014. View Article : Google Scholar : PubMed/NCBI
|
|
46
|
Speca S, Rousseaux C, Dubuquoy C, Rieder
F, Vetuschi A, Sferra R, Giusti I, Bertin B, Dubuquoy L, Gaudio E,
et al: Novel PPARγ modulator GED-0507-34 levo ameliorates
inflammation-driven intestinal fibrosis. Inflamm Bowel Dis.
22:279–292. 2016. View Article : Google Scholar : PubMed/NCBI
|
|
47
|
Rieder F and Fiocchi C: Intestinal
fibrosis in IBD - a dynamic, multifactorial process. Nat Rev
Gastroenterol Hepatol. 6:228–235. 2009. View Article : Google Scholar : PubMed/NCBI
|
|
48
|
Andersen V, Nimmo E, Krarup HB, Drummond
H, Christensen J, Ho GT, Ostergaard M, Ernst A, Lees C, Jacobsen
BA, et al: Cyclooxygenase-2 (COX-2) polymorphisms and risk of
inflammatory bowel disease in a Scottish and Danish case-control
study. Inflamm Bowel Dis. 17:937–946. 2011. View Article : Google Scholar : PubMed/NCBI
|
|
49
|
Østergaard M, Ernst A, Labouriau R,
Dagiliené E, Krarup HB, Christensen M, Thorsgaard N, Jacobsen BA,
Tage-Jensen U, Overvad K, et al: Cyclooxygenase-2, multidrug
resistance 1, and breast cancer resistance protein gene
polymorphisms and inflammatory bowel disease in the Danish
population. Scand J Gastroenterol. 44:65–73. 2009. View Article : Google Scholar : PubMed/NCBI
|
|
50
|
Cox DG, Crusius JB, Peeters PH,
Bueno-de-Mesquita HB, Pena AS and Canzian F: Haplotype of
prostaglandin synthase 2/cyclooxygenase 2 is involved in the
susceptibility to inflammatory bowel disease. World J
Gastroenterol. 11:6003–6008. 2005. View Article : Google Scholar : PubMed/NCBI
|
|
51
|
Garrity-Park MM, Loftus EV Jr, Bryant SC
and Smyrk TC: A biomarker panel to detect synchronous neoplasm in
non-neoplastic surveillance biopsies from patients with ulcerative
colitis. Inflamm Bowel Dis. 22:1568–1574. 2016. View Article : Google Scholar : PubMed/NCBI
|