Introduction
Hypertension is frequently associated with metabolic
disorders, characterized by obesity, dyslipidemia and
hyperglycemia. The clustering of these disorders contributes to the
increased morbidity and mortality of cardiovascular diseases
(1). Spontaneously hypertensive
rats (SHRs) are commonly-used rat models of essential hypertension.
Antihypertensive treatment with losartan during the prehypertensive
period, a specific stage in the early life of SHRs, has been
demonstrated to be able to inhibit the increased in the blood
pressure of the rats long-term. In addition, the expression of
angiotensin II type 1 receptor (AT1R), an important component of
the renin-angiotensin system (RAS), was decreased in the heart and
kidney of the rats, suggesting that RAS inactivation in
hypertension-associated tissues is involved in the benefit of early
treatment with losartan (2).
However, it has yet to be determined whether this therapeutic
strategy is beneficial to relieve metabolic disorders and inhibit
the activation of RAS in metabolism-associated tissues.
Metabolic disorders are associated with adipose
tissue dysfunction. Adipose tissue functions as a storage place of
fatty acids and an endocrine organ, producing a large number of
hormones and adipokines (3). RAS
is considered to be an important regulator of blood pressure and
fluid homeostasis. Accumulating evidence has demonstrated that RAS
is additionally present in adipose tissue. The local adipose tissue
RAS is reported to be able to modulate adipocyte differentiation,
adipokine production, local blood flow, inflammation and oxidative
stress (4,5). These newly verified roles provided a
novel perspective on the pathophysiology and possible
interventional targets for metabolic disorders.
It has been established that the expression of RAS
genes in specific tissues may be affected by low-protein diet,
nicotine and high-salt diet exposure in early life, and that
alterations in gene expression are associated with certain chronic
diseases in later life, a phenomenon attributed to ‘developmental
programming’ (6–8). Epigenetic mechanisms serve a role in
these programmed diseases (6,7). DNA
methylation is considered to be one of the most fundamental
epigenetic modifications. It refers to covalent binding of a methyl
group to the 5′ carbon of cytosine, and this binding primarily
occurs at CpG dinucleotide sequences in the mammalian genome
(9,10). In general, promoter methylation
leads to long-term repression of gene expression by altering the
chromatin structure or blocking the binding of transcription
factors to the DNA sequence (11).
Losartan, one of the typical RAS inhibitors, is
commonly used as an antihypertensive agent. RAS inhibitors have
been demonstrated to have a beneficial effect in the regulation of
metabolism (12,13). As a common chronic disease,
metabolic disorders may be induced by suboptimal exposure in early
life (14). Therefore, it may be
hypothesized that prehypertensive treatment with losartan may be
able to relieve metabolic disorders in a model of high-fat-fed SHRs
long-term, and that methylation regulation of RAS gene expression
in adipose tissue may be involved in the long-term effect elicited
by the early treatment with losartan.
Materials and methods
Animals, diet and pharmacological
treatment
Prior to beginning the experiment, specific criteria
of humane endpoints were established. The criteria included: i) A
marked reduction in food or water intake; ii) shaggy coat; iii)
labored breathing; iv) an inability to remain upright; and v)
unconsciousness or unresponsiveness to external stimuli, including
picking up, handling and sound (15,16).
All signs were validated by an animal specialist. If rats presented
one or more of the above signs, they were considered to have
reached the humane endpoint, and were anesthetized with sodium
pentobarbital (50 mg/kg, administered intraperitoneally) and
sacrificed by cervical dislocation immediately. A total of 32
4-week-old male SHRs [body weight (BW) 122±11 g] were obtained from
Vital River Laboratory Animal Technology Co., Ltd. (Beijing,
China). Animals were housed (5 rats/cage) under controlled
conditions (temperature, 22–24°C; humidity, 40–60%; 12/12-h
dark/light cycle), with free access to food and water. Rats were
randomly divided into four groups based on diets and treatment (n=8
rats/group): Standard chow, standard chow + losartan, high-fat
diet, and high-fat diet + losartan. The standard chow consisted of
10% Kcal as fat, 70% Kcal as carbohydrate, and 20% Kcal as protein.
The high-fat diet consisted of 45% Kcal as fat, 35% Kcal as
carbohydrate and 20% Kcal as protein. Additionally, 25% soybean oil
and 0.23% NaCl were mixed into the diets. The diets were
manufactured by the Laboratory Animal Center of Fujian Medical
University (Fuzhou, China). Losartan was administrated at the
dosage of 30 mg/kg/day by gavage. Rats without treatment with
losartan were administrated with 1 ml saline. At 10 weeks of age,
treatment with losartan was discontinued. The rats were followed
up. At 26 weeks of age, all rats were sacrificed following the
measurement of blood pressure and BW. The study protocol was
approved by the Institutional Animal Care Committee of the First
Affiliated Hospital of Fujian Medical University (approval no.
001).
Measurement of BW and systolic blood
pressure (SBP)
BW was determined using a balance at 2–4 week
intervals. At 26 weeks of age, SBP was measured under conscious
conditions using the tail-cuff method (Softron BP-98A; Softron Co.,
Ltd., Tokyo, Japan) as previously described (17,18).
Prior to the measurement, rats were placed inside a warming chamber
for 15 min to calm the animals and dilate the tail blood vessels.
The rats were subsequently removed to plastic restrainers, and a
cuff with a pneumatic pulse sensor was attached to the tail blood
vessels. Mean SBP was calculated from three consecutive SBP
readings.
Plasma and tissue collection
The rats were deprived of food for 6 h prior to
sacrifice, and anesthetized with sodium pentobarbital (50 mg/kg,
administered intraperitoneally) at 26 weeks of age. Blood samples
were rapidly collected via abdominal aortic puncture and the rats
were immediately sacrificed by cervical dislocation. Plasma was
separated by centrifugation (1,200 × g for 10 min) at 4°C, and
stored at −20°C until analysis. Inguinal, epididymal,
retroperitoneal and mesenteric fat pads were dissected and weighed.
The percentage of each fat pad weight compared with the total BW
was calculated to determine the alterations in white adipose tissue
(WAT) mass. A portion of the epididymal fat pad was stored in a
fixative solution (formaldehyde 4% w/v; 0.1 M phosphate buffer; pH
7.2) for morphological assessment, and the remaining fat pad was
rapidly frozen at −80°C for ELISA and molecular analyses.
Biochemical analysis and ELISA
The concentrations of plasma total cholesterol (TC),
triglycerides (TG), high density lipoprotein cholesterol (HDL-C),
low density lipoprotein cholesterol (LDL-C) and glucose were
analyzed using an automated autoanalyzer (Olympus Au2700; Olympus
Corporation, Tokyo, Japan). A total of 30 mg epididymal fat was
homogenized at 4°C following the addition of 1 ml PBS. The
supernatant was carefully collected following centrifugation for 10
min at 1,200 × g at 4°C. Leptin (cat. no. KRC2281), adiponectin
(cat. no. KRP0041), interleukin-6 (IL-6; cat. no. BMS625), tumor
necrosis factor-α (TNF-α; cat. no. 88-7340-86) and monocyte
chemoattractant protein-1 (MCP-1; cat. no. BMS631INST) in the
plasma and the supernatant of the epididymal fat were determined
using commercially available ELISA kits (Thermo Fisher Scientific,
Inc., Waltham, MA, USA).
Morphological analysis in WAT
Epididymal fat was fixed in 10% (v/v)
formaldehyde/PBS for 48 h at room temperature, followed by
dehydration with acetone for 24 h. The dehydrated tissue was
embedded in paraffin and sliced into 10-µm-thick sections. The
sections were stained with hematoxylin for 10 min and eosin for 15
sec at room temperature. A total of four sections were selected
from each sample. A total of four different microscopic fields
(upper left, upper right, lower left and lower right) per section
were observed under a light microscope (CX31; Olympus Corp., Tokyo,
Japan). At least 25 adjacent adipocytes per microscopic field were
analyzed. The diameter and cross-sectional area of each adipocyte
was determined using Image Pro Plus 6.0 (Media Cybernetics. Inc.,
Rockville, MD, USA). The mean diameter and area were
calculated.
Reverse transcription-quantitative
polymerase chain reaction (RT-qPCR) analysis in WAT
The mRNA expression levels of peroxisome
proliferator-activated receptor γ (PPARγ), transcription factor
adaptin 2 (aP2), CCAAT/enhancer binding protein α (CEBP/α), CEBP/β,
AT1R subtype a (AT1aR), AT1bR and AT1R-associated protein (ATRAP)
were assessed via RT-qPCR, as previously described (19,20).
Total RNA was extracted from epididymal fat using TRIzol
(Invitrogen; Thermo Fisher Scientific, Inc.), according to the
manufacturer's protocol. A total of 2 µg RNA was
reverse-transcribed into cDNA using a RevertAid First Strand cDNA
Synthesis kit (Thermo Fisher Scientific, Inc.). Primers were
designed according to the PubMed Database (www.ncbi.nlm.nih.gov/pubmed; Table I). qPCR was performed using SYBR
Green PCR Master Mix (Takara Bio, Inc., Otsu, Japan), and detected
using an ABI Prism 7000 sequence detection system (Applied
Biosystems; Thermo Fisher Scientific, Inc.). The following qPCR
conditions were used: 95°C (30 min), followed by a three-step PCR
program of 95°C (10 sec), 60°C (31 sec) and 72°C (30 sec) for 40
cycles, and a final extension step of 72°C for 5 min. The mRNA
level was quantified by calculating the values of the Δ
quantification cycle (ΔCq) by normalizing the average Cq value
compared with the internal control (GAPDH), and calculating
2−ΔΔCq (19).
 | Table I.Primer sequences used in reverse
transcription-quantitative polymerase chain reaction analysis of
genes. |
Table I.
Primer sequences used in reverse
transcription-quantitative polymerase chain reaction analysis of
genes.
| Gene | Forward primer
(5′→3′) | Reverse primer
(5′→3′) |
|---|
| PPARγ |
ATGACAGACCTCAGGCAGATTG |
TGTCAGCGACTGGGACTTTTC |
| aP2 |
ATGAAAGAAGTGGGAGTTGGC |
CAGTTTGAAGGAAATCTCGGTGT |
| CEBP/α |
TCAAGGGCTTGGCTGGTCC |
CGCGATGTTGTTGCGTTCC |
| CEBP/β |
CACCGGGTTTCGGGACTTG |
CCCGCAGGAACATCTTTAAGTG |
| AT1aR |
ATTCGTGGCTTGAGTCCTGT |
GTTAACTCAGGGAATGTGGCA |
| AT1bR |
GATTTTTTTTTATAATTTTTTTAAGGTGG |
CAAATAAACCTATATCAAATAAATAACAC |
| ATRAP |
ACTCTGTTGATGCCATTG |
GAAGATGCTAATGTAGATAATGTC |
| GAPDH |
CCTGCACCACCAACTGCTTA |
AGTGATGGCATGGACTGTGG |
AT1R and ATRAP western blot analysis
in WAT
Western blotting was performed as previously
described, with minor modifications (21). The total protein was extracted from
epididymal fat using a cold radioimmunuoprecipitation assay cell
lysis buffer (Shanghai Sunred Biological Technology Co., Ltd,
Shanghai, China) supplemented with a protease and phosphatase
inhibitor cocktail, and phenylmethane sulfonyl fluoride. The
supernatant was separated by centrifugation for 10 min at 800 × g
at 4°C, followed by centrifugation for 15 min at 14,000 × g at 4°C.
The concentration of protein was determined using a bicinchoninic
acid protein assay kit (Beyotime Institute of Biotechnology,
Haimen, China). Aliquots of 80 µg protein were separated using 10%
SDS-PAGE gels, and electro-transferred onto polyvinylidene fluoride
membranes. The membranes were blocked with 5% non-fat milk in TBS
containing 0.05% Tween 20 (TBST). The protein bands were incubated
overnight with anti-AT1R antibody (1:200; cat. no. sc-1173; Santa
Cruz Biotechnology, Inc., Dallas, TX, USA), anti-ATRAP antibody
(1:200; cat. no. sc134652; Santa Cruz Biotechnology, Inc.) or
anti-β-actin antibody (1:1,000; cat. no. sc1616; Santa Cruz
Biotechnology, Inc.) overnight at 4°C. Following three washes with
TBST, the blot was hybridized with horseradish
peroxidase-conjugated goat anti-mouse or rabbit immunoglobulin G
(1:5,000; cat. nos. ZB-2301 and ZB-2305; OriGene Technologies,
Inc., Beijing, China) for 1 h at room temperature. Following a
further three washes with TBST for 10 min, the membrane was
visualized using enhanced chemiluminescence (Xiamen Lulong Biotech
Co., Ltd., Xiamen, China) with a high-performance chemiluminescence
film and quantified using Image Pro Plus version 6.0 (Media
Cybernetics, Inc.).
Promoter methylation of AT1aR, AT1bR
and ATRAP: Bisulfite-specific polymerase chain reaction (BSP) and
DNA sequencing
The methylation levels of the AT1aR, AT1bR and ATRAP
promoters were determined as described previously (22). Genomic DNA was extracted from
epididymal fat using a GenElute Mammalian Genomic DNA mini-prep kit
(Sigma-Aldrich; Merck KGaA, Darmstadt, Germany), according to the
manufacturer's protocol. DNA was subjected to bisulfate treatment
using EpiTect Bisulfite kit (Qiagen GmbH, Hilden, Germany). The
process specifically converts only unmethylated cytosine residues
of CpG to uracil residues. PCR analysis of the target regions of
interest was performed to amplify the bisulfite-modified products.
The primer sequences for the PCR and the sequencing strategy are
presented in Table II. The
conditions of the PCR cycle were as follows: 95°C for 3 min,
followed by 50 cycles at 95°C for 15 sec, 54°C for 30 sec and 72°C
for 30 sec, and a final step of 72°C for 5 min. The reaction
mixture contained 10X PCR buffer (4 µl), dNTP (10 mM; 0.8 µl),
primer F (10 µM; 0.5 µl), primer R (10 µM; 0.5 µl), Takara Hotstart
Taq (0.5 µl; 2.5 units; Takara Bio, Inc.), DNA template (2 µl) and
H2O (31.7 µl). PCR products were separated using 3%
agarose gels, and the bands were visualized by ethidium bromide
staining (Thermo Fisher Scientific, Inc.), and were excised using
the QIAquick Gel Extraction kit (Qiagen GmbH). Purified PCR
products were mixed with sequencing buffer containing 0.5 µM
sequencing primer. Following denaturation at 80°C for 2 min, the
products were sequenced using a PyroMark Q96 ID sequencer (Qiagen
GmbH).
| Table II.Primer sequences used in
bisulfite-specific polymerase chain reaction and DNA sequencing for
CpG methylation in gene promoters. |
Table II.
Primer sequences used in
bisulfite-specific polymerase chain reaction and DNA sequencing for
CpG methylation in gene promoters.
| Gene | Forward primer
(5′→3′) | Reverse primer
(5′→3′) | Sequencing primer
(5′→3′) |
|---|
| AT1aR |
TGGGAGGGATTGGATGATGT |
Biotin-AAACCCCTAAACTAAAACTCACCAA |
GGAGAGGATTAGTGGTTTG |
| AT1bR |
TTTGTTAAGGGAGGGGTTAGGA |
Biotin-CCTACTACCTAAAATCCAAACTACCTACA |
GGGAGGGGTTAGGAG |
| ATRAP |
TGGTAGAGGTTTAGGTAGTAGTAGGAGT |
Biotin-CCAACTCCAAAACAAACTTCCT |
GTTTTGTAGTAAGGGTAAGT |
Statistical analysis
Statistical analysis was performed using SPSS
version 17.0 (SPSS, Inc., Chicago, IL, USA). Continuous data are
presented as the mean ± standard deviation. Differences between
groups were detected by one-way analysis of variance, followed by
the least significant difference post hoc test for multiple
comparisons. P<0.05 was considered to indicate a statistically
significant difference.
Results
BW and percentage of WAT mass compared
with BW
During the experiment, no rats met the criteria of
humane endpoints, and all of the rats were followed up until the
planned experimental endpoints. BW increased with age in all rats.
No difference was observed in BW between standard chow-fed SHRs
(SC) and losartan-treated SHRs on standard chow (SC-Los) throughout
the study period (P>0.05). BW was increased in high-fat-fed SHRs
(HF) compared with SC from 8 weeks of age onwards (26 weeks old, HF
396±15 g vs. SC 316±18 g; P<0.05). Losartan-treated SHRs on a
high-fat diet (HF-Los) exhibited a significantly decreased BW
compared with age-matched HF animals from 10 weeks of age onwards
(26 weeks old, HF-Los 348±12 g vs. HF 396±15 g; P<0.05)
(Fig. 1A). As presented in
Fig. 1B, there was no difference
in the percentage of inguinal fat pad weight compared with BW among
the four groups (P>0.05). The percentage of epididymal,
retroperitoneal and mesenteric fat pad weights compared with BW was
similar between the SC and SC-Los groups (P>0.05), whereas they
were significantly increased in HF compared with SC (P<0.05),
and significantly decreased in HF-Los compared with HF
(P<0.05).
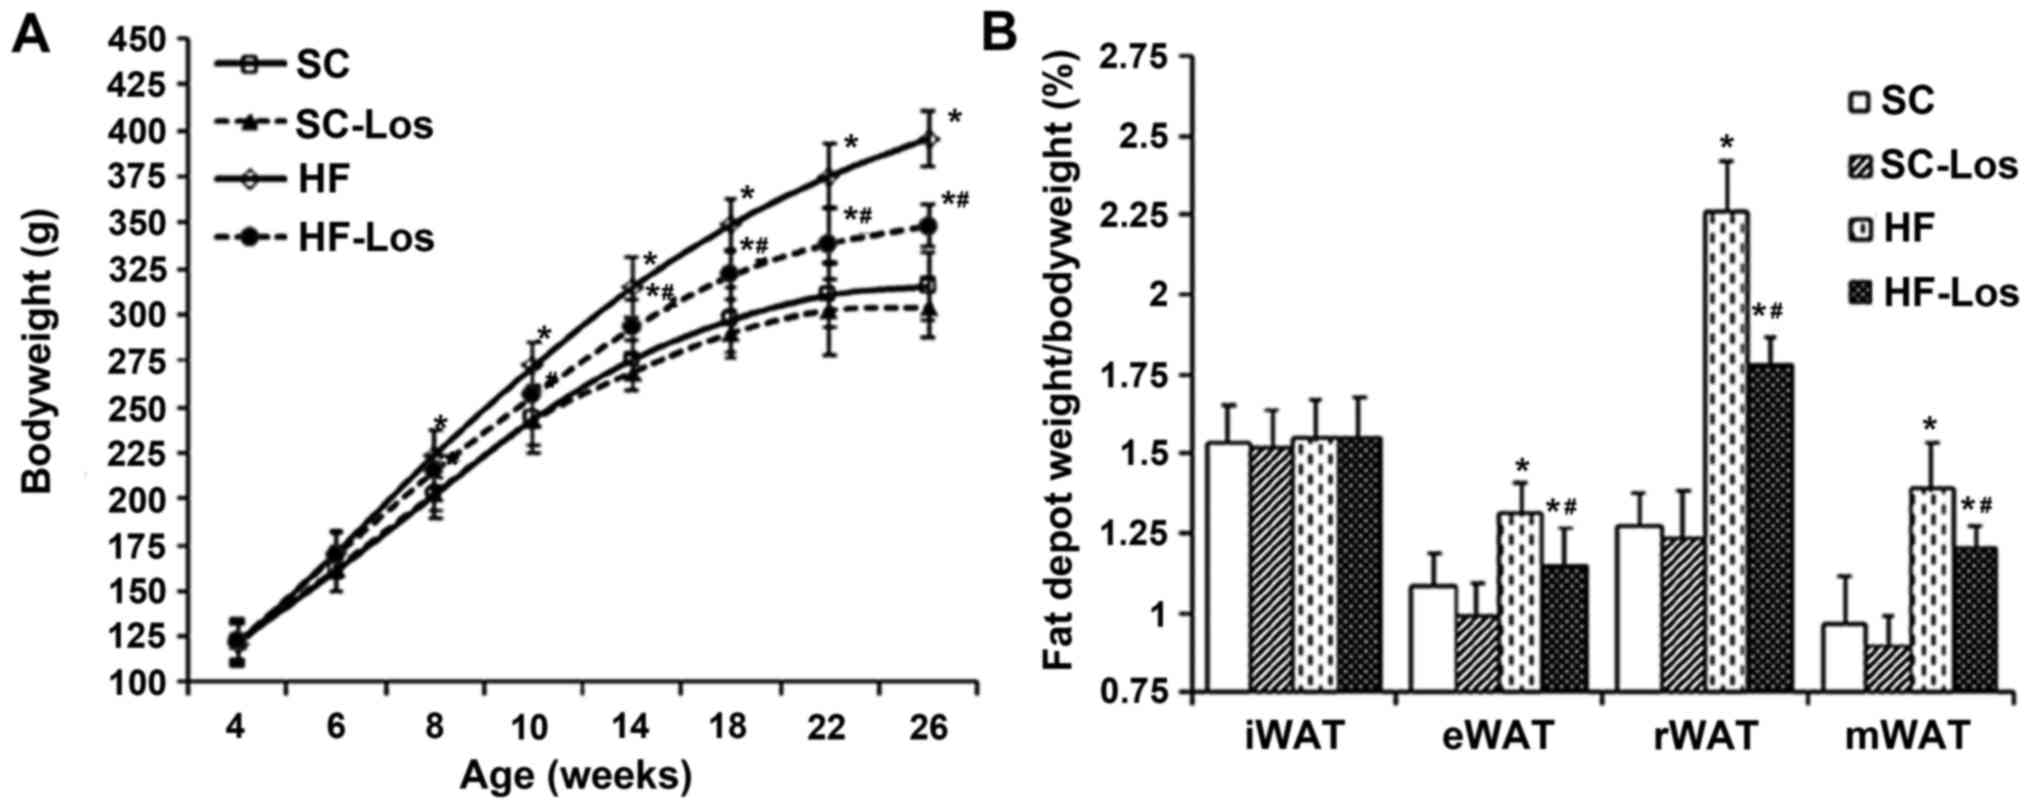 | Figure 1.Effect of prehypertensive losartan
therapy on body weight and WAT in high-fat-fed SHRs. (A)
Bodyweight, (B) the percentage of white adipose tissue weight to
bodyweight in rats at 26 weeks of age. *P<0.05 vs. age-matched
SC; #P<0.05 vs. age-matched HF. The data are presented as the
mean ± standard deviation. n=8. SHRs, spontaneously hypertensive
rats; SC, standard chow-fed SHRs; HF, high-fat-fed SHRs; SC-Los,
losartan-treated SHRs on standard chow; HF-Los, losartan-treated
SHRs on high-fat diet. WAT, white adipose tissue; iWAT, inguinal
WAT; eWAT, epididymal WAT; rWAT, retroperitoneal WAT; mWAT,
mesenteric WAT. |
Blood pressure, metabolic profiles and
levels of plasma adipokines
SBP was decreased in SC-Los compared with SC (26
weeks old, SC-Los 185±22 mmHg vs. SC 215±15 mmHg; P<0.05).
Although a slight increase in SBP was observed in HF compared with
SC, it did not reach statistical significance (P>0.05). SBP in
HF-Los was decreased compared with HF (26 weeks old, HF-Los 192±18
mmHg vs. HF 222±19 mmHg; P<0.05). There was no difference in the
expression levels of plasma TC, TG, HDL-C, LDL-C, IL-6, MCP-1,
TNF-α, leptin or adiponectin (P>0.05) between SC and SC-Los. The
levels of HDL-C and adiponectin were significantly decreased, and
the levels of TC, TG, LDL-C, glucose, IL-6 and MCP-1 were
significantly increased in HF compared with SC (P<0.05). The
levels of TC, TG, LDL-C, IL-6 and MCP-1 were decreased, and the
levels of HDL-C, fasting blood glucose and adiponectin were
increased in HF-Los compared with HF. There was no difference in
the level of TNF-α among the four groups (Table III).
| Table III.Effect of prehypertensive losartan
therapy on the metabolic profiles and plasma adipokine levels of
high-fat-fed SHRs at 26 weeks of age (mean ± standard deviation;
n=8). |
Table III.
Effect of prehypertensive losartan
therapy on the metabolic profiles and plasma adipokine levels of
high-fat-fed SHRs at 26 weeks of age (mean ± standard deviation;
n=8).
|
| Group |
|---|
|
|
|
|---|
| Variable | SC | SC-Los | HF | HF-Los |
|---|
| SBP, mmHg |
215±15 |
185±22a |
222±19 |
192±18a,b |
| TC, mmol/l |
2.11±0.30 |
2.05±0.27 |
3.88±0.72a |
3.40±0.78a,b |
| TG, mmol/l |
0.73±0.08 |
0.72±0.11 |
1.36±0.22a |
1.18±0.17a,b |
| HDL-C, mmol/l |
1.03±0.09 |
1.07±0.10 |
0.61±0.07a |
0.79±0.06a,b |
| LDL-C, mmol/l |
0.84±0.10 |
0.82±0.16 |
3.18±0.56a |
2.57±0.36a,b |
| Glucose,
mmol/l |
6.22±0.49 |
6.11±0.62 |
6.92±0.31a |
6.34±0.43a,b |
| Leptin, ng/ml |
5.31±0.79 |
5.11±0.74 |
10.11±1.66a |
8.60±1.89a,b |
| Adiponectin,
µg/ml |
5.73±2.24 |
5.36±1.67 |
2.23±0.80a |
4.24±1.63a,b |
| IL-6, pg/ml |
21.38±4.02 |
20.90±3.22 |
29.44±3.80a |
23.41±3.22a,b |
| MCP-1, pg/ml |
78.63±15.08 |
93.38±9.47 |
176.25±18.33a |
156.38±21.13a,b |
| TNF-α, pg/ml |
22.12±4.80 |
21.41±4.58 |
21.41±4.18 |
20.72±4.56 |
Adipocyte differentiation and
adipokine production in adipose tissue
There was no difference in mean diameter and area of
adipocytes between SC and SC-Los. The mean diameter and area of
adipocytes was increased in HF compared with SC (P<0.05), and
significantly decreased in HF-Los compared with HF (mean diameter
of adipocytes, HF-Los 43.63±7.93 µm vs. HF 62.38±10.31 µm; mean
area of adipocytes, HF-Los 1,537±529 µm2 vs. HF
3,127±1,043 µm2; P<0.05) (Fig. 2A and B). The mRNA expression levels
of PPARγ, aP2, CEBP/α, and CEBP/β in adipose tissue were similar
between SC and SC-Los (P<0.05), and decreased in HF compared
with SC (P<0.05). The mRNA levels of PPAR and CEBP/β were
significantly higher in HF-Los compared with HF (P<0.05).
However, no difference was observed in the mRNA levels of aP2 and
CEBP/α between HF and HF-Los (P>0.05; Fig. 2C). There was no difference in the
levels of IL-6, MCP-1 TNF-α, leptin or adiponectin in adipose
tissue between SC and SC-Los (P>0.05). The level of adiponectin
was decreased, and the levels of IL-6, MCP-1 and leptin were
increased in HF compared with SC (P<0.05). HF-Los exhibited a
significantly higher level of adiponectin and significantly lower
levels of IL-6, MCP-1 and leptin compared with HF (P<0.05).
There was no difference in the level of TNF-α among the four groups
(P>0.05; Table IV).
 | Figure 2.Effect of prehypertensive losartan
therapy on adipocyte size and differentiation in high-fat-fed SHRs
at 26 weeks of age. (A) Adipocyte diameter, (B) adipocyte area and
(C) the mRNA expression levels of PPARγ, CEBP/α, CEBP/β and aP2 in
epididymal adipose tissue were analyzed. *P<0.05 vs. SC;
#P<0.05 vs. HF. The data are presented as the mean ± standard
deviation. n=8. SHRs, spontaneously hypertensive rats; SC, standard
chow-fed SHRs; HF, high-fat-fed SHRs; SC-Los, losartan-treated SHRs
on standard chow; HF-Los, losartan-treated SHRs on high-fat diet;
PPARγ, peroxisome proliferator-activated receptor γ; CEBP,
CCAAT/enhancer binding protein; aP2, transcription factor adaptin
2. |
| Table IV.Effect of prehypertensive treatment
with losartan on adipokine production in the adipose tissue of
high-fat-fed SHRs at 26 weeks of age (mean ± standard deviation;
n=8). |
Table IV.
Effect of prehypertensive treatment
with losartan on adipokine production in the adipose tissue of
high-fat-fed SHRs at 26 weeks of age (mean ± standard deviation;
n=8).
|
| Group |
|---|
|
|
|
|---|
| Variable | SC | SC-Los | HF | HF-Los |
|---|
| Leptin, ng/ml |
19.26±2.72 |
20.45±3.13 |
74.46±8.23a |
45.46±5.99a,b |
| Adiponectin,
µg/ml |
25.56±3.44 |
24.66±1.64 |
8.34±0.91a |
18.44±2.65a,b |
| IL-6, pg/ml |
33.37±8.72 |
30.94±3.55 |
58.49±9.80a |
42.46±8.29a,b |
| MCP-1, pg/ml |
96.66±19.08 |
97.35±12.44 |
245.25±24.35a |
175.38±21.44a,b |
| TNF-α, pg/ml |
42.38±6.22 |
44.23±7.58 |
39.39±6.76 |
41.23±6.22 |
Expression of AT1aR, AT1bR and ATRAP
in WAT
The mRNA expression level of AT1aR and the protein
expression level of AT1R in adipose tissue were similar between SC
and SC-Los (P>0.05). The mRNA expression level of AT1aR and
protein expression level of AT1R were increased in HF compared with
SC (P<0.05), and were decreased in HF-Los compared with HF
(P<0.05) (Fig. 3A and B). There
was no difference in the mRNA expression of AT1b among the four
groups (P>0.05; Fig. 3A). No
difference was observed in the mRNA and protein expression levels
of ATRAP between SC and SC-Los. The mRNA and protein expression
levels of ATRAP were decreased in HF compared with SC (P<0.05),
and were similar between HF and HF-Los (P>0.05) (Fig. 3A and C). As a result, the protein
ratio of AT1R to ATRAP was increased in HF compared with SC (HF
3.58±1.23 vs. SC 1.24±0.56; P<0.05), and was decreased in HF-Los
compared with HF (HF-Los 2.16±0.62 vs. HF 3.58±1.23; P<0.05)
(Fig. 3D).
 | Figure 3.Effect of prehypertensive losartan
therapy on the expression of AT1aR, AT1bR and ATRAP in the adipose
tissue of high-fat-fed SHRs at 26 weeks of age. (A) The mRNA
expression levels of AT1aR, AT1bR and ATRAP, (B) the protein
expression level of AT1R, (C) the protein expression level of ATRAP
and (D) the protein ratio of AT1R to ATRAP were measured.
*P<0.05 vs. SC; #P<0.05 vs. HF. The data are presented as the
mean ± standard deviation. n=8. AT1aR, angiotensin II type 1
receptor subtype a; ATRAP, AT1R-associated protein; SHRs,
spontaneously hypertensive rats; SC, standard chow-fed SHRs; HF,
high-fat-fed SHRs; SC-Los, losartan-treated SHRs on standard chow;
HF-Los, losartan-treated SHRs on high-fat diet. |
DNA methylation in AT1aR, AT1bR and
ATRAP promoters
A total of seven CpG sites (+70, +77, +84, +93, +99,
+108 and +113 bp) were examined in the AT1aR promoter (Fig. 4A). The methylation levels of the
+77, +84, +99, +108 and +113 bp sites were decreased in HF compared
with SC (P<0.05), and were increased in HF-Los compared with HF
(P<0.05; Fig. 4B). A total of
three CpG sites (−77, −72 and −42 bp) were examined in the AT1bR
promoter (Fig. 4C). There was no
difference in the methylation levels of these sites among the four
groups (P>0.05) (Fig. 4D). A
total of nine CpG sites (−120, −117, −103, −91, −85, −83, −81, −68
and −65 bp) were examined in the ATRAP promoter (Fig. 4E). The methylation levels at the
−120, −117, −85 and −65 bp sites were higher in HF compared with SC
(P<0.05), and were similar between HF and HF-Los (P>0.05;
Fig. 4F).
 | Figure 4.Effect of prehypertensive losartan
therapy on the methylation level of the AT1aR, AT1bR and ATRAP
promoters in the adipose tissue of high-fat-fed SHRs at 26 weeks of
age. (A) CpG sites of AT1aR gene promoter as the targets of
methylation status analysis, (B) methylation level of AT1aR gene
promoter, (C) CpG sites of AT1bR gene promoter as the targets of
methylation status analysis, (D) methylation level of AT1bR gene
promoter, (E) CpG sites of ATRAP gene promoter as the targets of
methylation status analysis. (F) Methylation level of ATRAP gene
promoter. *P<0.05 vs. SC; #P<0.05 vs. HF. The data are
represented as the mean ± standard deviation. n=8. AT1aR,
angiotensin II type 1 receptor subtype a; ATRAP, AT1R-associated
protein; SHRs, spontaneously hypertensive rats; SC, standard
chow-fed SHRs; HF, high-fat-fed SHRs; SC-Los, losartan-treated SHRs
on standard chow; HF-Los, losartan-treated SHRs on high-fat
diet. |
Discussion
In the present study, it was demonstrated that
prehypertensive treatment with losartan was able to attenuate
metabolic disorders in high-fat-fed SHRs, persisting up to 26 weeks
of age. It was additionally observed that the long-term effect may
be associated with differential epigenetic regulation of AT1aR and
ATRAP expression in adipose tissue.
It is well known that hypercaloric diets,
particularly a high-fat diet, are potential contributors to
metabolic disorders in human (23). Knight et al (24) and Cao et al (25) demonstrated that when fed with
high-fat-diet, SHRs experienced certain symptoms, including
obesity, excessive adipose deposition, dyslipidemia, which were
similar to metabolic disorders in obese patients with hypertension.
The present study successfully duplicated this previous animal
model and a number of alterations were further revealed in adipose
tissue. Adipocytes became larger, the expression of PPARγ, aP2,
CEBP/α and CEBP/β was decreased, the production of IL-6, MCP-1 and
leptin was increased, and the production of adiponectin was
decreased. PPARγ is an important transcription factor that mediates
adipocyte differentiation, and it is considered to be a marker of
adipocyte differentiation in addition to aP2, CEBP/α and CEBP/β
(26). IL-6 and MCP-1 may be
produced by adipocytes and generally serve as proinflammatory
cytokines. Leptin and adiponectin are typical adipokines produced
by adipose tissue. The action of leptin is primarily to inhibit
food intake and decrease body weight. However, an increase in
leptin production generally indicates obesity due to of leptin
resistance. Adiponectin possesses antiatherogenic, antiflammatory
and antioxidant properties (3).
Due to the roles of these molecules, it was inferred that abnormal
adipocyte differentiation and adipose tissue dysfunction were
elicited in high-fat-fed SHRs in the present study. In addition,
the protein ratio of AT1R to ATRAP was increased, which was
consistent with alterations observed in other models of metabolic
disorders (13). AT1R has been
identified to be the primary mediator of the pathophysiology of
angiotensin II, an important effector of RAS (27). In rodents, AT1R is divided into two
subtypes: AT1aR and AT1bR (27).
ATRAP is an AT1R-binding protein, and it may selectively
downregulate AT1R-mediated signaling by promoting AT1R
internalization (28). An
imbalance of AT1R and ATRAP in the cardiovascular system was
associated with the development of hypertension and cardiac
remodeling (29). Therefore, it is
reasonable to hypothesize that the increase in the protein ratio of
AT1R to ATRAP in adipose tissue was involved in abnormal adipocyte
differentiation and adipose tissue dysfunction in high-fat-fed
SHRs. Additionally, hypomethylation of AT1aR and hypermethylation
of ATRAP were observed to be associated with the increase in AT1R
mRNA expression and the decrease in ATRAP mRNA expression,
suggesting that the expression of these two genes may be regulated
by DNA methylation. To the best of our knowledge, this is the first
report on the DNA methylation of RAS genes in adipose tissue.
A previous study suggested that early life is a
critical period for adipose tissue development (30). The results of the present study
demonstrated that treatment with losartan during the
prehypertensive period attenuated metabolic disorders, abnormal
adipocyte differentiation and adipose tissue dysfunction in
high-fat-fed SHRs. Notably, the observed benefit lasted for at
least 16 weeks following treatment withdrawal. The early treatment
with losartan was revealed to be able to reverse the increased
expression and promoter hypomethylation of AT1aR in adipose tissue,
suggesting that epigenetic regulation of AT1aR expression through
DNA methylation may serve a role in the long-term effect elicited
by the early treatment. However, it was demonstrated in the present
study that the treatment with losartan failed to mitigate the
decreased expression and hypermethylation of ATRAP in the adipose
tissue of high-fat-fed SHRs. By contrast, a previous study reported
that promoter hypermethylation of ATRAP in the myocardium of SHRs
may be reversed by early treatment with losartan (22). Therefore, the present and previous
results suggested that the effect of the early treatment on DNA
methylation is gene- and tissue- specific. Li et al
(31) additionally reported that
the alteration in DNA methylation was gender-specific. Further
studies are required to examine the mechanism underlying the
specificity of DNA methylation.
Based on the role of epigenetics in the development
of chronic disease, it is presumed that epigenetic intervention may
be an attractive strategy for the treatment of these diseases.
Typical epigenetic drugs, including histone deacetylase inhibitors
and DNA methyltransferase inhibitors, have previously been
investigated in animal models of cardiovascular diseases (32,33).
However, these typical epigenetic drugs have been demonstrated to
confer a beneficial effect in certain tissues and to cause a
deleterious effect in other tissues (33,34).
A possible interpretation is that these drugs alter epigenetic
modification without tissue specificity. By contrast, the present
and previous data suggested that early treatment with losartan may
inhibit the increase in blood pressure, and protect against cardiac
and renal damage, and metabolic disorders. In addition, the effect
of losartan on epigenetic modification is gene- and tissue-
specific, and this specificity may be due to the intrinsic
properties of losartan, serving as a potential inducer of
epigenetic modification, and not as a direct inhibitor or activator
of epigenetic enzymes. Pentaerythritol tetranitrate has been
reported to exhibit similar characteristic to losartan (35). Losartan and pentaerythritol
tetranitrate may be regarded as atypical epigenetic drugs, and
atypical epigenetic drugs may be potential alternatives to typical
epigenetic drugs in the treatment of chronic disease.
The results of the present study demonstrated that
prehypertensive treatment with losartan was able to relieve
metabolic disorders in the later life of high-fat-fed SHRs. The
long-term effects may be associated with the differential
epigenetic regulation of RAS gene expression in adipose tissue via
DNA methylation. The present study provided evidence for the
additional benefits of early treatment with losartan, beyond the
prolongation of a decrease in blood pressure.
Acknowledgements
The present study was supported by grants from the
National Natural Science Foundation of China (grant no. 81570446),
Natural Science Foundation of Fujian province (grant no.
2017J01193) and Middle and Young Aged Backbone of Fujian health
department (grant no. 2017-ZQN-44).
Glossary
Abbreviations
Abbreviations:
|
SHRs
|
spontaneously hypertensive rats
|
|
AT1R
|
angiotensin II type 1 receptor
|
|
ATRAP
|
AT1 receptor-associated protein
|
|
AT1aR
|
AT1R subtype a
|
|
RAS
|
renin-angiotensin system
|
|
WAT
|
white adipose tissue
|
|
BW
|
body weight
|
|
SBP
|
systolic blood pressure
|
|
TC
|
total cholesterol
|
|
TG
|
triglycerides
|
|
HDL-C
|
high-density lipoprotein
cholesterol
|
|
LDL-C
|
low-density lipoprotein
cholesterol
|
|
IL-6
|
interleukin-6
|
|
MCP-1
|
monocyte chemoattractant protein-1
|
|
TNF-α
|
tumor necrosis factor-α
|
|
PPAR-γ
|
peroxisome proliferator-activated
receptor-γ
|
|
aP2
|
transcription factor adaptin 2
|
|
CEBP
|
CCAAT/enhancer binding protein
|
References
|
1
|
Galassi A, Reynolds K and He J: Metabolic
syndrome and risk of cardiovascular disease: A meta-analysis. Am J
Med. 119:812–819. 2006. View Article : Google Scholar
|
|
2
|
Peng F, Lin J, Lin L and Tang H: Transient
prehypertensive treatment in spontaneously hypertensive rats: A
comparison of losartan and amlodipine regarding long-term blood
pressure, cardiac and renal protection. Int J Mol Med.
30:1376–1386. 2012. View Article : Google Scholar
|
|
3
|
Maury E and Brichard SM: Adipokine
dysregulation, adipose tissue inflammation and metabolic syndrome.
Mol Cell Endocrinol. 314:1–16. 2010. View Article : Google Scholar
|
|
4
|
Jing F, Mogi M and Horiuchi M: Role of
renin-angiotensin-aldosterone system in adipose tissue dysfunction.
Mol Cell Endocrinol. 378:23–28. 2013. View Article : Google Scholar
|
|
5
|
Lastra G and Sowers JR: Obesity and
cardiovascular disease: Role of adipose tissue, inflammation, and
the renin-angiotensin-aldosterone system. Horm Mol Biol Clin
Investig. 15:49–57. 2013.
|
|
6
|
Bogdarina I, Welham S, King PJ, Burns SP
and Clark AJ: Epigenetic modification of the renin-angiotensin
system in the fetal programming of hypertension. Circ Res.
100:520–526. 2007. View Article : Google Scholar :
|
|
7
|
Xiao D, Dasgupta C, Li Y, Huang X and
Zhang L: Perinatal nicotine exposure increases angiotensin II
receptor-mediated vascular contractility in adult offspring. PLoS
One. 9:e1081612014. View Article : Google Scholar :
|
|
8
|
Mao C, Liu R, Bo L, Chen N, Li S, Xia S,
Chen J, Li D, Zhang L and Xu Z: High-salt diets during pregnancy
affected fetal and offspring renal renin-angiotensin system. J
Endocrinol. 218:61–73. 2013. View Article : Google Scholar :
|
|
9
|
Schübeler D: Function and information
content of DNA methylation. Nature. 517:321–326. 2015. View Article : Google Scholar
|
|
10
|
Jones PA: Functions of DNA methylation:
Islands, start sites, gene bodies and beyond. Nat Rev Genet.
13:484–492. 2012. View
Article : Google Scholar
|
|
11
|
Deaton AM and Bird A: CpG islands and the
regulation of transcription. Genes Dev. 25:1010–1022. 2011.
View Article : Google Scholar :
|
|
12
|
Effects of ramipril on cardiovascular and
microvascular outcomes in people with diabetes mellitus: Results of
the HOPE study and MICRO-HOPE substudy. Heart Outcomes Prevention
Evaluation Study Investigators. Lancet. 355:253–259. 2000.
View Article : Google Scholar
|
|
13
|
Maeda A, Tamura K, Wakui H, Ohsawa M,
Azushima K, Uneda K, Kobayashi R, Tsurumi-Ikeya Y, Kanaoka T,
Dejima T, et al: Effects of Ang II receptor blocker irbesartan on
adipose tissue function in mice with metabolic disorders. Int J Med
Sci. 11:646–651. 2014. View Article : Google Scholar :
|
|
14
|
Fernandez-Twinn DS and Ozanne SE: Early
life nutrition and metabolic programming. Ann N Y Acad Sci.
1212:78–96. 2010. View Article : Google Scholar
|
|
15
|
Lindl T, Gross U, Ruhdel I, von Aulock S
and Völkel M: Guidance on determining indispensability and
balancing potential benefits of animal experiments with costs to
the animals with specific consideration of EU directive 2010/63/EU.
Altex. 29:219–228. 2012. View Article : Google Scholar
|
|
16
|
Ray MA, Johnston NA, Verhulst S, Trammell
RA and Toth LA: Identification of markers for imminent death in
mice used in longevity and aging research. J Am Assoc Lab Anim Sci.
49:282–288. 2010.
|
|
17
|
Widdop RE and Li XC: A simple versatile
method for measuring tail cuff systolic blood pressure in conscious
rats. Clin Sci (Lond). 93:191–194. 1997. View Article : Google Scholar
|
|
18
|
Xie LD, Chen DG, Zhang S, Wang HJ and Chen
HJ: Sympatholytic effect of captopril in regression of
cardiovascular remodeling in spontaneously hypertensive rats.
Zhongguo Yao Li Xue Bao. 15:123–128. 1994.
|
|
19
|
Livak KJ and Schmittgen TD: Analysis of
relative gene expression data using real-time quantitative PCR and
the 2(-Delta Delta C(T)) method. Method. 25:402–408. 2001.
View Article : Google Scholar
|
|
20
|
Xie LD, Lin PS, Xie H and Xu CS: Effects
of atorvastatin and losartan on monocrotaline-induced pulmonary
artery remodeling in rats. Clin Exp Hypertens. 32:547–554. 2011.
View Article : Google Scholar
|
|
21
|
Chen HF, Xie LD and Xu CS: The signal
transduction pathways of heat shock protein 27 phosphorylation in
vascular smooth muscle cells. Mol Cell Biochem. 333:49–56. 2010.
View Article : Google Scholar
|
|
22
|
Wang TJ, Lin X, Lian GL, Zhong HB and Xie
LD: The effect of early losartan treatment on methylation of
angiotensin II type 1 receptor subtype b and angiotensin II type 1
receptor associated protein genes in the myocardium of
spontaneously hypertensive rats. Chin J Hypertens. 24:141–146.
2016. View Article : Google Scholar
|
|
23
|
Lee AM, Gurka MJ and DeBoer MD: Trends in
metabolic syndrome severity and lifestyle factors among
adolescents. Pediatrics. 137:e201531772016. View Article : Google Scholar :
|
|
24
|
Knight SF, Quigley JE, Yuan J, Roy SS,
Elmarakby A and Imig JD: Endothelial dysfunction and the
development of renal injury in spontaneously hypertensive rats fed
a high-fat diet. Hypertension. 51:352–359. 2008. View Article : Google Scholar
|
|
25
|
Cao J, Inoue K, Sodhi K, Puri N, Peterson
SJ, Rezzani R and Abraham NG: High-fat diet exacerbates renal
dysfunction in SHR: Reversal by induction of HO-1-adiponectin axis.
Obesity (Silver Spring). 20:945–953. 2012. View Article : Google Scholar
|
|
26
|
Tontonoz P and Spiegelman BM: Fat and
beyond: The diverse biology of PPARgamma. Annu Rev Biochem.
77:289–312. 2008. View Article : Google Scholar
|
|
27
|
Singh KD and Karnik SS: Angiotensin
receptors: Structure, function, signaling and clinical
applications. J Cell Signal. 1:pii: 111. 2016.
|
|
28
|
Tamura K, Wakui H, Maeda A, Dejima T,
Ohsawa M, Azushima K, Kanaoka T, Haku S, Uneda K, Masuda S, et al:
The physiology and pathophysiology of a novel angiotensin
receptor-binding protein ATRAP/Agtrap. Curr Pharm Des.
19:3043–3048. 2013. View Article : Google Scholar
|
|
29
|
Shigenaga A, Tamura K, Wakui H, Masuda S,
Azuma K, Tsurumi-Ikeya Y, Ozawa M, Mogi M, Matsuda M, Uchino K, et
al: Effect of olmesartan on tissue expression balance between
angiotensin II receptor and its inhibitory binding molecule.
Hypertension. 52:672–678. 2008. View Article : Google Scholar
|
|
30
|
Spalding KL, Arner E, Westermark PO,
Bernard S, Buchholz BA, Bergmann O, Blomqvist L, Hoffstedt J,
Naslund E, Britton T, et al: Dynamics of fat cell turnover in
humans. Nature. 453:783–787. 2008. View Article : Google Scholar
|
|
31
|
Li Y, Xiao D, Yang S and Zhang L: Promoter
methylation represses AT2R gene and increases brain
hypoxic-ischemic injury in neonatal rats. Neurobiol Dis. 60:32–38.
2013. View Article : Google Scholar
|
|
32
|
McKinsey TA: Therapeutic potential for
HDAC inhibitors in the heart. Annu Rev Pharmacol Toxicol.
52:303–319. 2012. View Article : Google Scholar
|
|
33
|
Xiao D, Dasgupta C, Chen M, Zhang K,
Buchholz J, Xu Z and Zhang L: Inhibition of DNA methylation
reverses norepinephrine-induced cardiac hypertrophy in rats.
Cardiovasc Res. 101:373–382. 2014. View Article : Google Scholar
|
|
34
|
Cho HM, Lee HA, Kim HY, Han HS and Kim IK:
Expression of Na+−K+ −2Cl−
cotransporter 1 is epigenetically regulated during postnatal
development of hypertension. Am J Hypertens. 24:1286–1293. 2011.
View Article : Google Scholar
|
|
35
|
Wu Z, Siuda D, Xia N, Reifenberg G, Daiber
A, Münzel T, Förstermann U and Li H: Maternal treatment of
spontaneously hypertensive rats with pentaerythritol tetranitrate
reduces blood pressure in female offspring. Hypertension.
65:232–237. 2015. View Article : Google Scholar
|


