Introduction
Diabetic retinopathy (DR) is a major blinding eye
disease and often causes vision loss or even blindness due to
macular oedema, retinal detachment and vitreous haemorrhage. It has
been predicted that the number of patients with diabetes would
increase to 642 million in 2040 (1). Studies showed that under a high
glucose environment, excessive oxidative stress products in the
retina (2), activation of the
renin-angiotensin system (3), and
an increase in advanced glycation end products (4) initiated damage in retinal tissue
cells, thus causing a series of subsequent pathological
changes.
Inflammation is an important process in the
microangiopathy of DR and many inflammatory mediators are activated
in the pathogenesis (5). Previous
studies have reported that inflammation could induce retinal
biochemical and molecular changes, leading to vision-threaten
complications such as diabetic macular edema (DME) (6). Corticosteroids was effective in the
treatment of DME proved that inflammation response plays a vital
role in DR (7). However the
present study merely focused on the upstream of inflammation in DR,
hyperglycemia.
Glucose in the retina is transported from blood
circulation. Glucose uptake by retinal tissue cells depends on one
type of glucose-transporting carrier protein family, glucose
transporters (GLUTs). GLUT1 is an important member of the GLUT
family and is the only transporter that allows glucose to pass
through the blood-retinal barrier (8). Forskolin is a type of diterpenoid
derivative extracted from Coleus forskohlii. Forskolin can
inhibit the glucose transport by GLUT1 (9). Our group aimed to use forskolin to
inhibit the GLUT1 transport of glucose into the retina and thus
reduce the glucose level in retinal tissues; consequently, we could
determine whether inhibition of GLUT1 could control the glucose
level in retinal tissues and alleviate inflammation response of
DR.
Materials and methods
Reagents and instruments
Streptozotocin (STZ), forskolin, and the glucose
content detection reagent kit were all from Sigma-Aldrich (Merck
KGaA, St. Louis, MO, USA). The protein quantitation reagent kit was
from Bio-Rad Laboratories, Inc. (Hercules, CA, USA). Fluorescein
isothiocyanate conjugated concanavalin A (FITC-ConA) was from
Vector Laboratories (Burlingame, CA, USA). Rabbit anti-mouse
GLUT-1, intracellular cell adhesion molecule-1 (ICAM-1) and tumour
necrosis factor-α (TNF-α) primary antibodies and goat anti-rabbit
secondary antibody were all from Millipore Corporation (St.
Charles, MO, USA). Citric acid buffer was from Tiangen Biotech
(Beijing, China). The electronic analytic balance was from Jingke
Balance Factory (Shanghai, China). The spectrophotometer was from
Spectro (Kleve, Germany). The inverted fluorescence microscope was
from Olympus Corporation (Tokyo, Japan).
Experimental animals and grouping
This study was complied with the Animal Research:
Reporting of In Vivo Experiments (ARRIVE) guidelines and
carried out in strict accordance with the recommendations in the
Guide for the Care and Use of Laboratory Animals of the National
Institutes of Health (NIH Publications no. 8023, revised 1978). The
protocol was approved by the Committee on the Ethics of Animal
Experiments of Nanchang University. A total of 27 healthy, inbred,
8-week-old, male, and clean-grade C57BL/6 mice without eye diseases
and with a body weight of 20–30 g were purchased from the
Department of Animal Sciences of Nanchang University. The mice were
numbered using ear tags and randomly divided into a normal control
group, diabetic control group, and forskolin treatment group. Each
group had 9 animals. For establishment of the DM model, mice were
fasted for 8 h and then received an intraperitoneal injection of
STZ for 5 consecutive days. Before injection, STZ was dissolved in
pH 4.5, 0.01 M citric acid buffer. The diabetic control group and
the forskolin treatment group received STZ at a dose of 55
mg•kg−1 (10), and the
normal control group received an intraperitoneal injection of an
equal amount of citric acid buffer. Tail vein blood samples were
collected on day 7 to measure blood glucose. The model was
successfully established when the blood glucose level was greater
than 300 mg•dl−1. After model establishment, the
forskolin treatment group received intragastric administration of
forskolin at 50 mg•kg−1 week−1 for 12
consecutive weeks, and the normal control group and the diabetic
control group received an equal amount of PBS.
Detection of glucose levels in retinal
tissues
Six mice from each of the 3 groups were sacrificed
by spinal dislocation, and 6 left eyeballs were removed to measure
the glucose levels in the retina. The right eyeballs were used for
subsequent western blot analysis. Retinal tissues were collected,
added to 50 µl deionized water, and heated to 70–75°C for 15 min.
The samples were then sonicated for 30 sec and centrifuged for 20
min. A total of 35 µl supernatant was added to 165 µl glucose
concentration assay reagent, and the standard curve and the blank
control were set up. The absorbance of the samples was measured
using a spectrophotometer, and the glucose concentration was
calculated using SPECTROstar Nano MARS software. Next, 10 µl
supernatant was added to 190 µl protein concentration determination
reagent, and the standard curve and a blank control were set up.
The absorbance of the samples was measured using a
spectrophotometer, and the protein concentration was calculated
using SPECTROstar Nano MARS software. The retinal glucose level was
expressed as nmol glucose•mg protein−1, and the
calculation formula was GxGV•GMW−1•(PxPV)−1,
with the following parameters: G, glucose concentration
(ng•ml−1); GV, volume of glucose content determination
reaction solution (ml); P, protein concentration
(mg•ml−1); PV, volume of protein concentration
determination reaction solution (ml); and GMW, molecular weight of
glucose (180.2).
Western blot analysis
The retinal tissues of the above 6 removed right
eyeballs of the mice in the 3 groups were collected and placed in
Eppendorf tubes with 200 µl lysis buffer. Samples were sonicated
for 30 sec and centrifuged for 20 min. The supernatant was
collected, and the protein concentrations of the samples were
determined. Equal amounts of protein samples were collected and
subjected to SDS-PAGE electrophoresis. Proteins were transferred
onto a membrane for 90–120 min. The membrane was incubated with the
GLUT-1, ICAM-1 and TNF-α primary antibodies at 75°C overnight. The
next day, the membrane was washed 3 times and incubated with the
secondary antibody at room temperature for 1 h. The developing
solution was then added in a dark room for gel image analysis; in
addition, the grey scale values of the protein bands were
measured.
Leukostasis assay in retinal blood
vessels
Three mice from each of the 3 groups were
anaesthetized using a mixed solution of ketamine (10
mg•kg−1) and xylazine (60 mg•kg−1). The
thoracic skin and ribs of the mice were cut to expose the thoracic
cavity. The descending aorta was closed by clamping, the right
atrial appendage was cut, and a 27 G needle was inserted into the
left ventricle. A mixture of 10 ml PBS and heparin (0.1
mg•ml−1) was first perfused to wash out non-adherent
leukocytes. Next, adherent leukocytes were labelled with a mixed
solution containing 20 µg•ml−1 PBS and FITC-ConA (5
mg•kg−1). FITC-ConA that did not bind to leukocytes was
washed out using 10 ml PBS. After the mice were sacrificed, 6
eyeballs were removed from each group and directly placed in 4%
paraformaldehyde for 1 h. Next, the retinal tissues were flat
mounted and counted under a fluorescence microscope.
Statistical analysis
Statistical analyses were performed using SPSS 17.0
(SPSS, Inc., Chicago, IL, USA) statistical software. The body
weight, glucose levels, retinal glucose levels, and grey scale
density results of western blot were expressed as mean ± SD. A
comparison between groups was performed using one-way analysis of
variance (ANOVA) test with post hoc contrasts by
Student-Newman-Keuls test. P<0.05 was considered to indicate a
statistically significant difference.
Results
Establishment of the diabetic model
and measurement of body weight and blood glucose levels in the
three groups
All blood glucose levels of the 27 males C57BL/6
mice (diabetic control and forskolin treatment groups) used for
diabetes induction were higher than 300 mg/dl at 7 day after
streptozotocin intraperitoneal injection. We measured the body
weight and blood glucose levels of the mice at 21 weeks after
diabetes induction. The results showed that there were no
significant differences in the body weight of the mice among the
three groups when the diabetes was successfully induced. At 21
weeks after diabetes induction, the body weight of the normal
control group was significantly higher than that of the diabetic
control and forskolin treatment groups by 43.18 and 37.90%,
respectively.
We also measured the blood glucose levels at 1 day
and 21 weeks after the diabetes induction. The blood glucose levels
of the normal control group were lower than those of the diabetic
control group by 48.04 and 55.21%, respectively. The blood glucose
levels were significantly lower than those of the forskolin
treatment group by 48.75 and 46.64% (P<0.01). However, there was
no significant difference between the diabetic control and
forskolin treatment groups (Table
I).
 | Table I.Body weight and blood glucose levels
of the three groups. |
Table I.
Body weight and blood glucose levels
of the three groups.
|
| Body weight (g) | Blood glucose level
(mg/dl) |
|---|
|
|
|
|
|---|
| Group | At 1 day after the
diabetes induction | At 21 weeks after the
diabetes induction | At 1 day after the
diabetes induction | At 21 weeks after the
diabetes induction |
|---|
| Normal control |
26.32±2.25 |
36.31±2.98 |
178.41±19.58 |
169.53±26.25 |
| Diabetic control |
25.83±2.00 |
25.36±3.02a |
343.36±61.52 |
378.51±51.25a |
| Forskolin
treatment |
26.12±1.98 |
26.33±3.16a |
348.15±63.53 |
363.52±60.14a |
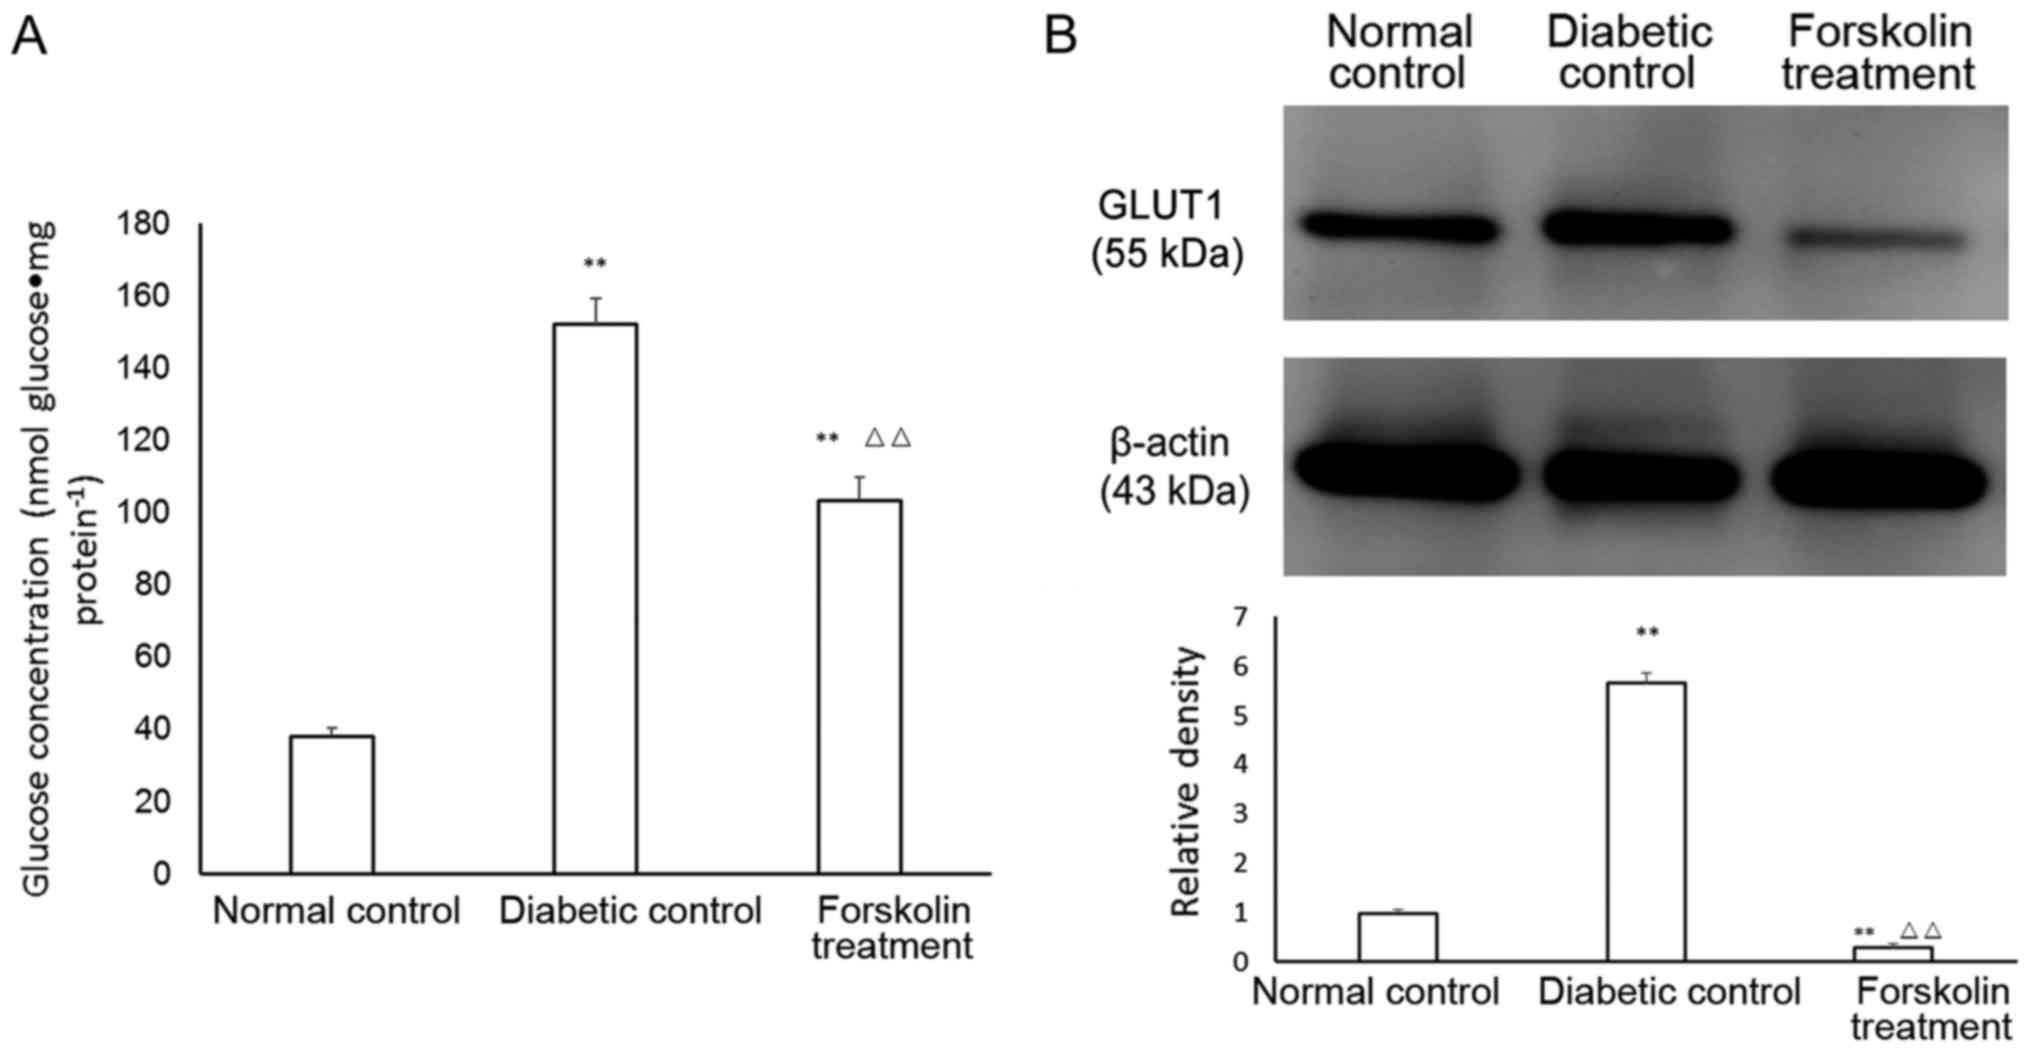
Determination of glucose levels in
retinal tissues
The retinal glucose levels in the 3 groups were
measured. The glucose level in the mouse retina in the normal
control group was (38.21±2.31 nmol) glucose•mg
protein−1. At week 21, the retinal glucose level of the
mice in the diabetic control group reached (152.13±7.31) nmol
glucose•mg protein−1, and the retinal glucose level of
the mice in the forskolin treatment group was (103.54±6.27) nmol
glucose•mg protein−1. The retinal glucose levels of the
mice in the two groups of diabetic models were both higher than
that in the normal control group, and the differences were
statistically significant (P<0.01). In addition, the retinal
glucose level of the mice in the forskolin treatment group was
significantly lower (P<0.01) than that in the diabetic control
group and was approximately 68.06% of that in the diabetic control
group (Fig. 1A).
Retinal GLUT1 expression in the three
groups
The expression of GLUT1 in the retina was
upregulated under diabetic conditions, but the expression of
retinal GLUT1 in the forskolin treatment group was lower than that
in the normal control group by 72.13%; however, GLUT1 expression in
the forskolin treatment group was lower than that in the diabetic
control group by 8.07%. Both of these differences were
statistically significant (P<0.01) (Fig. 1B).
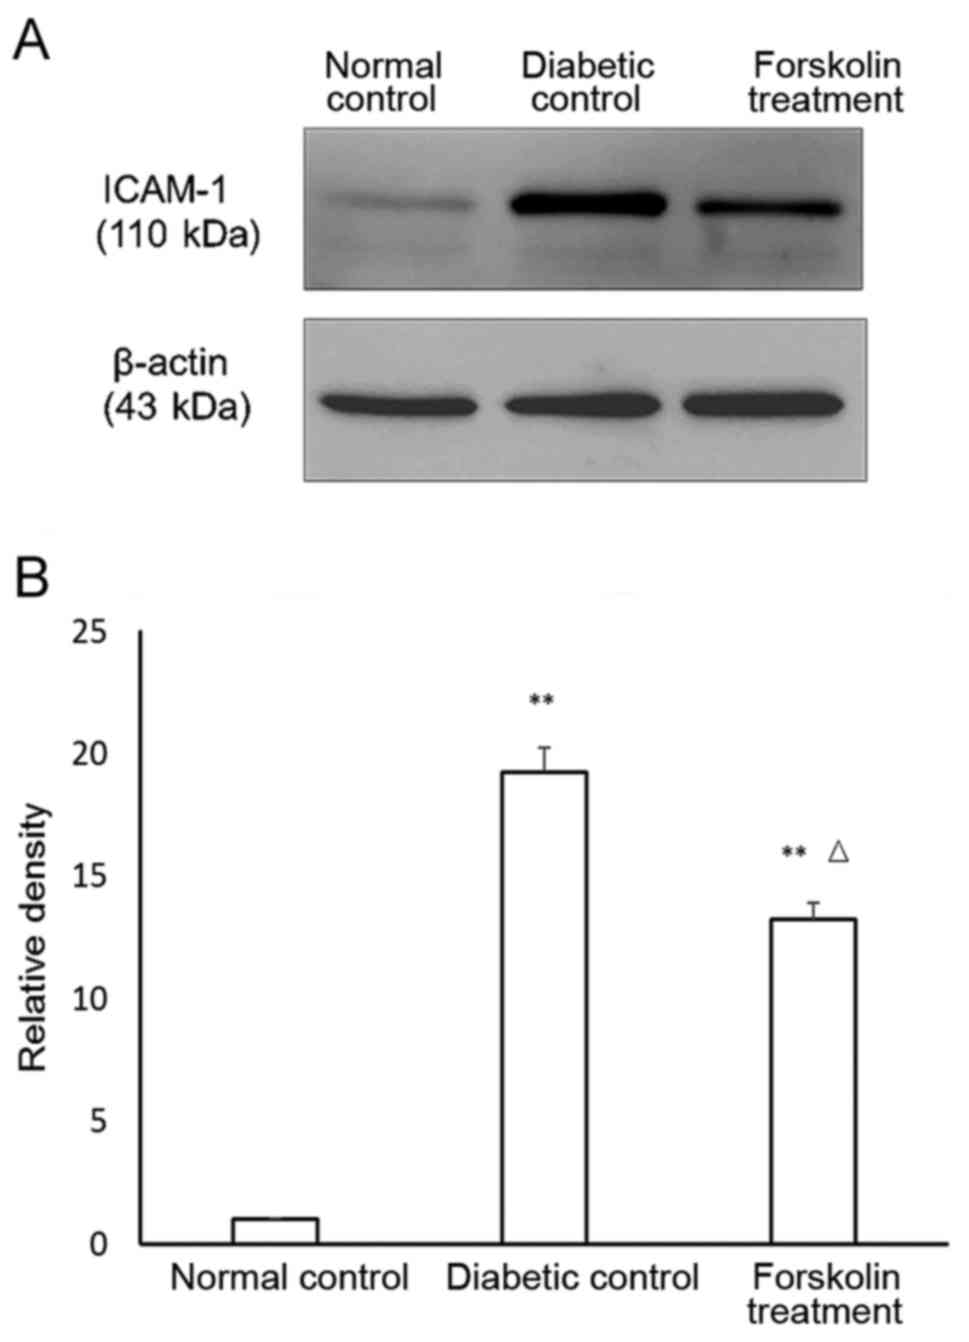
Expression of inflammatory factors in
the retina of the mice in the diabetic control group and the
forskolin control group
Previous studies confirmed that DR is a chronic
inflammatory disease (11). ICAM-1
and TNF-α are two important markers of inflammatory reactions. The
expression of ICAM-1 and TNF-α in the retina of the mice in the
three groups was determined using western blot, and the results
were statistically analysed. The results showed that the ICAM-1
expression was upregulated in both the diabetic control group and
the forskolin treatment group compared to that in the normal
control group, and the differences were statistically significant
(P<0.01). In addition, the ICAM-1 expression in the retina of
the mice in the forskolin treatment group was approximately 68.75%
of that in the diabetic control group, and the difference was
statistically significant (P<0.05) (Fig. 2).
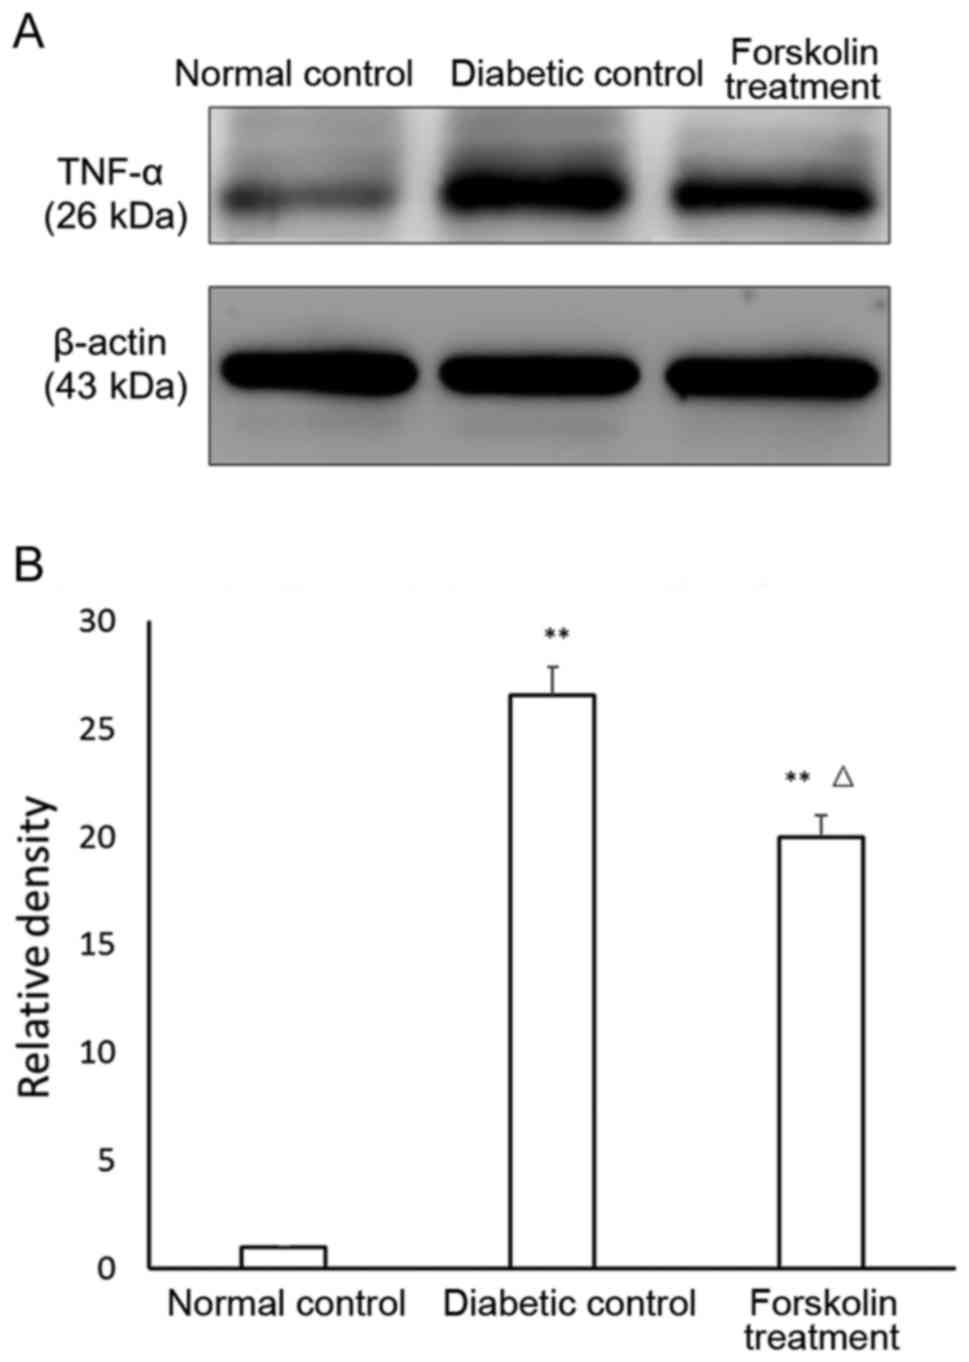
The TNF-α results were similar. The expression of
TNF-α in the diabetic control group and the forskolin treatment
group was also upregulated compared to that in the normal control
group, with statistically significant differences (P<0.01). In
addition, the TNF-α expression in the retina of the mice in the
forskolin treatment group was ~75.37% of that in the diabetic
control group, and the difference was statistically significant
(P<0.05) (Fig. 3).
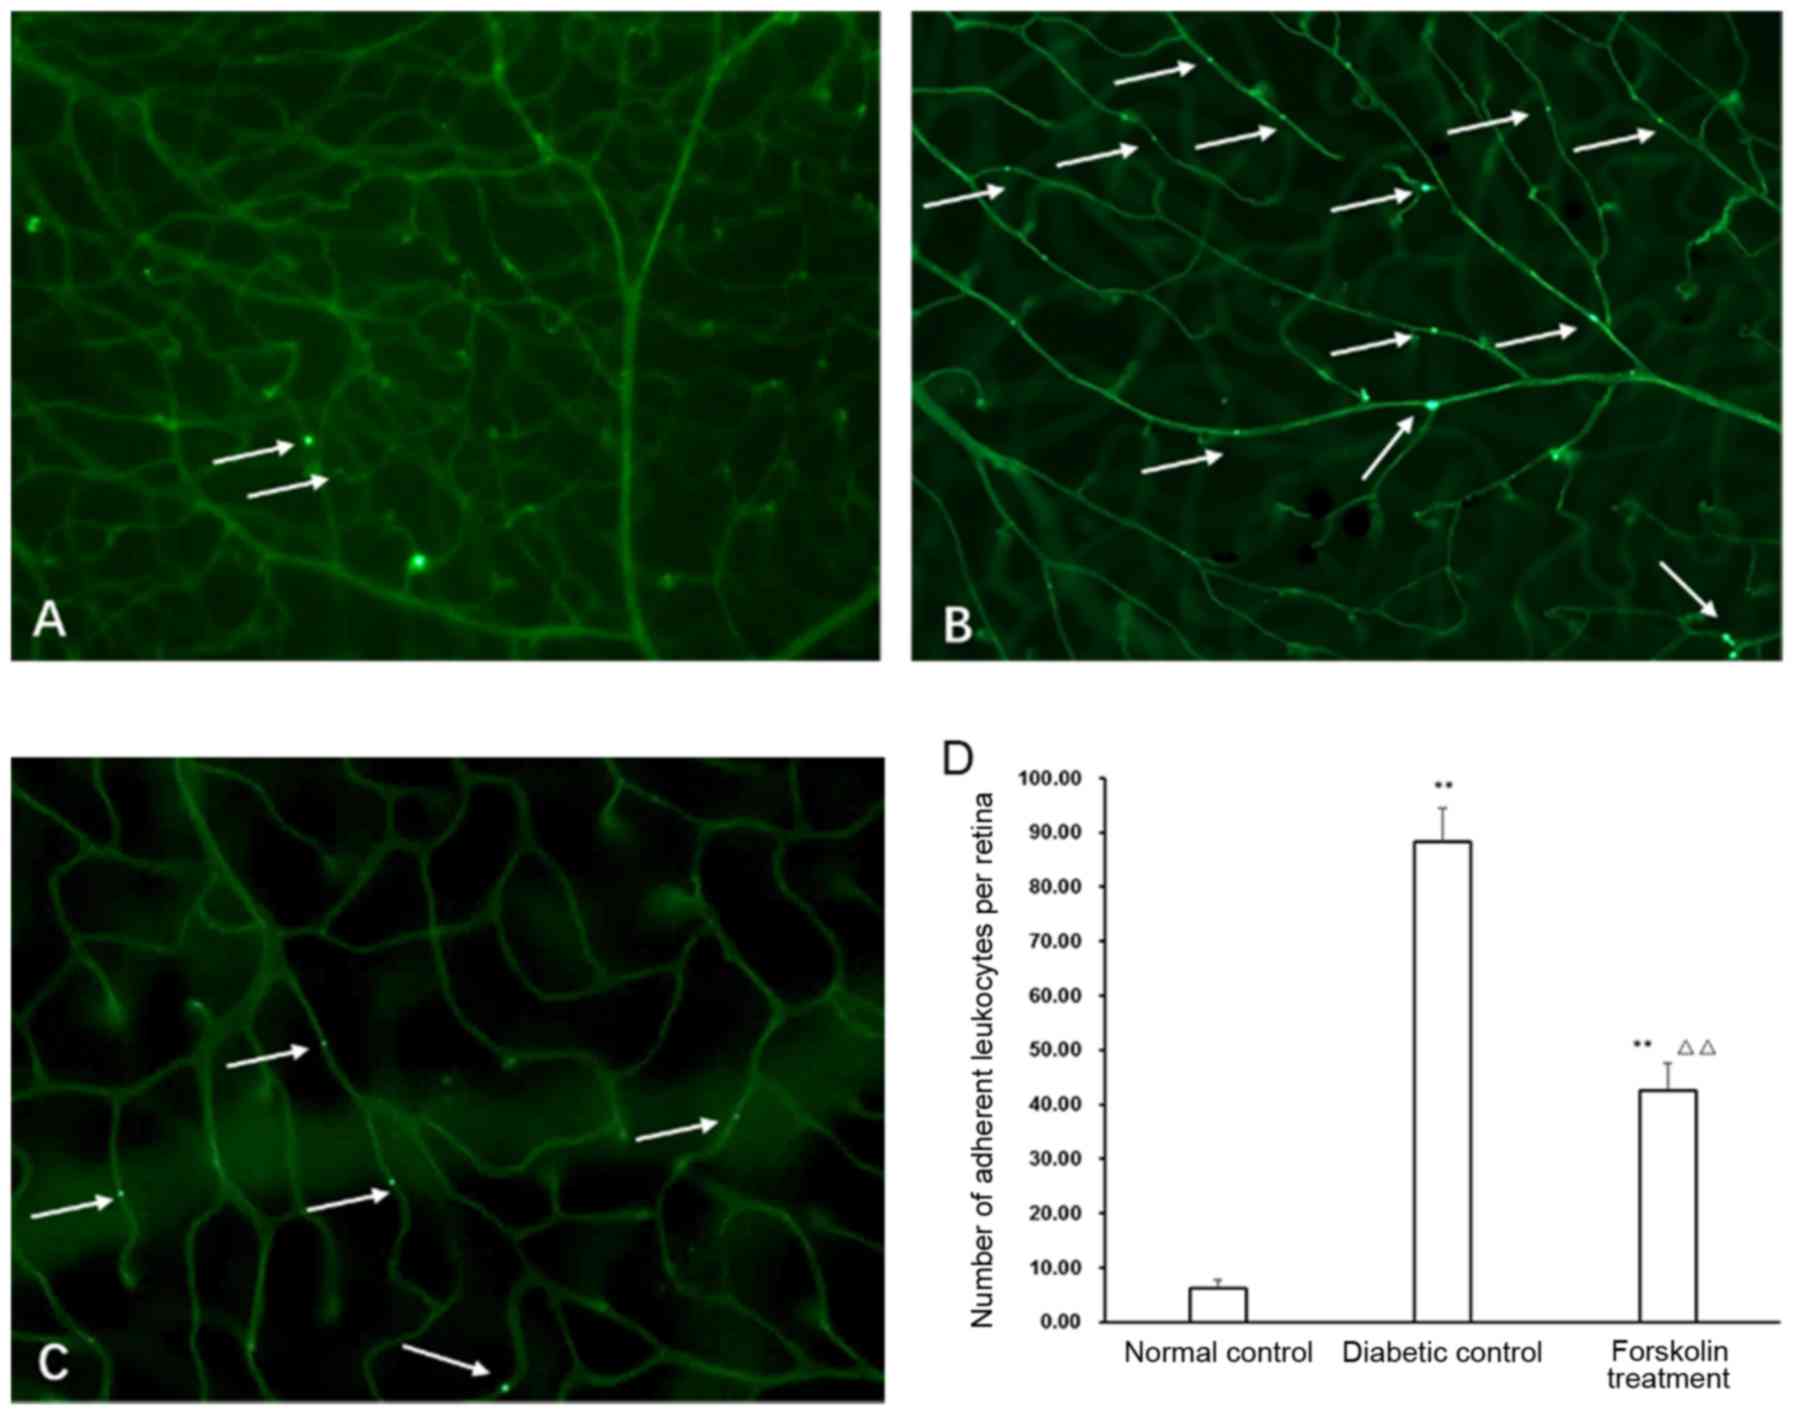
Leukostasis changes in retinal blood
vessels in the diabetic control group and the forskolin treatment
group
Leukostasis in retinal blood vessels is an important
indicator of retinal inflammation (12) and is also an early pathological
change in DR. Our results showed that there were only several
isolated adherent leukocytes in the retinal blood vessels in the
normal control group. The mice in the diabetic group and the
forskolin treatment groups both had more leukostasis; however, the
number of counted adherent leukocytes in the forskolin treatment
group was approximately 48.28% of that in the diabetic control
group, and the difference was statistically significant (P<0.01)
(Fig. 4).
Discussion
DR is one of the most common severe complications of
DM and will become an extensive public health issue in the future.
The specific pathogenic mechanism is still not clear. A
large-scale, randomized, clinical study, the UK Prospective
Diabetes Study (UKPDS) (13),
previously confirmed the important roles of high blood glucose in
DR and other diabetic complications. The mechanisms of high glucose
on retinal cells may include influences on the expression of
specific genes, an increase in advanced glycation end products, and
an increase in the oxidative stress reaction (14). We hypothesized that since the high
glucose microenvironment of retinal tissues in the diabetic
condition exerts damaging effects, controlling the local glucose
level in retinal tissues and reversing the high glucose environment
may alleviate inflammation response. Glucose in the retina is
transported from blood, however, water-soluble glucose cannot pass
through the phospholipid bilayer of the cell membrane and requires
a group of carrier proteins, GLUTs, for glucose transport. GLUT1 is
the only carrier that allows glucose to pass through the
blood-retinal barrier (8). Kumagai
et al used immunocytochemistry to quantitatively study GLUT1
expression in eyeballs (without or with only mild retinopathy) of
DM patients and showed that the GLUT1 activity in the retina of
more than half of the eyeballs was 18 times higher than that in the
normal control group, suggesting that GLUT1 upregulation mediated
cell injury through its transport of a large amount of glucose into
the retina (15). Forskolin could
competitively inhibit glucose transport by GLUT1, thus reducing
retinal glucose levels. As mentioned above, the expression of
retinal GLUT1 of the forskolin treatment was decreased by ~95.04%
compared with that in the diabetic control group and by ~72.13%
compared with that in the normal control group. At 21 weeks after
the establishment of the DM model, the retinal glucose level of the
mice in the forskolin treatment group was only 68.06% of that in
the diabetic control group, confirming that forskolin could
effectively limit glucose transport into the retina via GLUT1
inhibition.
Inflammation is an important step in the
pathological changes of DR. We measured two markers of the
inflammatory reaction, the level of the ICAM-1 chemokine and the
level of the TNF-α cytokine. ICAM-1 plays important roles in
mediating leukostasis (16).
Inhibition of ICAM-1 can significantly reduce leukostasis and
vascular permeability (17). TNF-α
expression is also upregulated in the retina of DR patients
(18). We found that the
expression levels of ICAM-1 and TNF-α in the retina of the mice in
the forskolin treatment group were only 68.75 and 75.37%,
respectively, of those in the diabetic control group. These results
suggested that after glucose transport into the retina was
inhibited by forskolin, the inflammatory reaction in diabetic mice
was relatively mild.
Studies showed that the number of leukocytes in the
retina of diabetic animal models increased, the adhesion ability
increased, and the deformability decreased (19,20).
The passive deformability of leukocytes to pass through capillaries
that had smaller diameters in DR patients, thus causing an increase
in the leukocyte adhesion rate. In addition, with the progression
of the disease, the increase in the adhesion rate was more evident
(14). A leukostasis assay in
retinal blood vessels could be used to analyse and compare the
extent of inflammatory reactions in DR. This study showed that
although the forskolin treatment had a higher number of adherent
leukocytes in retinal blood vessels than the normal control group,
the number was only 48.28% of that in the diabetic control
group.
In conclusion, inhibition of GLUT1 by forskolin
could decrease the retinal glucose level in diabetic mice to form a
relatively low glucose environment in the retina. Under this
environment, retinal inflammation response was relieved compared to
that in general diabetic mice. These results suggested that
inhibition of GLUT1 to limit local retinal glucose levels may
become a new direction for future therapy of DR.
Acknowledgements
The present study was supported by the National
Natural Science Foundation of China (grant nos. 81460088 and
81760176), Jiangxi Provincial Training Program for Distinguished
Young Scholars (grant no. 20171BCB23092), Jiangxi Provincial Key
R&D Program (grant no. 20171BBG70099), Jiangxi Provincial
Natural Science Foundation for Youth Scientific Research (grant no.
20171BAB215032), Youth Scientific Research Foundation of the Second
Affiliated Hospital of Nanchang University (grant no.
2014YNQN12011) and Traditional Chinese Medicine Scientific Research
Program of Jiangxi Health and Family Planning Commission (grant no.
2013B016)
References
|
1
|
International Diabetes Federation (IDF), .
IDF Diabetes Atlas. 7th. IDF; Brussels: 2015
|
|
2
|
Wong TY, Simó R and Mitchell P:
Fenofibrate-a potential systemic treatment for diabetic
retinopathy. Am J Ophthalmol. 154:6–12. 2012. View Article : Google Scholar : PubMed/NCBI
|
|
3
|
Sjølie AK, Dodson P and Hobbs FR: Does
renin-angiotensin system blockade have a role in preventing
diabetic retinopathy? A clinical review. Int J Clin Pract.
65:148–153. 2011. View Article : Google Scholar : PubMed/NCBI
|
|
4
|
Chen M, Curtis TM and Stitt AW: Advanced
glycation end products and diabetic retinopathy. Curr Med Chem.
20:3234–3240. 2013. View Article : Google Scholar : PubMed/NCBI
|
|
5
|
Tang J and Kern TS: Inflammation in
diabetic retinopathy. Prog Retin Eye Res. 30:343–358. 2011.
View Article : Google Scholar : PubMed/NCBI
|
|
6
|
Roy S, Kern TS, Song B and Stuebe C:
Mechanistic insights into pathological changes in the diabetic
retina: Implications for targeting diabetic retinopathy. Am J
Pathol. 187:9–19. 2017. View Article : Google Scholar : PubMed/NCBI
|
|
7
|
Silva PS, Sun JK and Aiello LP: Role of
steroids in the management of diabetic macular edema and
proliferative diabetic retinopathy. Semin Ophthalmol. 24:93–99.
2009. View Article : Google Scholar : PubMed/NCBI
|
|
8
|
Thorens B and Mueckler M: Glucose
transporters in the 21st century. Am J Physiol Endocrinol Metab.
298:E141–E145. 2010. View Article : Google Scholar : PubMed/NCBI
|
|
9
|
Lu L, Seidel CP, Iwase T, Stevens RK, Gong
YY, Wang X, Hackett SF and Campochiaro PA: Suppression of GLUT1; a
new strategy to prevent diabetic complications. J Cell Physiol.
228:251–257. 2013. View Article : Google Scholar : PubMed/NCBI
|
|
10
|
Fu S, Dong S, Zhu M, Sherry DM, Wang C,
You Z, Haigh JJ and Le YZ: Müller glia are a major cellular source
of survival signals for retinal neurons in diabetes. Diabetes.
64:3554–3563. 2015. View Article : Google Scholar : PubMed/NCBI
|
|
11
|
Agrawal NK and Kant S: Targeting
inflammation in diabetes: Newer therapeutic options. World J
Diabetes. 5:697–710. 2014. View Article : Google Scholar : PubMed/NCBI
|
|
12
|
Wang J, Xu X, Elliott MH, Zhu M and Le YZ:
Müller cell-derived VEGF is essential for diabetes-induced retinal
inflammation and vascular leakage. Diabetes. 59:2297–2305. 2010.
View Article : Google Scholar : PubMed/NCBI
|
|
13
|
Intensive blood-glucose control with
sulphonylureas or insulin compared with conventional treatment and
risk of complications in patients with type 2 diabetes (UKPDS 33).
UK prospective diabetes study (UKPDS) group. Lancet. 352:837–853.
1998. View Article : Google Scholar : PubMed/NCBI
|
|
14
|
Stophen J and Ryan R: Retina. 4th.
Elsevier; Singapore: 2010
|
|
15
|
Kumagai AK, Vinores SA and Pardridge WM:
Pathological upregulation of inner blood-retinal barrier Glut1
glucose transporter expression in diabetes mellitus. Brain Res.
706:313–317. 1996. View Article : Google Scholar : PubMed/NCBI
|
|
16
|
Tian P, Ge H, Liu H, Kern TS, Du L, Guan
L, Su S and Liu P: Leukocytes from diabetic patients kill retinal
endothelial cells: Effects of berberine. Mol Vis. 19:2092–2105.
2013.PubMed/NCBI
|
|
17
|
Zhang HT, Shi K, Baskota A, Zhou FL, Chen
YX and Tian HM: Silybin reduces obliterated retinal capillaries in
experimental diabetic retinopathy in rats. Eur J Pharmacol.
740:233–239. 2014. View Article : Google Scholar : PubMed/NCBI
|
|
18
|
Zhang Q and Steinle JJ: IGFBP-3 inhibits
TNF-α production and TNFR-2 signaling to protect against retinal
endothelial cell apoptosis. Microvasc Res. 95:76–81. 2014.
View Article : Google Scholar : PubMed/NCBI
|
|
19
|
Lutty GA: Effects of diabetes on the eye.
Invest Ophthalmol Vis Sci. 54:ORSF81–ORSF87. 2013. View Article : Google Scholar : PubMed/NCBI
|
|
20
|
Noda K, Nakao S, Zandi S, Sun D, Hayes KC
and Hafezi-Moghadam A: Retinopathy in a novel model of metabolic
syndrome and type 2 diabetes: New insight on the inflammatory
paradigm. FASEB J. 28:2038–2046. 2014. View Article : Google Scholar : PubMed/NCBI
|