Introduction
Multidrug resistance protein 4 (MRP4) transports
nucleoside monophosphates (1), and
an increasing number of studies have indicated that MRP4 transports
an array of diverse substrates across membranes, including
endogenous substances [eicosanoids, prostaglandins, bile acids,
cyclic adenosine monophosphate, cyclic guanosine monophosphate,
dehydroepiandrosterone 3-sulfate (DHEAS), conjugated steroids and
folate] (2,3), anticancer agents (methotrexate and
etoposide), and antiviral drugs [nelfinavir, adefovir and tenofovir
(TFV)] (4,5).
Nucleos(t)ide analogues (NAs) are very effective
antiviral agents that function by inhibiting the replication of the
hepatitis B virus (HBV). Currently available NAs include the
nucleoside analogues lamivudine (LAM), telbivudine, and entecavir
(ETV) and the nucleotide analogues adefovir and TFV. LAM, ETV,
adefovir and TFV all inhibits HBV polymerases. The structure of TFV
is similar to adefovir, differing only by the addition of a methyl
group in the sugar-like aliphatic linker (4). Furthermore, adefovir and TFV are both
transported by MRP4 (3,6,7). To
the best of our knowledge, whether the transport of LAM and ETV
involves MRP4 has not been reported in the literature to date.
Thus, the present study aimed to evaluate the possibility that the
transport of LAM and ETV may involve MRP4 in vitro.
NAs are broadly used in antiviral and anti-tumor
therapy, and their intracellular concentrations affect the clinical
response. Based on knowledge of the intracellular concentrations of
NAs, the most simple and cost-effective technique for the
determination of NA content is high performance liquid
chromatography (HPLC), but in many cases this technique is not
sufficiently sensitive (8).
Compared with other routine techniques, the recent improvements in
column technology and mass spectrometers associated with liquid
chromatography-mass spectrometry (LCMS) methods have resulted in
more sensitive, specific and efficient results, making them
commonly used methods (9).
Furthermore, they reduce the relative sample preparation and
analysis time. Moreover, the intracellular concentrations of NAs
(like small molecule ETV) are extremely low at pg/ml levels; thus,
the LCMS method is needed for detection because the concentrations
of these molecules are below the detection limits and sensitivity
of typical reversed-phase HPLC methods (10). Therefore, LCMS technology is more
suitable for evaluating the pharmacokinetics of NAs in
vitro.
The aim of the present study was to evaluate whether
MRP4 is involved in the hepatocyte efflux of LAM and ETV by i)
detecting the expression of MRP4 in HepG2.4D14 cells containing
wild-type HBV and HepG2.A64 cells containing ETV-resistant HBV; ii)
evaluating the cytotoxic effects of LAM, ETV, TFV,
3-([(3-(2-[7-chloro-2-quinolinyl]ethyl)phenyl]-[(3-dimethylamino-3-oxoporphyl)-thio)-methyl]-thio)
propanoic acid (MK571) and the activities of these three NAs
against HBV in vitro; and iii) investigating the
intracellular concentrations of LAM, ETV and TFV (a positive
control) in the presence or absence of MK571 in the two cell
lines.
Materials and methods
Reagents
HPLC-grade LAM, ETV and MK571 were provided by
Sigma-Aldrich; Merck KGaA (Darmstadt, Germany) and TFV was
purchased from R&D Systems, Inc. (Minneapolis, MN, USA). The
water was purified by a Purelab Classic UF purification system.
Formic acid (LCMS grade) was obtained from Sigma-Aldrich; Merck
KGaA and HPLC-grade methanol, ammonium acetate were supplied by
Thermo Fisher Scientific, Inc. (Waltham, MA, USA).
Cell culture
The HepG2.4D14 (wild-type HBV) and HepG2.A64
(ETV-resistant HBV) cell lines were gifts from Dong-Ping Xu
(Beijing 302 Hospital, Beijing, China) (11,12).
They were grown in Dulbecco's modified Eagle's medium (DMEM; Gibco;
Thermo Fisher Scientific, Inc.) supplemented with 10% fetal bovine
serum (Gibco; Thermo Fisher Scientific, Inc.) and 100 U/ml
penicillin-streptomycin (Gibco; Thermo Fisher Scientific, Inc.).
Cells were cultured at 37°C in 5% CO2 and 300 µg/ml
geneticin was added to the medium (Sigma-Aldrich; Merck KGaA).
Cell proliferation assay
Cells were seeded at 3×10³ cells/well
into 96-well plates for five replicates in three independent
experiments. After incubation for 24 h at 37°C in 5%
CO2, dilution series of drugs in 100 µl conditioned
medium were added and changed every other day for 4 days. The
medium was removed and 10 µl Cell Counting kit-8 (CCK-8; Dojindo
Molecular Technologies, Inc., Shanghai, China) was added to each
well and agitated for 10 min. The cells were further incubated for
1~4 h, then the absorbance was detected by an EnSpire®
Multimode Plate Reader (PerkinElmer, Inc., Waltham, MA, USA) at 450
nm wavelength. The concentrations of 50% inhibition of growth
(IC50) were calculated individually by nonlinear
regression using GraphPad Prism 5.0 (GraphPad Software Inc., San
Diego, CA, USA).
Quantitative polymerase chain reaction
(qPCR) analysis
Total RNA was extracted using TRIzol (Invitrogen;
Thermo Fisher Scientific, Inc.) following the manufacturer's
protocol. The primer sequences were as follows: MRP4 sense,
5′-TGGTGCAGAAGGGGACTTAC-3′ and antisense,
5′-GCTCTCCAGAGCACCATCTT-3′; β-actin sense,
5′-GCCAACACAGTGCTGTCTGG-3′ and antisense,
5′-GCTCAGGAGGAGCAATGATCTTG-3′. qPCR was performed in a thermocycler
for 40 cycles according to the following procedure: 95°C for 30
sec, 95°C for 5 sec, 57°C for 30 sec, 65°C for 15 sec and then
stored at 4°C. It was carried out on an Applied Biosystems Prism
7900HT Sequence detection system (Applied Biosystems; Thermo Fisher
Scientific, Inc.) using a one-step SYBR®
PrimeScript™ Real-Time PCR kit (Takara, Dalian, China).
β-actin served as an endogenous control. The relative mRNA
expression levels were calculated using the 2−ΔΔCq
method (13).
Western blot analysis
The cells and tissues were lysed on ice using RIPA
buffer and PMSF protease inhibitors (Beyotime Institute of
Biotechnology, Shanghai, China) according to the manufacturer's
instructions. The lysate was centrifuged at 12,000 × g for 20 min
at 4°C, and the clear supernatant was mixed with 5X Loading sample
buffer. The protein concentrations were quantified using a
bicinchoninic acid kit (Beyotime Institute of Biotechnology). Total
protein (30 µg) was separated by 10% SDS-PAGE gel at room
temperature for 2 h and transferred onto polyvinylidene fluoride
membranes (EMD Millipore, Billerica, MA) for 2 h. The membranes
were incubated with anti-MRP4 (cat. no. ab180712; 1:20 dilution;
Abcam, Cambridge, MA, USA) and anti-β-actin (cat. no. 12620; 1:500
dilution; Cell Signaling Technology, Inc., Danvers, MA, USA)
primary monoclonal antibodies overnight at 4°C. Following this,
they were incubated with the horseradish peroxidase-conjugated goat
anti-rabbit IgG secondary antibody (cat. no. sc-2004; 1:4,000
dilution; Santa Cruz Biotechnology, Inc., Dallas, TX, USA) at room
temperature for 1 h. The protein bands were visualized by enhanced
chemiluminescence (Beyotime Institute of Biotechnology) and
analyzed using Image Pro Plus version 6.0 (Media Cybernetics, Inc.,
Rockville, MD, USA).
DNA extraction and HBV DNA qPCR
HBV DNA was extracted using a Tissue DNA kit (Omega
Bio-Tek, Inc., Norcross, GA, USA) according to the manufacturer's
instructions. Quantitative analysis was performed by qPCR using the
One Step Hepatitis B viral DNA quantitative fluorescence diagnostic
kit (Hunan Sansure Biotech, Hunan, China). Briefly, after addition
of 5 µl nucleic acid lysis buffer, HBV DNA was subsequently
released from the 5-µl samples. After 10 min, the above PCR
reaction mixtures were added to each well. The qPCR was performed
according to the manufacturer's instructions using the absolute
quantitative PCR fluorescence probing method and quantified using
the 2−ΔΔCq method (13,14).
Forward and reverse primer sequences for HBV were,
5′-GTGTCTGCGGCGTTTTATCAT-3′ and 5′-ACAAACGGGCAACATACCTTG-3′,
respectively, and the specific fluorescent probe was
5′FAM-CATCCTGCTGCTATGCCTCATCTTCTT-Dabcyl3′. A dilution series of
the WHO international reference standard for HBV DNA [NIBSC 97/746,
genotype B (accession nos. D00329, AF100309, AB033554)], 0,
4×10⁴, 4×10⁵, 4×10⁶,
4×10⁷ IU/ml) was PCR amplified. The thermocycling
conditions were as follows: 50°C for 2 min for UNG enzyme reaction,
94°C for 5 min for Taq enzyme activation; 45 cycles of 94°C for 15
sec and 57°C for 30 sec, and 25°C for 10 sec.
Standard solutions and quality control
(QC) samples
Stock solutions of LAM and ETV (2 µg/ml) and TFV (10
mM) were prepared by dissolving the reagents in 50% methanol in
water, storing them at −20°C and serially diluting them in 50%
methanol to generate the sample concentrations. Calibration curves
(LAM and ETV for cells and culture supernatants: 0.5, 2, 10, 25, 50
and 100 ng/ml and 0.2, 0.5, 1.0, 2.0, 5.0, and 10.0 ng/ml,
respectively; TFV for cells: 0.45, 0.9, 4.5, 9.0, 45.0 and 90.0
ng/ml; TFV for culture supernatants: 9.0, 18.0, 45.0, 90.0, 180.0
and 450.0 ng/ml) and two QC samples with low and high
concentrations (LAM and ETV for cells and culture supernatants:
0.5, 80 and 0.5, 8.0 ng/ml; TFV for cells: 0.9 and 72.0 ng/ml; TFV
for culture supernatants: 18.0 and 360 ng/ml) were prepared by
spiking stock solutions into blank cell samples or blank culture
supernatants (controls).
Sample preparation
Cells (3×10⁵/ml) were transferred to
6-well culture plates and the following day were treated with LAM,
ETV or TFV for 4 days in the presence or absence of 5 µM MK571 (a
widely used MRP4 inhibitor) for 48 h (HepG2.4D14) or 4 h
(HepG2.A64). At the end of each time-point, 5×10⁶ cells
were centrifuged at 4°C for 5 min at 12,000 × g and washed twice
with ice cold phosphate-buffered saline (PBS). The cells were fully
lysed on ice by ultrasonic treatment in 200 µl 70% methanol.
Culture medium was extracted with an equivalent volume of ice-cold
100% methanol. For calibration, 10 µl working standard solutions
were spiked into 90 µl blank cell samples or blank supernatant
tubes. After vortexing for 5 min and centrifuging at 4°C for 10 min
at 12,000 × g, 100 µl samples were drawn for LCMS analysis.
LCMS conditions
The LCMS system consisted of two LC-20AD pumps, a
SIL-20ACHT autosampler, a CTO-20AC column oven and a DGU-20A3
degasser (Shimadzu Corporation, Kyoto, Japan). A Leapsil
C18 column (150×2.1 mm, 2.7-µm particle size; Dikma,
Richmond Hill, NY, USA) with a pre-column (4.0×3.0 mm I.D., 5 µm;
Phenomenex, Torrance, CA, USA) was used for the sample separation.
The mobile phase for ETV consisted of 5 mM ammonium acetate in
water (solvent A) and methanol (solvent B). The mobile phase for
LAM and TFV was 10 mM ammonium acetate, 0.5% formic acid in water
(solvent A) and 0.5% formic acid in 100% methanol (solvent B). The
analytical column was operated at a flow rate of 0.25 ml/min at
40°C, and a volume of 10 µl was injected at 4°C. The linear
gradient profile consisted of the following proportions of solvent
A and B applied at time t (min); (t, %): 1, 95%; 1.5, 5%; 3.0, 5%;
3.5, 95%.
The samples were detected using an API 4000 triple
quadrupole mass spectrometer (Applied Biosystems; Thermo Fisher
Scientific, Inc.) equipped with electrospray ionization (ESI). The
ESI ion source temperature was set at 650°C, and the capillary
voltage was 5.5 kV. Multiple reaction monitoring transitions were
applied for quantification in comparison with standards: m/z
230.1→112.1 for LAM, m/z 278.3→152.1 for ETV, and m/z 288.2→176.2
for TFV. Integration of the peak area and data analysis was
performed using Analyst 1.6.2 software (Applied Biosystems; Thermo
Fisher Scientific, Inc.).
Method validation
Validation of the specificity, linearity, lower
limit of quantification (LLOQ), precision, accuracy, recovery (RE),
matrix effect (ME), dilution and stability of the method was
evaluated according to the guidance of the Food and Drug
Administration (FDA) Guidance for industry bioanalytical method
validation (15).
LLOQ was defined as the lowest concentration of the
calibration curve at which precision and accuracy was within 20%
with a signal-to-noise ratio >10.0. The selectivity of each
ingredient over interference from endogenous substances was
assessed. The presence of components for which the response was
<20% LLOQ was accepted. A calibration curve was established
based on external standards using a weighted least-squares linear
regression with 1/x2 weighting. Accuracy and precision
were assessed by analysing five replicates of the two QC samples on
three subsequent days, and accuracy and precision bias within ±15%
was accepted. The RE and intra- and inter-day relative standard
deviation should be <15%. ME was determined by comparing the
percentage of the peak area for each ingredient spiked into the
drug-free blank sample (control) with those in the two QC levels.
The stability of each ingredient demonstrated that the accuracy and
precision bias introduced by storage at room temperature for 4 h
and 30 days at −80°C and 8 h in the autosampler were all within
15%. The dilution integrity was assessed at 2 -fold, 4-fold or
20-fold the upper limit of the quantification concentration for all
samples.
Statistical analysis
All data are presented as the mean ± standard error
of at least three independent experiments. Data were compared using
an unpaired two-tailed Student's t-test, two-way analysis of
variance followed by Bonferroni's post hoc test or nonlinear
regression. The statistical analyses were performed using SPSS
software version 12.0.0 (SPSS Inc., Chicago, IL, USA). P<0.05
was considered to indicate a statistically significant
difference.
Results
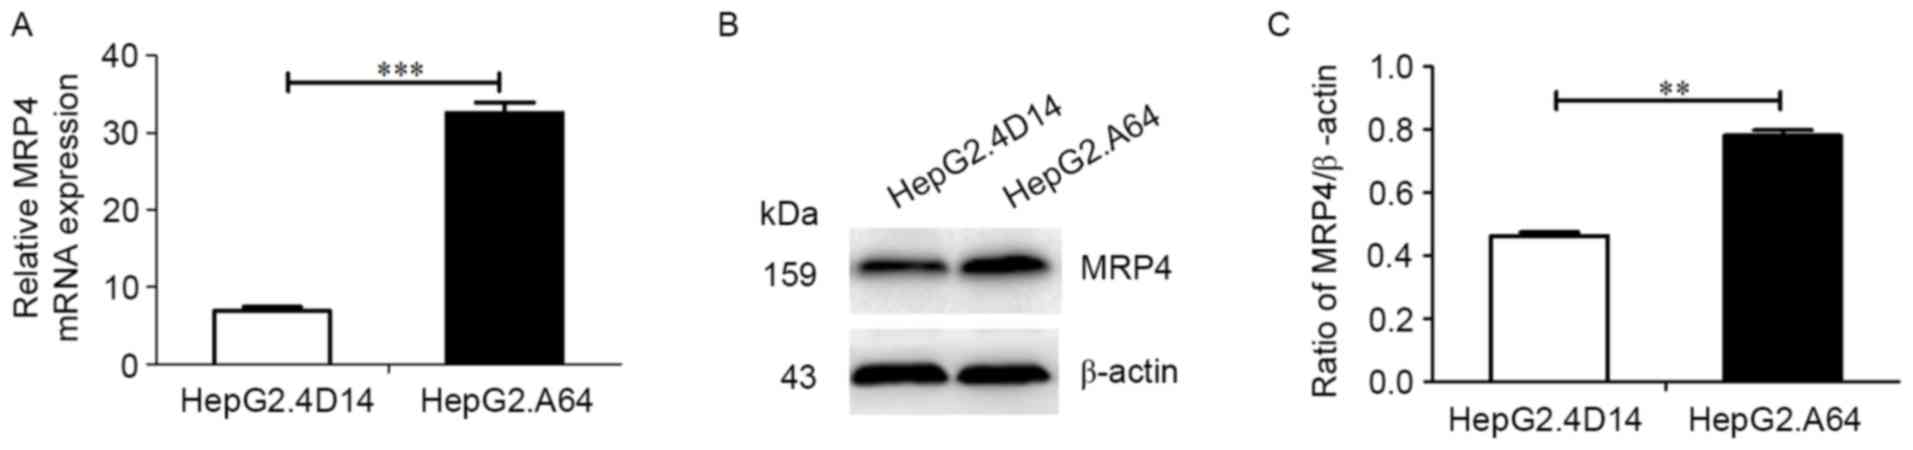
Expression of MRP4 in HepG2.4D14 and
HepG2.A64 cell lines
MRP4 transcriptional levels were detected in
HepG2.4D14 cells containing wild-type HBV and HepG2.A64 cells
containing ETV-resistant HBV. MRP4 mRNA expression was higher in
HepG2.A64 cells than that in HepG2.4D14 cells (Fig. 1A; P<0.001). Furthermore, the
protein expression levels of MRP4 were consistent with the MRP4
transcriptional levels (Fig. 1B and
C; P<0.01).
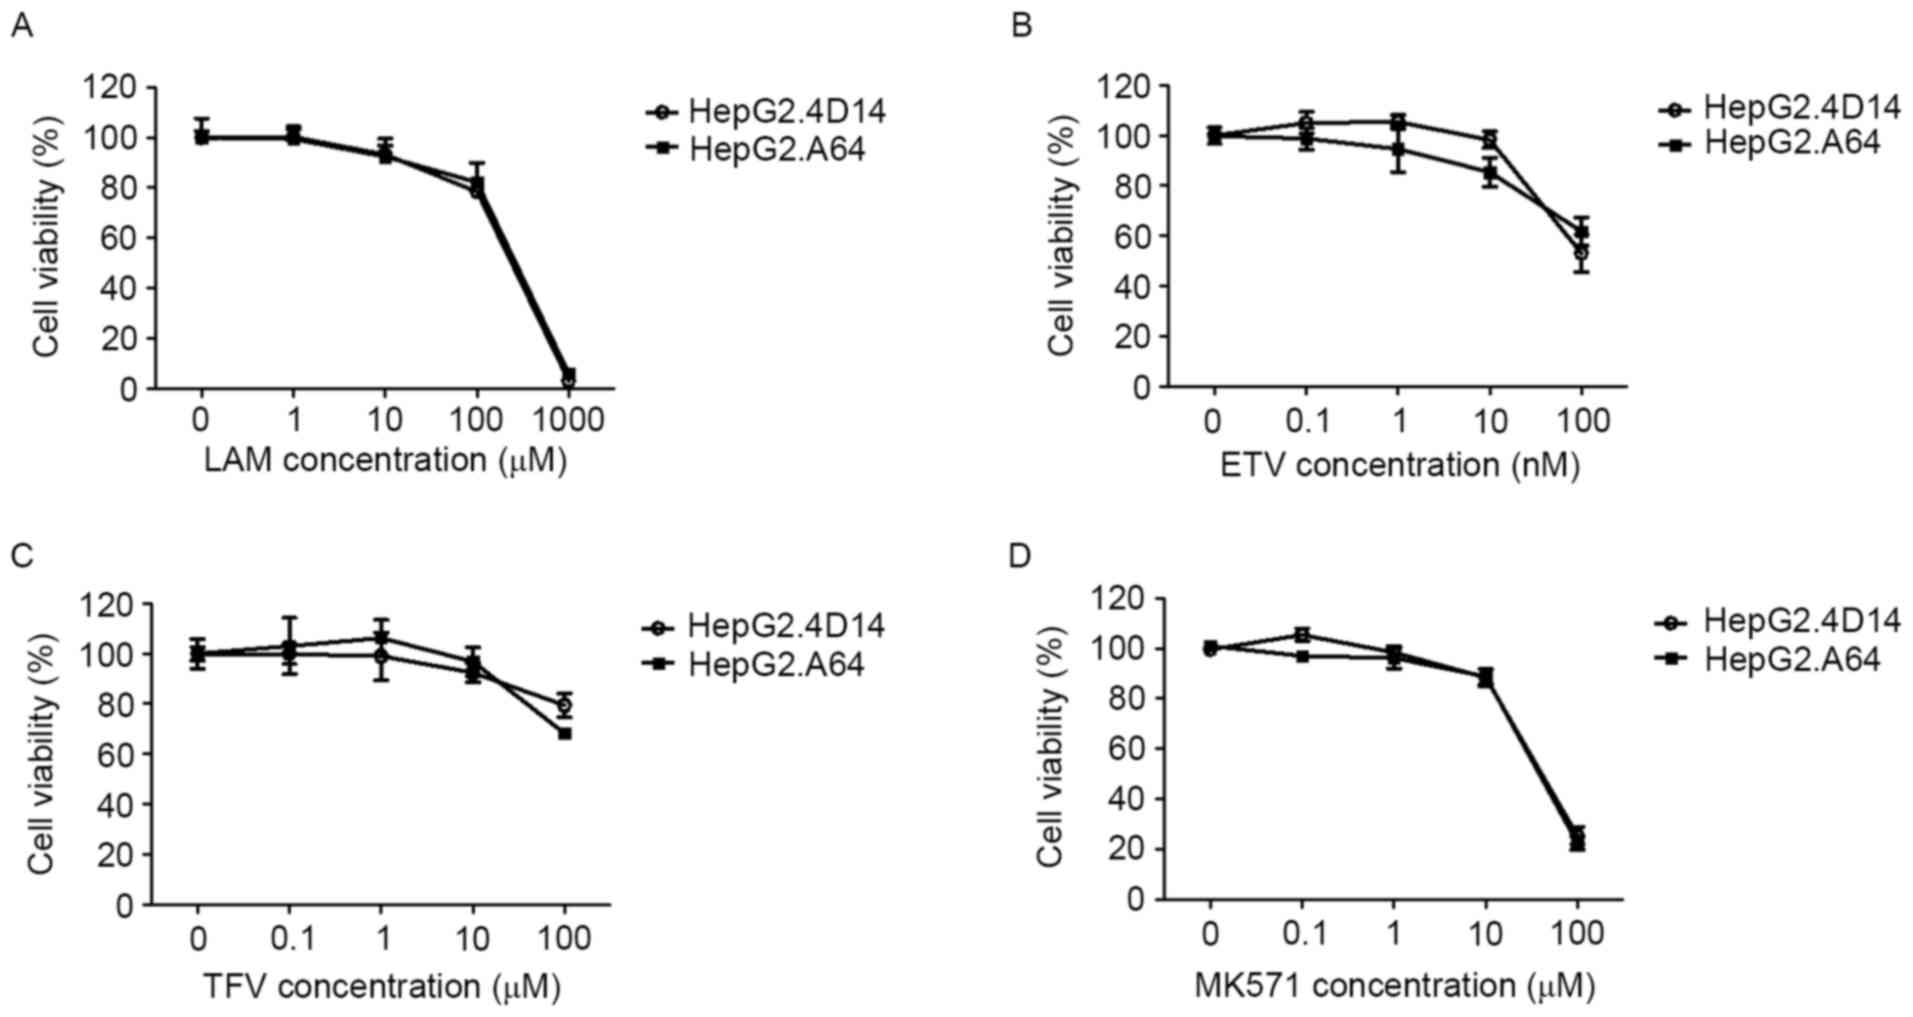
Cytotoxicity of compounds in
HepG2.4D14 and HepG2.A64 cells
To investigate the cytotoxicity of antiviral drugs
(LAM, ETV and TFV) and the MRP inhibitor MK571 in hepatic cells,
HepG2.4D14 and HepG2.A64 cells were incubated with various
concentrations of these drugs for 96 h (Fig. 2). In both cell types, apparent
cytotoxicity was observed for LAM, ETV, TFV and MK571, at doses
above 10 µM (Fig. 2). The
calculated IC50 was 180.80, 0.14, 256.27 and 44.57 µM in
HepG2.4D14 cells for LAM, ETV, TFV and MK571, respectively, and
similar IC50 values were obtained in HepG2.A64 cells
(Table I). Therefore, noncytotoxic
doses were used for subsequent experiments.
 | Table I.IC50 values (µM) of LAM,
ETV and TFV in HepG2.4D14 (wild-type), and HepG2.A64 (ETV-resistant
mutant) cells. |
Table I.
IC50 values (µM) of LAM,
ETV and TFV in HepG2.4D14 (wild-type), and HepG2.A64 (ETV-resistant
mutant) cells.
| Compound | HepG2.4D14 | HepG2.A64 |
|---|
| LAM |
180.80±0.09 |
225.79±0.04 |
| ETV |
0.14±0.00 |
0.24±0.04 |
| TFV |
256.27±0.00 |
210.38±0.00 |
| MK571 |
46.57±0.03 |
39.50±0.05 |
NAs against HBV in HepG2.4D14 and
HepG2.A64 cells
HepG2.4D14 and HepG2.A64 cells expressing HBV were
used to analyze the anti-HBV activities of LAM, ETV and TFV. The
levels of supernatant HBV DNA in HepG2.4D14 and HepG2.A64 cells
treated with antiviral drugs at various non-cytotoxic
concentrations for 4 days were quantified by qPCR. LAM, ETV and TFV
demonstrated anti-HBV activities in HepG2.4D14 cells
[concentrations for 50% of the maximal effect (EC50) values were
4.14±0.03, 0.13±0.02 and 3.24±0.01 µM, respectively] and in
HepG2.A64 cells (EC50 values were 5.94±0.20, 6.28±0.07
and 11.43±0.09 µM, respectively; Table II). Compared with wild-type
HepG2.4D14 cells, the potency of ETV was decreased by at least
48-fold in ETV-resistant HepG2.A64 cells (Table II). The latter conferred a 3- to
4-fold decreased susceptibility to TFV in cell culture (Table II). Taken together, these data
demonstrated that HepG2.4D14 and HepG2.A64 cells could be used to
investigate drug resistance, suggesting that they may be helpful to
screen for inhibitors of HBV replication.
| Table II.In vitro susceptibilities of
HepG2.4D14 (wild-type) and HepG2.A64 (ETV-resistant mutant) to LAM,
ETV and TFV in a cell-based antiviral assay. |
Table II.
In vitro susceptibilities of
HepG2.4D14 (wild-type) and HepG2.A64 (ETV-resistant mutant) to LAM,
ETV and TFV in a cell-based antiviral assay.
|
| HepG2.4D14 | HepG2.A64 |
|
|---|
|
|
|
|
|
|---|
| Compound | EC50
(µM) | n | EC50
(µM) | n | Fold
resistance |
|---|
| LAM |
4.14±0.03 | 3 |
5.94±0.2 | 5 | 1.5 |
| ETV |
0.13±0.02 | 7 |
6.28±0.07 | 8 | 48.3 |
| TFV |
3.24±0.01 | 4 |
11.43±0.09 | 3 | 3.5 |
Optimization of chromatographic
conditions
To optimize chromatographic behavior, several types
of aqueous and organic phases were evaluated: Different
concentrations of ammonium acetate buffer, ammonium formate or
formic acid were used instead of water; methanol was used to
supplant acetonitrile; and different volumes of formic acid were
added to the organic phase to adjust the pH value. The mobile phase
selected for each ingredient was revealed to be suitable based on
method validation. The ESI source conditions for MS were also
optimized to obtain a good signal with a high sensitivity.
The drugs concentrations were varied between the
cell and supernatant samples, which led to a wide linear range of
measurements. For LAM and ETV, the linear range can cover both cell
and supernatant samples, and thus the same calibration curves and
QCs were used. However, for TFV, the linear range did not encompass
them both, and therefore two different calibration curves were used
to insure accuracy. The results for the inter-run (n=5) precision,
accuracy, RE, ME and LLOQs for LAM, ETV and TFV in cell and culture
supernatant samples at two QC levels are presented in Table III.
| Table III.Results of the precision, accuracy,
RE, ME and LLOQs of LAM, ETV and TFV. |
Table III.
Results of the precision, accuracy,
RE, ME and LLOQs of LAM, ETV and TFV.
|
|
|
|
|
|
| LLOQ |
|---|
|
|
|
|
|
|
|
|
|---|
| Compound | QCs (ng/ml) | Precision RSD
(%) | Accuracy RSD
(%) | RE (%) | ME | Conc. (ng/ml) | RSD (%) |
|---|
| LAM | 0.5 | 10.1 | 112.5 | 112.3 | 112.4 | 0.25 | 9.8 |
|
| 80 | 6.5 | 103.4 | 100.9 | 118.9 |
|
|
| ETV | 0.5 | 8.8 | 101.6 | 110.5 | 80.2 | 0.2 | 11.2 |
|
| 8.0 | 3.2 | 101.4 | 102.8 | 84.7 |
|
|
| TFV (cell) | 0.9 | 12.3 | 89.8 | 109.8 | 69.2 | 0.45 | 10.4 |
|
| 72.0 | 2.2 | 93.4 | 104.1 | 77.9 |
|
|
| TFV
(supernatant) | 18.0 | 4.1 | 104.9 | 96.5 | 70.4 | 9.0 | 12.9 |
|
| 360.0 | 1.2 | 100.9 | 98.1 | 62.5 |
|
|
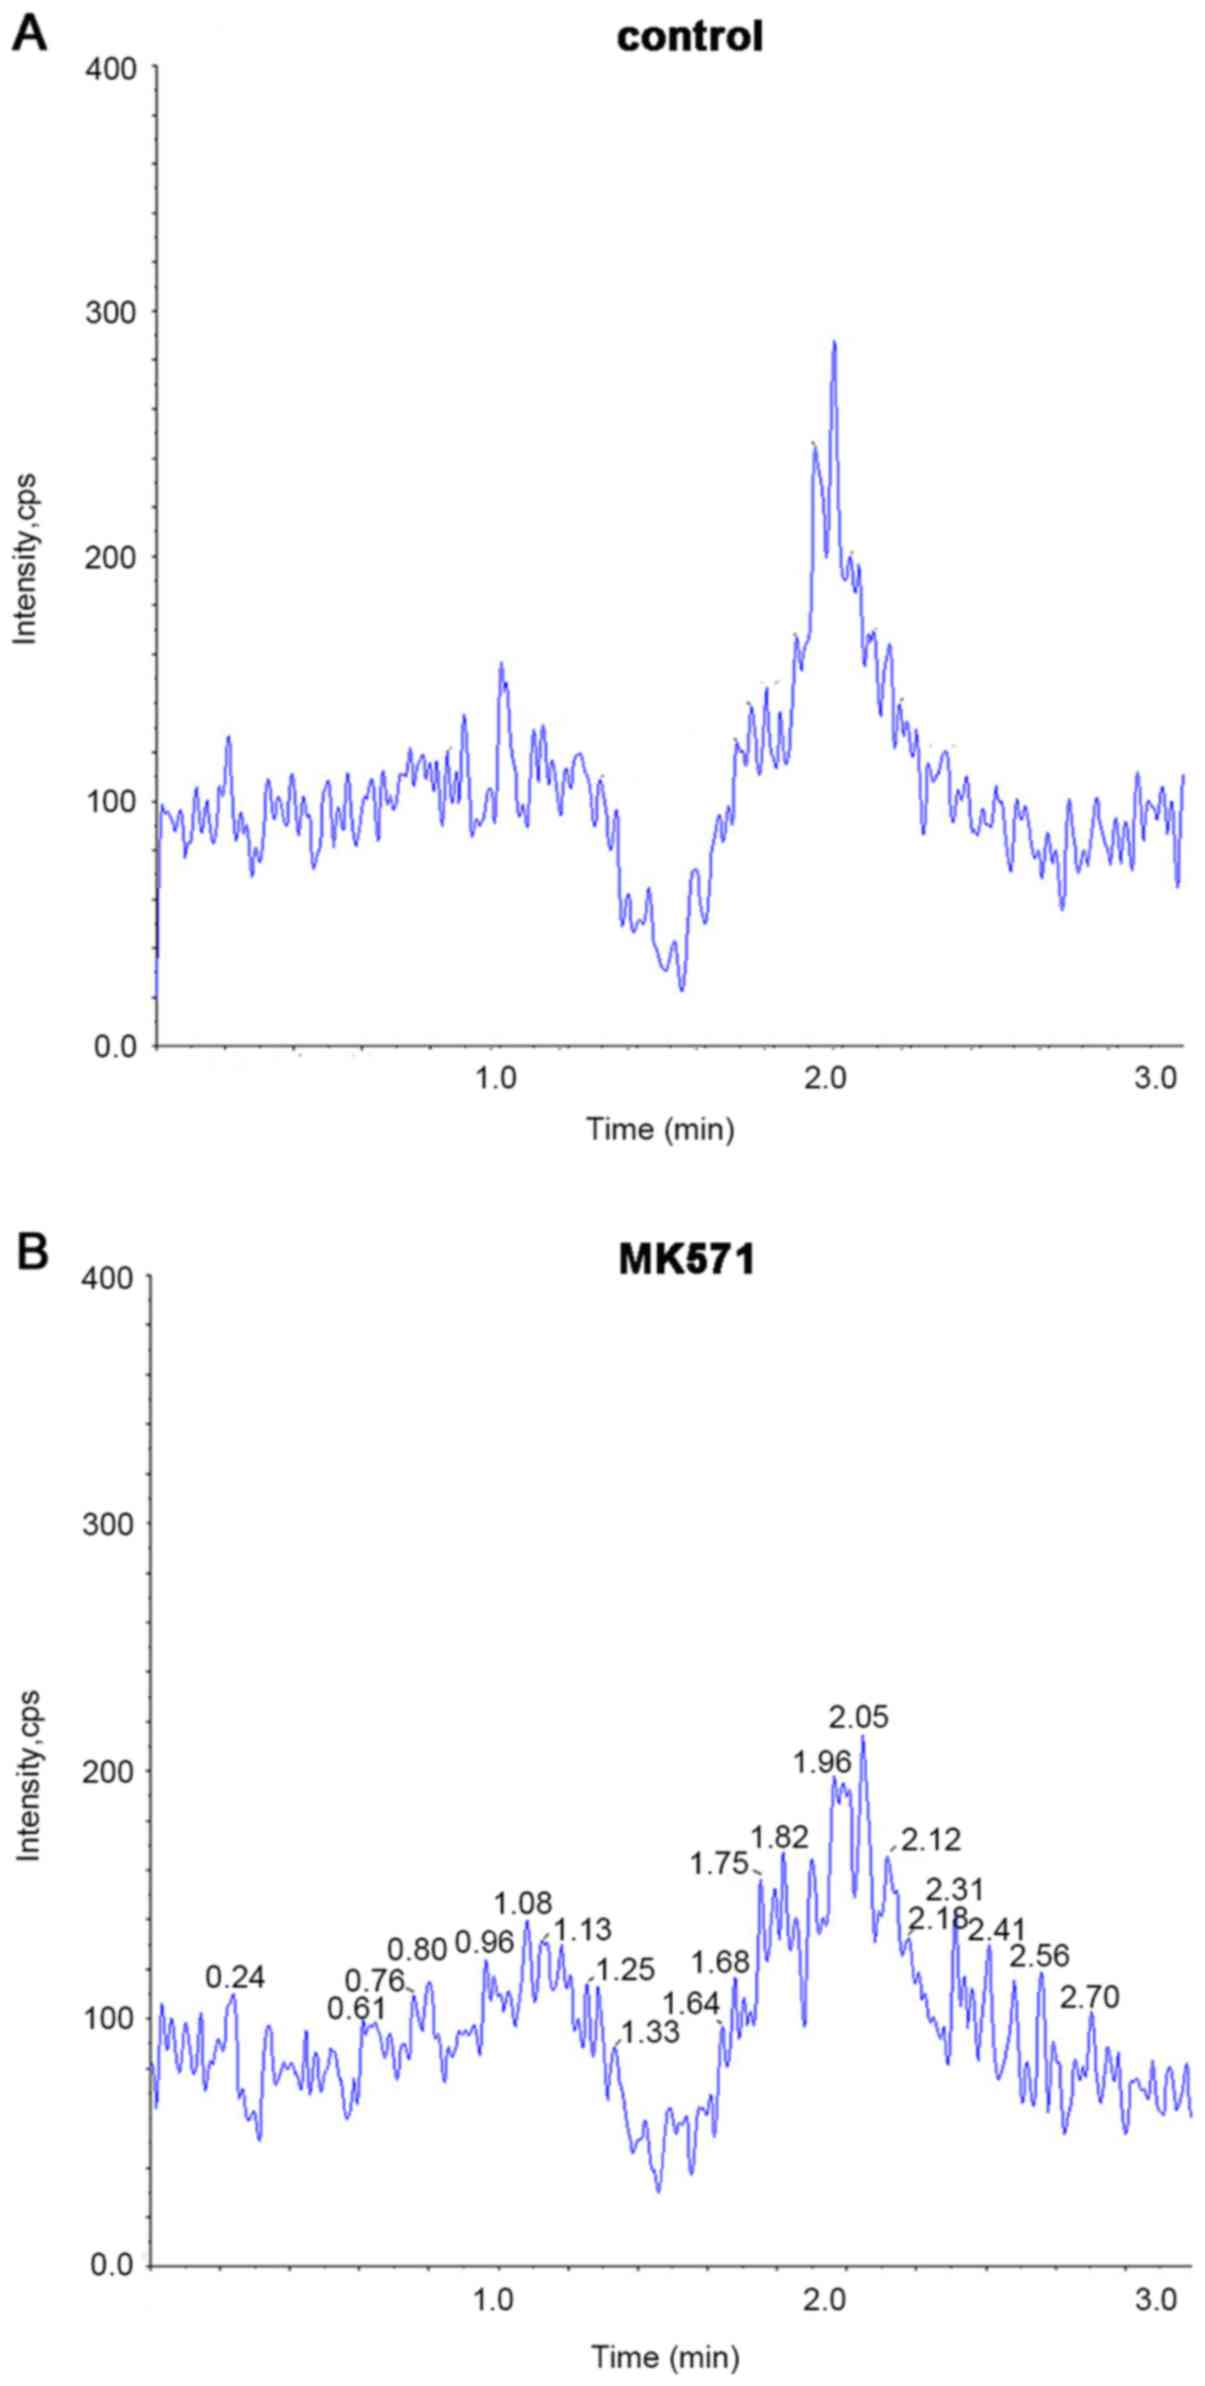
For the selectivity study, no significant peaks at
the retention time of each ingredient were identified in the blank
samples (control and MK571; Fig. 3A
and B). Cell samples of LAM, ETV and TFV, as well as the
supernatant samples of LAM and ETV displayed good chromatographic
behavior using the same precipitation method with acetonitrile
mixed with methanol (Fig. 4A and
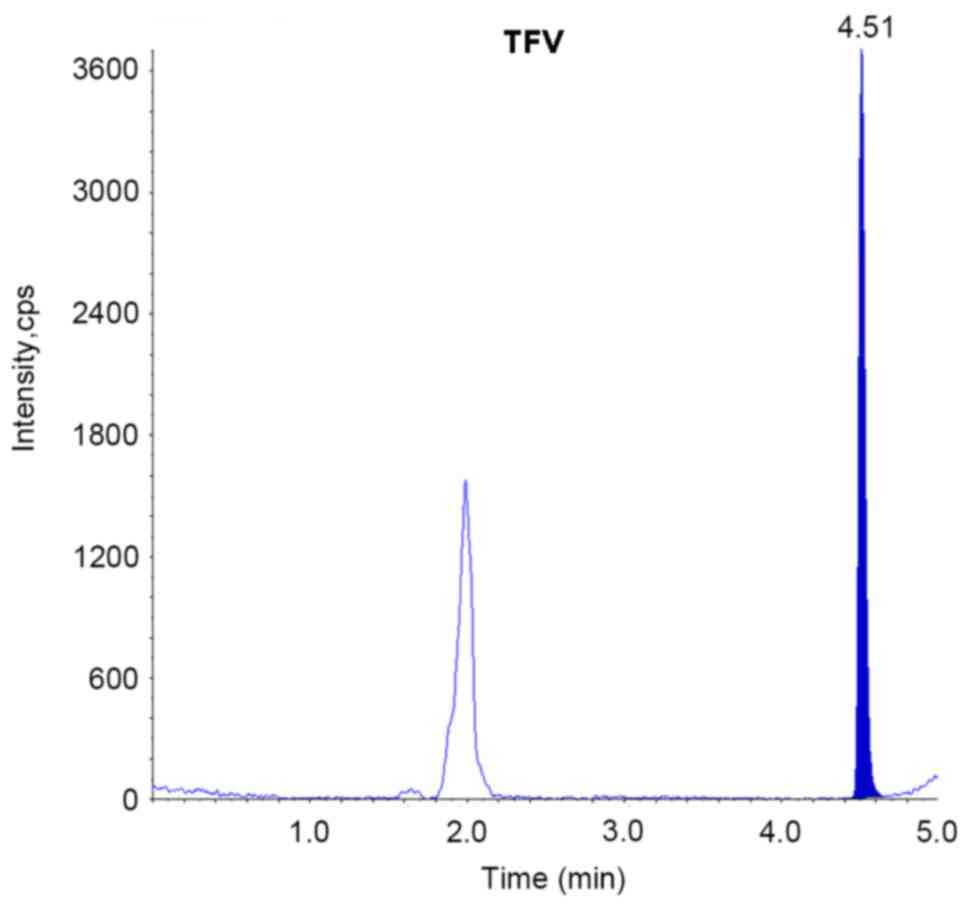
B). However, for the supernatant samples of TFV, the above
method was not suitable for analysis of the peak shape and response
values. Only when the pH was adjusted to the samples using formic
acid did we obtain a suitable chromatographic behavior for TFV
(Fig. 5). The retention time of
LAM, ETV and TFV was 1.64, 4.25 and 4.51 min, respectively.
Effect of a transport inhibitor on LAM
and ETV concentrations in HepG2.4D14 and HepG2.A64 cells
To study the pharmacokinetics of LAM and ETV in
different cell types, incubations with LAM, ETV and TFV were
conducted over 4 days in the presence or absence of MK571. It is
well known that TFV is transported by MRP4 (3,6,7);
thus, it was used as a positive control.
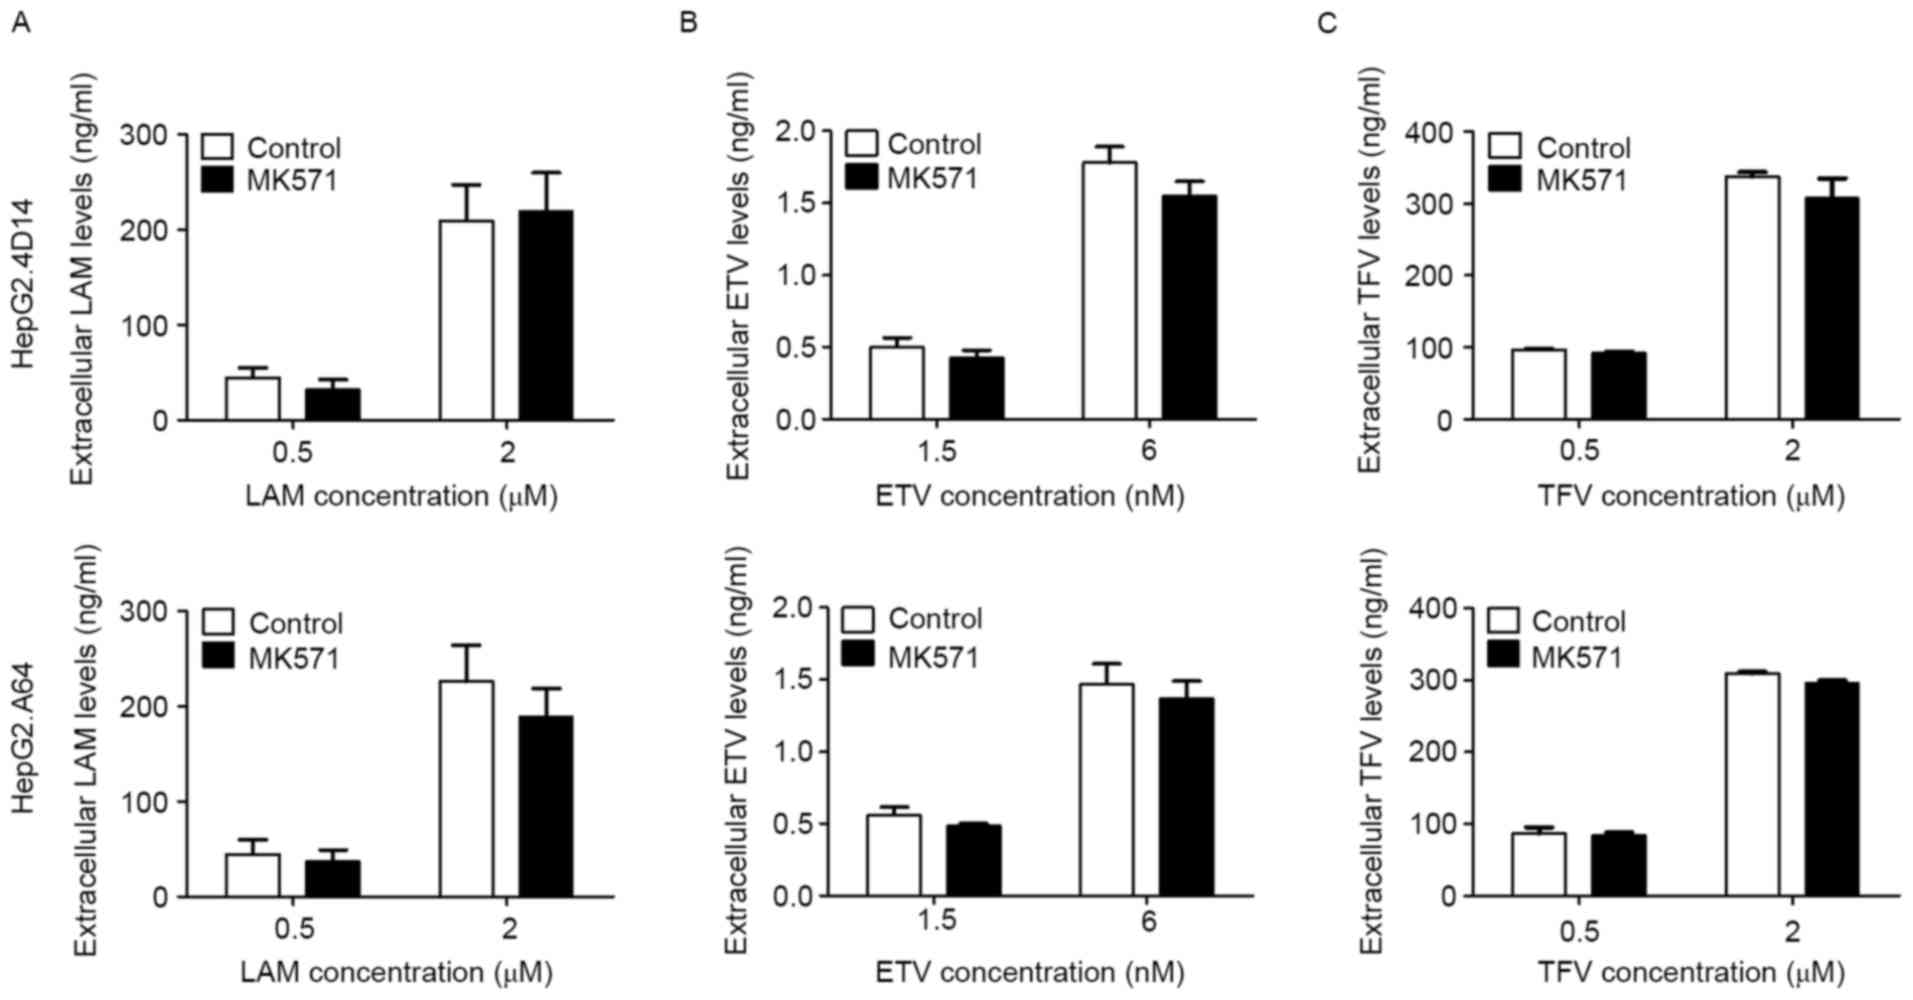
After dosing with MK571, LAM, ETV and TFV
demonstrated lower extracellular drug concentrations than those in
the culture medium both in HepG2.4D14 and HepG2.A64 cells (Fig. 6), whereas their intracellular
concentrations in HepG2.4D14 cells exceeded those in HepG2.A64
cells (Fig. 7). In contrast to the
control group (absence of MK571), the extracellular concentrations
of all three drugs were slightly reduced by the presence of MK571
(Fig. 6A-C), while their
intracellular accumulation was markedly increased by the presence
of MK571 in the two cell lines, especially for ETV (P<0.05) and
TFV (0.5 µM, P<0.05; 2 µM, P<0.01) in HepG2.4D14 cells
(Fig. 7A-C).
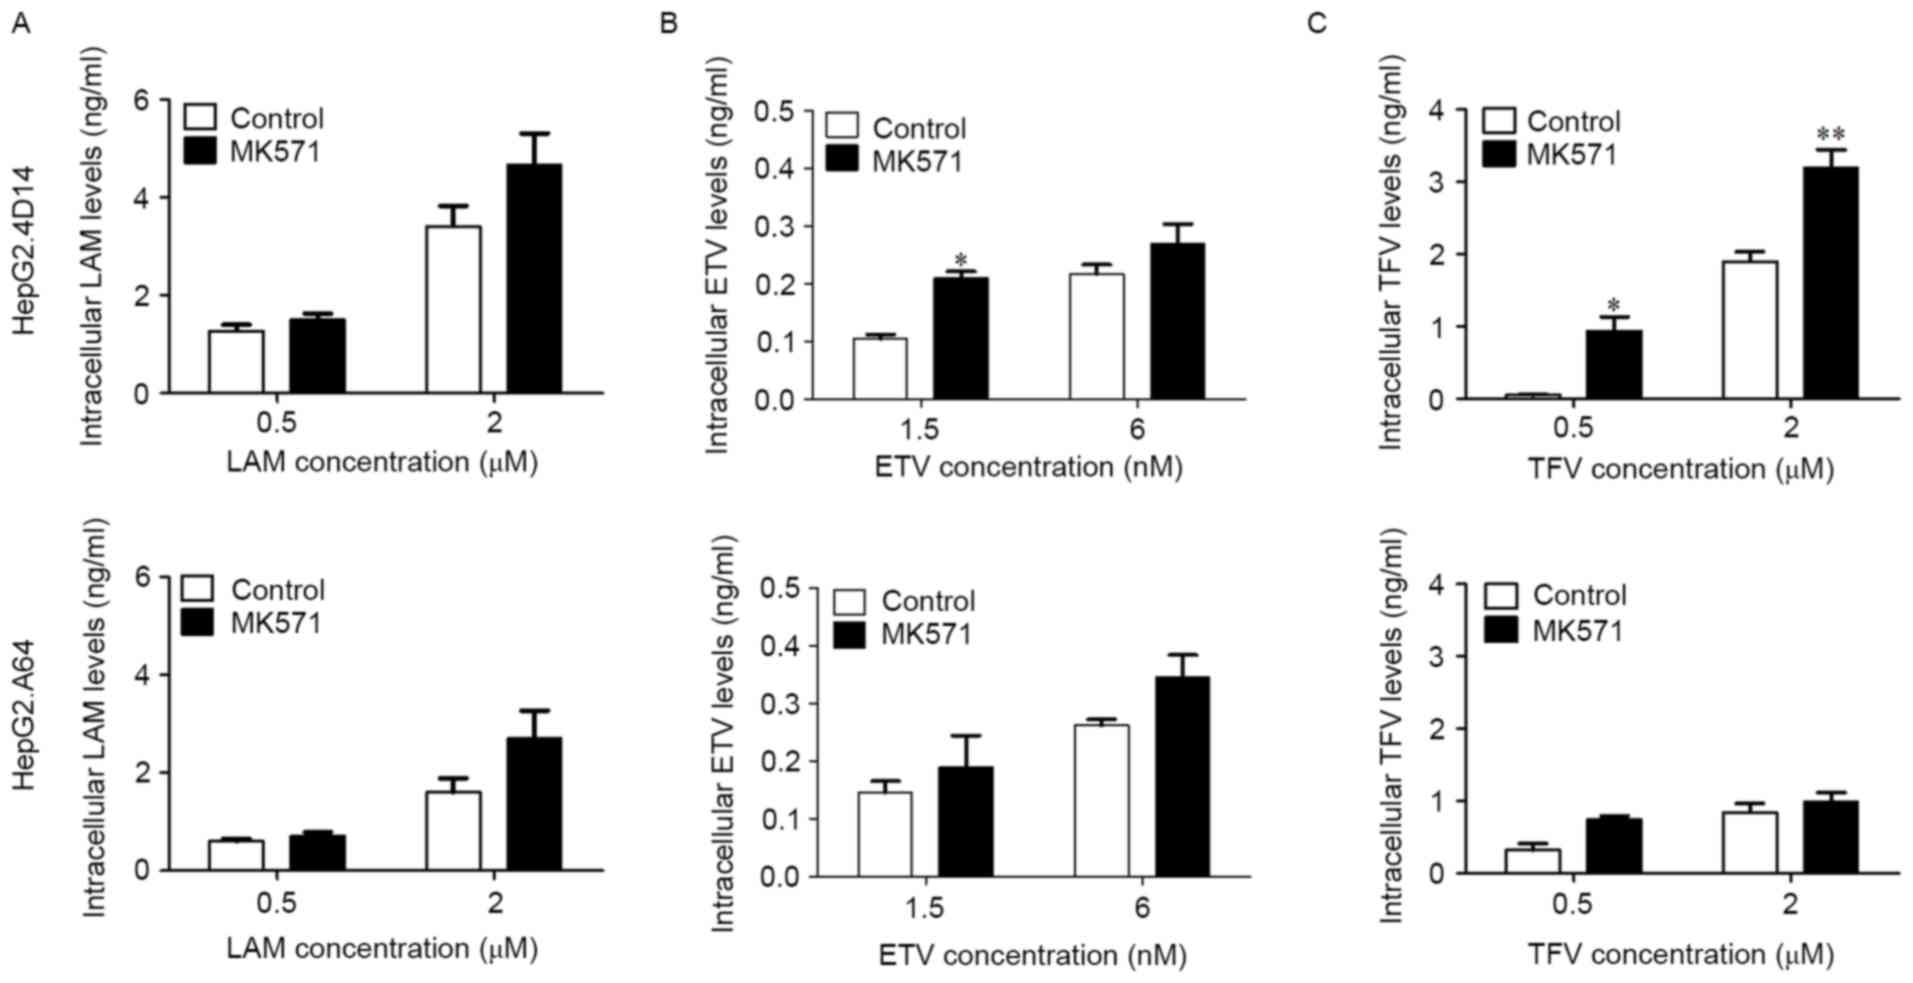 | Figure 7.Intracellular concentrations of LAM,
ETV and TFV in HepG2.4D14 and HepG2.A64 cells. HepG2.4D14 and
HepG2.A64 cells were treated with (A) LAM, (B) ETV and (C) TFV for
4 days in the presence or absence of MK571. At the end of each
time-point, cells were lysed and centrifuged, and the amounts of
intracellular LAM, ETV and TFV were measured by liquid
chromatography-mass spectrometry. Data are expressed as the mean ±
standard error. *P<0.05, **P<0.01 vs. control group. LAM,
lamivudine; ETV, entecavir; TFV, tenofovir; MK571,
3-([(3-(2-[7-chloro-2-quinolinyl]ethyl)phenyl]-[(3-dimethylamino-3-oxoporphyl)-thio)-methyl]-thio)
propanoic acid; LCMS, liquid chromatography-mass spectrometry. |
Discussion
MRP4 is capable of transporting acyclic nucleotide
phosphonates, but little is known about its role in LAM and ETV
transport. LCMS method for estimating NA concentration in the cells
is more sensitive, specific and efficient. The present study
assessed the ability of MRP4 to interact with LAM and ETV using
LCMS analysis, and demonstrated that MRP4 is capable of
transporting LAM and ETV.
Analyses of NAs have been performed in plasma,
urine, cultured cells and tissues (3,8,16–18).
Plasma drug concentrations are usually thought to predict clinical
efficacy in pharmacokinetic studies. However, the plasma or medium
concentrations of drugs with low membrane permeability or those
that are substrates for drug transporters, such as adefovir and
TFV, may not reflect their intracellular concentrations (19). The results of the present study
supported this perspective and indicated that medium concentrations
of LAM, ETV and TFV were different from their intracellular
concentrations. Therefore, it is important to not only monitor
plasma or medium concentration but also variations in the
intracellular concentrations of NAs, according to the
pharmacological mechanism of drug action (8).
To better evaluate the intracellular concentration
of NAs, the LCMS conditions were optimized. Drug detection may be
seriously affected by the matrix effects caused by the use of
bio-analytical methods. Many approaches are capable of reducing
matrix effects, and the most important approaches include sample
preparation methods, efficient chromatographic separation and use
of quantitative stable isotopically labeled internal standards
(20,21). The latter are often overlooked,
probably owing to their high cost and limited availability in
recently emerging LCMS assays (22,23).
In most analytical methods, sample pretreatment is very important
because the main purpose of this step is to reduce matrix effects
(24). The extraction of unstable
NAs is performed on ice and in the dark. Common sample preparation
methods are generally divided into protein precipitation (PP) and
solid phase extraction (SPE). PP is the simplest method to remove
proteins using PP reagents such as inorganic acid (perchloric acid)
(25), organic acid
(trichloroacetic acid) (26) or an
organic solvent (acetonitrile, methanol) (27,28)
in biological matrices. In the present study, after lysing the
cells completely using appropriate conditions such as ultrasonic
vibration, methanol was used to sufficiently reduce the matrix
effects. Different LC columns, mobile phase compositions and flow
rates were evaluated separately for each ingredient in this study
to optimize the peak shapes. A Leapsil C18 column could
provide satisfactory results for all ingredients. The parameters
for ESI positive ion mode were optimized separately for the
detection specificity. These improved LCMS methods for the
determination of the intracellular concentration of NAs were
simpler, faster and more sensitive.
Because NAs inhibit serum HBV DNA and only induce
low rates of HBsAg seroconversion, most patients require long-term
treatment to prevent the progression of liver disease. Long-term
therapy requires the ability to manage NA treatment failure. It has
been demonstrated that NA treatment failure is associated with
increased expression of MRP4 in antiretroviral therapy (29). Furthermore, the absence of MRP4
increases the concentrations of adefovir and TFV in MRP4 knockout
mice (3). This finding provides a
possible link between the levels of NA and the expression of MRP4.
The results of the present study demonstrated that inhibition of
MRP4 increased the intracellular concentrations of LAM, ETV and TFV
in vitro, enhancing their antiviral effectiveness. Thus,
MRP4 may regulate LAM and ETV concentrations in human hepatocyte
cell lines.
MRP4 mediates ATP-dependent unidirectional
transport. It is widely present in human epithelial cells and is
mostly localized to the basolateral membrane (30), except for the luminal side of the
brain capillary endothelium and the renal proximal tubular cells
(2). MRP4 is localized to the
sinusoidal membrane of human hepatocytes, and MRP4-mediated export
is potently suppressed by the quinoline derivative MK571 (31). The amounts of expressed MRP4
determine the intracellular concentration of MRP4-mediated
transported drugs (4). The results
of the present study demonstrated that the intracellular
concentrations of the three antiviral agents were enhanced by
inhibiting MRP4 export. Consequently, compared with HepG2.4D14
cells, HepG2.A64 cells expressing high levels of MRP4 displayed
increased drug export and a reduced intracellular accumulation of
NAs. Thereby, the intracellular concentrations of LAM, ETV and TFV
in HepG2.A64 cells were lower than those in HepG2.4D14 cells.
Prostaglandin E2 may stimulate MRP4 ATPase activity;
however, concentration-dependent biphasic kinetics may have an
influence (32). Similarly, the
MRP4-mediated transport of DHEAS and estradiol 17-β-D-glucuronide
is suppressed by low concentrations of steroid analogues and
sulfated bile acids in a competitive manner, whereas no inhibition
is observed at a high concentration (33). The results of the present study
further confirmed this finding and indicated that low doses of NAs
in the presence of an MRP4 inhibitor accumulated to a greater
extent than high doses of <8 µM for LAM and TFV or 25 nM for ETV
(data not shown), and even high concentrations of NAs demonstrated
no significant change, compared with the control group.
In conclusion, the present study demonstrated the
involvement of MRP4 in LAM and ETV efflux, and elucidated the
mechanism of its distribution in two hepatocyte cell lines. These
results may contribute to enhancing antiviral efficacy and will be
applied in the case of NA treatment failure.
Acknowledgements
The authors would like to thank Professor Dong-Ping
Xu for providing HepG2.4D14 and HepG2.A64 cell lines, and American
Journal Experts for helping prepare the manuscript.
Glossary
Abbreviations
Abbreviations:
|
MRP4
|
multidrug resistance protein 4
|
|
LAM
|
lamivudine
|
|
ETV
|
entecavir
|
|
HBV
|
hepatitis B virus
|
|
TFV
|
tenofovir
|
|
MK571
|
3-([(3-(2-[7-chloro-2-quinolinyl]ethyl)phenyl]-[(3-dimethylamino-3-oxoporphyl)-thio)-methyl]-thio)
propanoic acid
|
|
DHEAS
|
dehydroepiandrosterone 3-sulphate
|
|
NAs
|
nucleos(t)ide analogues
|
|
NFV
|
nelfinavir
|
|
HPLC
|
high performance liquid
chromatography
|
|
LCMS
|
liquid chromatography-mass
spectrometry
|
|
CCK-8
|
cell counting kit-8
|
|
IC50
|
the concentrations of 50% inhibition
of growth
|
|
PCR
|
polymerase chain reaction
|
|
QC
|
quality control
|
|
PBS
|
phosphate-buffered saline
|
|
ESI
|
electrospray ionization
|
|
MRM
|
multiple reaction-monitoring
|
|
LLOQ
|
lower limit of quantification
|
|
RE
|
recovery
|
|
ME
|
matrix effect
|
|
EC50
|
concentration for 50% of maximal
effect
|
|
PP
|
protein precipitation
|
|
SPE
|
solid phase extraction
|
References
|
1
|
Schuetz JD, Connelly MC, Sun D, Paibir SG,
Flynn PM, Srinivas RV, Kumar A and Fridland A: MRP4: A previously
unidentified factor in resistance to nucleoside-based antiviral
drugs. Nat Med. 5:1048–1051. 1999. View
Article : Google Scholar : PubMed/NCBI
|
|
2
|
Sodani K, Patel A, Kathawala RJ and Chen
ZS: Multidrug resistance associated proteins in multidrug
resistance. Chin J Cancer. 31:58–72. 2012. View Article : Google Scholar : PubMed/NCBI
|
|
3
|
Imaoka T, Kusuhara H, Adachi M, Schuetz
JD, Takeuchi K and Sugiyama Y: Functional involvement of multidrug
resistance-associated protein 4 (MRP4/ABCC4) in the renal
elimination of the antiviral drugs adefovir and tenofovir. Mol
Pharmacol. 71:619–627. 2007. View Article : Google Scholar : PubMed/NCBI
|
|
4
|
Fukuda Y, Takenaka K, Sparreboom A,
Cheepala SB, Wu CP, Ekins S, Ambudkar SV and Schuetz JD: Human
immunodeficiency virus protease inhibitors interact with ATP
binding cassette transporter 4/multidrug resistance protein 4: A
basis for unanticipated enhanced cytotoxicity. Mol Pharmacol.
84:361–371. 2013. View Article : Google Scholar : PubMed/NCBI
|
|
5
|
Wen J, Luo J, Huang W, Tang J, Zhou H and
Zhang W: The pharmacological and physiological role of
multidrug-resistant protein 4. J Pharmacol Exp Ther. 354:358–375.
2015. View Article : Google Scholar : PubMed/NCBI
|
|
6
|
Takenaka K, Morgan JA, Scheffer GL, Adachi
M, Stewart CF, Sun D, Leggas M, Ejendal KF, Hrycyna CA and Schuetz
JD: Substrate overlap between Mrp4 and Abcg2/Bcrp affects purine
analogue drug cytotoxicity and tissue distribution. Cancer Res.
67:6965–6972. 2007. View Article : Google Scholar : PubMed/NCBI
|
|
7
|
Ray AS, Cihlar T, Robinson KL, Tong L,
Vela JE, Fuller MD, Wieman LM, Eisenberg EJ and Rhodes GR:
Mechanism of active renal tubular efflux of tenofovir. Antimicrob
Agents Chemother. 50:3297–3304. 2006. View Article : Google Scholar : PubMed/NCBI
|
|
8
|
Mu L, Liu X, Li S, Tang F and Yu P:
Determination of intracellular concentrations of nucleoside
analogues and their phosphorylated metabolites. J Mol Pharm Org
Process Res. 2:1122014.doi: 10.4172/2329-9053.1000112.
|
|
9
|
Bushman LR, Kiser JJ, Rower JE, Klein B,
Zheng JH, Ray ML and Anderson PL: Determination of nucleoside
analog mono-, di-, and tri-phosphates in cellular matrix by solid
phase extraction and ultra-sensitive LC-MS/MS detection. J Pharm
Biomed Anal. 56:390–401. 2011. View Article : Google Scholar : PubMed/NCBI
|
|
10
|
Zhang D, Fu Y, Gale JP, Aubry AF and
Arnold ME: A sensitive method for the determination of entecavir at
picogram per milliliter level in human plasma by solid phase
extraction and high-pH LC-MS/MS. J Pharm Biomed Anal. 49:1027–1033.
2009. View Article : Google Scholar : PubMed/NCBI
|
|
11
|
Wang L, Liu Y, Liu W, et al: Establishment
of three hepatoma cell lines stably replicating wild-type,
entecavir-resistant or multidrug-resistant genotype C hepatitis B
viruses. Hepatology. 54:1082A. 2011.
|
|
12
|
Liu W, Song H, Chen Q, Xu C, Zhang W, Liu
Y, Wang B, Xu D, Lu M, Yang D and Zheng X: Multidrug resistance
protein 4 is a critical protein associated with the antiviral
efficacy of nucleos(t)ide analogues. Liver Int. 36:1284–1294. 2016.
View Article : Google Scholar : PubMed/NCBI
|
|
13
|
Livak KJ and Schmittgen TD: Analysis of
relative gene expression data using real-time quantitative PCR and
the 2(-Delta Delta C(T)) method. Methods. 25:402–408. 2001.
View Article : Google Scholar : PubMed/NCBI
|
|
14
|
Fu X, Tan D, Dou X, Chen J and Wu J: A
multi-center clinical study comparing Sansure Magb and CAP/CTM HBV
tests in the quantitative detection of HBV DNA. J Infect Dev
Ctries. 10:755–761. 2016. View Article : Google Scholar : PubMed/NCBI
|
|
15
|
U.S. Department of Health and Human
Services: Guidance for industry, . Bioanalytical method validation.
https://www.fda.gov/downloads/Drugs/Guidance/ucm070107.pdfDecember
2–2015
|
|
16
|
Hendrix CW, Chen BA, Guddera V, Hoesley C,
Justman J, Nakabiito C, Salata R, Soto-Torres L, Patterson K,
Minnis AM, et al: MTN-001: Randomized pharmacokinetic cross-over
study comparing tenofovir vaginal gel and oral tablets in vaginal
tissue and other compartments. PLoS One. 8:e550132013. View Article : Google Scholar : PubMed/NCBI
|
|
17
|
Thompson CG, Cohen MS and Kashuba AD:
Antiretroviral pharmacology in mucosal tissues. J Acquir Immune
Defic Syndr. 63 Suppl 2:S240–S247. 2013. View Article : Google Scholar : PubMed/NCBI
|
|
18
|
Delaney WE IV, Ray AS, Yang H, Qi X, Xiong
S, Zhu Y and Miller MD: Intracellular metabolism and in vitro
activity of tenofovir against hepatitis B virus. Antimicrob Agents
Chemother. 50:2471–2477. 2006. View Article : Google Scholar : PubMed/NCBI
|
|
19
|
Zhang X, Wang R, Piotrowski M, Zhang H and
Leach KL: Intracellular concentrations determine the cytotoxicity
of adefovir, cidofovir and tenofovir. Toxicol In Vitro. 29:251–258.
2015. View Article : Google Scholar : PubMed/NCBI
|
|
20
|
Trufelli H, Palma P, Famiglini G and
Cappiello A: An overview of matrix effects in liquid
chromatography-mass spectrometry. Mass Spectrom Rev. 30:491–509.
2011. View Article : Google Scholar : PubMed/NCBI
|
|
21
|
Gosetti F, Chiuminatto U, Zampieri D,
Mazzucco E, Robotti E, Calabrese G, Gennaro MC and Marengo E:
Determination of perfluorochemicals in biological, environmental
and food samples by an automated on-line solid phase extraction
ultra high performance liquid chromatography tandem mass
spectrometry method. J Chromatogr A. 1217:7864–7872. 2010.
View Article : Google Scholar : PubMed/NCBI
|
|
22
|
Challa BR, Awen BZ, Chandu BR and
Rihanaparveen S: LC-ESI-MS/MS method for the quantification of
entecavir in human plasma and its application to bioequivalence
study. J Chromatogr B Analyt Technol Biomed Life Sci. 879:769–776.
2011. View Article : Google Scholar : PubMed/NCBI
|
|
23
|
Zhao FJ, Tang H, Zhang QH, Yang J, Davey
AK and Wang JP: Salting-out homogeneous liquid-liquid extraction
approach applied in sample pre-processing for the quantitative
determination of entecavir in human plasma by LC-MS. J Chromatogr B
Analyt Technol Biomed Life Sci. 881-882:119–125. 2012. View Article : Google Scholar : PubMed/NCBI
|
|
24
|
Zacharis CK and Tzanavaras PD:
Determination of bisphosphonate active pharmaceutical ingredients
in pharmaceuticals and biological material: A review of analytical
methods. J Pharm Biomed Anal. 48:483–496. 2008. View Article : Google Scholar : PubMed/NCBI
|
|
25
|
Oeckl P and Ferger B: Simultaneous
LC-MS/MS analysis of the biomarkers cAMP and cGMP in plasma, CSF
and brain tissue. J Neurosci Methods. 203:338–343. 2012. View Article : Google Scholar : PubMed/NCBI
|
|
26
|
Losa R, Sierra MI, Gion MO, Esteban E and
Buesa JM: Simultaneous determination of gemcitabine di- and
triphosphate in human blood mononuclear and cancer cells by RP-HPLC
and UV detection. J Chromatogr B Analyt Technol Biomed Life Sci.
840:44–49. 2006. View Article : Google Scholar : PubMed/NCBI
|
|
27
|
Huang J, Bathena SP, Csanaky IL and
Alnouti Y: Simultaneous characterization of bile acids and their
sulfate metabolites in mouse liver, plasma, bile, and urine using
LC-MS/MS. J Pharm Biomed Anal. 55:1111–1119. 2011. View Article : Google Scholar : PubMed/NCBI
|
|
28
|
Bobeldijk I, Hekman M, de Vries-van der
Weij J, Coulier L, Ramaker R, Kleemann R, Kooistra T, Rubingh C,
Freidig A and Verheij E: Quantitative profiling of bile acids in
biofluids and tissues based on accurate mass high resolution
LC-FT-MS: Compound class targeting in a metabolomics workflow. J
Chromatogr B Analyt Technol Biomed Life Sci. 871:306–313. 2008.
View Article : Google Scholar : PubMed/NCBI
|
|
29
|
Schuetz JD, Connelly MC, Sun D, Paibir SG,
Flynn PM, Srinivas RV, Kumar A and Fridland A: MRP4: A previously
unidentified factor in resistance to nucleoside-based antiviral
drugs. Nat Med. 5:1048–1051. 1999. View
Article : Google Scholar : PubMed/NCBI
|
|
30
|
Rius M, Thon WF, Keppler D and Nies AT:
Prostanoid transport by multidrug resistance protein 4 (MRP4/ABCC4)
localized in tissues of the human urogenital tract. J Urol.
174:2409–2414. 2005. View Article : Google Scholar : PubMed/NCBI
|
|
31
|
Rius M, Nies AT, Hummel-Eisenbeiss J,
Jedlitschky G and Keppler D: Cotransport of reduced glutathione
with bile salts by MRP4 (ABCC4) localized to the basolateral
hepatocyte membrane. Hepatology. 38:374–384. 2003. View Article : Google Scholar : PubMed/NCBI
|
|
32
|
Sauna ZE, Nandigama K and Ambudkar SV:
Multidrug resistance protein 4 (ABCC4)-mediated ATP hydrolysis:
Effect of transport substrates and characterization of the
post-hydrolysis transition state. J Biol Chem. 279:48855–48864.
2004. View Article : Google Scholar : PubMed/NCBI
|
|
33
|
Zelcer N, Reid G, Wielinga P, Kuil A, van
der Heijden I, Schuetz JD and Borst P: Steroid and bile acid
conjugates are substrates of human multidrug-resistance protein
(MRP) 4 (ATP-binding cassette C4). Biochem J. 371:361–367. 2003.
View Article : Google Scholar : PubMed/NCBI
|