Introduction
Breast cancer (BC) is one of the most common types
of cancer in women worldwide and its incidence is increasing,
particularly in developed countries (1–3).
Women are typically screened for BC with mammography and
traditional tumor markers, including carcinoembryonic antigen and
carcinoma antigen 15-3 (4).
However, the diagnostic power of these methods is limited, due to
low sensitivity and specificity (5,6). BC
treatment commonly includes surgical resection and hormone therapy,
radiotherapy or chemotherapy. However, BC remains highly prevalent
and malignant due to recurrence and metastasis. Therefore, there is
an urgent need to develop novel diagnostic strategies and
therapeutic agents to improve the prognosis of patients with
BC.
The molecular mechanisms of BC tumorigenesis and
progression remain unclear. It is therefore critical to identify
new genes and pathways that are associated with BC tumorigenesis
and patient prognosis, which may not only help to elucidate the
underlying molecular mechanisms involved, but also to discover
novel diagnostic markers and therapeutic targets. Microarrays can
rapidly detect gene expression on a global basis and are
particularly useful in screening for differentially expressed genes
(DEGs) (7). Gene chips are a form
of microarray which allow the investigation of gene expression in a
high throughput manner with high sensitivity, specificity and
repeatability. A significant amount of data has been produced via
the use of microarrays and the majority of such data has been
uploaded and stored in public databases. Previous studies
concerning BC gene expression profiling have identified hundreds of
DEGs (8–10). However, the comparative analysis of
DEGs across a range of independent studies may yield only a
relatively limited amount of useful data with regard to
carcinogenesis. The disadvantages of these single studies may be
overcome by combining microarray technology and bioinformatics
analysis, as this approach would make it possible to analyze the
associated pathways and interaction networks associated with the
identified DEGs. This information may aid in elucidating the
molecular mechanisms underlying BC.
In the present study, five profiling microarray
datasets were downloaded from the Gene Expression Omnibus (GEO):
GSE22035, GSE3744, GSE5764, GSE21422 and GSE26910. DEGs were
identified in tumor tissues relative to adjacent non-cancerous
tissues in patients with BC. Additionally, gene ontology (GO),
Kyoto Encyclopedia of Genes and Genomes (KEGG) analysis was
performed and protein-protein interaction (PPI) networks were
constructed to identify the hub genes in BC. Collectively, the
findings of the present study highlighted key genes and pathways
that may contribute to the pathology of BC. These may provide a
basis for the development of future diagnostic and therapeutic
tools for BC.
Materials and methods
Microarray data
GSE22035 (11),
GSE3744 (12), GSE5764 (13), GSE21422 (14) and GSE26910 (15) profile datasets were downloaded from
the GEO database (http://www.ncbi.nlm.nih.gov/geo/) and based on a
GeneChip Human Genome U133 Plus 2.0 Array platform (Affymetrix;
Thermo Fisher Scientific, Inc., Waltham, MA, USA). The datasets
contained 151 tissue samples, including 88 invasive ductal
carcinoma tissues, 23 invasive lobular carcinoma tissues, five
ductal carcinoma in situ tissues and 38 adjacent
non-tumorous tissues.
Expression analysis of DEGs
Raw data were converted into an expression matrix,
which was subsequently normalized with the robust multi-array
average algorithm (16) in the
affy package (version 3.4.1) in R (17). Inter-batch difference was rectified
using the ComBat function in the sva R package (18). The t-test method in the limma
(19) R package was subsequently
used to identify DEGs between the tumor tissues and adjacent
non-tumorous tissue samples. A |log2-fold change|>1 and
P<0.05 were considered as the threshold values for DEG
identification.
GO and pathway enrichment
analysis
The Database for Annotation Visualization and
Integrated Discovery (DAVID) (20)
is a tool which provides a comprehensive set of functional
annotation tools for researchers to investigate the biological
meaning of genes. Identified DEGs were investigated further using
DAVID (version 6.7), GO (21) and
KEGG (22) pathway enrichment
analyses. P<0.05 and gene counts of >5 were considered to
indicate a statistically significant difference in the functional
enrichment analysis.
Integration of the PPI network
Identified DEGs were mapped into the online Search
Tool for the Retrieval of Interacting Genes (STRING; 2017 release)
database (23) to evaluate the
interactive relationships among the DEGs. Interactions with a
combined score >0.4 were defined as statistically significant.
Cytoscape software (version 3.5.1) (24) was used to visualize the integrated
regulatory networks. The Cytoscape plugin Molecular Complex
Detection (MCODE; version 1.31) was used to further detect deeper
connected regions within the PPI network (25). According to the degree levels in
the Cytoscape plugin cytoHubba (version 0.1), the top five ranked
genes were defined as hub genes.
Results
The identification of DEGs in BC
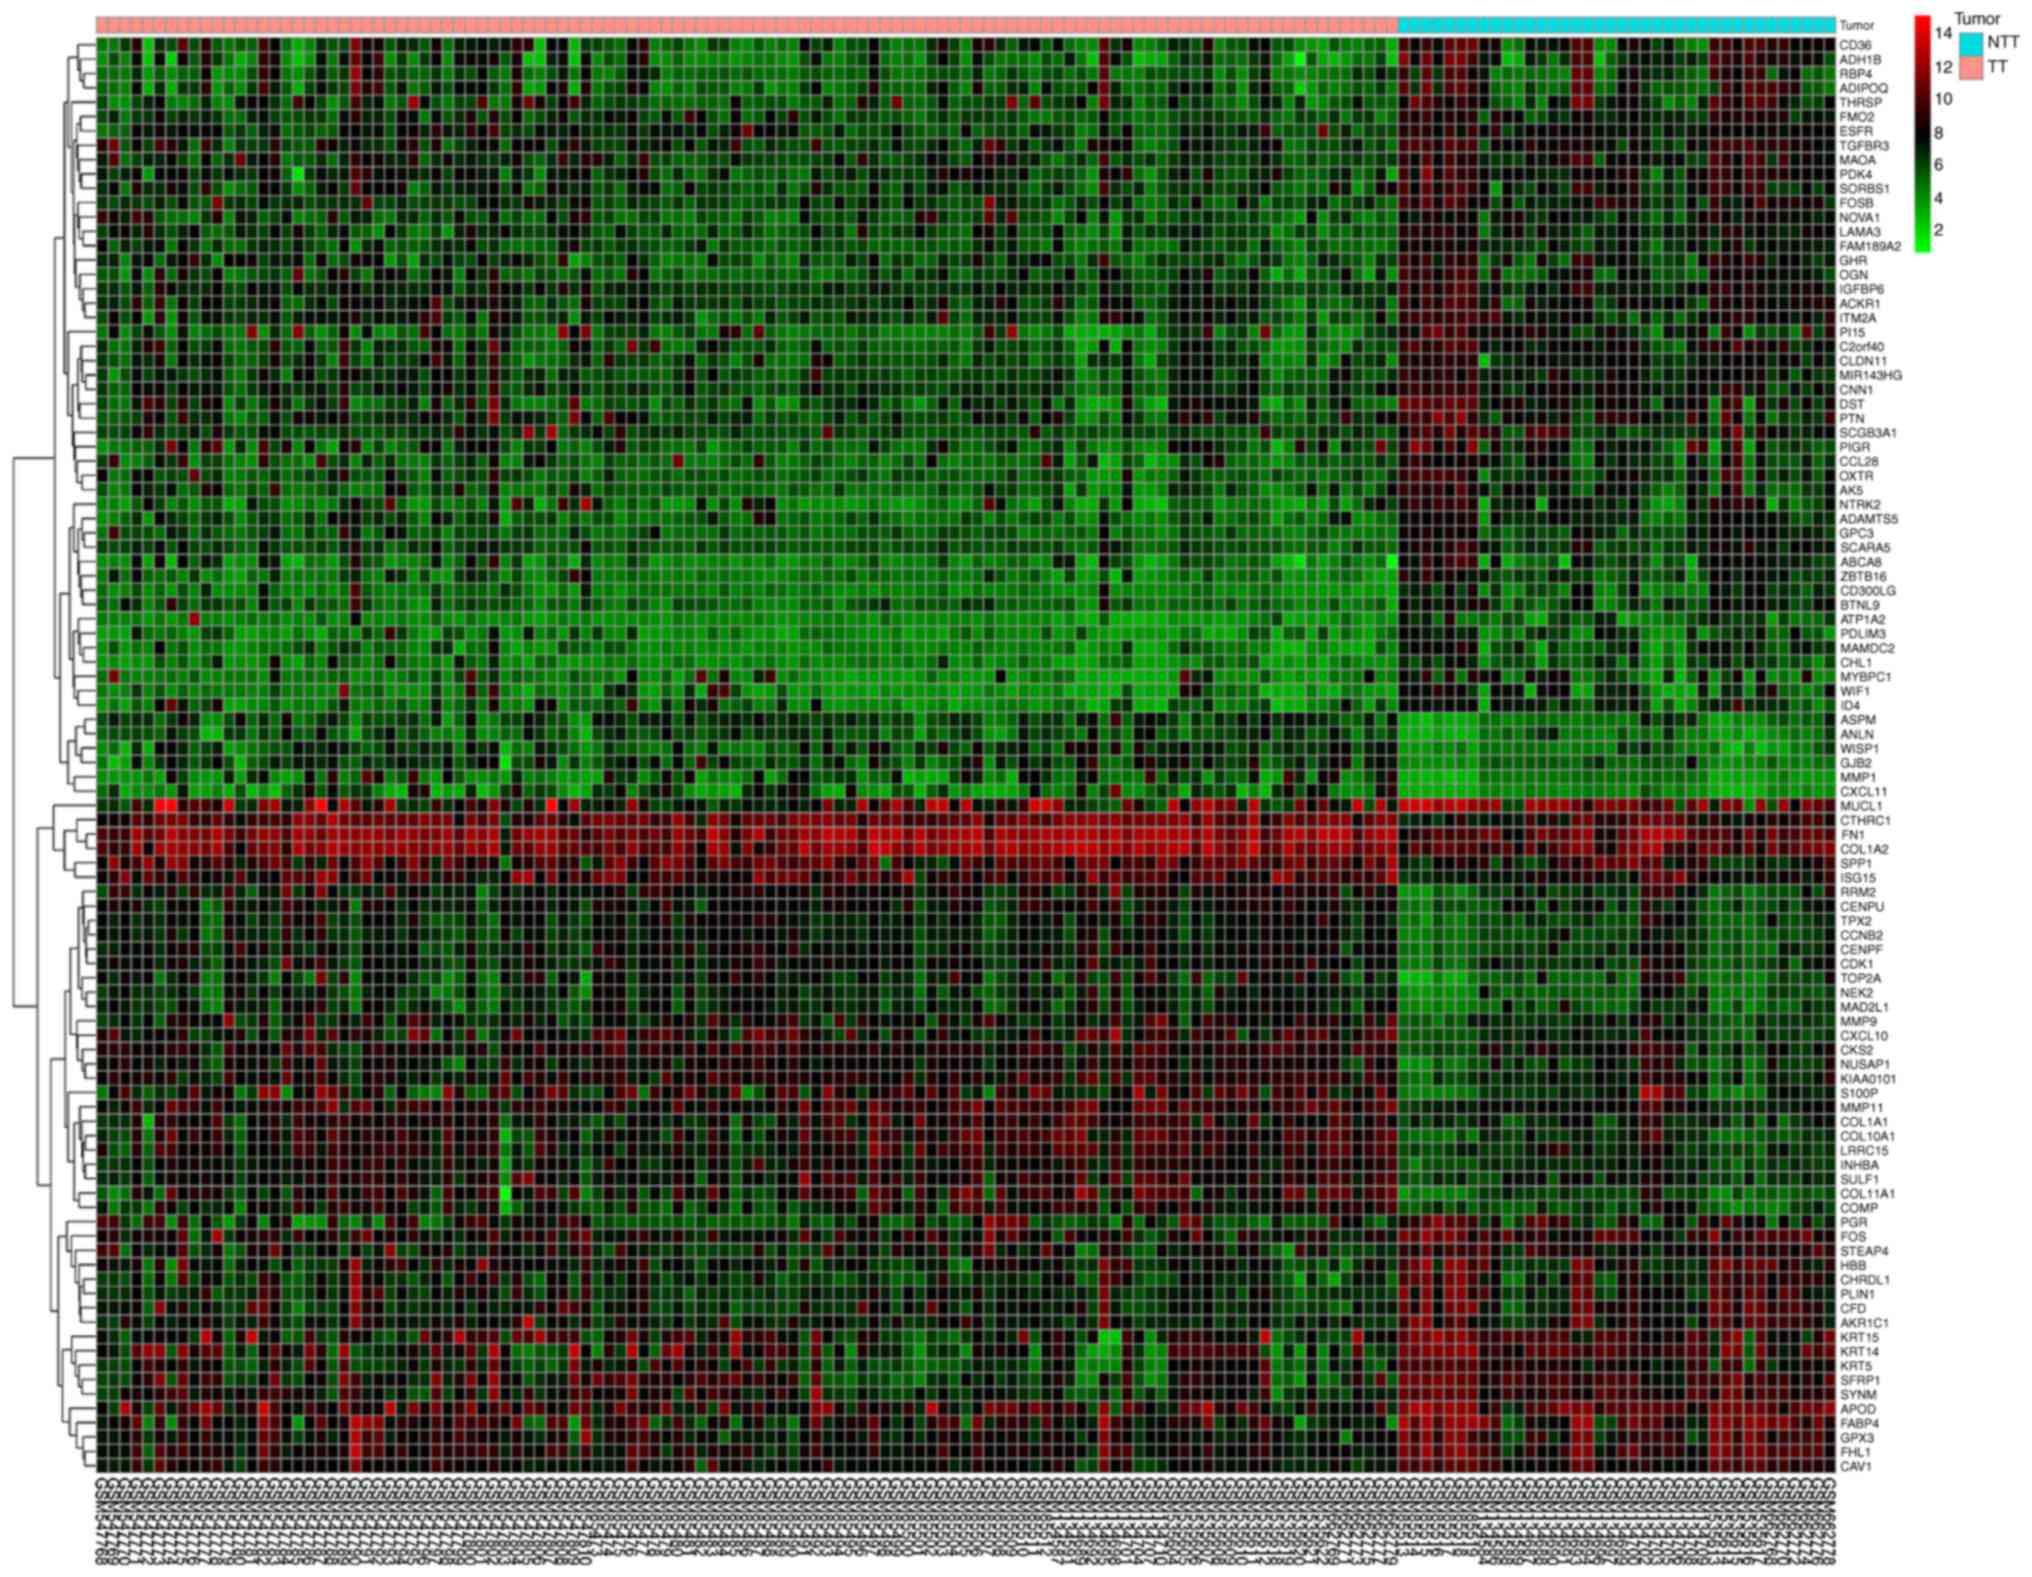
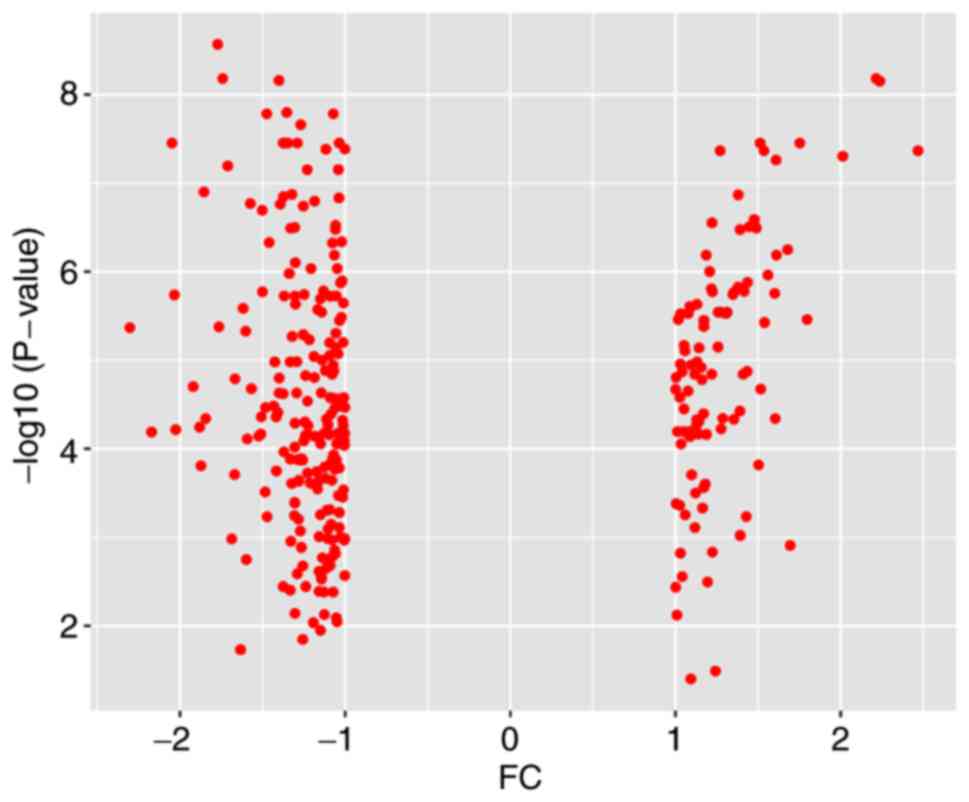
Database analysis (Table I) identified a total of 227 DEGs,
including 82 upregulated genes and 145 downregulated genes. An
expression heat map (Fig. 1) and a
volcano plot (Fig. 2) for the
identified DEGs was constructed.
 | Table I.Compared with adjacent non-tumorous
tissues, 227 DEGs were identified from the datasets analyzed, 82 of
which were upregulated genes and 145 which were downregulated genes
in breast cancer tissues. |
Table I.
Compared with adjacent non-tumorous
tissues, 227 DEGs were identified from the datasets analyzed, 82 of
which were upregulated genes and 145 which were downregulated genes
in breast cancer tissues.
| DEGs | Genes |
|---|
| Upregulated | DLGAP5, APOBEC3B,
RAD51AP1, ASPN, BIRC5, LMNB1, NDC80, BGN, KIF4A, GINS1, RACGAP1,
IFI6, EZH2, KIF20A, CMPK2, CCNB1, UHRF1, SQLE, VCAN, UBE2C, PTTG1,
PPAPDC1A, BUB1, COL5A2, TYMS, RSAD2, FNDC1, DTL, CCNE2, BUB1B,
ECT2, CXCR4, UBE2T, CDKN3, ADAMDEC1, PBK, LYZ, MELK, FAM83D, POSTN,
STAT1, CXCL9, ZWINT, CEP55, PRR11, HMMR, PRC1, CEACAM6, CKS2, CDK1,
CCNB2, TPX2, MMP9, COL1A2, ANLN, CENPU, MAD2L1, ISG15, CENPF,
COL1A1, NEK2, CXCL11, SULF1, MMP1, GJB2, FN1, MMP11, ASPM, SPP1,
INHBA, COMP, KIAA0101, WISP1, LRRC15, TOP2A, NUSAP1, RRM2, S100P,
CTHRC1, CXCL10, COL10A1, COL11A1 |
| Downregulated | ADH1B, KRT14,
C2orf40, DST, SFRP1, CD36, PI15, SYNM, NTRK2, ZBTB16, ABCA8,
MAMDC2, OXTR, FABP4, MUCL1, PDK4, TGFBR3, KRT15, WIF1, FOSB, CFD
KRT5, CHRDL1, FMO2, GPC3, APOD, ADAMTS5, PLIN1, MAOA, SCGB3A1, ID4,
AK5, FHL1, CD300LG, THRSP, CLDN11, CAV1, SORBS1, LAMA3, SCARA5,
FAM189A2, MIR143HG, PIGR, ACKR1, GHR, ATP1A2, RBP4, PDLIM3, CCL28,
CHL1, FOS, STEAP4, BTNL9, AKR1C1, ADIPOQ, EGFR, MYBPC1, IGFBP6,
ITM2A, OGN, GPX3, NOVA1, PGR, HBB, EGR1, MYH11, TF, LIFR, CXCL12,
KIT, ACACB, CXCL14, SYNPO2, DMD, TFPI2, KLHL13, SRPX, SEMA3G, LEP,
ENPP2, HOXA5, AKR1C3, RHOJ, ACTG2, SDPR, MIR205HG, ANXA3, LPL,
ATF3, KLF4, PAMR1, TMTC1, SEMA6D, CRYAB MEOX1, HLF, ANPEP, LYVE1,
ADIRF, WLS, SOCS2, ALDH1A1, AQP1, PLIN4, SPRY2, THRB, G0S2, TSHZ2,
TM4SF18, ITIH5, EFEMP1, CAV2, CX3CL1, TCEAL7, EGR3, SCN4B, PPL,
C16orf89, EBF1, MAOB, ANXA1, MME, ANK2, ABCA6, CXCL2, IRX1,
MIR100HG, LMOD1, NDRG2, NFIB, SAMD5, AOC3, NR3C2, LHFP, COL6A6,
CITED1, CDO1, BOC, TIMP4, INHBB, GSN |
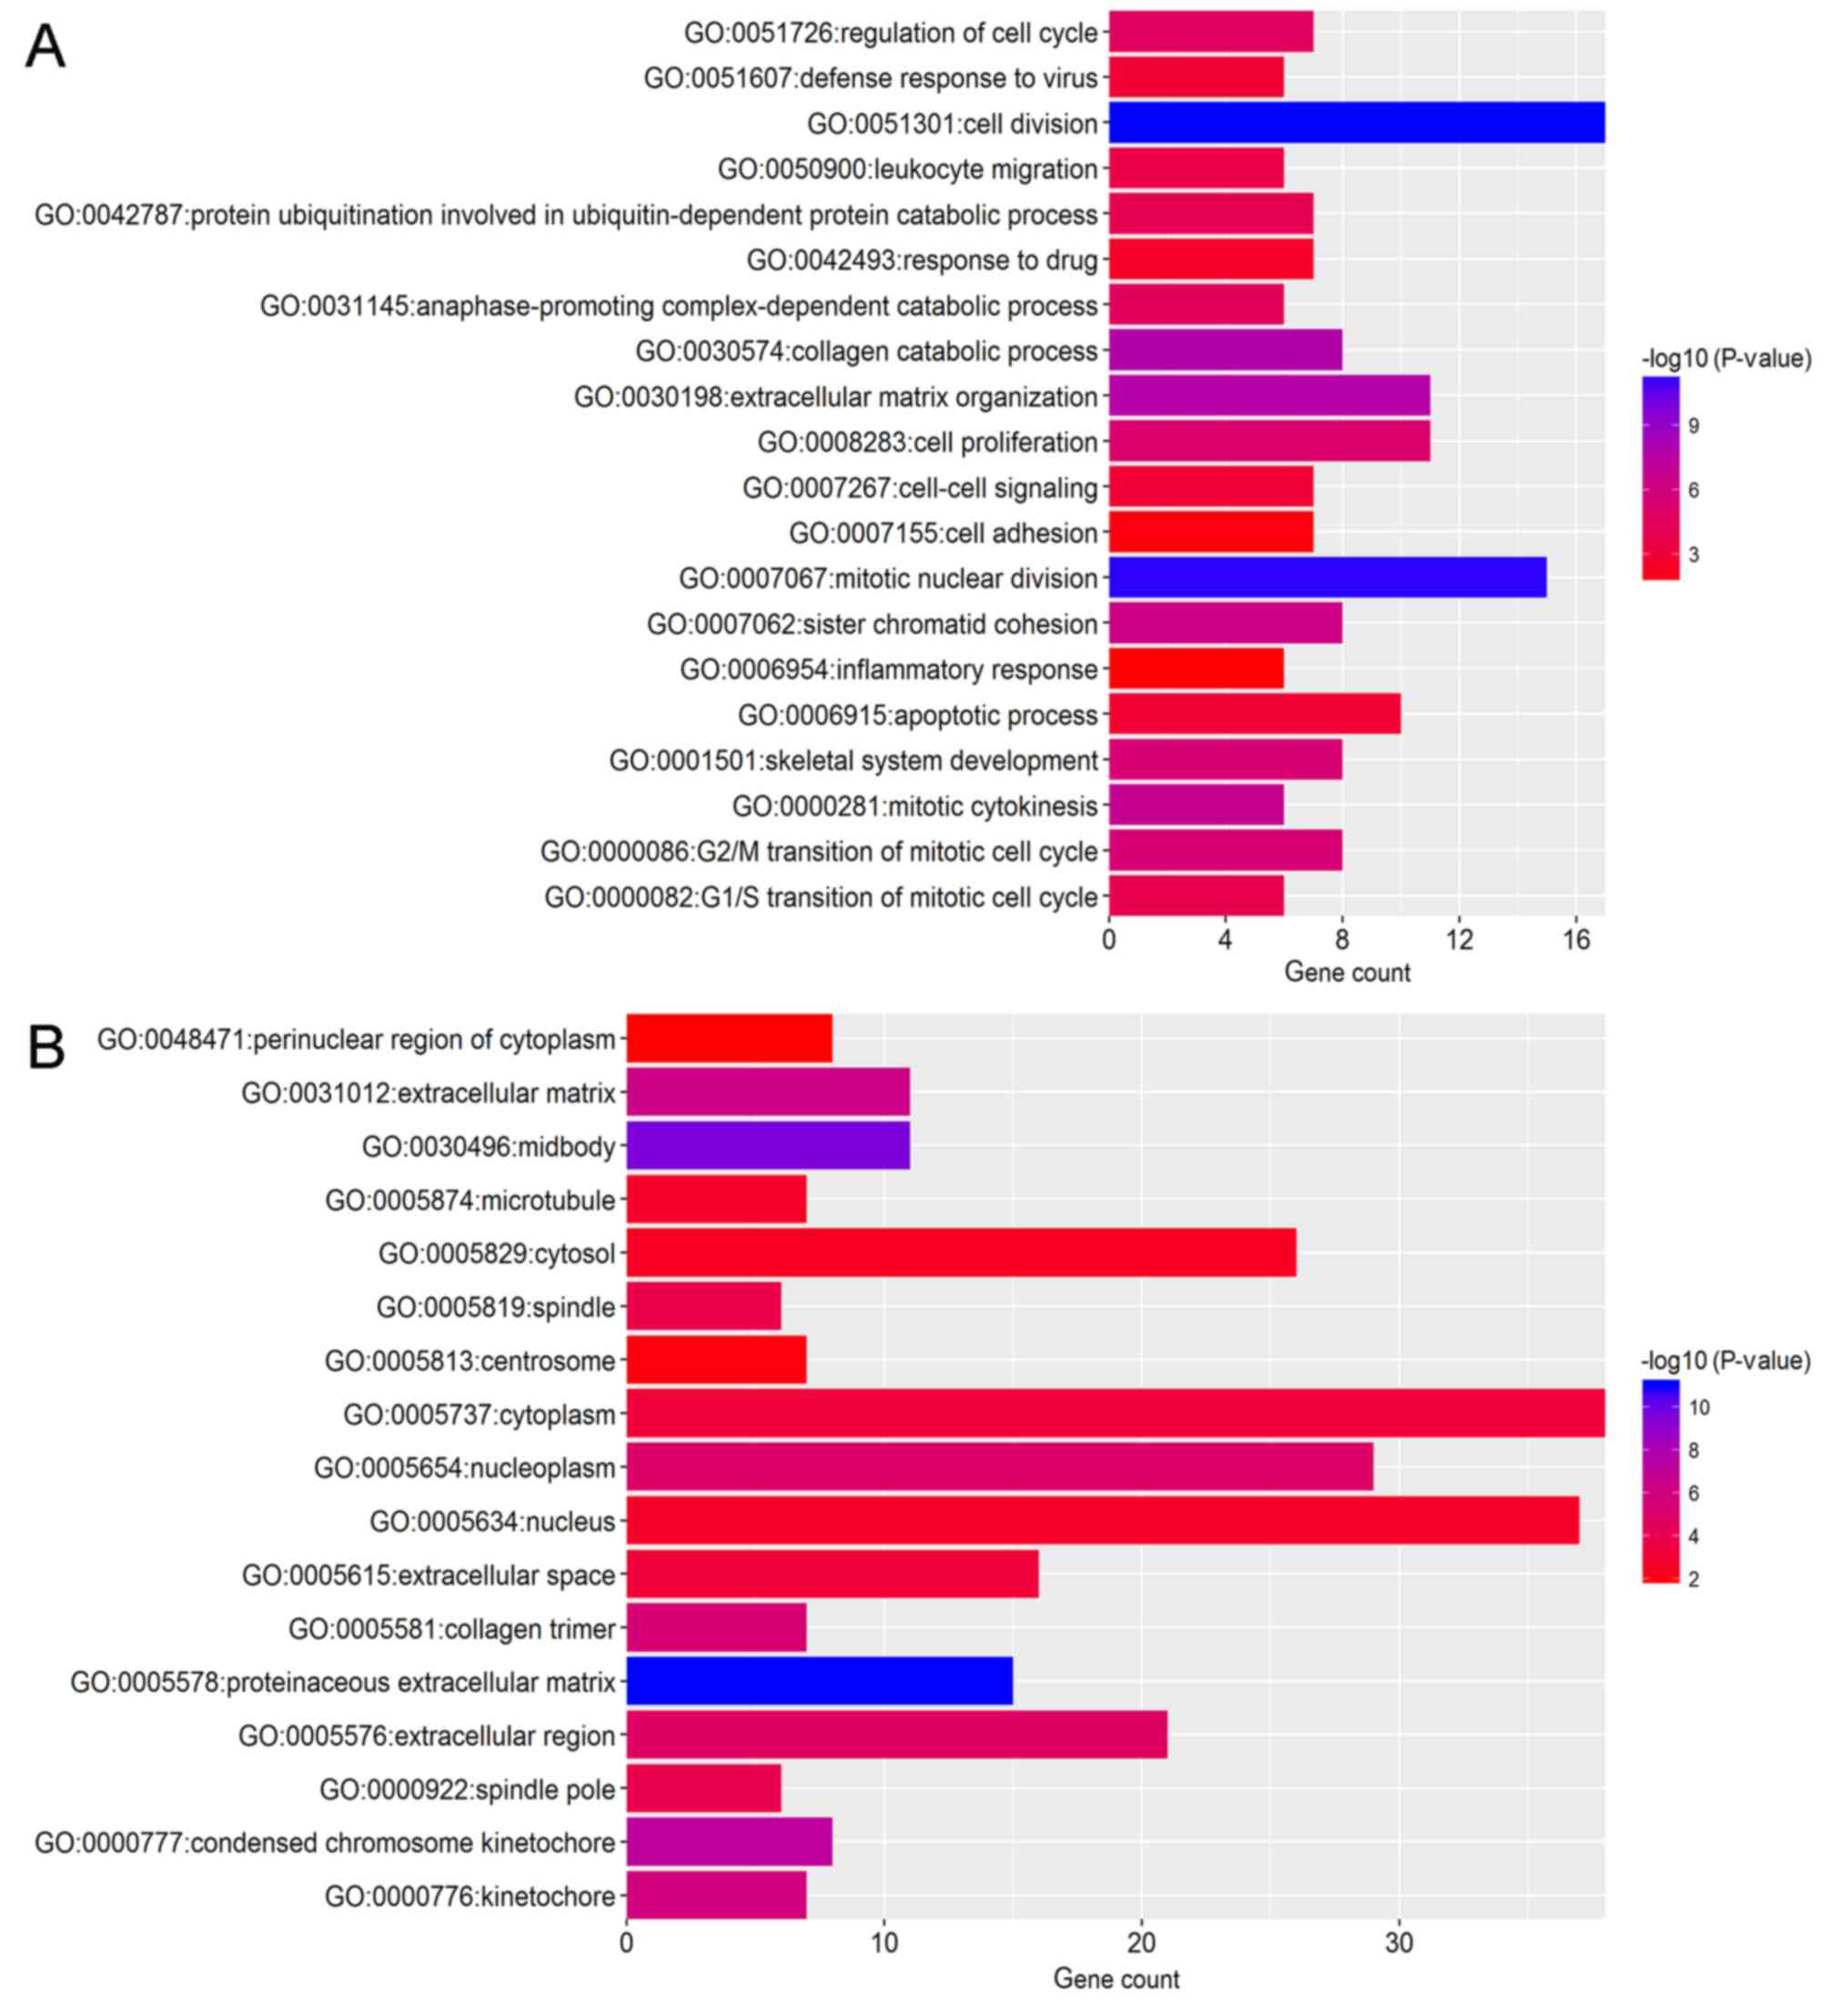
Functional enrichment analysis
To identify the pathways which had the most
significant involvement with the genes identified, upregulated
(Fig. 3) and downregulated
(Fig. 4) DEGs were submitted into
DAVID for GO and KEGG pathway analysis. GO analysis revealed that
in biological process terms, the upregulated DEGs were mainly
enriched in ‘cell division’, ‘mitotic nuclear division’ and
‘collagen catabolic process’ (Fig.
3A). Downregulated DEGs were mainly enriched in ‘response to
drug’, ‘response to estradiol’ and ‘negative regulation of the
extracellular signal-regulated kinase (ERK)1 and ERK2 cascade’
(Fig. 4A). In cell component
terms, upregulated DEGs were mainly enriched in ‘proteinaceous
extracellular matrix (ECM)’, ‘mid-body’ and ‘condensed chromosome
kinetochores’ (Fig. 3B), whereas
downregulated DEGs were mainly enriched in ‘extracellular space’,
‘extracellular exosomes’ and the ‘extracellular region’ (Fig. 4B). In molecular function terms,
upregulated DEGs were mainly enriched in ‘ECM structural
constituents’, ‘protein binding’ and ‘microtubule binding’
(Fig. 3C), whereas downregulated
DEGs were mainly enriched in ‘transcriptional activator activity’,
‘structural constituents of the cytoskeleton’ and ‘protein
homo-dimerization activity’ (Fig.
4C).
KEGG pathway analysis demonstrated that upregulated
DEGs were significantly enriched in ‘ECM-receptor interaction’,
‘cell cycle’, ‘focal adhesion’ and ‘phosphatidylinositol 3
kinase-protein kinase B (PI3K-Akt) signaling pathway’ and ‘pathways
in cancer’ (Fig. 3D).
Downregulated DEGs were significantly enriched in the ‘peroxisome
proliferator-activated receptor (PPAR) signaling pathway’ and
‘cytokine-cytokine receptor interaction’ (Fig. 4D).
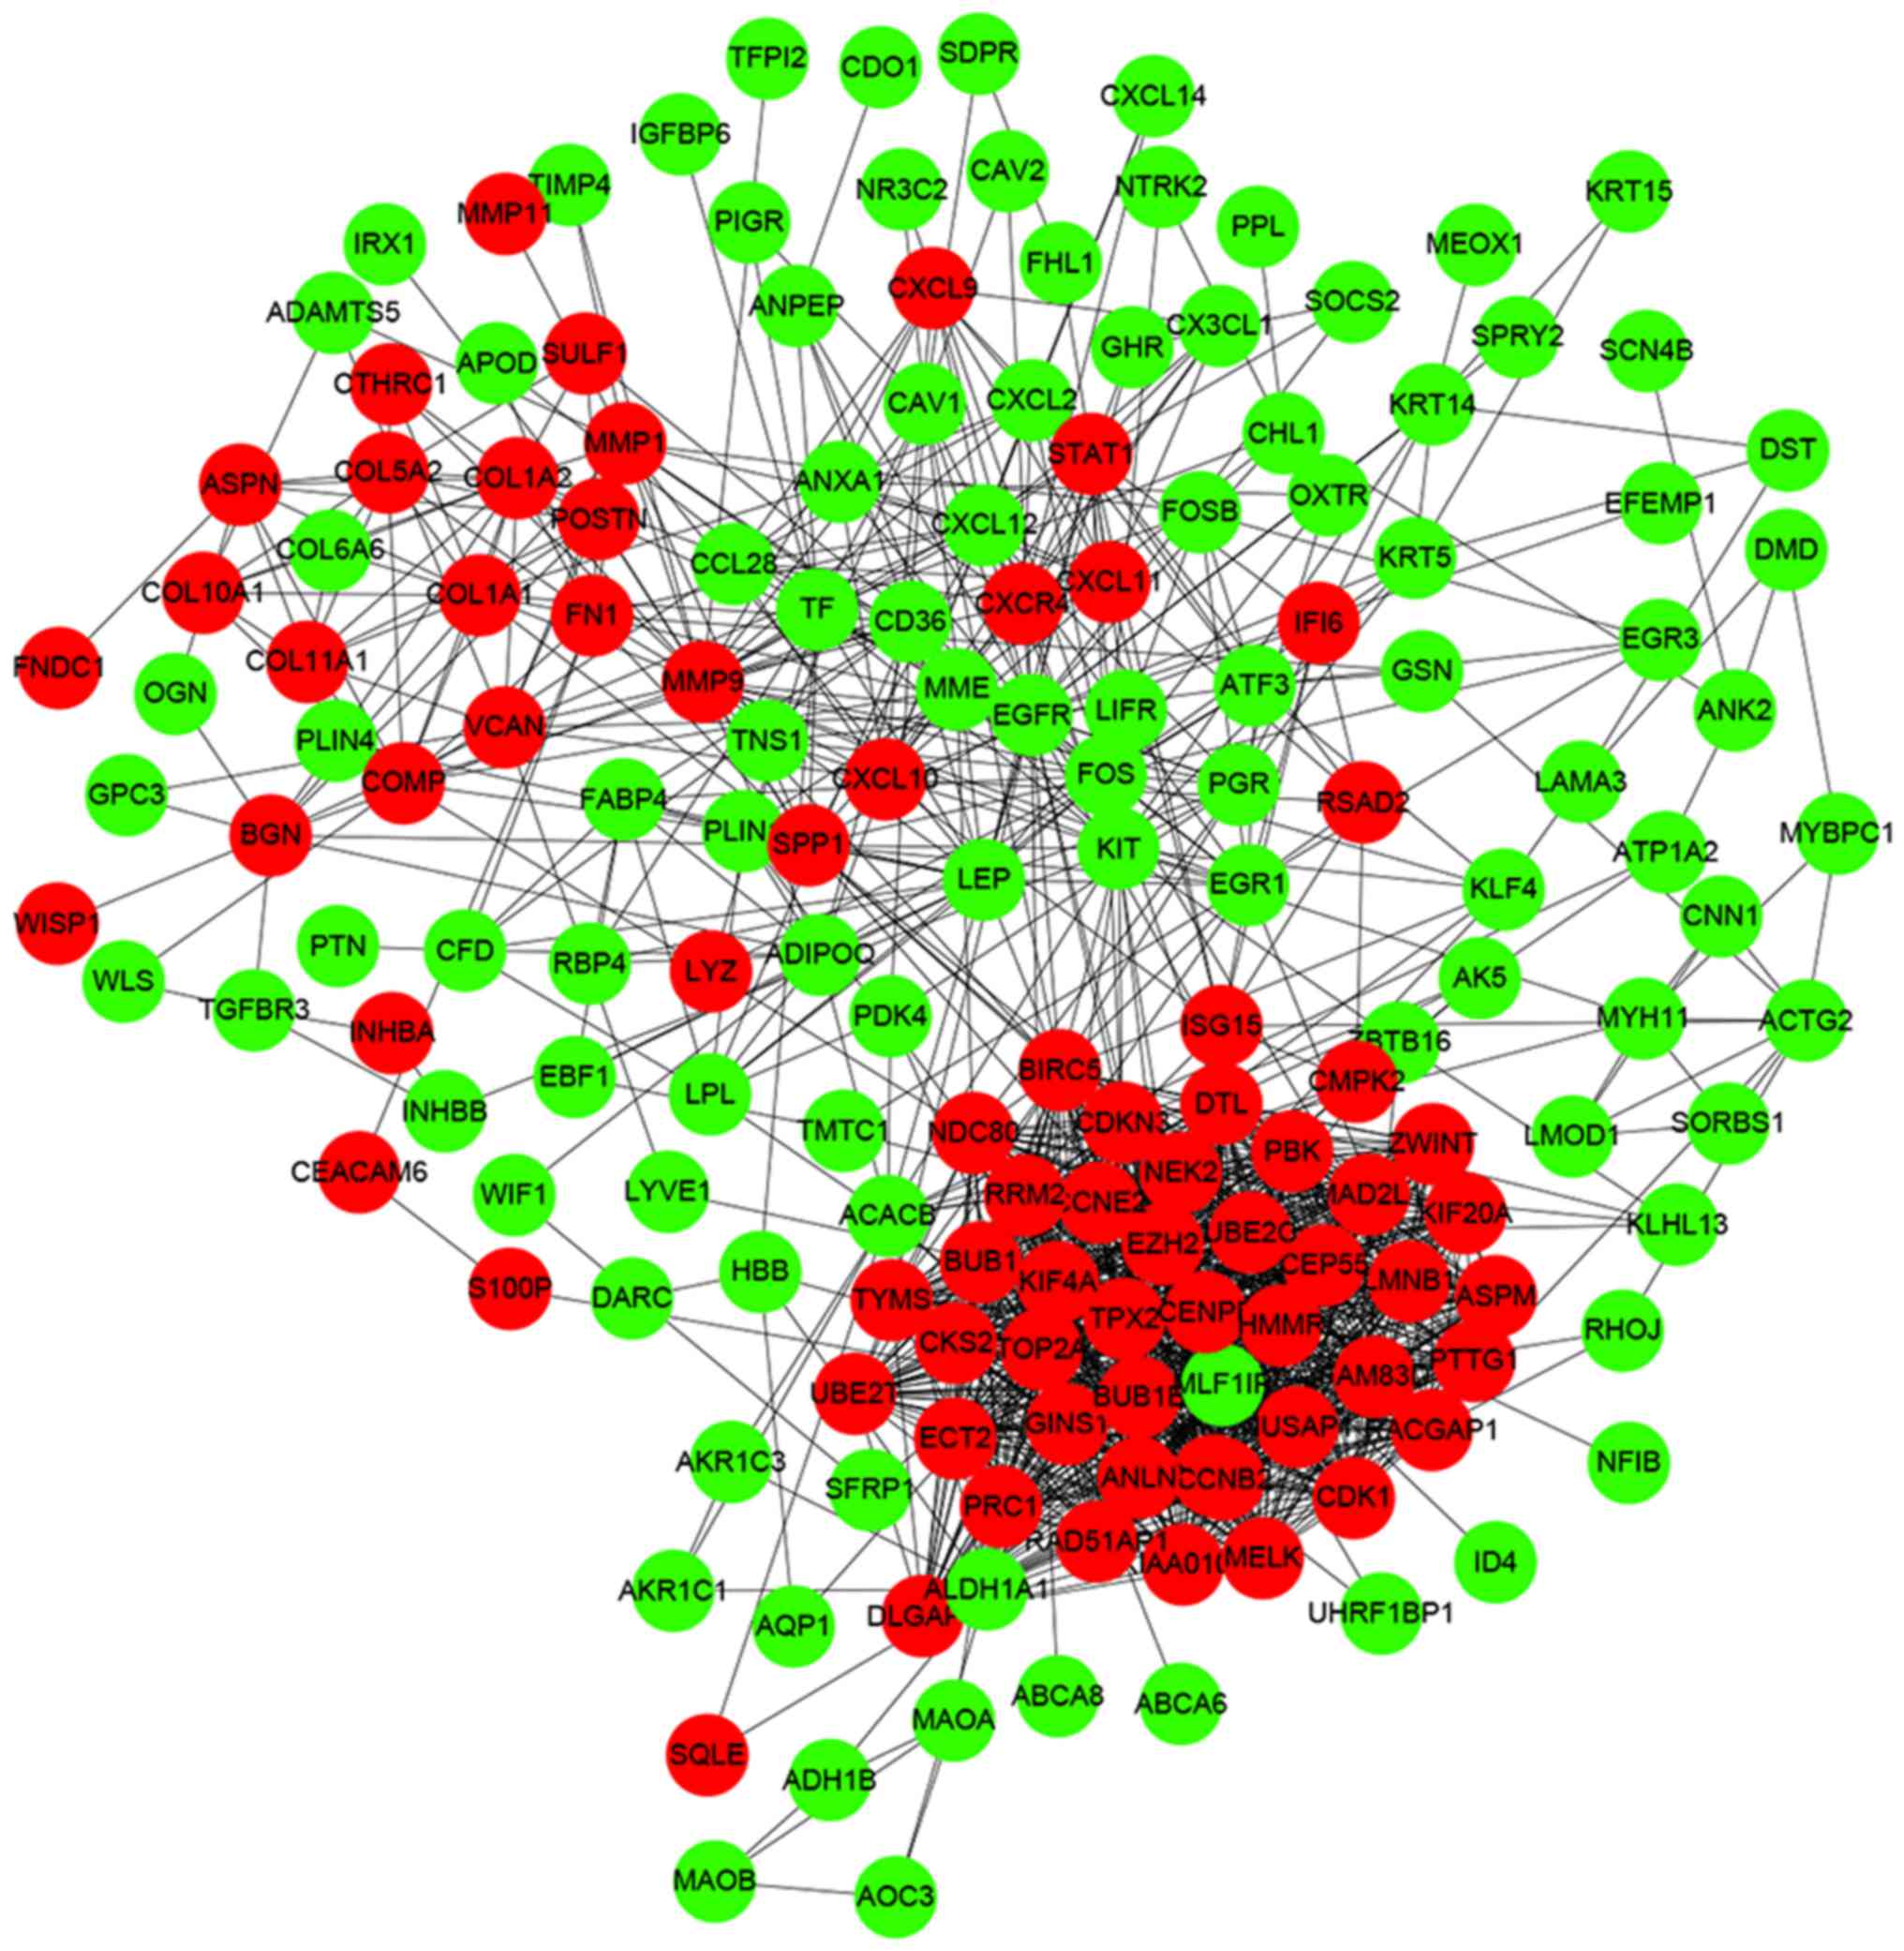
PPI network construction and module
analysis
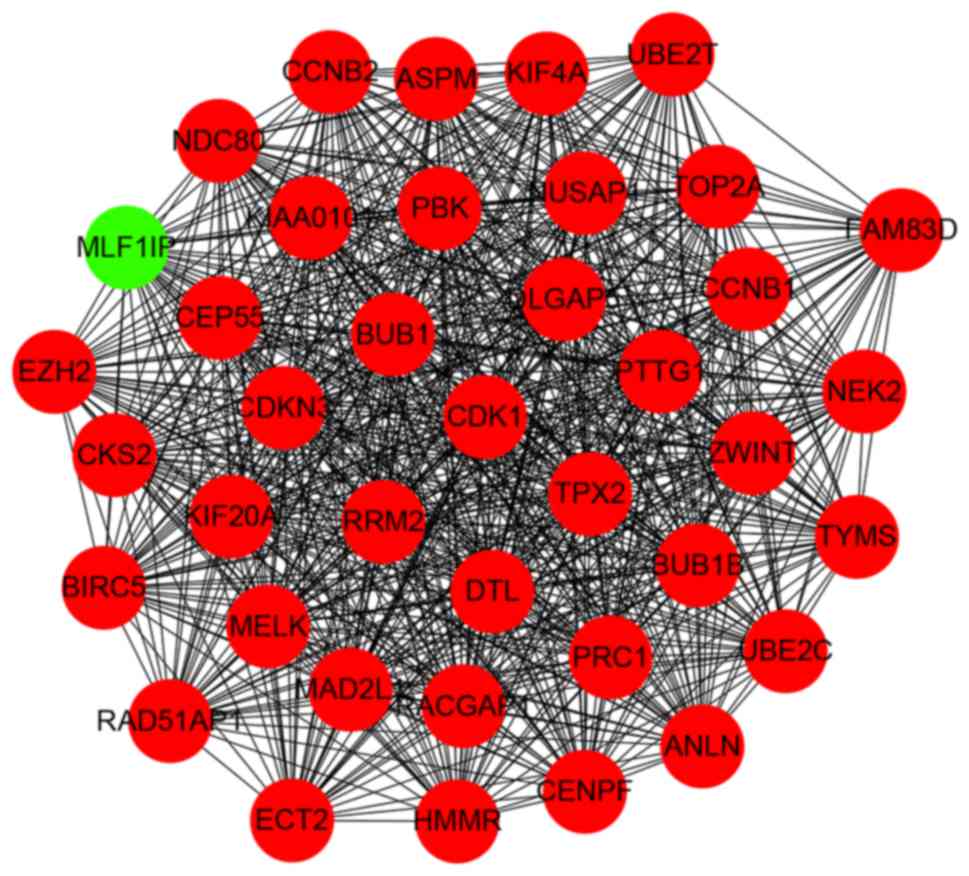
Interactions between the identified DEGs were
revealed by constructing a PPI network. In total, there were 174
nodes and 1,257 edges in the network (Fig. 5). According to degree levels, the
top five hub nodes were: DNA topoisomerase 2-α (TOP2A; degree, 53),
baculoviral inhibitor of apoptosis repeat-containing protein 5
(BIRC5; degree, 49), cyclin-dependent kinase 1 (CDK1; degree, 45),
G2/mitotic-specific cyclin-B1 (CCNB1; degree, 44) and kinetochore
protein NDC80 homolog (NDC80; degree, 44). A significant module was
subsequently constructed with 39 nodes and 728 edges, which gained
the highest MCODE score (Fig. 6).
Subsequent functional enrichment analysis revealed that the genes
in this module were mainly enriched in ‘mitotic nuclear division’,
‘cell division’, ‘nucleus’, ‘cytoplasm’, ‘protein binding’, ‘ATP
binding’ and ‘cell cycle’ (Table
II).
| Table II.Pathway enrichment analysis of gene
function within the identified module. |
Table II.
Pathway enrichment analysis of gene
function within the identified module.
| Category | GO ID | Term | Count |
|---|
| BP | GO:0007067 | Mitotic nuclear
division | 15 |
| BP | GO:0051301 | Cell division | 16 |
| BP | GO:0000281 | Mitotic
cytokinesis | 6 |
| BP | GO:0000086 | G2/M transition of
mitotic cell cycle | 8 |
| BP | GO:0008283 | Cell
proliferation | 10 |
| BP | GO:0007062 | Sister chromatid
cohesion | 7 |
| BP | GO:0031145 | Anaphase-promoting
complex-dependent catabolic process | 6 |
| BP | GO:0042787 | Protein
ubiquitination involved in ubiquitin-dependent Protein catabolic
process | 6 |
| BP | GO:0006915 | Apoptotic
process | 6 |
| CC | GO:0030496 | Midbody | 11 |
| CC | GO:0000776 | Kinetochore | 7 |
| CC | GO:0000777 | Condensed
chromosome kinetochore | 7 |
| CC | GO:0005654 | Nucleoplasm | 21 |
| CC | GO:0005634 | Nucleus | 28 |
| CC | GO:0005829 | Cytosol | 21 |
| CC | GO:0005737 | Cytoplasm | 26 |
| CC | GO:0000922 | Spindle pole | 6 |
| CC | GO:0005819 | Spindle | 6 |
| CC | GO:0005874 | Microtubule | 7 |
| CC | GO:0005813 | Centrosome | 7 |
| MF | GO:0005515 | Protein
binding | 34 |
| MF | GO:0008017 | Microtubule
binding | 7 |
| MF | GO:0019901 | Protein kinase
binding | 7 |
| MF | GO:0003682 | Chromatin
binding | 7 |
| MF | GO:0005524 | ATP binding | 12 |
| MF | GO:0004672 | Protein kinase
activity | 6 |
| MF | GO:0004674 | Protein
serine/threonine kinase activity | 6 |
| MF | GO:0042803 | Protein
homodimerization activity | 6 |
| KEGG | hsa04110 | Cell cycle | 7 |
Discussion
BC is a malignant tumor that can be caused by
various factors, including genetics, the endocrine system and the
environment (26,27). It is critical to understand the
molecular mechanisms underlying BC in order to identify and develop
more effective diagnostic and therapeutic strategies. Microarray
and high throughput sequencing are widely used to detect the
expression levels of thousands of genes within the human genome and
may aid in the identification of target genes of interest for
diagnosing or treating BC (28,29).
In the present study, five gene profile datasets
were obtained from GEO and bioinformatics analysis was performed,
resulting in identification of 227 genes which were differentially
expressed between BC and normal controls. Functional enrichment
analysis revealed that upregulated genes were mainly enriched in
‘cell division’, ‘proteinaceous ECM’, ‘ECM structural constituents’
and ‘ECM-receptor interaction’, whereas downregulated genes were
mainly enriched in ‘response to drugs’, ‘extracellular space’,
‘transcriptional activator activity’ and the ‘PPAR signaling
pathway’. A PPI network was constructed for the identified DEGs and
key genes were defined by the degree rank. The most significant
module was subsequently extracted from the PPI network.
Previous research involving multiple cohort studies
tend to have a lower false-positive and false-negative rate than
single cohort studies (30).
However, multiple microarrays from different platforms may mask and
confound true biological differences because of the batch effects
(31). In order to increase the
credibility of DEG identification, five microarray datasets from
the same platform were selected and a ComBat function was used to
eliminate batch effect in the present study. A total of 227 genes
were identified which were differentially expressed between tumor
tissues and the adjacent non-tumorous tissues, including 82
upregulated genes and 145 downregulated genes. It has been
demonstrated that there is a co-expression association between a
group of genes with similar expression profiles and these often
participate in parallel biological processes (32). Therefore, it is necessary to
perform functional enrichment analysis in order to understand the
interactions between DEGs and the associated biological
processes.
The upregulated genes identified in the present
study were mainly enriched in pathways of ‘cell division’,
‘proteinaceous ECM’, ‘ECM structural constituents’ and
‘ECM-receptor interaction’. This is consistent with the fact that
the ECM is an important component in the mammary gland
microenvironment and that ECM proteins have been demonstrated to
accelerate BC tumor progression and metastasis (33–36).
Furthermore, previous studies have indicated that the gene
expression signatures of the BC stroma, which includes ECM
proteins, can better predict patient outcome than the tumorous
epithelium (15,37,38).
The downregulated DEGs identified in the present
study were associated with ‘response to drugs’, ‘extracellular
space’, ‘transcriptional activator activity’ and the ‘PPAR
signaling pathway’. PPARs are members of the nuclear hormone
receptor superfamily and function in proliferation,
differentiation, inflammation and glucose and lipid balance
(39). Evidence suggests that
PPARg ligands may be regarded as antitumor factors in humans due to
their involvement in apoptosis and cell growth inhibition in
several malignant tumor cell types, including colon adenocarcinoma,
hepatocellular carcinoma and breast cancer (40). PPARg has also emerged as a
potential target for cancer therapy as it has high tumor
specificity (41). It has been
demonstrated that PPARg inhibits the invasion and metastasis of
human BC cells (42). Furthermore,
evidence has indicated that PPARg expression and signaling in
mammary secretory epithelial cells has a protective role against
breast tumorigenesis (43).
By constructing a PPI network, TOP2A, BIRC5, CDK1,
CCNB1 and NDC80 were identified to have higher degrees of
connectivity within the network and were therefore classified as
the hub genes in the present study. Additionally, module analysis
of the PPI network revealed that BC development was associated with
‘mitotic nuclear division’, ‘mid-body’, ‘protein binding’ and ‘cell
cycle’.
TOP2A is an enzyme that generates transient
double-stranded breaks in the topological structure of DNA
(44). In a previous report,
Milde-Langosch et al (45)
reported that TOP2A expression may be regarded as an indicator of
susceptibility to anthracycline neoadjuvant therapy in BC.
Additionally, Şahin et al (46) demonstrated that the overexpression
of TOP2A is associated with poor prognosis in patients with BC.
BIRC5 is a member of the inhibitor of apoptosis gene
family and is located on chromosome 17q25 (47). BIRC5 is involved in cell cycle
checkpoint progression and is overexpressed in breast carcinomas;
the degree of overexpression correlates with poor patient outcome
(48,49). Consequently, the BIRC5 gene is a
potential marker for the detection and prognosis of cancer at an
early age (50).
CDK1 is a conserved serine/threonine kinase that
controls cell cycle progression and is essential for driving the
cell cycle (51). A previous study
reported that CDK1 is overexpressed in BC (52). Additionally, CDK1 degradation may
be mediated by sequestosome-1-histone deacetylase 6-dependent
autophagy and the aggresome pathway in BC (53). Consequently, it has been reported
that the levels of CDK1 clearance may be a predictive biomarker for
the efficacy of BC chemotherapy (53).
CCNB1 is a highly conserved member of the cyclin
family that is expressed in almost all tissues of the human body
(54). CCNB1 is a key initiator of
mitosis through regulation of CDK1, which is responsible for
initiating progression from the G2 phase to mitosis (55). Other research has revealed that
CCNB1 is expressed in many types of cancer, suggesting that it may
also function in cancer transformation and progression (56). Ding et al (57) demonstrated that CCNB1 expression
may be used to monitor hormone therapy efficacy and this may aid in
the development of personalized therapies for patients with
estrogen receptor+ BC.
NDC80 is a nuclear protein rich in coiled-coil
motifs which was first discovered by Durfee et al (58) by combining the C-terminus of the
retinoblastoma protein and using yeast two-hybrid technology to
screen a B-lymphocyte complementary DNA library. NDC80 is a
kinetochore outer layer component and spindle checkpoint regulator
that is involved in chromosome segregation via overactivation of
the mitotic checkpoint (59).
Furthermore, it has been reported that NDC80 overexpression may
participate in tumor formation by activating the mitotic checkpoint
and is associated with poor clinical prognosis in patients with BC
(60,61).
In conclusion, the present study identified
candidate genes and pathways which may be involved in BC
progression through the integrated analysis of multiple cohort
profile datasets. These results may contribute to a better
understanding of the molecular mechanisms which underlie BC and
provide a series of potential biomarkers. However, further
experiments are required to verify the findings of the present
study. Additionally, the majority of included studies focused on
how a single key gene and pathway contribute to the development of
tumor in breast cancer, with limited research concerning the
interaction of multi-genes and multi-pathways. Therefore, further
experiments with additional patient cohorts are also required to
confirm the results of this study. In vivo and in
vitro investigation of gene and pathway interaction is
essential to delineate the specific roles of the identified genes,
which may help to confirm gene functions and reveal the mechanisms
underlying BC.
Acknowledgements
The authors thank Kaijiong Zhang for his technical
guidance.
Funding
No funding was received.
Availability of data and materials
The datasets used and analyzed during the current
study are available from the corresponding author on reasonable
request.
Authors' contributions
CL and YW conceived and designed the study. QH and
YZ collected the data. YW and YZ analyzed the database, prepared
the diagrams and wrote the paper. CL and QH reviewed and edited the
manuscript. All authors read and approved the final manuscript.
Ethics approval and consent to
participate
Not applicable.
Consent for publication
Not applicable.
Competing interests
The authors declare that they have no competing
interests.
References
|
1
|
Siegel RL, Miller KD and Jemal A: Cancer
statistics, 2015. CA Cancer J Clin. 65:5–29. 2015. View Article : Google Scholar : PubMed/NCBI
|
|
2
|
Fan L, Strasser-weippl K, Li JJ, St Louis
J, Finkelstein DM, Yu KD, Chen WQ, Shao ZM and Goss PE: Breast
cancer in China. Lancet Oncol. 15:e279–e289. 2014. View Article : Google Scholar : PubMed/NCBI
|
|
3
|
Elfar GA, Ebrahim MA, Elsherbiny NM and
Eissa LA: Validity of osteoprotegerin and receptor activator of
NF-κB ligand for the detection of bone metastasis in breast cancer.
Oncol Res. 25:641–650. 2017. View Article : Google Scholar : PubMed/NCBI
|
|
4
|
Uehara M, Kinoshita T, Hojo T,
Akashi-Tanaka S, Iwamoto E and Fukutomi T: Long-term prognostic
study of carcinoembryonic antigen (CEA) and carbohydrate antigen
15-3 (CA 15-3) in breast cancer. Int J Clin Oncol. 13:447–451.
2008. View Article : Google Scholar : PubMed/NCBI
|
|
5
|
Duffy MJ, Evoy D and McDermott EW: CA
15-3: Uses and limitation as a biomarker for breast cancer. Clin
Chim Acta. 411:1869–1874. 2010. View Article : Google Scholar : PubMed/NCBI
|
|
6
|
O'Donoghue C, Eklund M, Ozanne EM and
Esserman LJ: Aggregate cost of mammography screening in the United
States: Comparison of current practice and advocated guidelines.
Ann Intern Med. 160:1452014. View
Article : Google Scholar : PubMed/NCBI
|
|
7
|
Vogelstein B, Papadopoulos N, Velculescu
VE, Zhou S, Diaz LA Jr and Kinzler KW: Cancer genome landscapes.
Science. 339:1546–1558. 2013. View Article : Google Scholar : PubMed/NCBI
|
|
8
|
Luo J and Ellis MJ: Microarray data
analysis in neoadjuvant biomarker studies in estrogen
receptor-positive breast cancer. Breast Cancer Res. 12:1122010.
View Article : Google Scholar : PubMed/NCBI
|
|
9
|
Chen C, Li Z, Yang Y, Xiang T, Song W and
Liu S: Microarray expression profiling of dysregulated long
non-coding RNAs in triple-negative breast cancer. Cancer Biol Ther.
16:856–865. 2015. View Article : Google Scholar : PubMed/NCBI
|
|
10
|
Makoukji J, Makhoul NJ, Khalil M, El-Sitt
S, Aldin ES, Jabbour M, Boulos F, Gadaleta E, Sangaralingam A,
Chelala C, et al: Gene expression profiling of breast cancer in
Lebanese women. Sci Rep. 6:366392016. View Article : Google Scholar : PubMed/NCBI
|
|
11
|
Cizkova M, Cizeron-Clairac G, Vacher S,
Susini A, Andrieu C, Lidereau R and Bièche I: Gene expression
profiling reveals new aspects of PIK3CA mutation in
ERalpha-positive breast cancer: Major implication of the Wnt
signaling pathway. PLoS One. 5:e156472010. View Article : Google Scholar : PubMed/NCBI
|
|
12
|
Richardson AL, Wang ZC, De Nicolo A, Lu X,
Brown M, Miron A, Liao X, Iglehart JD, Livingston DM and Ganesan S:
X chromosomal abnormalities in basal-like human breast cancer.
Cancer Cell. 9:121–132. 2006. View Article : Google Scholar : PubMed/NCBI
|
|
13
|
Turashvili G, Bouchal J, Baumforth K, Wei
W, Dziechciarkova M, Ehrmann J, Klein J, Fridman E, Skarda J,
Srovnal J, et al: Novel markers for differentiation of lobular and
ductal invasive breast carcinomas by laser microdissection and
microarray analysis. BMC Cancer. 7:552007. View Article : Google Scholar : PubMed/NCBI
|
|
14
|
Kretschmer C, Sterner-Kock A, Siedentopf
F, Schoenegg W, Schlag PM and Kemmner W: Identification of early
molecular markers for breast cancer. Mol Cancer. 10:152011.
View Article : Google Scholar : PubMed/NCBI
|
|
15
|
Planche A, Bacac M, Provero P, Fusco C,
Delorenzi M, Stehle JC and Stamenkovic I: Identification of
prognostic molecular features in the reactive stroma of human
breast and prostate cancer. PLoS One. 6:e186402011. View Article : Google Scholar : PubMed/NCBI
|
|
16
|
Irizarry RA, Hobbs B, Collin F,
Beazer-Barclay YD, Antonellis KJ, Scherf U and Speed TP:
Exploration, normalization, and summaries of high density
oligonucleotide array probe level data. Biostatistics. 4:249–264.
2003. View Article : Google Scholar : PubMed/NCBI
|
|
17
|
Gautier L, Cope L, Bolstad BM and Irizarry
RA: affy-analysis of Affymetrix GeneChip data at the probe level.
Bioinformatics. 20:307–315. 2004. View Article : Google Scholar : PubMed/NCBI
|
|
18
|
Chen C, Grennan K, Badner J, Zhang D,
Gershon E, Jin L and Liu C: Removing batch effects in analysis of
expression microarray data: An evaluation of six batch adjustment
methods. PLoS One. 6:e172382011. View Article : Google Scholar : PubMed/NCBI
|
|
19
|
Ritchie ME, Phipson B, Wu D, Hu Y, Law CW,
Shi W and Smyth GK: limma powers differential expression analyses
for RNA-sequencing and microarray studies. Nucleic Acids Res.
43:e472015. View Article : Google Scholar : PubMed/NCBI
|
|
20
|
Jiao X, Sherman BT, da Huang W, Stephens
R, Baseler MW, Lane HC and Lempicki RA: DAVID-WS: A stateful web
service to facilitate gene/protein list analysis. Bioinformatics.
28:1805–1806. 2012. View Article : Google Scholar : PubMed/NCBI
|
|
21
|
Gene Ontology Consortium: The Gene
Ontology (GO) project in 2006. Nucleic Acids Res. 34:(Database
Issue). D322–D326. 2006. View Article : Google Scholar : PubMed/NCBI
|
|
22
|
Ogata H, Goto S, Sato K, Fujibuchi W, Bono
H and Kanehisa M: KEGG: Kyoto encyclopedia of genes and genomes.
Nucleic Acids Res. 27:29–34. 1999. View Article : Google Scholar : PubMed/NCBI
|
|
23
|
Szklarczyk D, Franceschini A, Kuhn M,
Simonovic M, Roth A, Minguez P, Doerks T, Stark M, Muller J, Bork
P, et al: The STRING database in 2011: Functional interaction
networks of proteins, globally integrated and scored. Nucleic Acids
Res. 39:(Database Issue). D561–D568. 2011. View Article : Google Scholar : PubMed/NCBI
|
|
24
|
Smoot ME, Ono K, Ruscheinski J, Wang PL
and Ideker T: Cytoscape 2.8: New features for data integration and
network visualization. Bioinformatics. 27:431–432. 2011. View Article : Google Scholar : PubMed/NCBI
|
|
25
|
Bader GD and Hogue CW: An automated method
for finding molecular complexes in large protein interaction
networks. BMC Bioinformatics. 4:22003. View Article : Google Scholar : PubMed/NCBI
|
|
26
|
Gray JM, Rasanayagam S, Engel C and Rizzo
J: State of the evidence 2017: An update on the connection between
breast cancer and the environment. Environ Health. 16:942017.
View Article : Google Scholar : PubMed/NCBI
|
|
27
|
Hamdi Y, Soucy P, Adoue V, Michailidou K,
Canisius S, Lemaçon A, Droit A, Andrulis IL, Anton-Culver H, Arndt
V, et al: Association of breast cancer risk with genetic variants
showing differential allelic expression: Identification of a novel
breast cancer susceptibility locus at 4q21. Oncotarget.
7:80140–80163. 2016. View Article : Google Scholar : PubMed/NCBI
|
|
28
|
Zheng T, Wang A, Hu D and Wang Y:
Molecular mechanisms of breast cancer metastasis by gene expression
profile analysis. Mol Med Rep. 16:4671–4677. 2017. View Article : Google Scholar : PubMed/NCBI
|
|
29
|
Ikeda K, Horie-Inoue K and Inoue S:
Identification of estrogen-responsive genes based on the DNA
binding properties of estrogen receptors using high-throughput
sequencing technology. Acta Pharmacol Sin. 36:24–31. 2015.
View Article : Google Scholar : PubMed/NCBI
|
|
30
|
Pounds S and Morris SW: Estimating the
occurrence of false positives and false negatives in microarray
studies by approximating and partitioning the empirical
distribution of P-values. Bioinformatics. 19:1236–1242. 2003.
View Article : Google Scholar : PubMed/NCBI
|
|
31
|
Kupfer P, Guthke R, Pohlers D, Huber R,
Koczan D and Kinne RW: Batch correction of microarray data
substantially improves the identification of genes differentially
expressed in rheumatoid arthritis and osteoarthritis. BMC Med
Genomics. 5:232012. View Article : Google Scholar : PubMed/NCBI
|
|
32
|
Liang B, Li C and Zhao J: Identification
of key pathways and genes in colorectal cancer using bioinformatics
analysis. Med Oncol. 33:1112016. View Article : Google Scholar : PubMed/NCBI
|
|
33
|
Lyons TR, O'Brien J, Borges VF, Conklin
MW, Keely PJ, Eliceiri KW, Marusyk A, Tan AC and Schedin P:
Postpartum mammary gland involution drives progression of ductal
carcinoma in situ through collagen and COX-2. Nat Med.
17:1109–1115. 2011. View
Article : Google Scholar : PubMed/NCBI
|
|
34
|
Provenzano PP, Inman DR, Eliceiri KW,
Knittel JG, Yan L, Rueden CT, White JG and Keely PJ: Collagen
density promotes mammary tumor initiation and progression. BMC Med.
6:112008. View Article : Google Scholar : PubMed/NCBI
|
|
35
|
Cox TR, Bird D, Baker AM, Barker HE, Ho
MW, Lang G and Erler JT: LOX-mediated collagen crosslinking is
responsible for fibrosis-enhanced metastasis. Cancer Res.
73:1721–1732. 2013. View Article : Google Scholar : PubMed/NCBI
|
|
36
|
Chia J, Kusuma N, Anderson R, Parker B,
Bidwell B, Zamurs L, Nice E and Pouliot N: Evidence for a role of
tumor-derived laminin-511 in the metastatic progression of breast
cancer. Am J Pathol. 170:2135–2148. 2007. View Article : Google Scholar : PubMed/NCBI
|
|
37
|
Chang HY, Nuyten DS, Sneddon JB, Hastie T,
Tibshirani R, Sørlie T, Dai H, He YD, van't Veer LJ, Bartelink H,
et al: Robustness, scalability, and integration of a wound-response
gene expression signature in predicting breast cancer survival.
Proc Natl Acad Sci USA. 102:3738–3743. 2005. View Article : Google Scholar : PubMed/NCBI
|
|
38
|
Finak G, Bertos N, Pepin F, Sadekova S,
Souleimanova M, Zhao H, Chen H, Omeroglu G, Meterissian S, Omeroglu
A, et al: Stromal gene expression predicts clinical outcome in
breast cancer. Nat Med. 14:518–527. 2008. View Article : Google Scholar : PubMed/NCBI
|
|
39
|
Peters JM, Shah YM and Gonzalez FJ: The
role of peroxisome proliferator-activated receptors in
carcinogenesis and chemoprevention. Nat Rev Cancer. 12:181–195.
2012. View Article : Google Scholar : PubMed/NCBI
|
|
40
|
Boitier E, Gautier JC and Roberts R:
Advances in understanding the regulation of apoptosis and mitosis
by peroxisome-proliferator activated receptors in pre-clinical
models: Relevance for human health and disease. Comp Hepatol.
2:32003. View Article : Google Scholar : PubMed/NCBI
|
|
41
|
Robbins GT and Nie D: PPAR gamma,
bioactive lipids, and cancer progression. Front Biosci (Landmark
Ed). 17:1816–1834. 2012. View
Article : Google Scholar : PubMed/NCBI
|
|
42
|
Liu H, Zang C, Fenner MH, Possinger K and
Elstner E: PPARgamma ligands and ATRA inhibit the invasion of human
breast cancer cells in vitro. Breast Cancer Res Treat. 79:63–74.
2003. View Article : Google Scholar : PubMed/NCBI
|
|
43
|
Apostoli AJ, Skelhorne-Gross GE, Rubino
RE, Peterson NT, Di Lena MA, Schneider MM, SenGupta SK and Nicol
CJ: Loss of PPARγ expression in mammary secretory epithelial cells
creates a pro-breast tumorigenic environment. Int J Cancer.
134:1055–1066. 2014. View Article : Google Scholar : PubMed/NCBI
|
|
44
|
Lan J, Huang HY, Lee SW, Chen TJ, Tai HC,
Hsu HP, Chang KY and Li CF: TOP2A overexpression as a poor
prognostic factor in patients with nasopharyngeal carcinoma. Tumour
Biol. 35:179–187. 2014. View Article : Google Scholar : PubMed/NCBI
|
|
45
|
Milde-Langosch K, Karn T, Müller V, Witzel
I, Rody A, Schmidt M and Wirtz RM: Validity of the proliferation
markers Ki67, TOP2A, and RacGAP1 in molecular subgroups of breast
cancer. Breast Cancer Res Treat. 137:57–67. 2013. View Article : Google Scholar : PubMed/NCBI
|
|
46
|
Şahin S, Işık Gönül İ, Çakır A, Seçkin S
and Uluoğlu Ö: Clinicopathological significance of the
proliferation markers Ki67, RacGAP1, and Topoisomerase 2 alpha in
breast cancer. Int J Surg Pathol. 24:607–613. 2016. View Article : Google Scholar : PubMed/NCBI
|
|
47
|
Ambrosini G, Adida C and Altieri DC: A
novel anti-apoptosis gene, survivin, expressed in cancer and
lymphoma. Nat Med. 3:917–921. 1997. View Article : Google Scholar : PubMed/NCBI
|
|
48
|
Tanaka K, Iwamoto S, Gon G, Nohara T,
Iwamoto M and Tanigawa N: Expression of survivin and its
relationship to loss of apoptosis in breast carcinomas. Clin cancer
Res. 6:127–134. 2000.PubMed/NCBI
|
|
49
|
Kappler M, Kotzsch M, Bartel F, Füssel S,
Lautenschläger C, Schmidt U, Würl P, Bache M, Schmidt H, Taubert H
and Meye A: Elevated expression level of survivin protein in
soft-tissue sarcomas is a strong independent predictor of survival.
Clin Cancer Res. 9:1098–1104. 2003.PubMed/NCBI
|
|
50
|
Ghaffari K, Hashemi M, Ebrahimi E and
Shirkoohi R: BIRC5 genomic copy number variation in early-onset
breast cancer. Iran Biomed J. 20:241–245. 2016.PubMed/NCBI
|
|
51
|
Santamaría D, Barrière C, Cerqueira A,
Hunt S, Tardy C, Newton K, Cáceres JF, Dubus P, Malumbres M and
Barbacid M: Cdk1 is sufficient to drive the mammalian cell cycle.
Nature. 448:811–815. 2007. View Article : Google Scholar : PubMed/NCBI
|
|
52
|
Kourea HP, Koutras AK, Scopa CD, Marangos
MN, Tzoracoeleftherakis E, Koukouras D and Kalofonos HP: Expression
of the cell cycle regulatory proteins p34cdc2, p21waf1, and p53 in
node negative invasive ductal breast carcinoma. Mol Pathol.
56:328–335. 2003. View Article : Google Scholar : PubMed/NCBI
|
|
53
|
Galindo-Moreno M, Giráldez S, Sáez C,
Japón MÁ, Tortolero M and Romero F: Both p62/SQSTM1-HDAC6-dependent
autophagy and the aggresome pathway mediate CDK1 degradation in
human breast cancer. Sci Rep. 7:100782017. View Article : Google Scholar : PubMed/NCBI
|
|
54
|
Miyazaki T and Arai S: Two distinct
controls of mitotic cdk1/cyclin B1 activity requisite for cell
growth prior to cell division. Cell Cycle. 6:1419–1425. 2007.
View Article : Google Scholar : PubMed/NCBI
|
|
55
|
Pines J and Hunter T: Human cyclin A is
adenovirus E1A-associated protein p60 and behaves differently from
cyclin B. Nature. 346:760–763. 1990. View Article : Google Scholar : PubMed/NCBI
|
|
56
|
Uhlen M, Oksvold P, Fagerberg L, Lundberg
E, Jonasson K, Forsberg M, Zwahlen M, Kampf C, Wester K, Hober S,
et al: Towards a knowledge-based Human Protein Atlas. Nat
Biotechnol. 28:1248–1250. 2010. View Article : Google Scholar : PubMed/NCBI
|
|
57
|
Ding K, Li W, Zou Z, Zou X and Wang C:
CCNB1 is a prognostic biomarker for ER+ breast cancer. Med
Hypotheses. 83:359–364. 2014. View Article : Google Scholar : PubMed/NCBI
|
|
58
|
Durfee T, Becherer K, Chen PL, Yeh SH,
Yang Y, Kilburn AE, Lee WH and Elledge SJ: The retinoblastoma
protein associates with the protein phosphatase type 1 catalytic
subunit. Genes Dev. 7:555–569. 1993. View Article : Google Scholar : PubMed/NCBI
|
|
59
|
Ciferri C, Pasqualato S, Screpanti E,
Varetti G, Santaguida S, Dos RG, Maiolica A, Polka J, De Luca JG,
De WP, et al: Implications for kinetochore-microtubule attachment
from the structure of an engineered Ndc80 complex. Cell.
133:427–439. 2008. View Article : Google Scholar : PubMed/NCBI
|
|
60
|
Diaz-Rodríguez E, Sotillo R, Schvartzman
JM and Benezra R: Hec1 overexpression hyperactivates the mitotic
checkpoint and induces tumor formation in vivo. Proc Natl Acad Sci
USA. 105:16719–16724. 2008. View Article : Google Scholar : PubMed/NCBI
|
|
61
|
van't Veer LJ, Dai H, van de Vijver MJ, He
YD, Hart AA, Mao M, Peterse HL, van der Kooy K, Marton MJ,
Witteveen AT, et al: Gene expression profiling predicts clinical
outcome of breast cancer. Nature. 415:530–536. 2002. View Article : Google Scholar : PubMed/NCBI
|