Introduction
Colorectal cancer (CRC) is the third leading cause
of cancer worldwide, with ~1.3 million new cases diagnosed every
year (1). Surgery is a curative
option for the majority of patients with early-stage CRC, whereas
interventions are often aimed at improving quality of life and
relieving symptoms of CRC at later stages. The 5-year survival rate
of CRC varies from >90% in stage I cases to ~10% in stage IV
cases (2). Recurrence and
metastasis are two major reasons accounting for the poor outcome
(3); therefore, promising
molecular biomarker candidates to improve prognostic prediction and
therapeutic outcome in CRC are required.
Long noncoding RNAs (lncRNAs), once considered
transcriptional noise, have recently become an important field in
research. LncRNAs are mRNA-like transcripts >200 nucleotides
long, which do not encode proteins (4). Previous studies demonstrated that
lncRNAs are involved in the tumorigenesis of numerous cancer
phenotypes via interactions with DNA, RNA, protein and other
cellular molecules (5,6). Expression of lncRNA
metastasis-associated lung adenocarcinoma transcript 1 and prostate
cancer-associated ncRNA transcripts 1 have been reported to be
markedly elevated in CRC tissues compared with in paired normal
tissues, and of prognostic significance in CRC (7,8). In
addition, Qi et al (9)
revealed that lncRNA LOC285194 expression is significantly reduced
in CRC tissues, and is associated with poor disease-free survival.
Recently, Ozawa et al (10)
indicated that colon cancer-associated transcript 1 and 2 may be of
strong prognostic value in CRC. These findings suggested the
necessity to identify potential prognostic lncRNAs in CRC; however,
there are few studies focusing on the identification of reliable
prognostic lncRNAs in CRC.
In the present study, a systematic analysis of the
lncRNA expression profiles in patients with CRC derived from The
Cancer Genome Atlas (TCGA; https://gdc-portal.nci.nih.gov/) portal was initially
conducted; differentially expressed lncRNAs (DELs) were screened
between CRC patients with good and poor prognoses, from which,
prognostic lncRNA signatures were identified using univariate and
multivariate Cox regression analyses. Based on the expression of
these signature lncRNAs, a risk scoring system was successfully
developed and was employed to classify patients in a training set
or an independent testing set into high-risk and low-risk groups.
Furthermore, interactions between the co-expressed genes of these
signature lncRNAs were analyzed in protein-protein interaction
(PPI) networks, followed by functional analyses to determine their
possible functional roles in CRC. The present study aimed to
provide novel insight into the lncRNAs with promising prognostic
value in CRC and to improve the survival of patients with CRC.
Materials and methods
Datasets
The present study was performed using an mRNA-seq
dataset of colon adenocarcinoma samples retrieved from TCGA data
portal, a publicly available repository. Samples with follow-ups of
<2 years and without recurrence, or without recurrence-free
survival (RFS) time information were excluded from the analysis;
consequently, 233 remaining samples were defined as a training set.
Additionally, the present study employed a TCGA rectal
adenocarcinoma (READ) mRNA-seq dataset. Similarly, following the
removal of samples with follow-ups of <2 years and without
recurrence, or without RFS time record, 94 remaining samples in the
READ set were included in the present study as a testing set.
Clinical features of the training and the testing sets are
presented in Table I.
 | Table I.Clinical characteristics of the
training set of COAD and the testing set of READ. |
Table I.
Clinical characteristics of the
training set of COAD and the testing set of READ.
|
Characteristics | COAD (n=233) | READ (n=94) | P-value |
|---|
| Age (years) | 68.15±12.38 | 65.58±10.29 | 0.0282a |
| Gender
(male/female) | 126/107 | 54/40 | 0.6241 |
| pathologic_stage
(I+II/III+IV) | 122/102 | 47/42 | 0.8027 |
| pathologic_M
(M0/M1) | 165/39 | 19/16 | 0.0017a |
| pathologic_N
(N0/N1/N2) | 133/53/47 | 49/21/22 | 0.5379 |
| pathologic_T
(T0/T1/T2/T3/T4) | 0/7/31/164/31 | 0/6/14/64/9 | 0.2664 |
| lymphatic_invasion
(yes/no) | 94/116 | 33/52 | 0.3665 |
| venous_invasion
(yes/no) | 61/136 | 22/61 | 0.4778 |
| residual_tumor
(R0/R1/R2) | 155/3/10 | 62/2/8 | 0.1543 |
|
primary_therapy_outcome_success
(SD/PD/CR/PR) | 0/6/9/2 | 0/2/7/0 | 0.6673 |
GENCODE gene annotation (www.gencodegenes.org/) (11) is the largest publicly available
catalogue of human lncRNAs. Genes in the training and testing sets
were annotated by GENCODE (11).
The resulting lncRNAs were used for further analysis.
Screening for prognosis-associated
DELs
According to RFS time and cancer recurrence status,
the 233 samples in the training set were classified into a good
prognosis group (n=106), in which patients exhibited RFS time ≥2
years without cancer recurrence, and a poor prognosis group
(n=127), in which patients experienced cancer recurrence. With an
adjusted P-value (P<0.05) as a strict cutoff value, DELs between
the two groups were screened using edgeR package (12–14)
or DESeq2 package (15)
(Bioconductor; www.bioconductor.org/) in R3.3.3 language.
Prognosis-associated DELs were identified from the
overlapped DELs between the two packages using univariate Cox
regression analysis (16) in
survival package 2.41-3 (cran.r-project.org/web/packages/survival/index.html)
in R 3.4.3, followed by log-rank test (cut-off value, P<0.01).
Subsequently, these identified prognosis-associated DELs were
subjected to multivariate Cox regression analysis.
Development of risk scoring
system
Based on the expression of significant prognostic
lncRNAs derived from multivariate Cox regression analysis, the risk
score was calculated as the linear combination of expression levels
of these lncRNAs, which were weighted by regression coefficients
(16,17), and a risk scoring system was
developed as follows:
Risk score = β1 × expr1 +
β2 × expr2 + ··· + βn ×
exprn
Where βn stands for estimated regression
coefficient of lncRNAn, and exprn stands for
expression levels of lncRNAn.
The risk scoring system was used to divide patients
in each set into high-risk and low-risk groups, with the median
risk score of the set being the cut-off point. Kaplan-Meier
survival analyses were employed to compare the RFS time of the
high-risk and low-risk groups, followed by log-rank test.
Furthermore, univariate and multivariate Cox regression analyses,
and data stratification analysis (χ2) were conducted to
evaluate whether the risk score was independent of clinical
features. For these tests, P<0.05 was considered to indicate a
statistically significant difference. In addition, the expression
levels of these selected lncRNAs were compared between the
high-risk group and the low-risk group using Student's t-test in
the R stats package 3.4.3 (www.rdocumentation.org/packages/stats/versions/3.4.3)
with a threshold of P<0.05.
Construction of lncRNA-gene networks
and PPI networks
Co-expressed genes of these significant lncRNAs
identified by multivariate Cox regression analysis were analyzed
using the Multi-Experiment Matrix (MEM) web-based online tool
(18,19) (http://biit.cs.ut.ee/mem/index.cgi) in Human Genome
U133 Plus 2.0. These co-expressed genes were ranked according to a
score of significance by the MEM tool. The top 100 genes of each
lncRNA were selected for the construction of a lncRNA-gene network
using Cytoscape 3.0 (20)
(www.cytoscape.org/). In order to study
the interactions between genes in each lncRNA-gene network,
corresponding PPI networks were built using the Search Tool for the
Retrieval of Interacting Genes (string-db.org/) (21)
and visualized using Cytoscape 3.0 (20), with the threshold value set at
median confidence=0.4.
Gene Ontology (GO) function and Kyoto
Encyclopedia of Genes and Genomes (KEGG) pathway enrichment
analyses
GOATOOLS 0.8.2 (github.com/tanghaibao/goatools) is an easily
accessible Python package used for annotation of genes to
biological processes (BP), molecular function (MF) and cellular
component (CC) in the GO database. KOBAS 3.0 (kobas.cbi.pku.edu.cn/) is a web server used to
annotate input genes and identify putative pathways involved,
allowing for ID mapping and cross-species sequence similarity
mapping (22). GO terms and KEGG
pathways that may involve these genes in the lncRNA-gene networks
were investigated with GOATOOLS and KOBAS, respectively.
ClusterProfiler (Bioconductor; https://bioconductor.org/packages/release/bioc/html/clusterProfiler.html)
is a R package used for the classification of biological terms and
enrichment analysis of gene clusters, and is characterized by
biological theme comparison among gene clusters (23). ClusterProfiler software 3.6.0 was
applied to perform GO function and KEGG pathway enrichment analyses
on the genes in the lncRNA-gene networks.
Results
Analysis of prognostic lncRNAs
Following removal of lncRNAs with 0 expression in at
least 50 samples, there were a total of 4,162 lncRNAs in the
training set. As a result, 82 DELs between good prognosis and poor
prognosis samples were identified using the edgeR and DESeq2
packages. Among these resulting DELs, 44 were identified as
prognosis-associated lncRNAs in univariate Cox regression analysis
(P<0.01). Furthermore, as presented in Table II, 5 of the 44
prognosis-associated lncRNAs were detected to be independently
associated with prognosis in multivariate Cox regression analysis,
including ENSG00000253417 [long intergenic nonprotein coding RNA
2159, (LINC02159)], ENSG00000280132 (RP11-452L6.6), ENSG00000261040
[whey acidic protein four-disulfide core domain 21 (WFDC21P)],
ENSG00000246451 (RP11-894P9.1) and ENSG00000279865
(RP11-69M1.6).
| Table II.Multivariate analysis of the five
lncRNA signatures. |
Table II.
Multivariate analysis of the five
lncRNA signatures.
| LncRNA | coef | exp(coef) | se(coef) | z-value | Pr (>|z|) |
|---|
|
ENSG00000280132 | 0.3844 | 1.4688 | 0.1606 | 2.394 | 0.017 |
|
ENSG00000253417 | −0.2810 | 0.7550 | 0.1002 | −2.805 | 0.005 |
|
ENSG00000279865 | −0.4740 | 0.6225 | 0.2294 | −2.066 | 0.039 |
|
ENSG00000261040 | −0.2715 | 0.7623 | 0.1200 | −2.262 | 0.024 |
|
ENSG00000246451 | −0.6862 | 0.5035 | 0.3136 | −2.188 | 0.029 |
Development of a risk score system
based on the 5-lncRNA signature
Based on the expression of the 5 lncRNAs derived
from multivariate Cox regression analysis, a risk scoring system
was developed as follows: Risk score = −0.219 × expr (LINC02159) +
0.354 × expr (RP11-452L6.6) −0.211 × expr (WFDC21P) + 0.143 × expr
(RP11-894P9.1) −0.374 × expr (RP11-69M1.6)
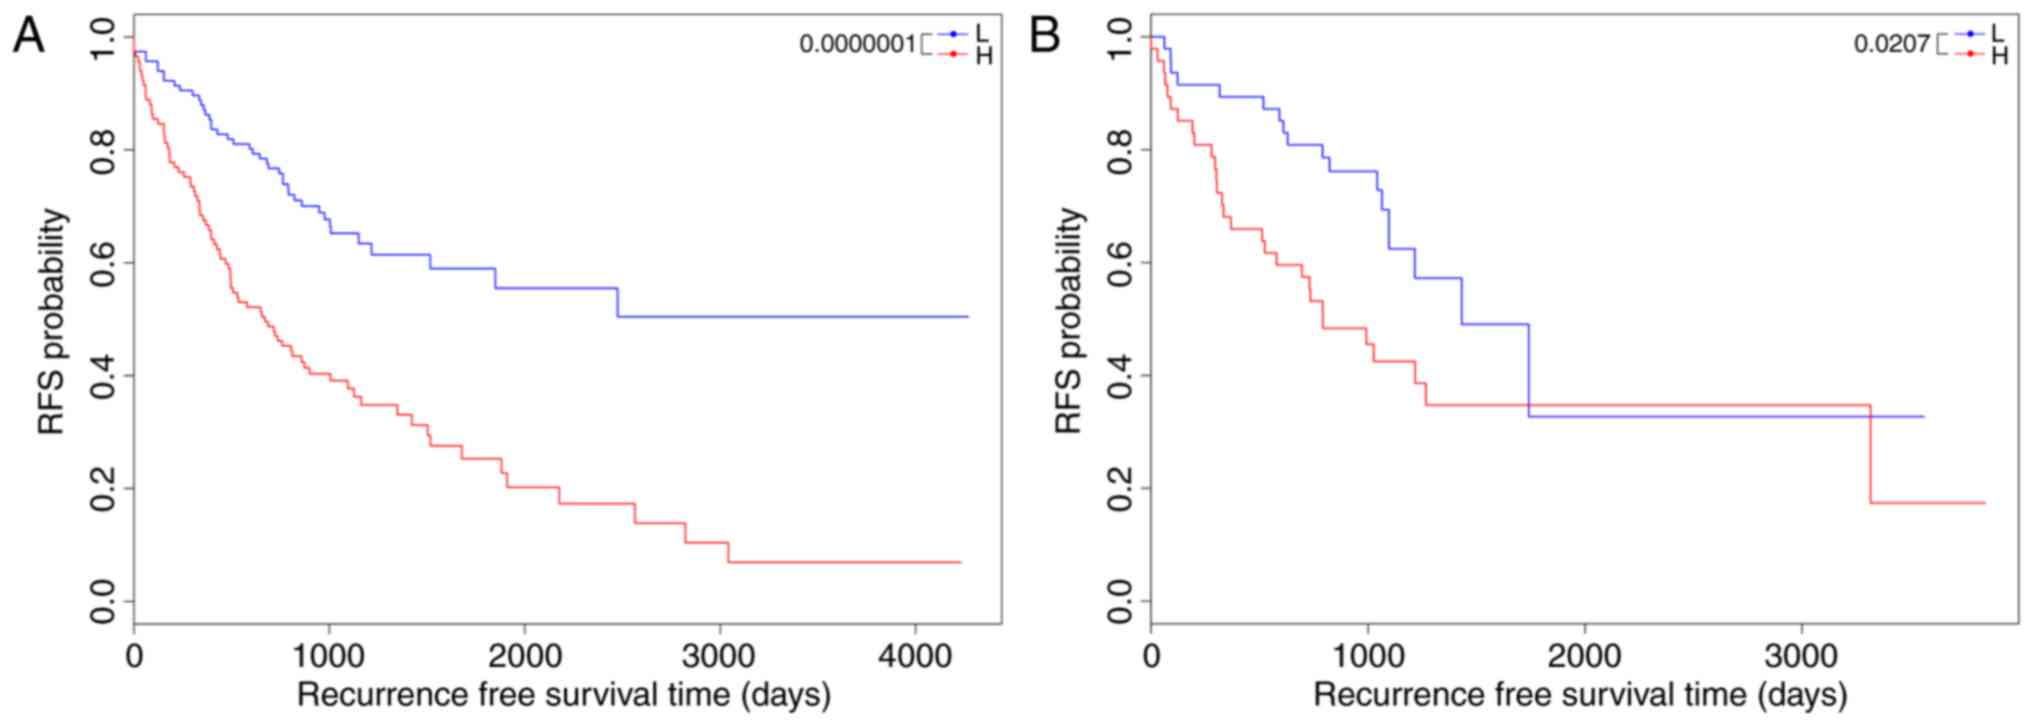
The 5-lncRNA-based risk scoring system was applied
to the training set to assort patients into high-risk and low-risk
groups, with the median risk score as the threshold. In the
training set, the low-risk group had a markedly longer RFS time
compared with the high-risk group (38.547±29.693 months vs.
26.721±25.532 months, P=1×10⁻⁷; Fig. 1A). To validate the prognostic power
of the risk scoring system in the testing set, all patients in the
testing set were also classified into high-risk and low-risk groups
by the risk scoring system. Similar results were yielded in the
testing set (34.090±18.477 months vs. 29.305±26.450 months,
P=0.0207; Fig. 1B).
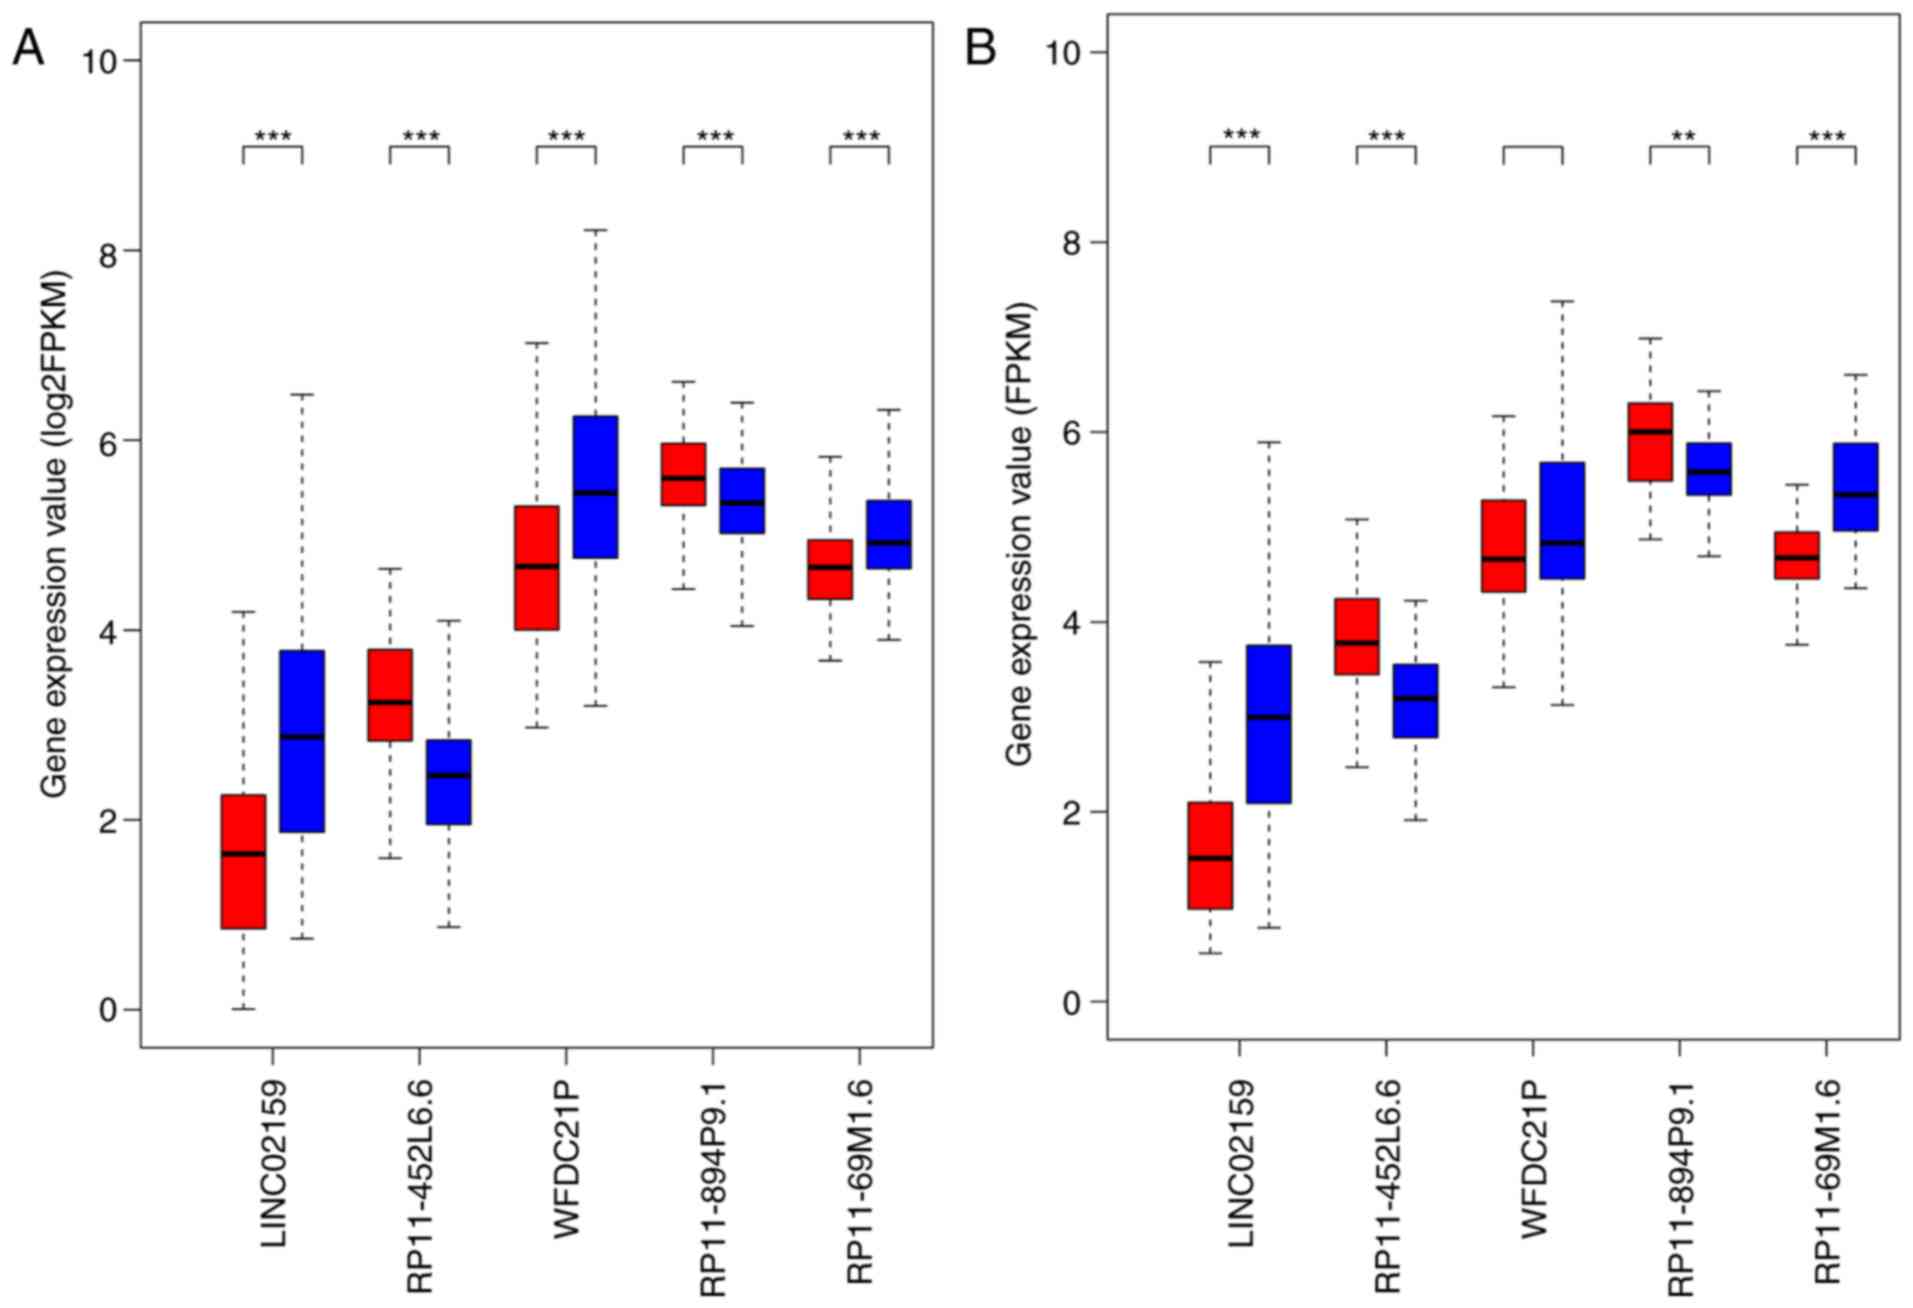
Expression levels of the 5 prognostic
lncRNAs in the training set and the testing set
Boxplots demonstrated that in the training set, the
expression levels of LINC02159, WFDC21P and RP11-69M1.6 were
significantly decreased, whereas the expression levels of
RP11-452L6.6 and RP11-894P9.1 were significantly elevated in the
high-risk samples compared with in the low-risk samples
(P<0.001; Fig. 2A), which was
validated in the testing set, except for WFDC21P (Fig. 2B). WFDC21P expression appeared to
be reduced in the high-risk samples compared with in low-risk
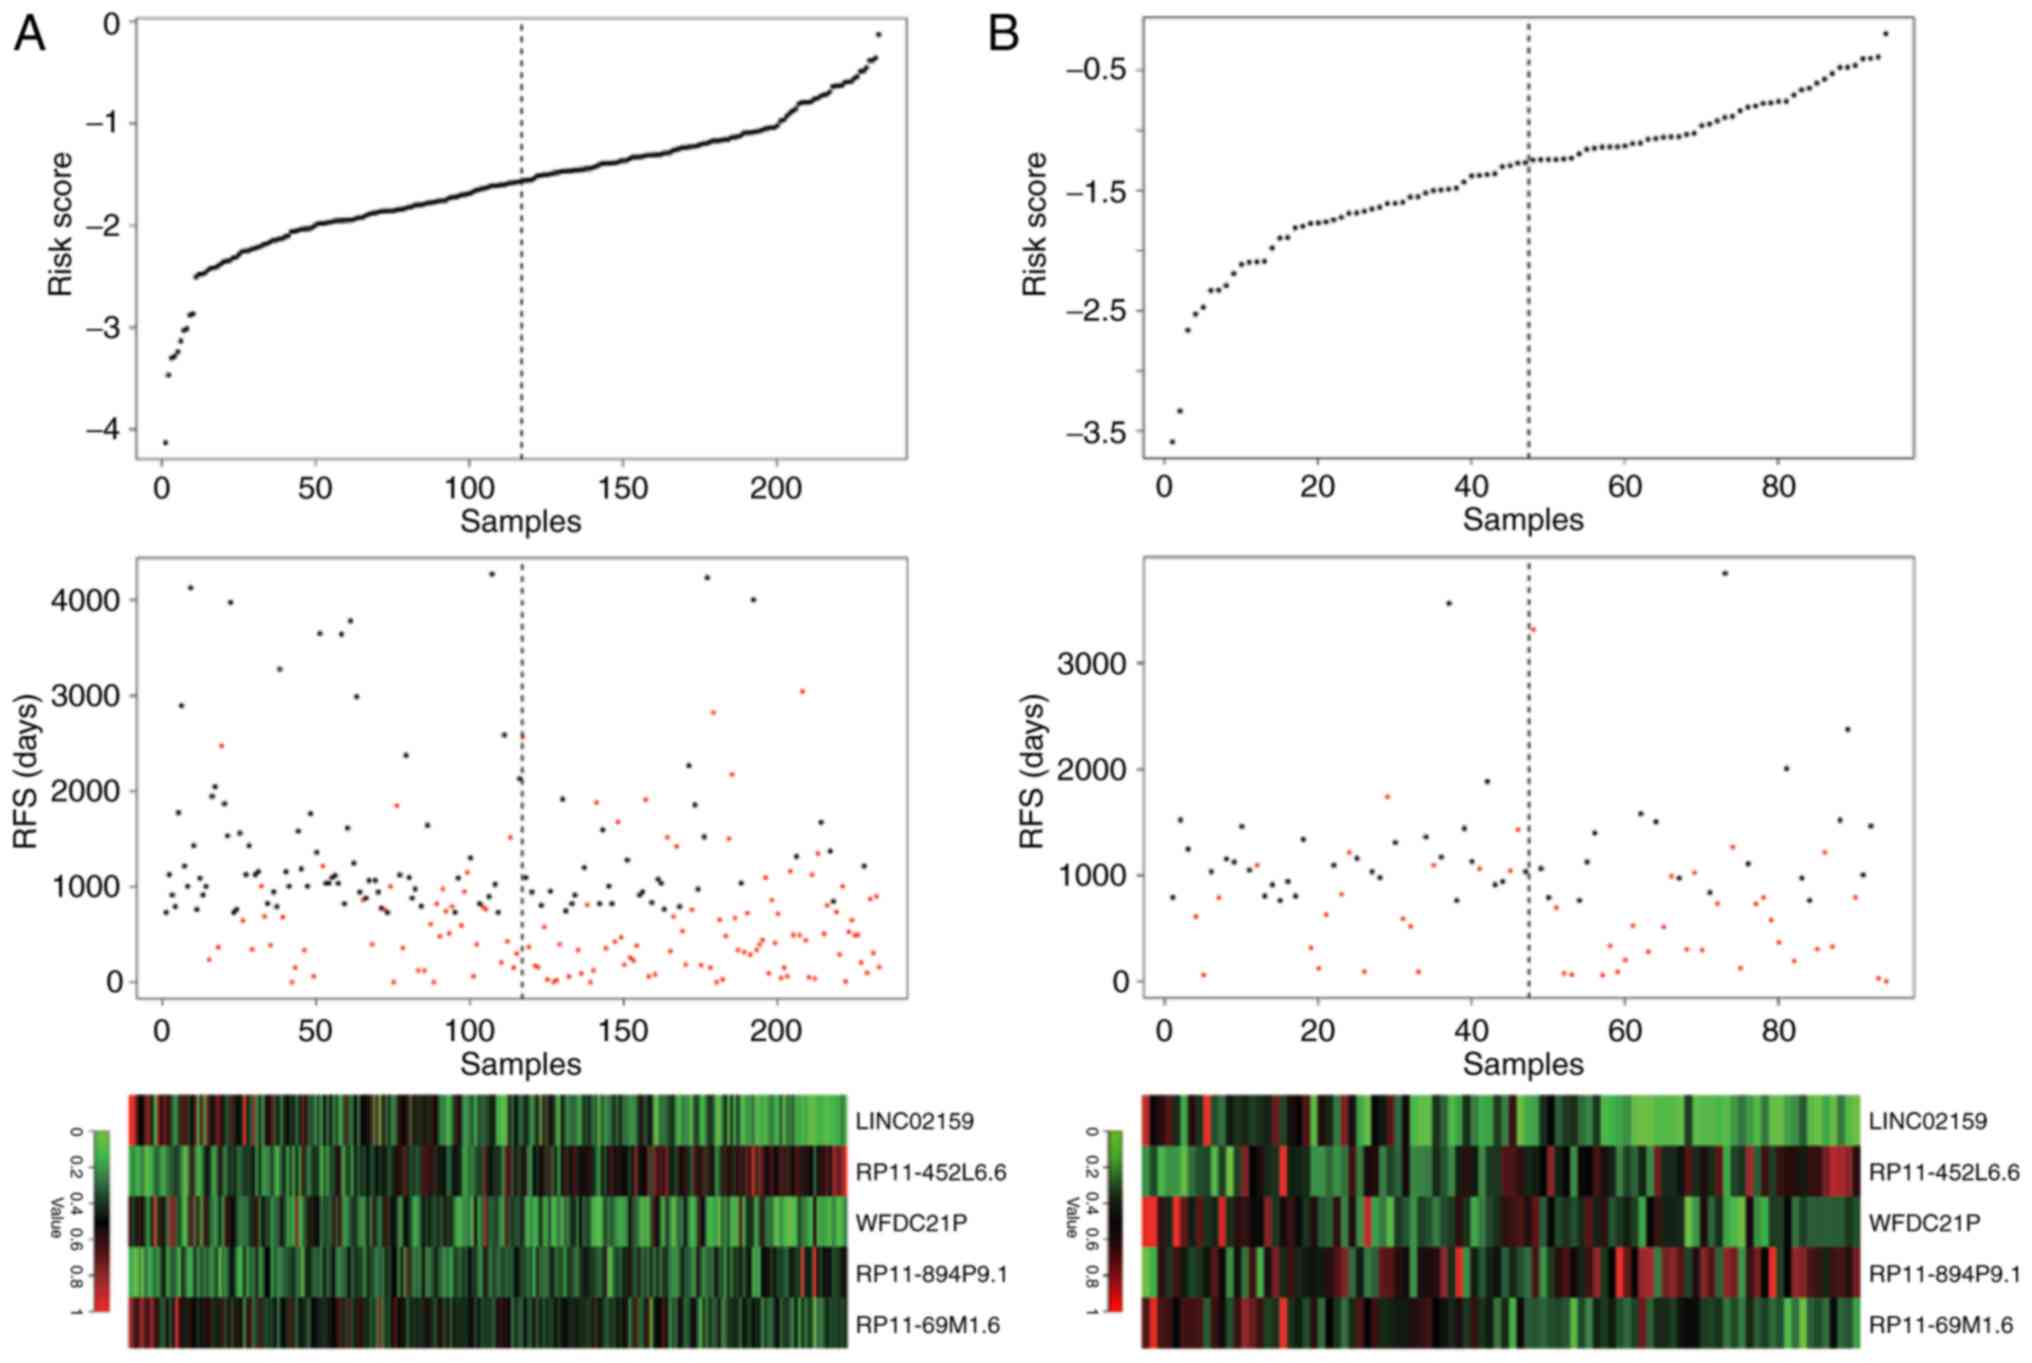
samples, but the difference was not significant. The distribution
of risk score, RFS time and long noncoding RNA expression in the
training set and the testing set were similar, indicating the
robustness of the risk scoring system based on the 5 lncRNAs
(Fig. 3).
Analysis on whether prognostic power
of the 5-lncRNA signature-based risk score model is independent of
clinical features
According to the results of a univariate Cox
regression analysis, risk score, pathologic_stage, pathologic_M,
pathologic_N, lymphatic_invasion and venous_invasion were
demonstrated to be significantly associated with prognosis
(Table III). Among these
significant factors, risk score, pathologic_stage, pathologic_n and
venous_invasion were identified to be independent predictors of
prognosis according to the results of a multivariate Cox regression
analysis (P<0.05; Table
IV).
| Table III.Results of univariate Cox regression
analysis for risk score and clinical features. |
Table III.
Results of univariate Cox regression
analysis for risk score and clinical features.
| Clinical
features | coef. | Standard error | z-value | P-value | HR | Lower. 95 | Upper. 95 |
|---|
| Risk score | 0.9622 | 0.1882 | 5.1116 |
3.20×10⁻⁷ | 2.6174 | 1.8098 | 3.7852 |
| Age | 0.0914 | 0.1786 | 0.5115 | 0.6090 | 1.0957 | 0.7720 | 1.5550 |
| Gender | 0.1667 | 0.1798 | 0.9272 | 0.3538 | 1.1814 | 0.8306 | 1.6803 |
|
pathologic_stage | 0.9726 | 0.1860 | 5.2279 |
1.71×10⁻⁷ | 2.6448 | 1.8367 | 3.8085 |
| pathologic_m | 1.4008 | 0.2137 | 6.5539 |
5.61×10⁻¹¹ | 4.0583 | 2.6694 | 6.1698 |
| pathologic_n | 0.8809 | 0.1806 | 4.8763 |
1.08×10⁻⁶ | 2.4130 | 1.6935 | 3.4381 |
|
lymphatic_invasion | 0.6131 | 0.1923 | 3.1876 | 0.0014 | 1.8461 | 1.2663 | 2.6913 |
|
venous_invasion | 0.8316 | 0.2047 | 4.0620 |
4.87×10⁻⁵ | 2.2970 | 1.5378 | 3.4310 |
| Table IV.Results of multivariate Cox
regression analysis for risk score and clinical features. |
Table IV.
Results of multivariate Cox
regression analysis for risk score and clinical features.
| Clinical
features | coef. | Standard error | z-value | P-value | HR | Lower. 95 | Upper. 95 |
|---|
|
pathologic_stage | 1.7686 | 0.4753 | 3.721 | 0.0002a | 5.8624 | 2.3095 | 14.8814 |
| pathologic_n | −1.1287 | 0.468 | −2.412 | 0.0159a | 0.3235 | 0.1293 | 0.8094 |
|
venous_invasion | 0.5074 | 0.2212 | 2.294 | 0.0218a | 1.6609 | 1.0767 | 2.5622 |
| Risk score | 0.6828 | 0.2226 | 3.068 | 0.0022a | 1.9794 | 1.2796 | 3.0620 |
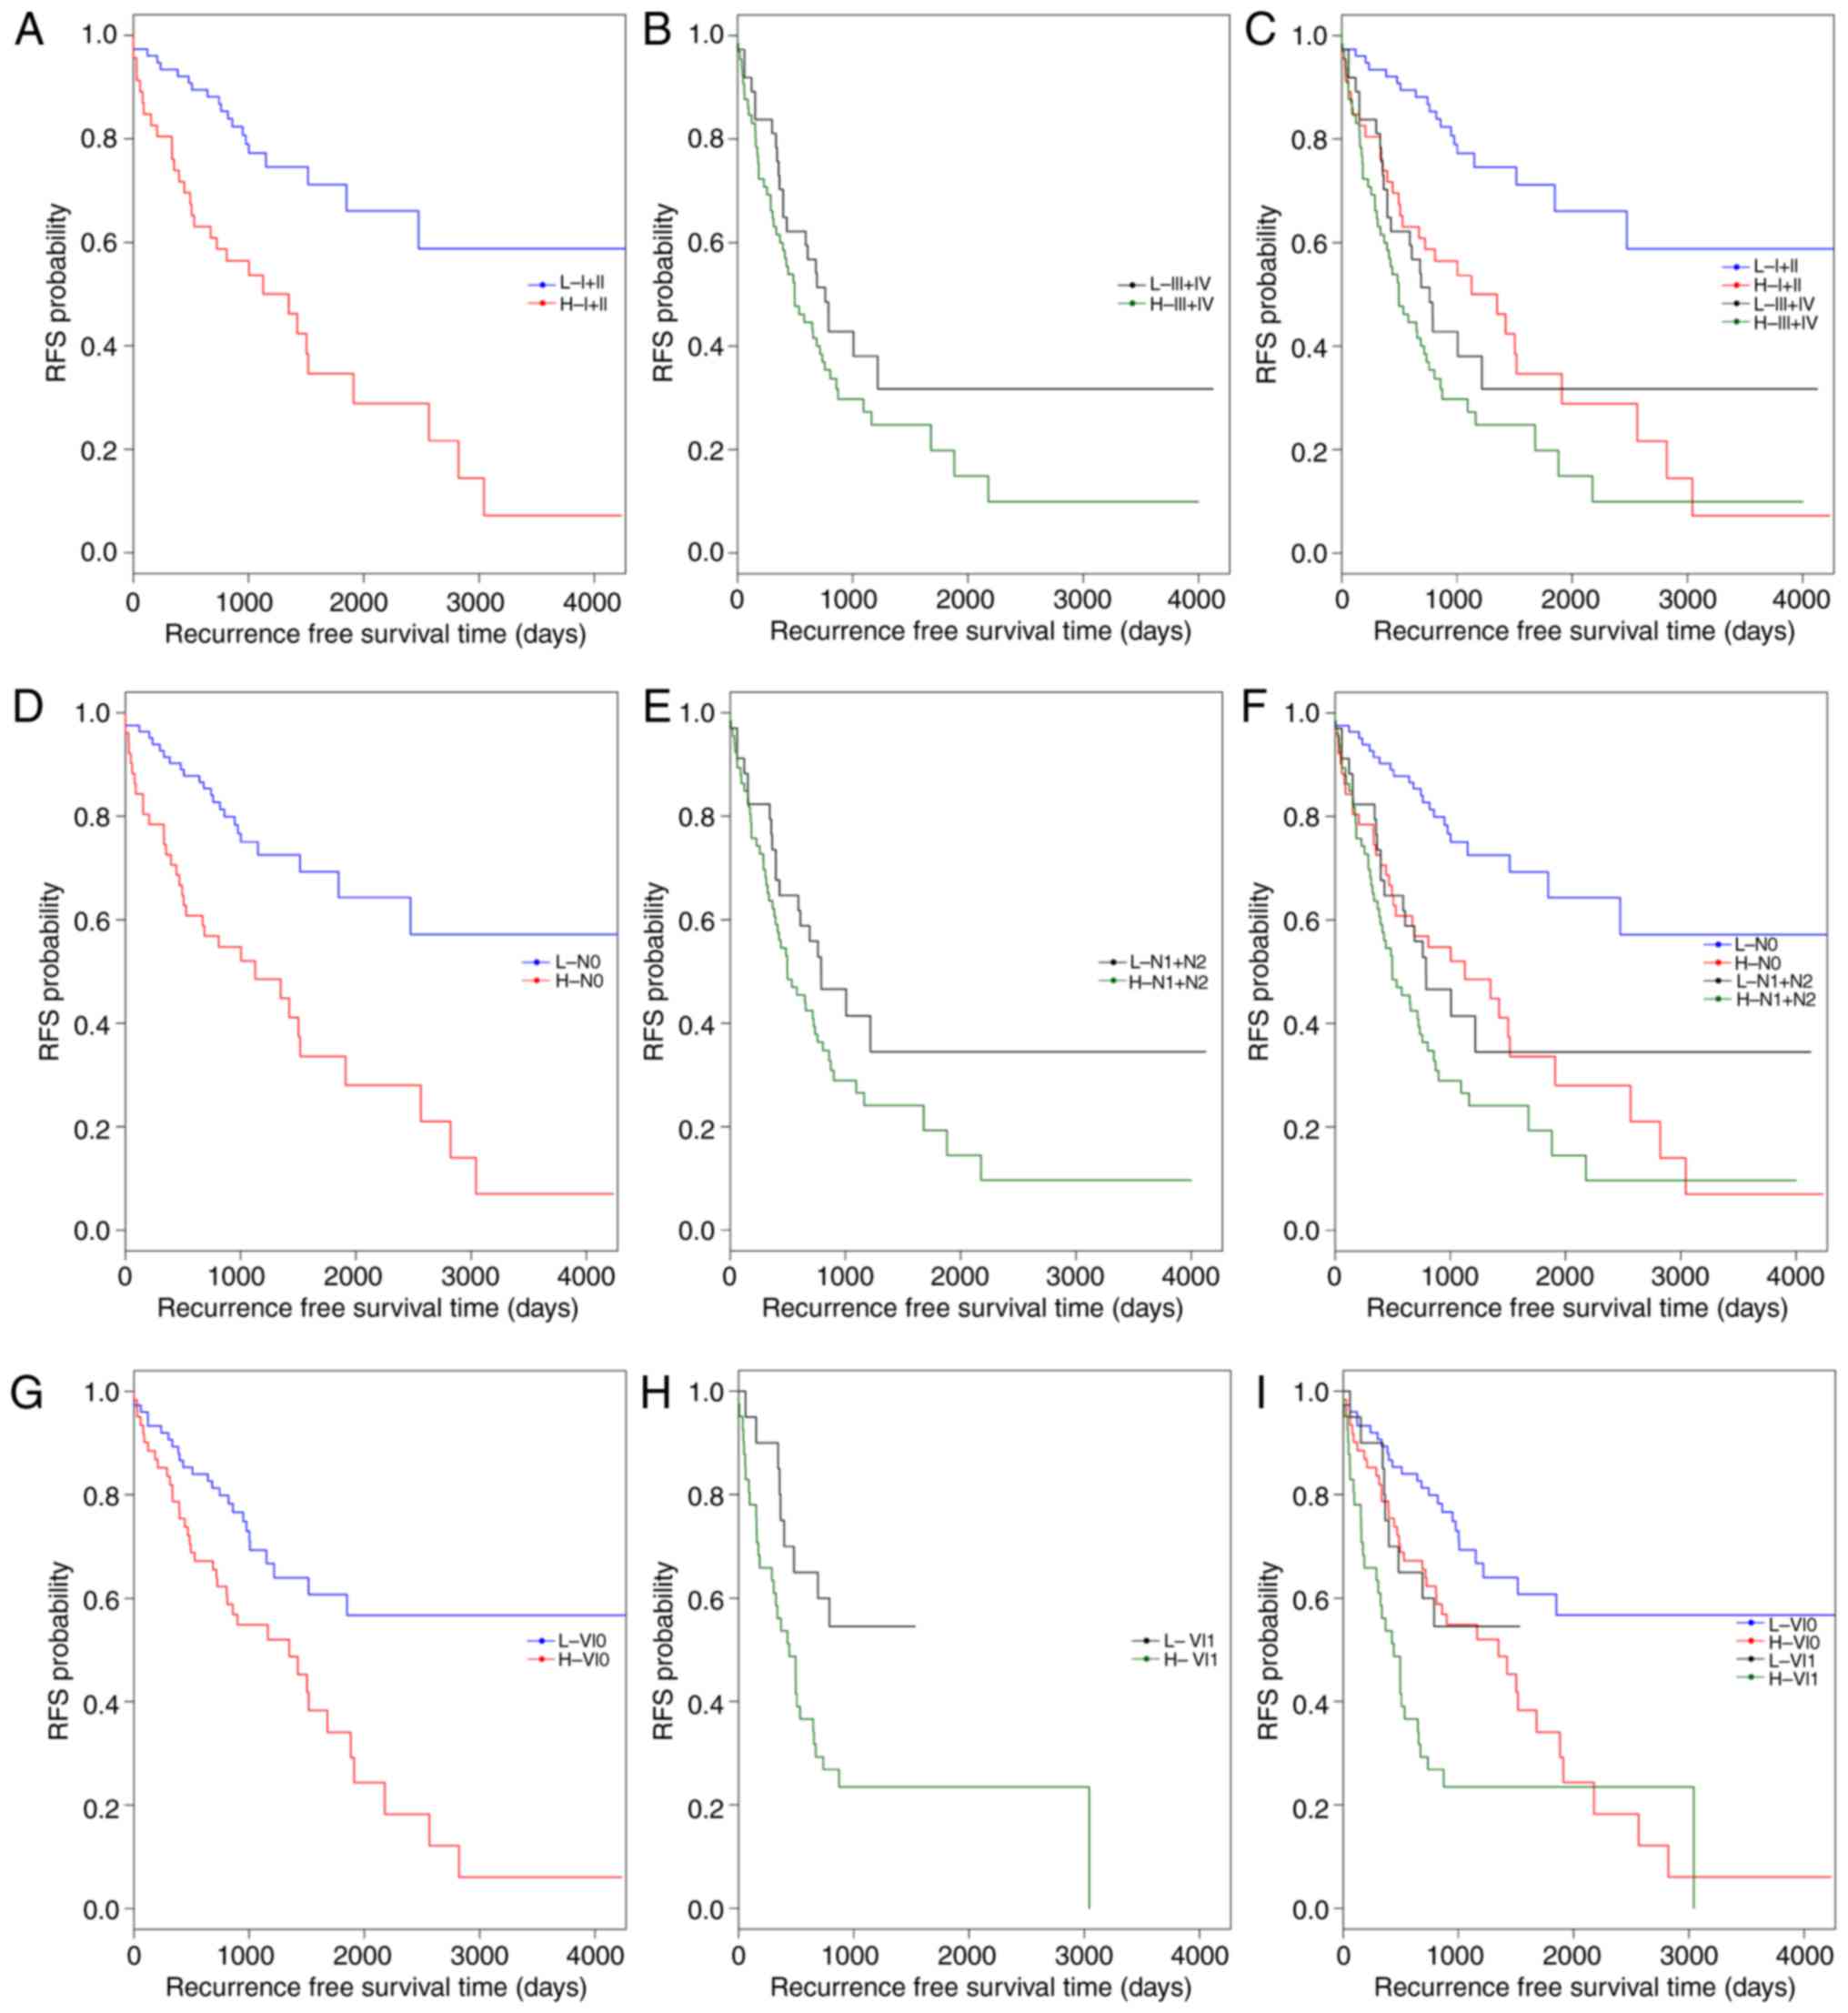
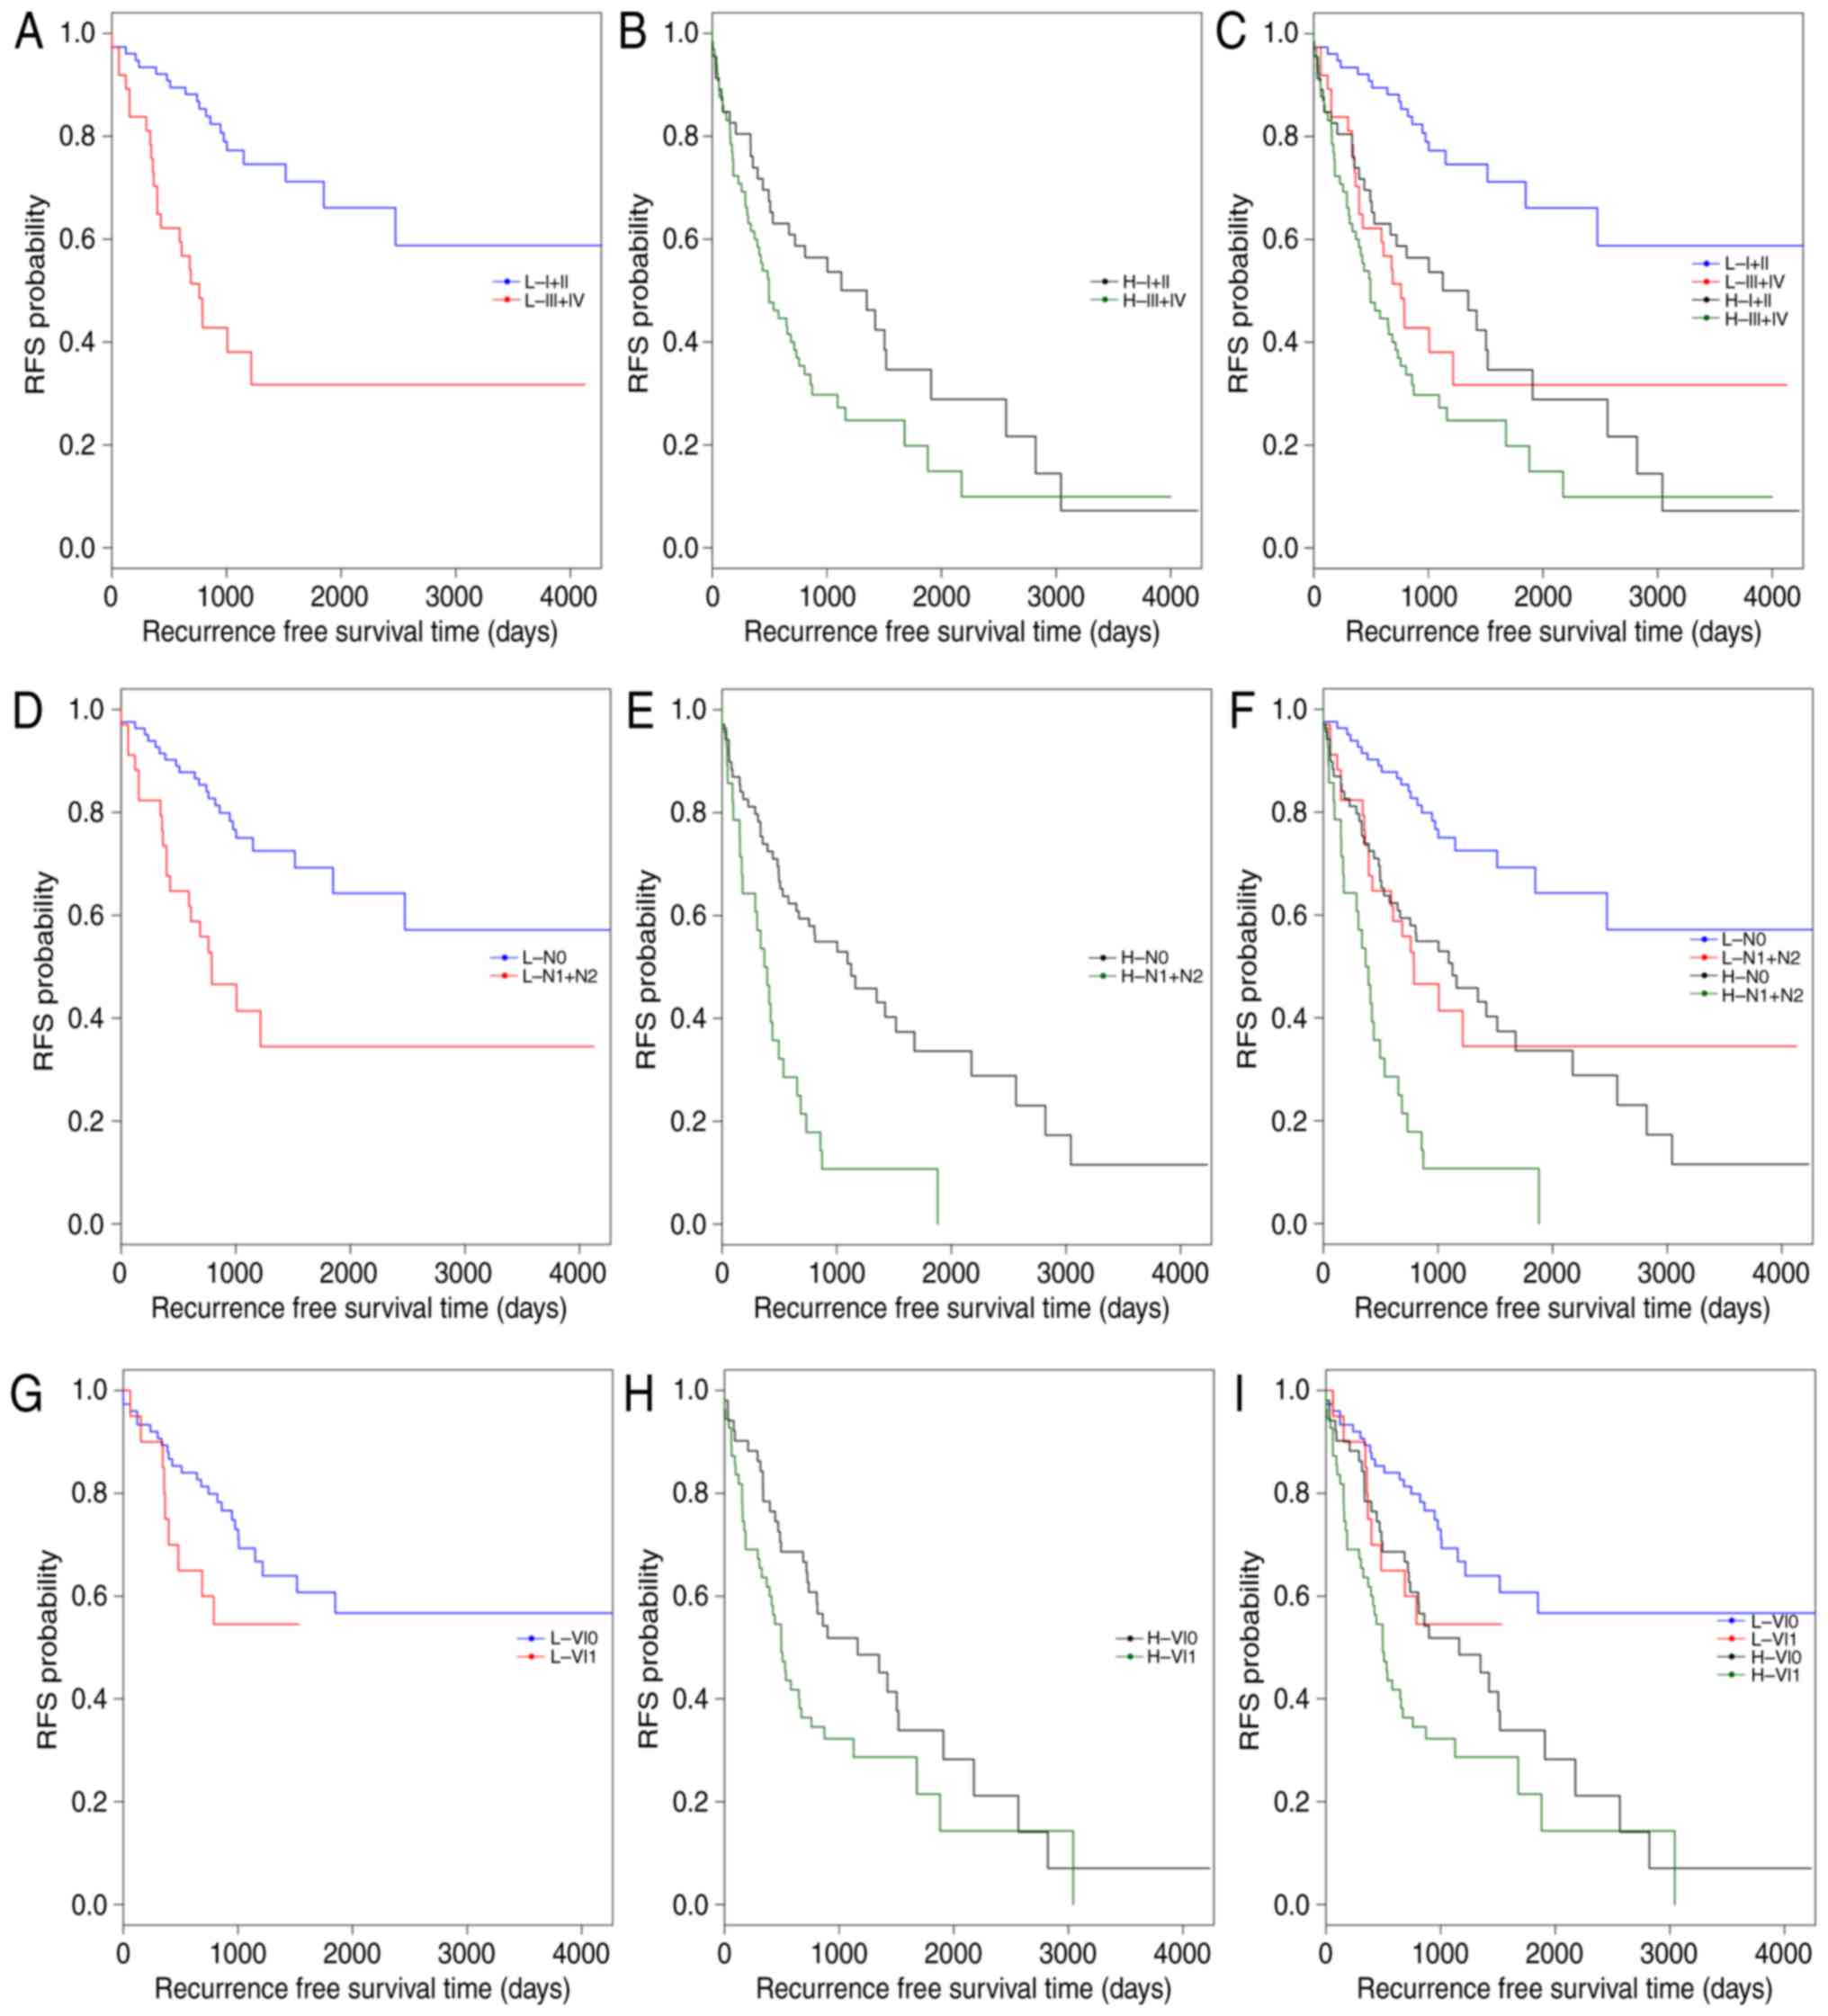
Subsequently, data stratification analysis was
conducted for pathologic_stage, pathologic_n and venous_invasion
(Fig. 4). All samples in the
training set were stratified by pathologic_stage, pathologic_n and
venous_invasion, respectively, into two groups. In each group, the
5-lncRNA based risk scoring model further split patients into a
high-risk subgroup and a low-risk subgroup (Table V). Significantly different RFS time
between high-risk and low-risk subgroups was observed in the
pathologic_stage (I+II) group (P=4×10⁻⁵; Fig. 4A and C), the pathologic_n (N0)
group (P=4×10⁻⁵; Fig. 4D
and F), and patients with or without venous_invasion (P=0.0178
and P=0.001; Fig. 4G-I). However,
the difference in RFS time between the high-risk and low-risk
subgroups was not significant in the pathologic_stage (III+IV)
group (P=0.1373; Fig. 4B) and the
pathologic_n (N1+N2) group (P=0.0883; Fig. 4E). The results of multivariate Cox
regression analysis and stratification analysis suggested that the
risk classification power of the 5-lncRNA signature-based risk
scoring system signature is independent of other clinical variables
in CRC.
| Table V.Results of data stratification
analysis. |
Table V.
Results of data stratification
analysis.
| Variables | χ2 | P-value |
|---|
| pathologic_stage
(I+II) | 16.8702 |
4×10⁻⁵ |
| pathologic_ stage
(III+IV) | 2.2082 | 0.13728 |
| pathologic_n
(N0) | 17.0432 |
4×10⁻⁵ |
| pathologic_n
(N1+N2) | 2.9055 | 0.08828 |
| venous_invasion
(No) | 10.8120 | 0.00101 |
| venous_invasion
(Yes) | 5.6180 | 0.01778 |
The present study also reported that the prognostic
value of pathologic_stage, pathologic_n and venous_invasion were
independent of risk score. For this, all patients in the training
set were first classified into high- and low-risk groups by the
risk scoring system. Each group was then stratified into two
subgroups by pathologic_stage, pathologic_n or venous_invasion,
respectively (Table VI). In both
low-risk and high-risk groups, RFS time was significantly different
between the patients at stage I+II and the patients at stage III+IV
(low-risk: P=1×10⁻⁵; high-risk: P=0.0303, respectively;
Fig. 5A-C). Similar results were
observed between the patients with pathologic N0 and the patients
with pathologic N1+N2 (low-risk: P=0.00026; high-risk: P=0.04216,
respectively; Fig. 5D-F). As
presented in Fig. 5G-I, the
difference in RFS time between the patients with and without venous
invasion was markedly significant in the high-risk group
(P=0.0068), but was not significant in the low-risk group
(P-value=0.1244). These observations confirmed that risk score,
pathologic_stage, pathologic_n and venous_invasion are independent
prognostic factors in CRC.
| Table VI.Results of data stratification
analysis. |
Table VI.
Results of data stratification
analysis.
| Risk | Clinical
features | χ2 | P-value |
|---|
| Low risk | pathologic_stage
(I+II vs. III+IV) | 19.1067 | 0.00001 |
| High risk | pathologic_stage
(I+II vs. III+IV) | 4.6771 | 0.03033 |
| Low risk | pathologic_n (N0
vs. N1+N2) | 13.3250 | 0.00026 |
| High risk | pathologic_n (N0
vs. N1+N2) | 4.1289 | 0.04216 |
| Low risk | venous_invasion (No
vs. Yes) | 2.3605 | 0.12444 |
| High risk | venous_invasion (No
vs. Yes) | 7.3158 | 0.00684 |
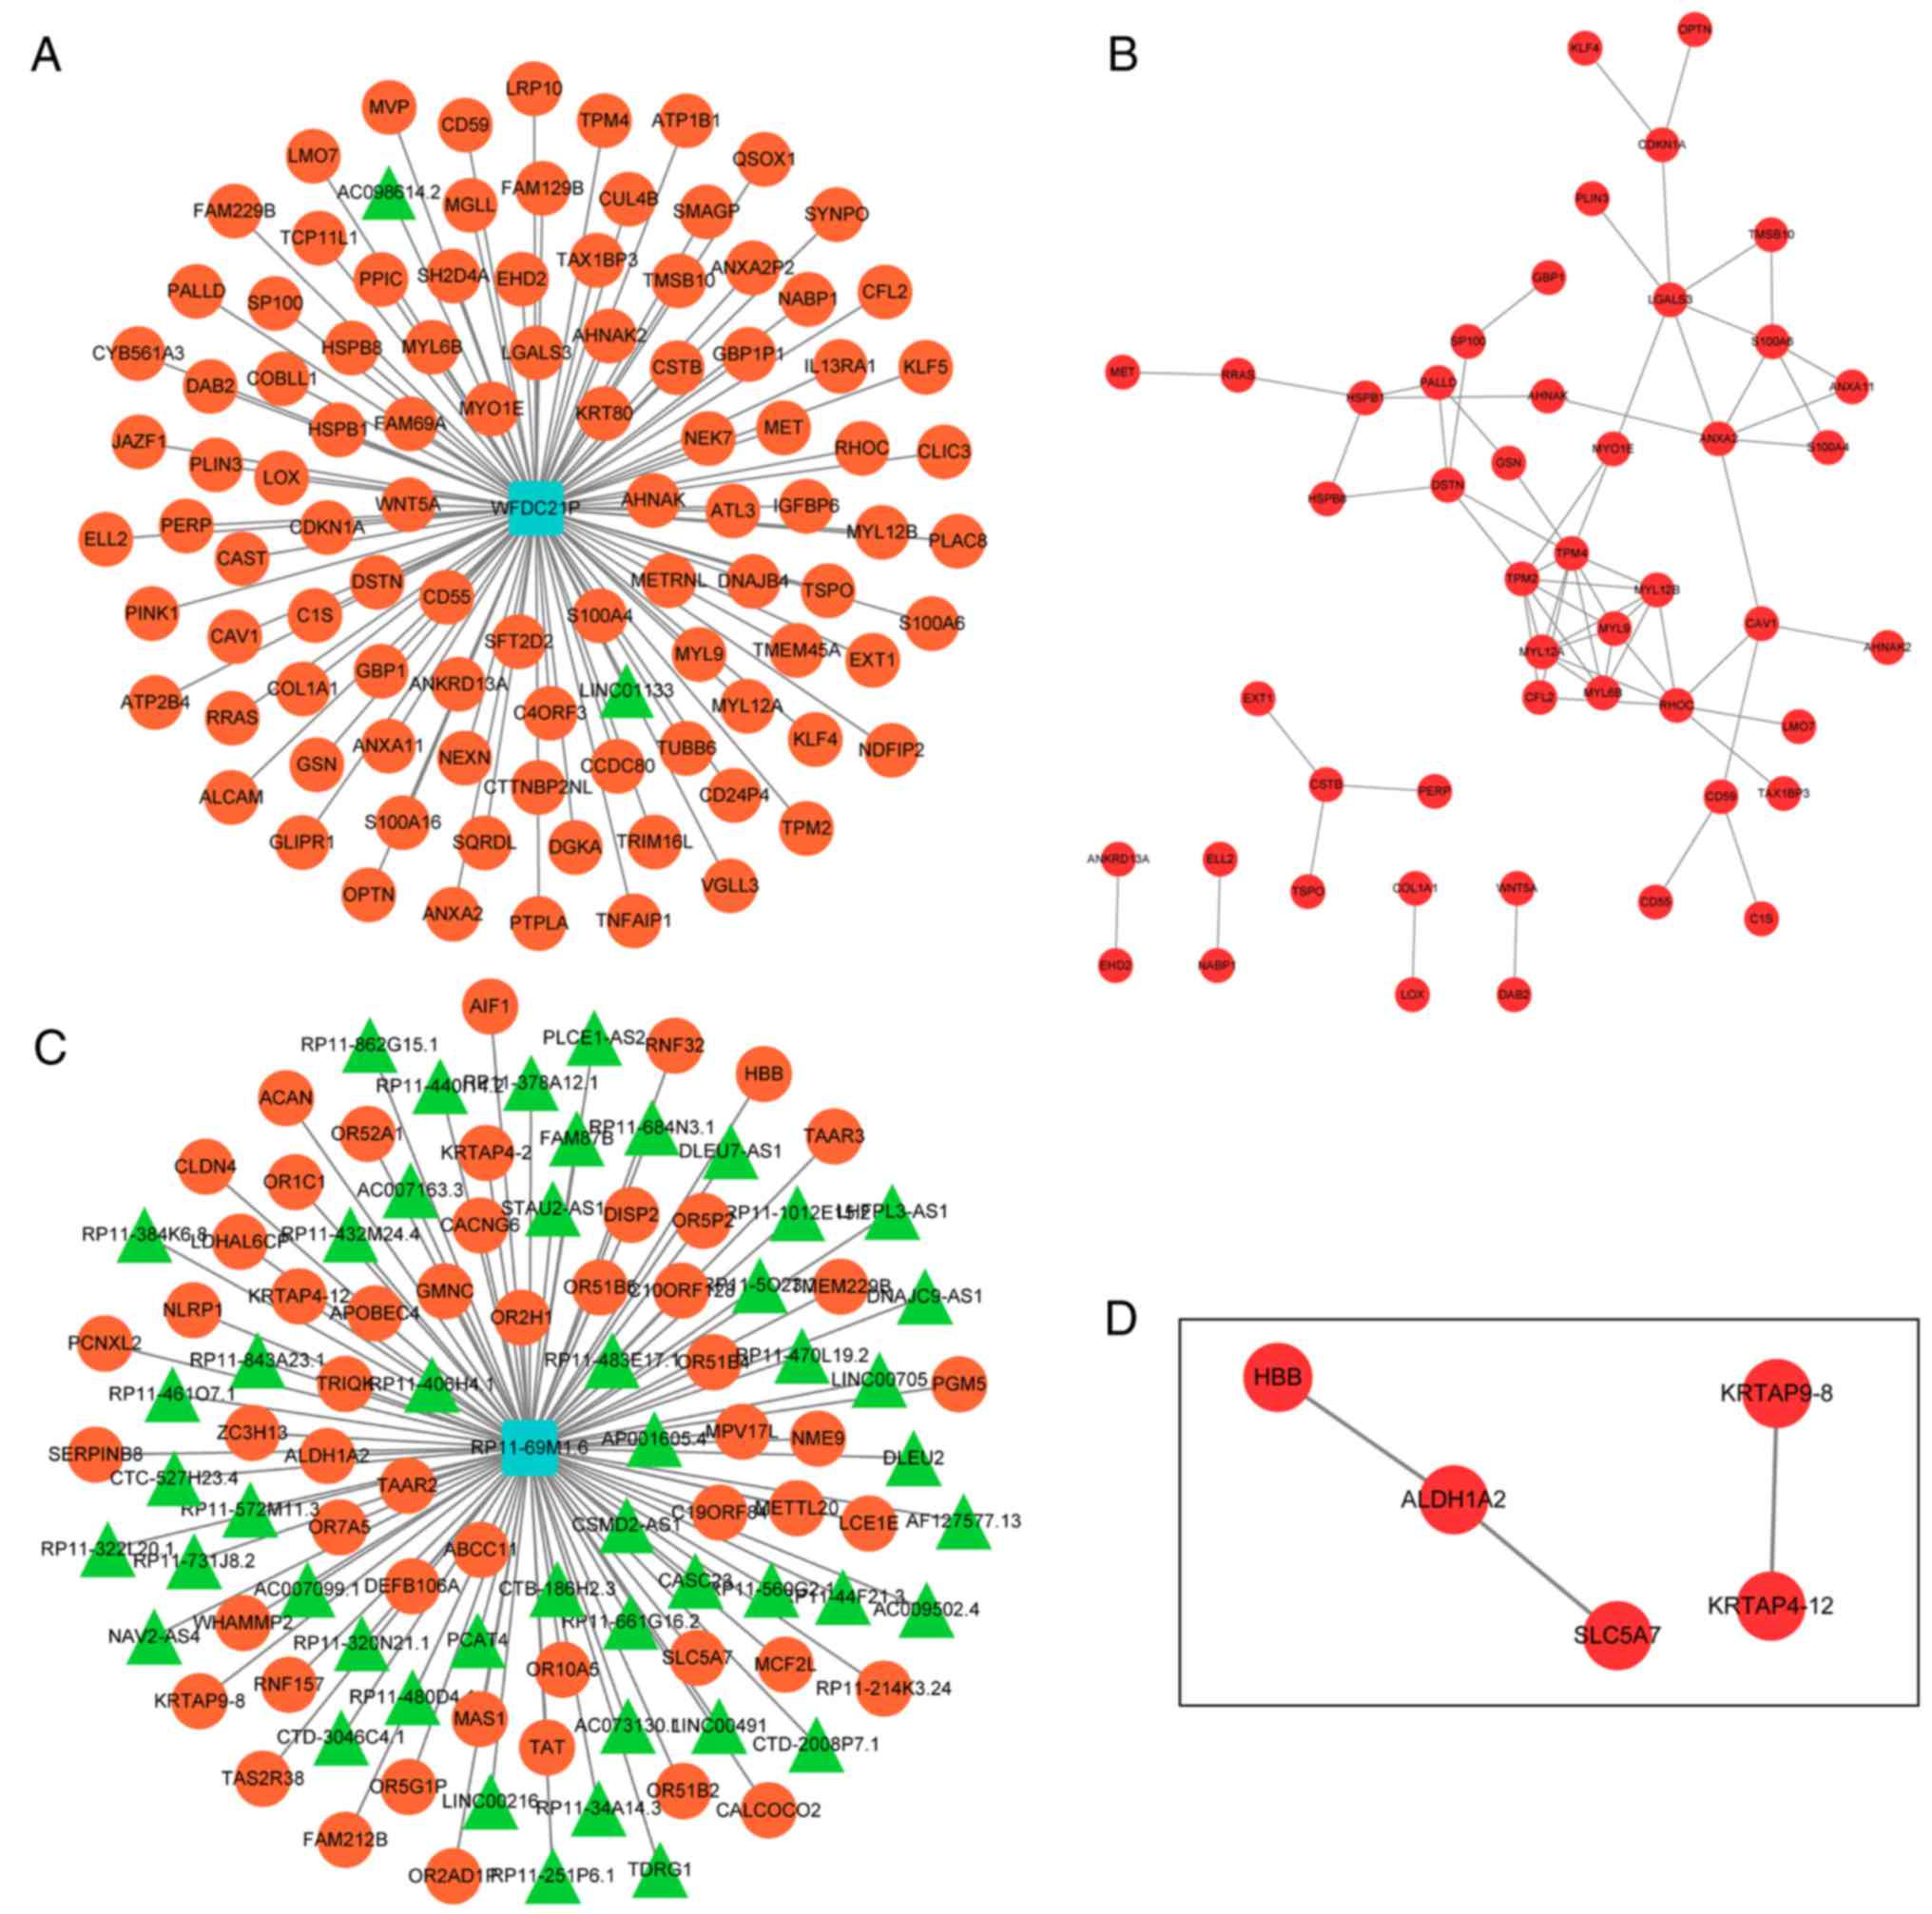
Analysis of co-expressed genes of
prognostic lncRNAs
Since lncRNAs may serve their biological roles by
regulating their co-expressed genes, co-expressed genes of the 5
lncRNAs were searched using the MEM tool. Only co-expressed genes
of WFDC21P and RP11-69M1.6 were obtained. The top 100 co-expressed
genes of WFDC21P or RP11-69M1.6 were used to construct lncRNA-gene
networks. PPI networks were also generated to analyze the
interactions between the genes in each lncRNA-gene network
(Fig. 6).
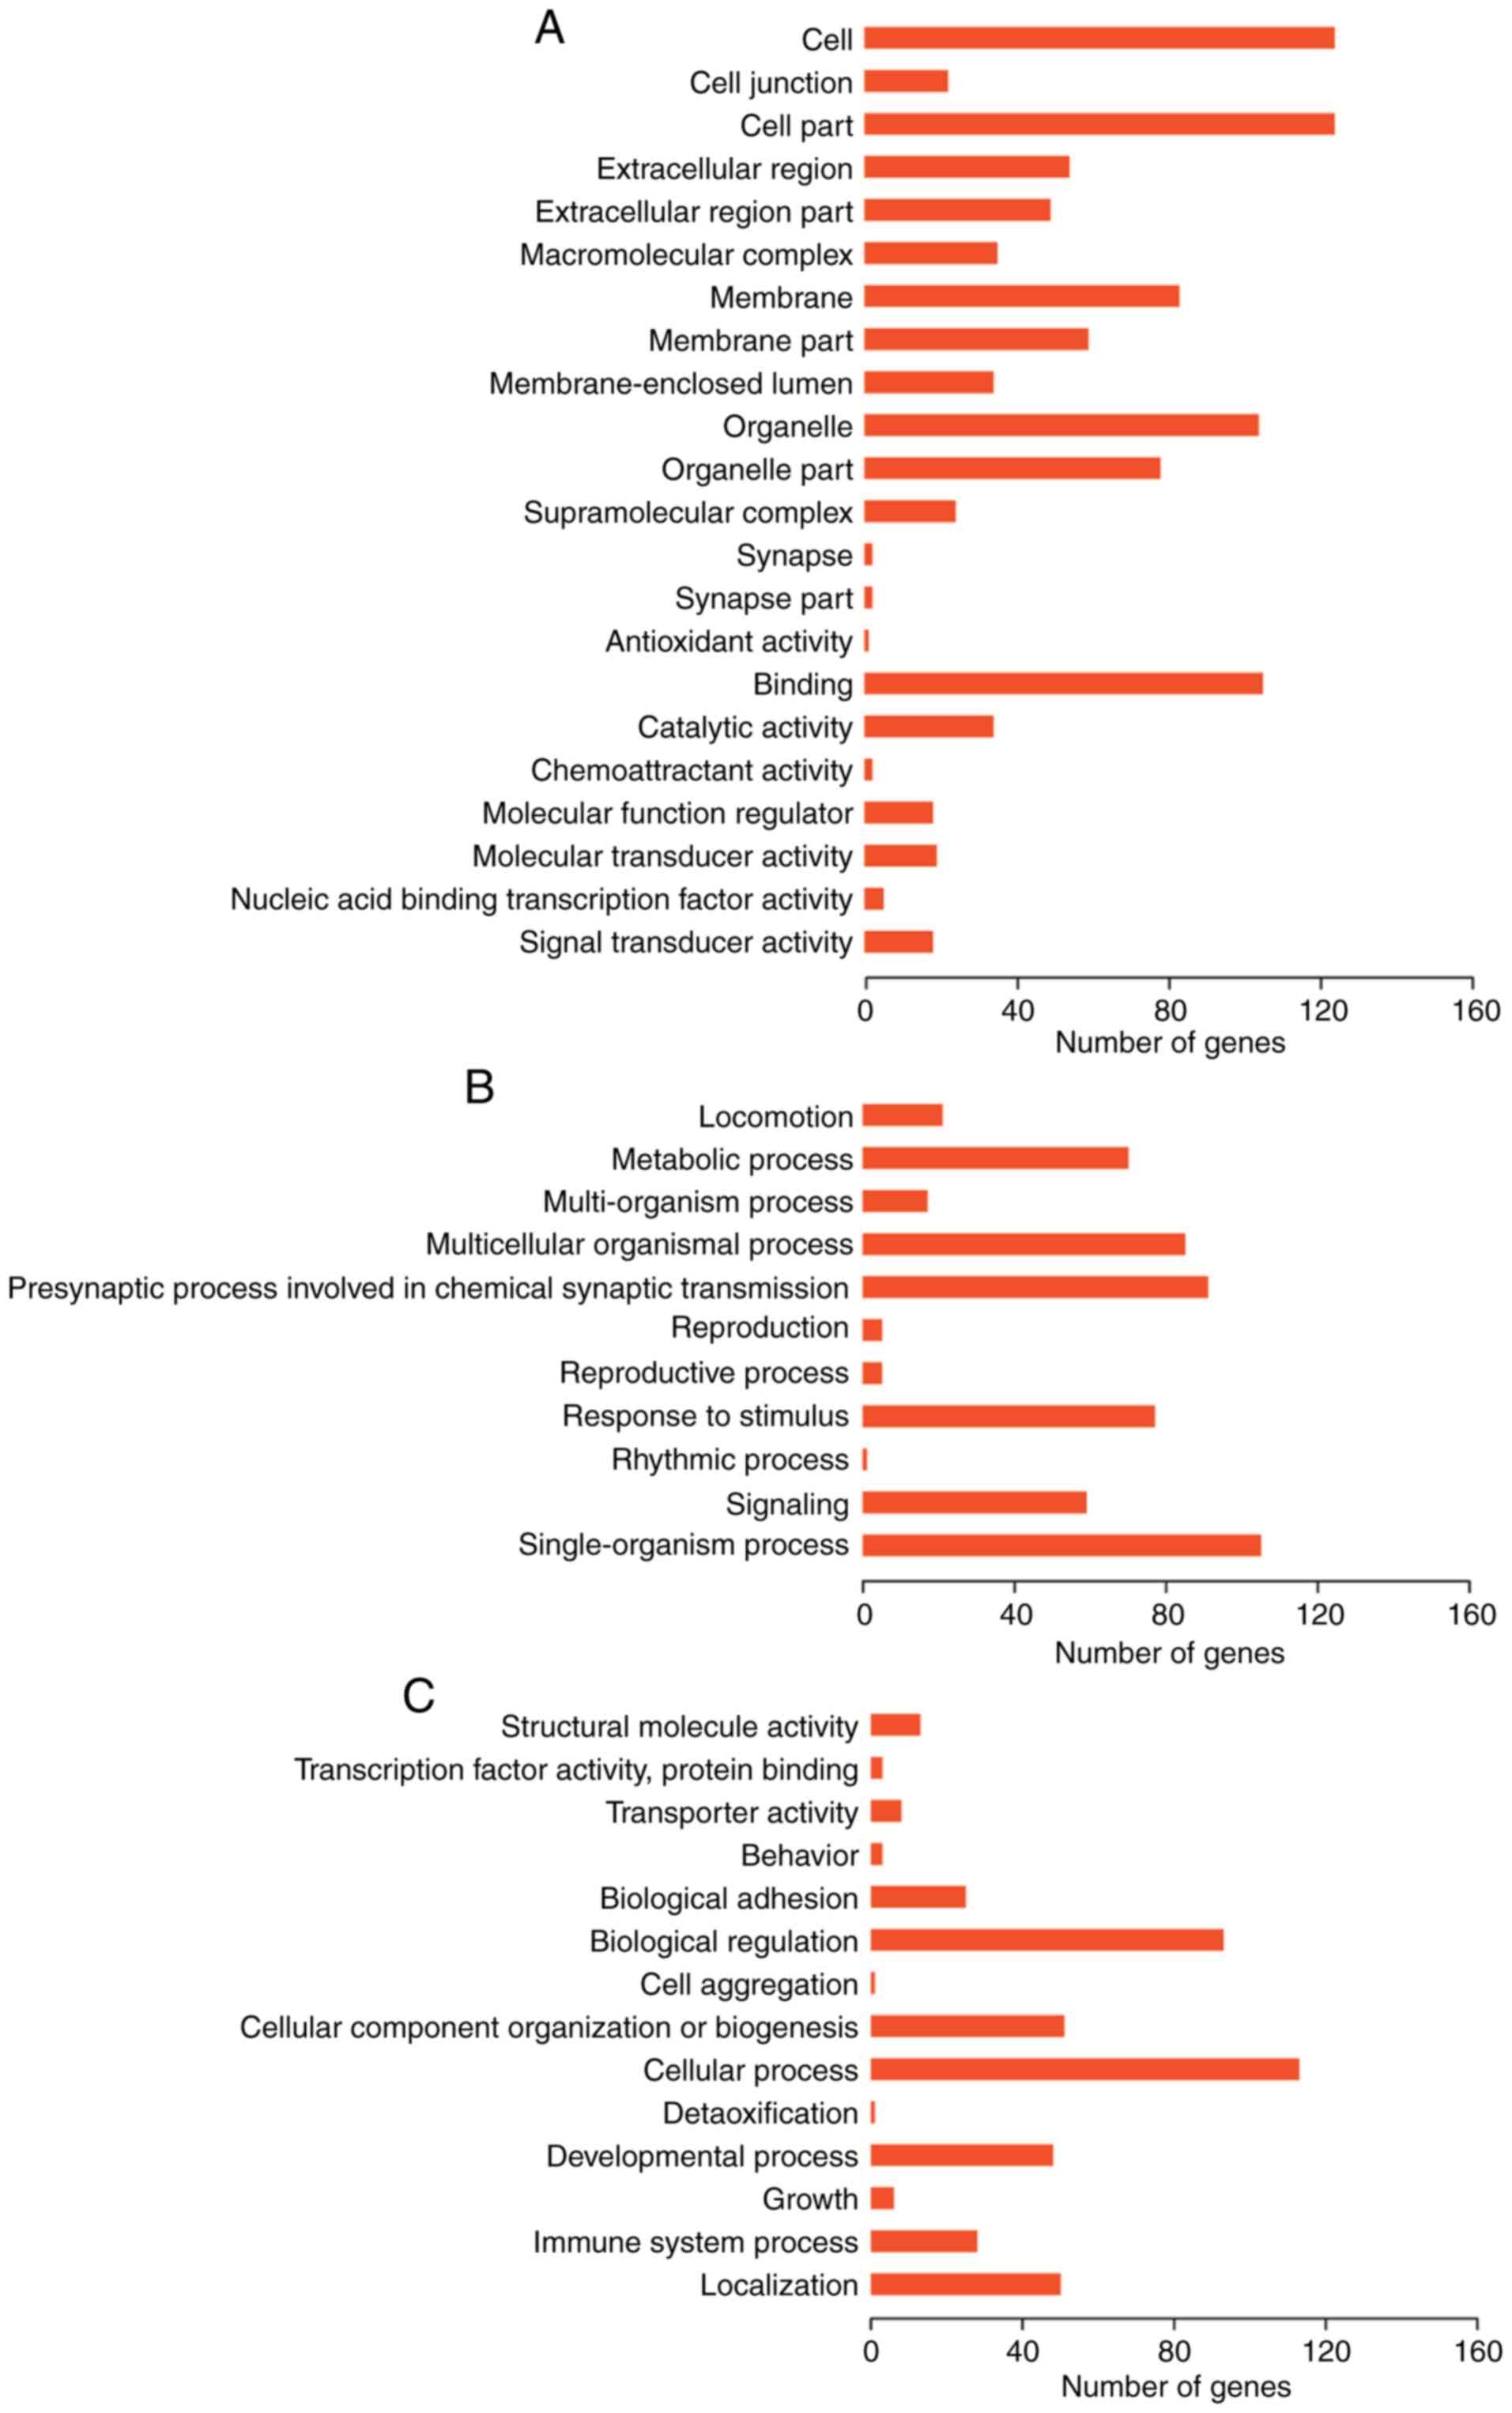
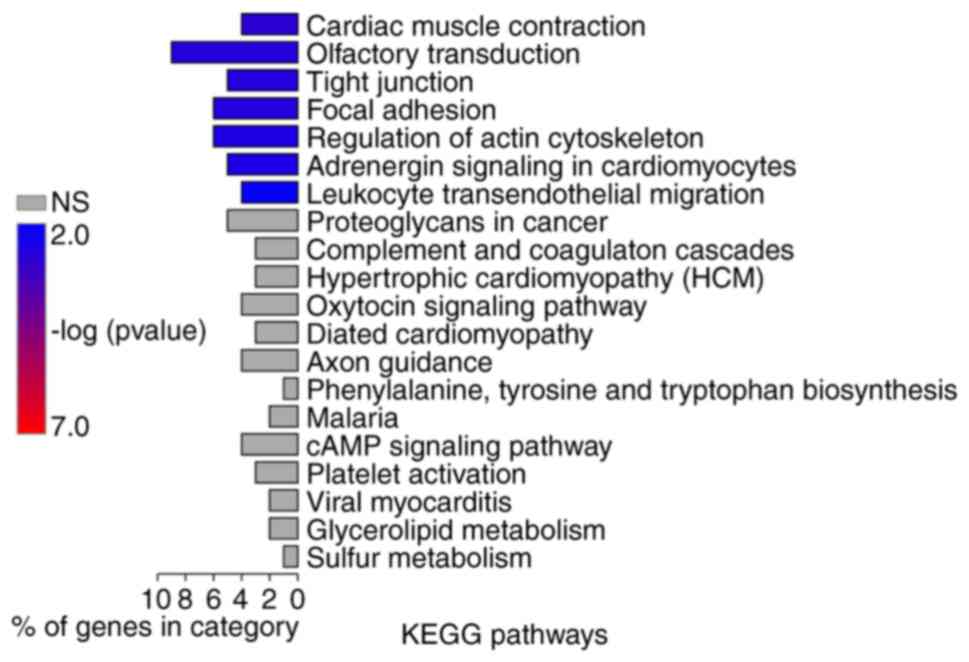
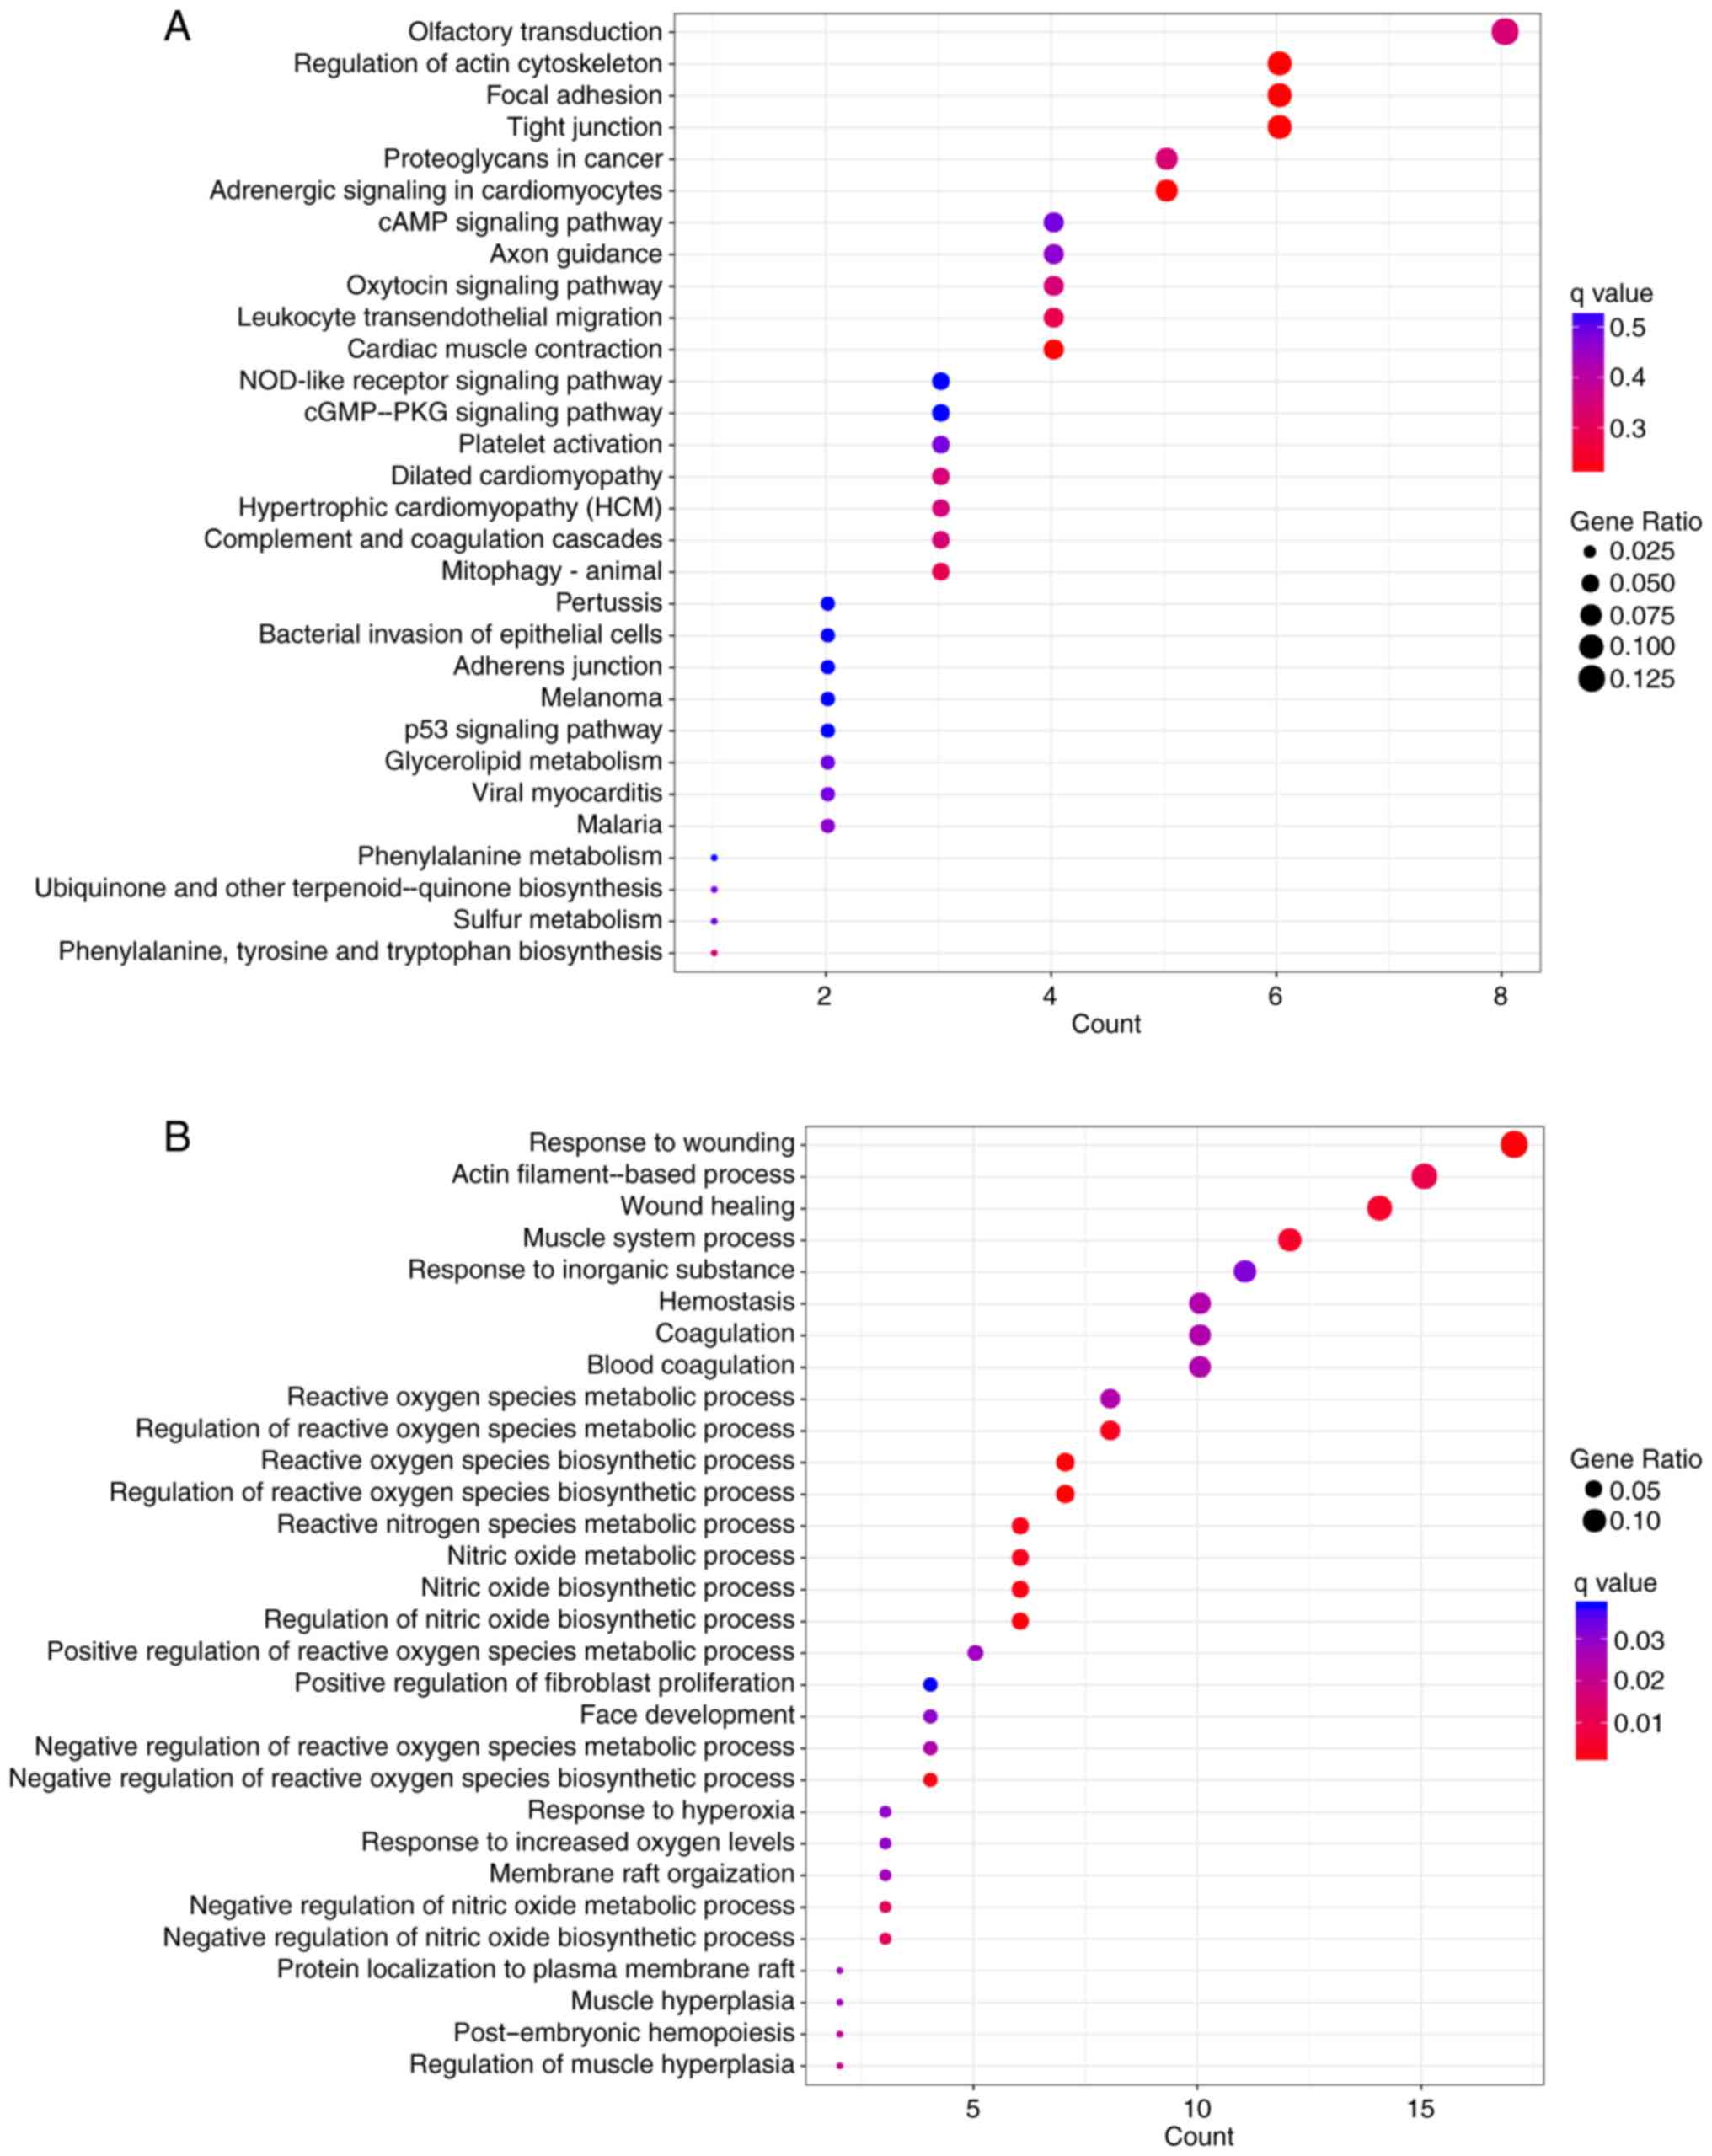
Function analysis
GO function and KEGG pathway enrichment analyses
were performed on genes in the two lncRNA-gene networks. GO
enrichment analysis using GOATOOLS suggested that these genes were
possibly associated with ‘cell membrane’, ‘organelle’ and other
cellular components (Fig. 7).
Pathway enrichment analysis conducted by KOBAS or ClusterProfiler
revealed that these genes were significantly associated with
numerous pathways, including ‘tight junction’, ‘focal adhesion’,
‘regulation of actin cytoskeleton’ and ‘leukocyte transendothelial
migration’ (Figs. 8 and 9A). According to the results of GO
enrichment analysis by ClusterProfiler, these genes were
significantly associated with numerous GO BP terms, including
‘wound healing’, ‘reactive oxygen species (ROS) metabolism’ and
‘nitric oxide metabolism’ (Fig.
9B).
Discussion
CRC remains a major cause of mortality worldwide.
Numerous lncRNAs have been reported to be involved in CRC
tumorigenesis; however, there is a lack of efficient prognostic
lncRNAs to refine the prediction of survival for patients with CRC
(24). In order to define a
prognostic lncRNA signature, the present study identified 82 DELs
between CRC patients with good and poor prognoses in the training
set. Among these DELs, WFDC21P, LINC02159, RP11-452L6.6,
RP11-894P9.1 and RP11-69M1.6 were demonstrated to be significantly
associated with prognosis via multivariate Cox regression analysis.
Based on the expression of these 5 lncRNAs, a risk scoring system
was generated. The results of the present study revealed that the
5-lncRNA signature-based risk scoring system may categorize
patients into high- and low-risk groups with significantly varying
RFS times in the training set and the testing set.
WFDC21P, namely lnc-dendritic cell (lnc-DC) has been
observed to be exclusively expressed in human DCs and mediates the
differentiation of monocytes to DCs via the activation of signal
transducer and activator of transcription 3, which is a
transcription factor that regulates numerous immune-associated
genes (25,26). Wu et al (27) suggested that lnc-DC in plasma may
be a possible biomarker for systemic lupus erythematosus. In
addition, Zhang et al (28)
reported that lnc-DC expression is increased in decidua, resulting
in over-maturation of decidual DCs and increased T helper 1 cells
in patients with preeclampsia. RP11-894P9.1 has been observed to be
abnormally expressed in the right ventricle of the heart during
heart failure (29); however, to
the best of our knowledge, aberrant expression levels of WFDC21P
and RP11-894P9.1 have previously not been reported in CRC. The
functions of LINC02159, RP11-452L6.6, and RP11-69M1.6 remain
unknown, and further investigations into lncRNA expression in
cancer are required. The present study suggested that the 5-lncRNA
signature may be a promising prognostic biomarker for CRC.
Previous studies have revealed the predictive value
of T stage, venous invasion and lymph node metastasis in patients
with CRC (30,31). Furthermore, in the present study,
multivariate Cox regression analysis demonstrated that
pathologic_stage, pathologic_n and venous_invasion were
independently associated with prognosis. In addition, the results
of data stratification analysis indicated that the prognostic value
of the 5-lncRNA signature-based risk score may be independent of
other clinical variables in CRC in the present study; therefore,
the 5-lncRNA signature may aid in improving current prognostic
approaches.
In order to uncover associated biological processes
and signaling pathways of the 5-lncRNA signature, the present study
attempted to identify the co-expressed genes of the 5 lncRNAs by
MEM analysis. Only co-expressed genes of WFDC21P and RP11-69M1.6
were reported and lncRNA-gene networks were subsequently generated,
followed by the construction of PPI networks to visualize the
interactions between these genes. Furthermore, according to KEGG
pathway enrichment analysis, these genes were significantly
associated with ‘tight junction’, ‘focal adhesion’ and ‘regulation
of actin cytoskeleton’ pathways. ‘Tight junction’ and ‘focal
adhesion’ pathways are key determinants in tumor progression and
metastasis (32,33). The ‘regulation of actin
cytoskeleton’ pathway has been associated with cancer cell motility
(34). Furthermore, the present
study demonstrated that the genes in these lncRNA-gene networks
were significantly associated with numerous GO BP terms that were
associated with ‘ROS metabolism’ or ‘nitric oxide metabolism’. It
has been established that abnormal ROS accumulation is a critical
contributor to tumorigenesis (35). In addition, Colin et al
(36) suggested that ROS may be
involved in the development of resistance against resveratrol in
colon cancer cells. Studies have also demonstrated that nitric
oxide is an important regulator of tumor metabolism (37,38).
These findings suggested that the 5-lncRNA signature may possibly
be involved in ‘tight junction’, ‘focal adhesion’ and ‘regulation
of actin cytoskeleton’ pathways, and ‘ROS metabolism’ and ‘nitric
oxide metabolism’ in CRC by regulating the co-expressed genes.
Some limitations of the present study should be
mentioned. Experiments were not conducted, and the size of the
patient cohort may be further expanded. Therefore, future studies
with larger patient cohorts are warranted to verify the prognostic
significance of the 5-lncRNA signature prior to its use in clinical
practice.
In conclusion, the present study identified a
5-lncRNA signature that may have great potential as a prognostic
biomarker for CRC, and developed a 5-lncRNA signature-based risk
scoring system as a prognostic classification system. Furthermore,
the underlying signaling pathways and biological processes
associated with the 5-lncRNA signature in CRC were investigated.
These findings may aid in refining the stratification approach for
the clinical assessment of prognosis, and provide guidance on
tailored therapeutic strategies and patient management; however,
further investigation is required to validate the findings of the
present study.
Acknowledgements
The authors would like to thank Dr Min Yu for
providing assistance in data collection and entry.
Funding
No funding was received.
Availability of data and materials
The datasets used and/or analyzed during the current
study are available from the corresponding author on reasonable
request.
Authors' contributions
LG wrote the manuscript. LG, JY, QW, BX, LY and LJ
performed the data analyses. JY and LY revised the manuscript and
provided important suggestions for the analyses. HC and XZ
conceptualized the study design. All authors read and approved the
final manuscript.
Ethics approval and consent to
participate
Not applicable.
Consent for publication
Not applicable.
Competing interests
The authors declare that they have no competing
interests.
References
|
1
|
Miller KD, Siegel RL, Lin CC, Mariotto AB,
Kramer JL, Rowland JH, Stein KD, Alteri R and Jemal A: Cancer
treatment and survivorship statistics, 2016. CA Cancer J Clin.
66:271–289. 2016. View Article : Google Scholar : PubMed/NCBI
|
|
2
|
Brenner H, Kloor M and Pox CP: Colorectal
cancer. Lancet. 383:1490–1502. 2014. View Article : Google Scholar : PubMed/NCBI
|
|
3
|
García Sánchez J: Colonoscopic polypectomy
and long-term prevention of colorectal cancer deaths. Rev Clin Esp.
212:4082012.(In Spanish).
|
|
4
|
Li X, Wu Z, Fu X and Han W: lncRNAs:
Insights into their function and mechanics in underlying disorders.
Mutat Res Rev Mutat Res. 762:1–21. 2014. View Article : Google Scholar : PubMed/NCBI
|
|
5
|
Schmitt AM and Chang HY: Long noncoding
RNAs in cancer pathways. Cancer Cell. 29:452–463. 2016. View Article : Google Scholar : PubMed/NCBI
|
|
6
|
Huarte M: The emerging role of lncRNAs in
cancer. Nat Med. 21:1253–1261. 2015. View
Article : Google Scholar : PubMed/NCBI
|
|
7
|
Zheng HT, Shi DB, Wang YW, Li XX, Xu Y,
Tripathi P, Gu WL, Cai GX and Cai SJ: High expression of lncRNA
MALAT1 suggests a biomarker of poor prognosis in colorectal cancer.
Int J Clin Exp Pathol. 7:3174–3181. 2014.PubMed/NCBI
|
|
8
|
Ge X, Chen Y, Liao X, Liu D, Li F, Ruan H
and Jia W: Overexpression of long noncoding RNA PCAT-1 is a novel
biomarker of poor prognosis in patients with colorectal cancer. Med
Oncol. 30:5882013. View Article : Google Scholar : PubMed/NCBI
|
|
9
|
Qi P, Xu MD, Ni SJ, Huang D, Wei P, Tan C,
Zhou XY and Du X: Low expression of LOC285194 is associated with
poor prognosis in colorectal cancer. J Transl Med. 11:1222013.
View Article : Google Scholar : PubMed/NCBI
|
|
10
|
Ozawa T, Matsuyama T, Toiyama Y, Takahashi
N, Ishikawa T, Uetake H, Yamada Y, Kusunoki M, Calin G and Goel A:
CCAT1 and CCAT2 long noncoding RNAs, located within the 8q.24.21
‘gene desert’, serve as important prognostic biomarkers in
colorectal cancer. Ann Oncol. 28:1882–1888. 2017. View Article : Google Scholar : PubMed/NCBI
|
|
11
|
Harrow J, Frankish A, Gonzalez JM,
Tapanari E, Diekhans M, Kokocinski F, Aken BL, Barrell D, Zadissa
A, Searle S, et al: GENCODE: the reference human genome annotation
for The ENCODE Project. Genome Res. 22:1760–1774. 2012. View Article : Google Scholar : PubMed/NCBI
|
|
12
|
Sillar B and Plint CW: The price of a
false-negative result of mammography and an overenthusiastic lay
press. Med J Aust. 151:4181989.PubMed/NCBI
|
|
13
|
Robinson MD, McCarthy DJ and Smyth GK:
edgeR: A Bioconductor package for differential expression analysis
of digital gene expression data. Bioinformatics. 26:139–140. 2010.
View Article : Google Scholar : PubMed/NCBI
|
|
14
|
McCarthy DJ, Chen Y and Smyth GK:
Differential expression analysis of multifactor RNA-Seq experiments
with respect to biological variation. Nucleic Acids Res.
40:4288–4297. 2012. View Article : Google Scholar : PubMed/NCBI
|
|
15
|
Love MI, Huber W and Anders S: Moderated
estimation of fold change and dispersion for RNA-seq data with
DESeq2. Genome Biol. 15:5502014. View Article : Google Scholar : PubMed/NCBI
|
|
16
|
Wang P, Wang Y, Bo H, Zou X and Mao JH: A
novel gene expression-based prognostic scoring system to predict
survival in gastric cancer. Oncotarget. 7:55343–55351.
2016.PubMed/NCBI
|
|
17
|
Zhou M, Wang X, Shi H, Cheng L, Wang Z,
Zhao H, Yang L and Sun J: Characterization of long non-coding
RNA-associated ceRNA network to reveal potential prognostic lncRNA
biomarkers in human ovarian cancer. Oncotarget. 7:12598–12611.
2016.PubMed/NCBI
|
|
18
|
Kolde R, Laur S, Adler P and Vilo J:
Robust rank aggregation for gene list integration and
meta-analysis. Bioinformatics. 28:573–580. 2012. View Article : Google Scholar : PubMed/NCBI
|
|
19
|
Adler P, Kolde R, Kull M, Tkachenko A,
Peterson H, Reimand J and Vilo J: Mining for coexpression across
hundreds of datasets using novel rank aggregation and visualization
methods. Genome Biol. 10:R1392009. View Article : Google Scholar : PubMed/NCBI
|
|
20
|
Shannon P, Markiel A, Ozier O, Baliga NS,
Wang JT, Ramage D, Amin N, Schwikowski B and Ideker T: Cytoscape: A
software environment for integrated models of biomolecular
interaction networks. Genome Res. 13:2498–2504. 2003. View Article : Google Scholar : PubMed/NCBI
|
|
21
|
Szklarczyk D, Morris JH, Cook H, Kuhn M,
Wyder S, Simonovic M, Santos A, Doncheva NT, Roth A, Bork P, et al:
The STRING database in 2017: Quality-controlled protein-protein
association networks, made broadly accessible. Nucleic Acids Res.
45:D362–D368. 2017. View Article : Google Scholar : PubMed/NCBI
|
|
22
|
Xie C, Mao X, Huang J, Ding Y, Wu J, Dong
S, Kong L, Gao G, Li CY and Wei L: KOBAS 2.0: A web server for
annotation and identification of enriched pathways and diseases.
Nucleic Acids Res. 39:W316–W322. 2011. View Article : Google Scholar : PubMed/NCBI
|
|
23
|
Yu G, Wang LG, Han Y and He QY:
clusterProfiler: An R package for comparing biological themes among
gene clusters. OMICS. 16:284–287. 2012. View Article : Google Scholar : PubMed/NCBI
|
|
24
|
Xu MD, Qi P and Du X: Long non-coding RNAs
in colorectal cancer: Implications for pathogenesis and clinical
application. Mod Pathol. 27:1310–1320. 2014. View Article : Google Scholar : PubMed/NCBI
|
|
25
|
Wang P, Xue Y, Han Y, Lin L, Wu C, Xu S,
Jiang Z, Xu J, Liu Q and Cao X: The STAT3-binding long noncoding
RNA lnc-DC controls human dendritic cell differentiation. Science.
344:310–313. 2014. View Article : Google Scholar : PubMed/NCBI
|
|
26
|
Li Q and Liu Q: Noncoding RNAs in Cancer
Immunology. Adv Exp Med Biol. 927:2432016. View Article : Google Scholar : PubMed/NCBI
|
|
27
|
Wu GC, Li J, Leng RX, Li XP, Li XM, Wang
DG, Pan HF and Ye DQ: Identification of long non-coding RNAs GAS5,
linc0597 and lnc-DC in plasma as novel biomarkers for systemic
lupus erythematosus. Oncotarget. 8:23650–23663. 2017.PubMed/NCBI
|
|
28
|
Zhang W, Zhou Y and Ding Y: Lnc-DC
mediates the over-maturation of decidual dendritic cells and
induces the increase in Th1 cells in preeclampsia. Am J Reprod
Immunol. 77:2017. View Article : Google Scholar
|
|
29
|
Di Salvo TG, Guo Y, Su YR, Clark T,
Brittain E, Absi T, Maltais S and Hemnes A: Right ventricular long
noncoding RNA expression in human heart failure. Pulm Circ.
5:135–161. 2015. View
Article : Google Scholar : PubMed/NCBI
|
|
30
|
Roxburgh CS, Mcmillan DC, Richards CH,
Atwan M, Anderson JH, Harvey T, Horgan PG and Foulis AK: The
clinical utility of the combination of T stage and venous invasion
to predict survival in patients undergoing surgery for colorectal
cancer. Ann Surg. 259:1156–1165. 2014. View Article : Google Scholar : PubMed/NCBI
|
|
31
|
Berger AC, Sigurdson ER, Levoyer T, Hanlon
A, Mayer RJ, Macdonald JS, Catalano PJ and Haller DG: Colon cancer
survival is associated with decreasing ratio of metastatic to
examined lymph nodes. J Clin Oncol. 23:8706–8712. 2005. View Article : Google Scholar : PubMed/NCBI
|
|
32
|
Martin TA: The role of tight junctions in
cancer metastasis. Semin Cell Dev Biol. 36:224–231. 2014.
View Article : Google Scholar : PubMed/NCBI
|
|
33
|
Eke I and Cordes N: Focal adhesion
signaling and therapy resistance in cancer. Seminars in Cancer
Biol. 31:65–75. 2015. View Article : Google Scholar
|
|
34
|
Olson MF and Sahai E: The actin
cytoskeleton in cancer cell motility. Clin Exp Metastasis.
26:273–287. 2009. View Article : Google Scholar : PubMed/NCBI
|
|
35
|
Costa A, Scholerdahirel A and
Mechta-Grigoriou F: The role of reactive oxygen species and
metabolism on cancer cells and their microenvironment. Semin Cancer
Biol. 25:23–32. 2014. View Article : Google Scholar : PubMed/NCBI
|
|
36
|
Colin DJ, Limagne E, Ragot K, Lizard G,
Ghiringhelli F, Solary É, Chauffert B, Latruffe N and Delmas D: The
role of reactive oxygen species and subsequent DNA-damage response
in the emergence of resistance towards resveratrol in colon cancer
models. Cell Death Dis. 5:e15332014. View Article : Google Scholar : PubMed/NCBI
|
|
37
|
Chang CF, Diers AR and Hogg N: Cancer cell
metabolism and the modulating effects of nitric oxide. Free Radic
Biol Med. 79:324–336. 2015. View Article : Google Scholar : PubMed/NCBI
|
|
38
|
Wink DA, Vodovotz Y, Laval J, Laval F,
Dewhirst MW and Mitchell JB: The multifaceted roles of nitric oxide
in cancer. Carcinogenesis. 19:711–721. 1998. View Article : Google Scholar : PubMed/NCBI
|