Introduction
Acute myocardial infarction (AMI) is the most common
and serious cardiovascular disease that can induce rapid heart
failure and sudden cardiac mortality. Although a declining trend of
AMI has been observed due to economic development, its incidence
remains high at approximately 44.57 per 100,000 individuals in 2013
(1). In addition, the mortality
rate in China was estimated to increase from 1987 to 2014 by
5.6-fold (2), particularly amongst
young females (3). Thus, the
development of strategies for the early diagnosis of AMI to prevent
the occurrence of sudden mortality is increasingly important.
Other than ischemic symptoms, physical examination
and electrocardiogram changes, cardiac troponins are the most
commonly used biomarker for the clinical diagnosis of AMI (4,5).
However, their sensitivity and specificity may be limited, as
increased cardiac troponin levels are also observed in patients
with non-acute coronary syndrome (6–8).
Therefore, research has attempted to develop more sensitive and
specific or combined type biomarkers for AMI. Mcmahon et al
(9) evaluated the diagnostic
efficacy of heart-type fatty acid-binding protein (H-FABP), cardiac
troponin I (cTnI), creatine kinase-MB and myoglobin for the early
detection of AMI and demonstrated that H-FABP has the greatest
sensitivity at 0–3 h (64.3%) and 3–6 h (85.3%) following the onset
of chest pain. The combination of cTnI and H-FABP measurements
increases the levels of sensitivity to 71.4, 88.2, and 92.4% at
0–3, 3–6 and 6–12 h, respectively (9). Similarly, Pyati et al
(10) indicated that H-FABP has
additional diagnostic power for the early diagnosis of AMI, with
its diagnostic efficiency markedly higher than that of CK-MB and
myoglobin within the first 6 h of chest pain (10). Wang et al (11) used receiver operating
characteristic curve analysis to reveal that the diagnostic
accuracy of circulating monomeric C-reactive protein may be as high
as 0.928 [95% confidence interval (CI), 0.887–0.969] for AMI
(11), whereas Han et al
(12) suggested that the plasma
level of RING finger protein 207 may detect individuals with AMI
with 90.5% sensitivity and 100% specificity (12). However, a limited number of genes
were associated with the occurrence of AMI.
The aim of the current study was to further identify
new biomarkers for the clinical diagnosis of AMI via an analysis of
the gene-expression differences of peripheral blood samples between
Chinese patients with AMI and healthy controls.
Materials and methods
AMI microarray data
Transcriptomics data were collected from the
National Center of Biotechnology Information Gene Expression
Omnibus database (NCBI GEO; www.ncbi.nlm.nih.gov/geo) under accession number
GSE97320 (study not published). This database contained the
peripheral blood samples of three patients with AMI (mean age,
53.0±13.1) and three healthy controls (mean age, 53.7±4.7). These
participants were Han Chinese and were recruited from the
Department of Cardiology at China-Japan Union Hospital, Jilin
University of China (Changchun, China).
Data normalization and differentially
expressed gene (DEG) identification
Raw Affymetrix Human Gene CEL files were
preprocessed and normalized using the Robust Multichip Average
algorithm (13) using the
Bioconductor affy package (version 1.34.2; www.bioconductor.org/packages/release/bioc/html/affy.html)
in R (version 3.4.1; http://www.R-project.org/) (14). The DEGs between patients with AMI
and healthy controls were screened using the limma method (15) using the Bioconductor package in R
(version 3.32.5; www.bioconductor.org/packages/release/bioc/html/limma.html).
P<0.05 and |log fold change (FC)|>1 were set as the threshold
values. A heatmap of the top 50 DEGs was constructed using the
pheatmap package in R (Version 0.7.7; cran.r-project.org/web/packages/pheatmap/index.html).
Protein-protein interaction (PPI)
network construction
To screen for the crucial genes associated with AMI,
DEGs were mapped into the PPI data retrieved from the Search Tool
for the Retrieval of Interacting Genes database (version 10.0;
www.string-db.org) (16) to construct the PPI network; the
cut-off value was set as a combined score of >0.9. The PPI
network was visualized using Cytoscape 2.8 (www.cytoscape.org) (17). The hub genes with the highest
degree were selected and plotted using the ggplot2 package in R
(version 1.0.0; cran.r-project.org/web/packages/ggplot2/index.html).
To identify functionally related and highly interconnected clusters
within the PPI network, a module analysis was subsequently
performed using the Molecular Complex Detection (MCODE) plugin of
Cytoscape with the following parameters: Degree cutoff, 6; node
score cutoff, 0.2; k-core, 5; and maximum depth, 100 (version 2.2;
www.baderlab.org/Software/MCODE) (18). Modules with MCODE scores of ≥5 and
≥6 nodes were considered significant.
microRNA (miRNA/miR) prediction
To further screen for the crucial genes associated
with AMI, microRNAs known to be associated with AMI were obtained
from the mir2disease database (www.mir2disease.org) that documents 1,939
relationships between 349 human microRNAs and 163 human diseases
based on a review of >3,273 published papers (19). The target genes of the
AMI-associated miRNAs were predicted using the miRWalk2 database
(zmf.umm.uni-heidelberg.de/apps/zmf/mirwalk2)
(20), which provides the largest
collection of predicted and experimentally verified miR-target
interactions using various miRNA databases. The predicted target
genes were subsequently overlapped with the DEGs to obtain the
miRNA-DEGs interaction relationships, which were used to construct
the miRNA-DEG interaction network. These genes were visualized
using Cytoscape 2.8 (www.cytoscape.org) (17).
Functional enrichment analysis
Kyoto Encyclopedia of Genes and genomes (KEGG)
(21) pathway and Gene Ontology
(GO) (22) enrichment analyses
were performed to explore the underlying functions of all DEGs,
genes in modules and miRNA-DEG networks using the Database for
Annotation, Visualization and Integrated Discovery (DAVID) online
tool (version 6.8; david.abcc.ncifcrf.gov). P<0.05 was selected as the
threshold for determining the significant enrichment for GO and
KEGG analyses.
Validation analysis
AMI microarray data were also collected from other
countries via the NCBI GEO database under accession number GSE24519
(study not published). This database includes the whole blood
samples of 17 Italian patients with AMI and 2 healthy individuals.
Two biological repeats were performed for each patient, resulting
in 34 AMI and four control samples for analysis.
To investigate the relationship between the DEGs
under investigation and various clinical characteristics, the
microarray datasets of GSE34198 (23) and GSE48060 (24) were also downloaded from the NCBI
GEO database. In the GSE34198 dataset (23), 97 peripheral whole blood samples
were obtained, including 45 from 41 patients with AMI (four
patients had two repeats) who were alive during the follow-up
period, four from four patients with AMI who succumbed to the
disease during the 6 month follow-up period, and 48 from 45
controls (three patients had two repeats) from the Czech Republic.
In the GSE48060 dataset (24), 52
peripheral whole blood samples were available, including 21
controls and patients with AMI from the USA with (n=5) or without
(n=22) any recurrent events over an 18-month follow-up period.
All of the validated datasets were preprocessed and
the DEGs between the AMI and control groups as well as between the
subgroups of patients with AMI who succumbed to the disease
(recurrence) and those who lived (non-recurrence) were identified
using the methods similar to those described above for the GSE97320
dataset. To visualize the shared DEGs between the validated
datasets and the Chinese dataset GSE97320, a Venn diagram was
generated using a web-based tool
(bioinformatics.psb.ugent.be/webtools/Venn).
Results
Identification of the DEGs in
GSE97320
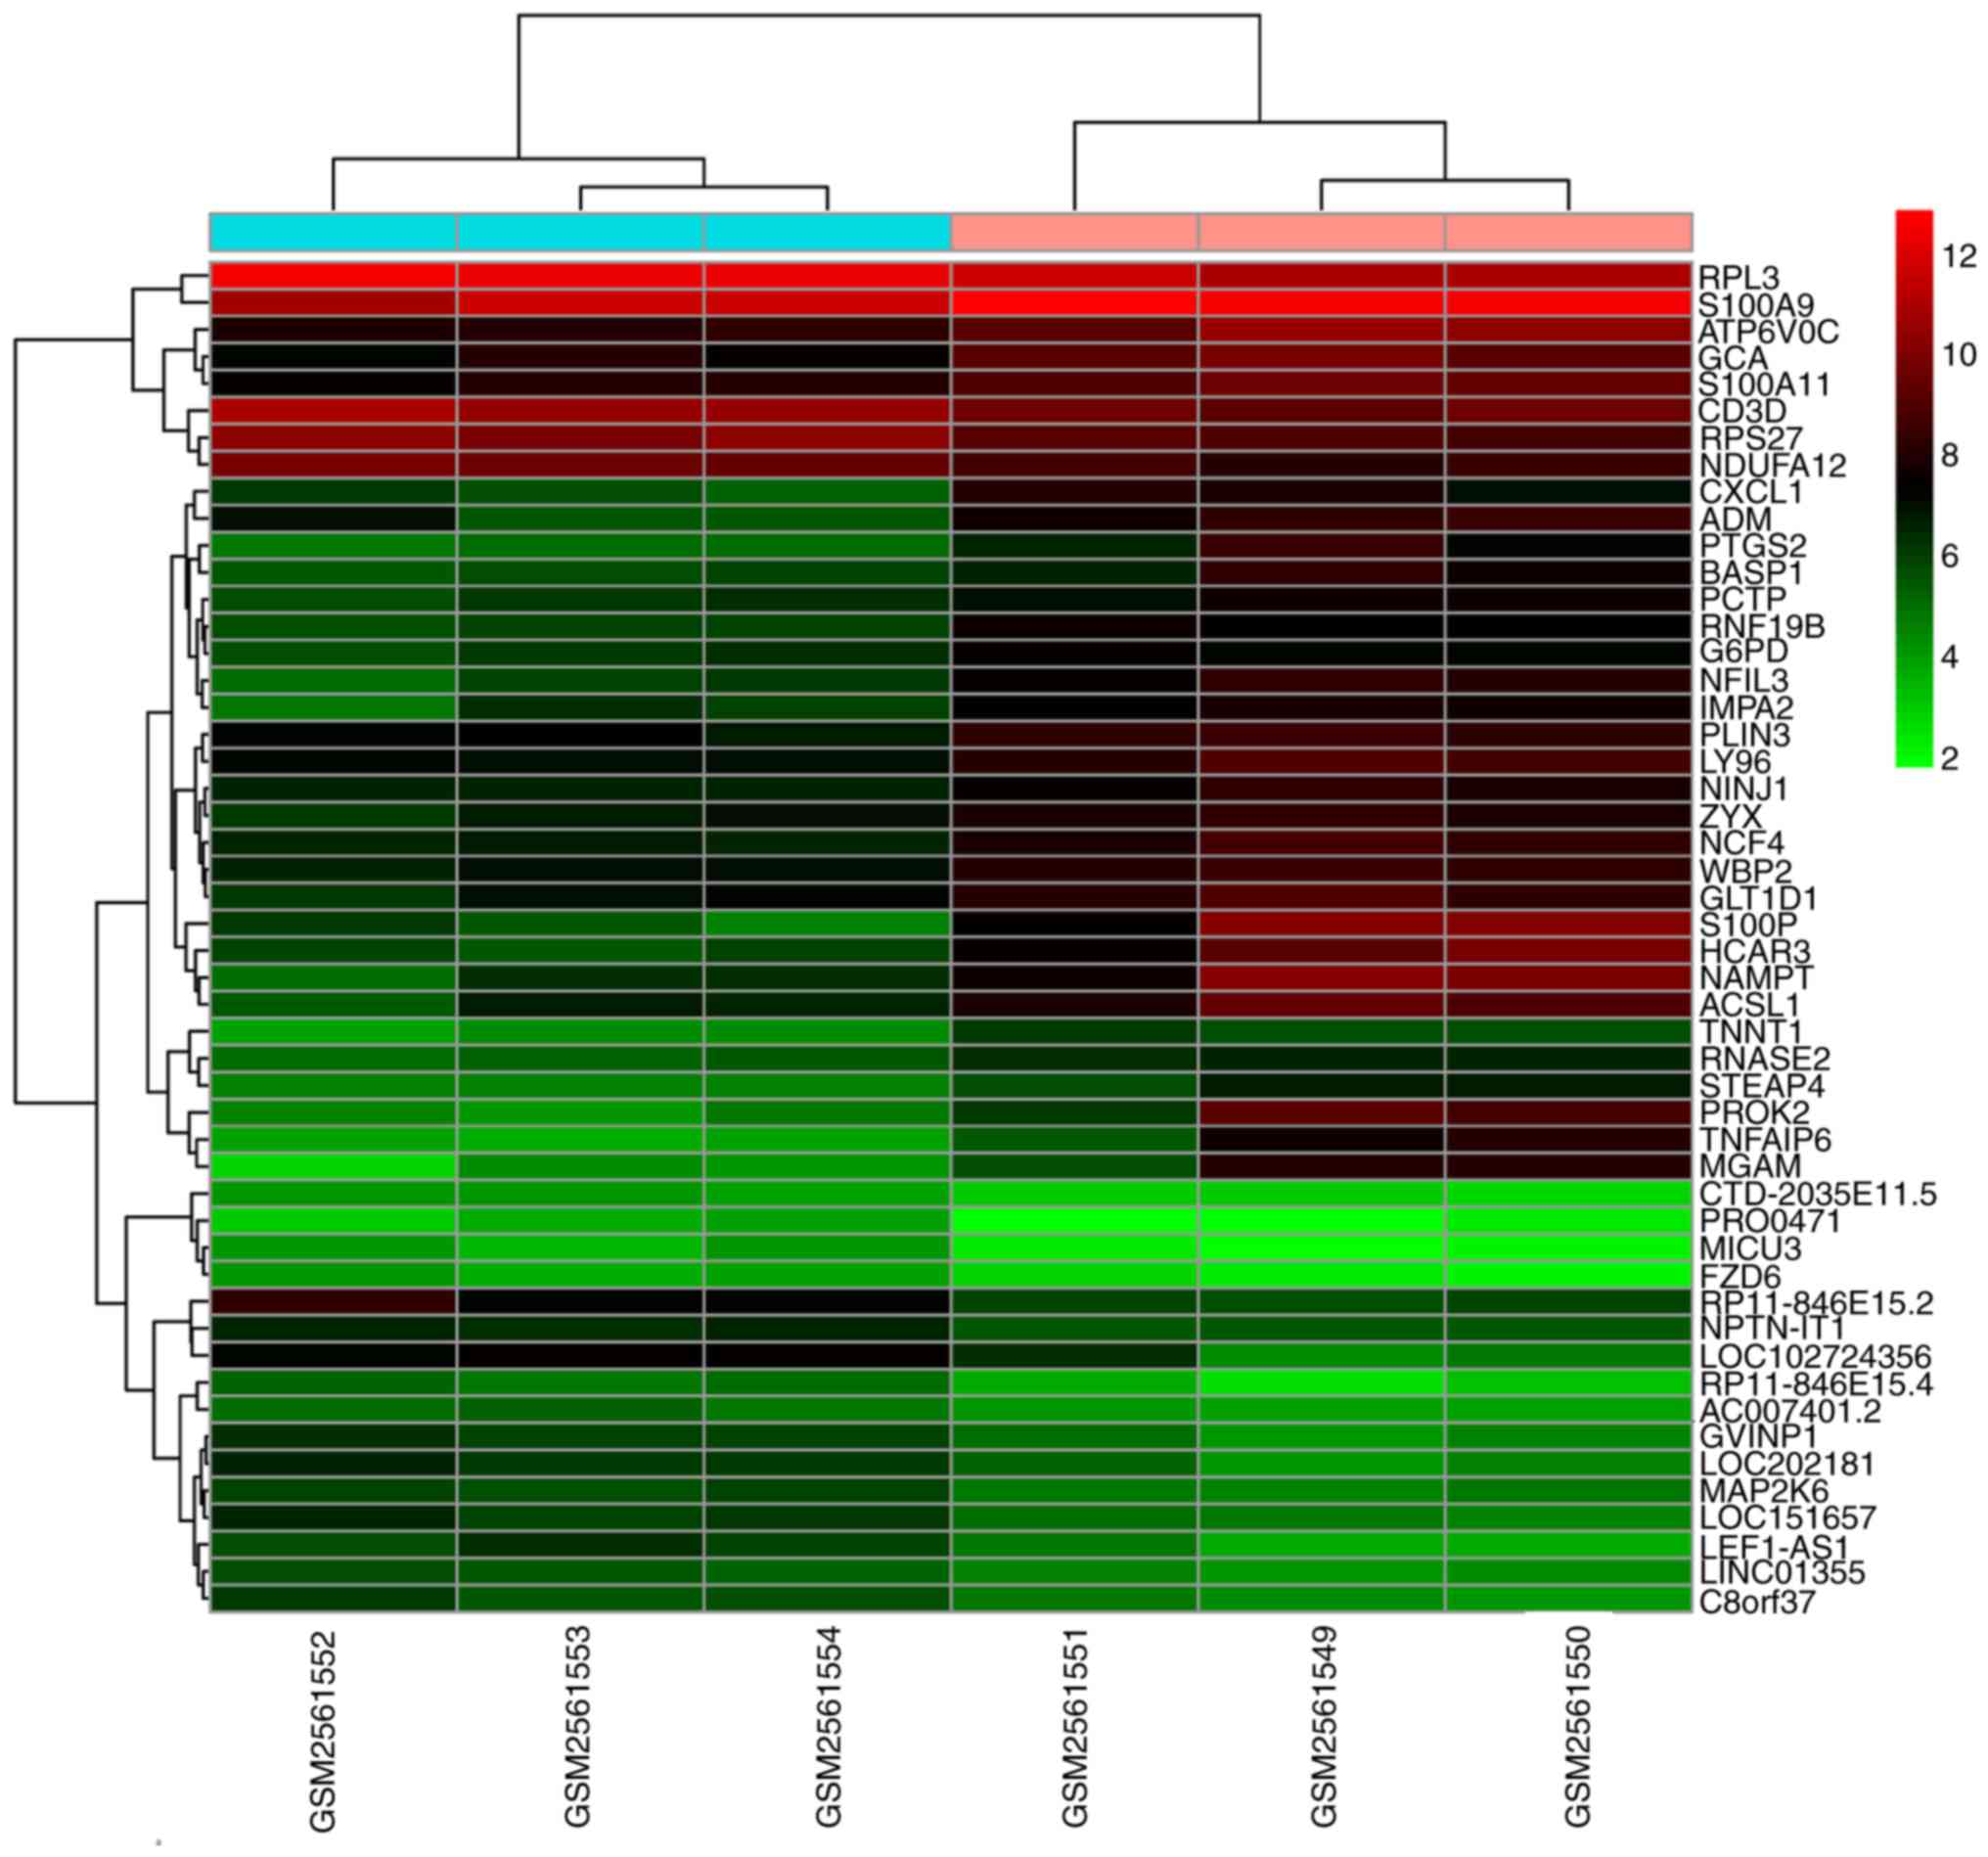
Following data normalization, 752 genes were
identified as DEGs between the patients with AMI and healthy
controls according to the thresholds of P<0.05 and |logFC|
>1, including 449 upregulated and 303 downregulated genes
(Table I). Heatmap clustering
analysis indicated that the identified DEGs easily distinguished
patients with AMI from healthy controls (Fig. 1).
 | Table I.Top 20 upregulated and downregulated
differentially expressed genes between acute myocardial infarction
patients and healthy controls. |
Table I.
Top 20 upregulated and downregulated
differentially expressed genes between acute myocardial infarction
patients and healthy controls.
| A, Upregulated |
|---|
| Gene | Log fold
change | P-value |
|---|
| RNF19B | 1.67 | 1.31×10⁻⁴ |
| TNNT1 | 1.67 | 3.70×10⁻⁴ |
| NFIL3 | 2.30 | 3.91×10⁻⁴ |
| NCF4 | 1.69 | 5.86×10⁻⁴ |
| RNASE2 | 1.29 | 6.91×10⁻⁴ |
| GCA | 1.84 | 7.04×10⁻⁴ |
| CXCL1 | 1.96 | 8.77×10⁻⁴ |
| WBP2 | 1.46 | 9.99×10⁻⁴ |
| STEAP4 | 1.78 | 1.20×10⁻³ |
| NINJ1 | 1.37 | 1.46×10⁻³ |
| HCAR3 | 3.04 | 1.76×10⁻³ |
| S100P | 3.88 | 1.81×10⁻³ |
| ATP6V0C | 1.88 | 1.86×10⁻³ |
| G6PD | 1.27 | 1.96×10⁻³ |
| PTGS2 | 2.44 | 2.07×10⁻³ |
| NAMPT | 3.35 | 2.23×10⁻³ |
| PLIN3 | 1.20 | 2.27×10⁻³ |
| ACSL1 | 2.47 | 2.32×10⁻³ |
| TNFAIP6 | 3.23 | 2.35×10⁻³ |
| LY96 | 1.54 | 2.72×10⁻³ |
|
| B,
Downregulated |
|
| Gene | Log fold
change | P-value |
|
| RP11-846E15.4 | −1.85 | 6.13×10⁻⁴ |
| MICU3 | −1.62 | 7.23×10⁻⁴ |
| NPTN-IT1 | −1.12 | 1.01×10⁻³ |
| FZD6 | −1.37 | 1.27×10⁻³ |
| LEF1-AS1 | −1.99 | 1.53×10⁻³ |
| PRO0471 | −1.61 | 1.53×10⁻³ |
| MAP2K6 | −1.09 | 1.71×10⁻³ |
| LOC151657 | −1.33 | 1.79×10⁻³ |
| GVINP1 | −1.51 | 1.88×10⁻³ |
| CTD-2035E11.5 | −1.02 | 1.91×10⁻³ |
| AC007401.2 | −1.09 | 2.13×10⁻³ |
| LINC01355 | −1.14 | 2.21×10⁻³ |
| C8orf37 | −1.38 | 2.29×10⁻³ |
| LOC202181 | −1.67 | 2.30×10⁻³ |
| RP11-846E15.2 | −1.72 | 2.58×10⁻³ |
| CD3D | −1.10 | 2.61×10⁻³ |
| RPS27 | −1.09 | 2.77×10⁻³ |
| NDUFA12 | −1.18 | 2.78×10⁻³ |
| LOC102724356 | −2.22 | 2.83×10⁻³ |
| RPL3 | −1.20 | 2.96×10⁻³ |
Functional enrichment analysis of
DEGs
The potential functions of the DEGs were predicted
using the online tool DAVID. It was demonstrated that 28 KEGG
pathways were enriched in the upregulated DEGs, such as the nuclear
factor (NF)-κB signaling pathway, including toll-like receptor
(TLR)4; the TLR signaling pathway, including ras-related C3
botulinum toxin substrate 1 (RAC1), TLR4 and C-C motif chemokine
receptor 1 (CCR1); cytokine-cytokine receptor interaction,
including RAC1, signal transducer and activator of transcription
(STAT)3 and G protein subunit gamma 10 (GNG10), the
hsa04062:chemokine signaling pathway, including CCR1, CCR10, and
RAC1; pathways in cancer, including colony stimulating factor 3
receptor (CSF3R); and leukocyte transendothelial migration,
including matrix metallopeptidase 9 (MMP9), as presented in
Table II. No KEGG pathways were
enriched in the downregulated DEGs. Subsequently, the GO term was
determined, which included cell-cycle-related downregulated gene
alstrom syndrome protein 1 (ALMS1) and inflammatory associated
upregulated genes TLR4, CCR1 and CCR10 (Table II).
| Table II.Significantly enriched functions for
differentially expressed genes between acute myocardial infarction
patients and healthy controls. Upregulated genes were enriched in
Kyoto encyclopedia of Genes and Genomes pathways, whereas the
downregulated genes were enriched in Gene ontology biological
process terms. |
Table II.
Significantly enriched functions for
differentially expressed genes between acute myocardial infarction
patients and healthy controls. Upregulated genes were enriched in
Kyoto encyclopedia of Genes and Genomes pathways, whereas the
downregulated genes were enriched in Gene ontology biological
process terms.
| Term | P-value | Genes |
|---|
| Upregulated |
|
|
|
hsa04380: Osteoclast
differentiation | 4.57×10⁻⁷ | NCF2, NCF4, PPP3R1,
SPI1, SIRPA, TAB2, BTK, TNFRSF1A, FCGR2B, LILRA2, FCGR2C, MAPK14,
LILRA5, RAC1, JUND, FCGR2A, FCGR3B |
|
hsa04145: Phagosome | 7.75×10⁻⁷ | DYNC1LI1, RILP,
NCF2, C3, TUBB2A, RAB5C, NCF4, TLR4, ATP6V1B2, ATP6V0C, LAMP2,
FCGR2B, FCGR2C, RAC1, FCGR2A, ATP6V0D1, FCGR3B, TUBB3 |
|
hsa05152: Tuberculosis | 1.35×10⁻⁶ | BID, C3, RAB5C,
TLR1, PPP3R1, TLR4, ATP6V0C, TNFRSF1A, LAMP2, FCGR2B, FCGR2C,
MAPK14, RHOA, FCER1G, CTSD, FCGR2A, CALML5, ATP6V0D1, FCGR3B |
|
hsa05150: Staphylococcus
aureus infection | 1.30×10⁻⁵ | C5AR1, FCGR2B, C3,
FCGR2C, FPR1, FCGR2A, FPR2, FCGR3B, C1QC, PTAFR |
|
hsa04064: NF-κB signaling
pathway | 1.19×10⁻⁴ | TNFRSF1A, TNFSF13B,
PTGS2, LYN, LY96, BCL2A1, CXCL8, TLR4, BCL2L1, TAB2, BTK |
|
hsa05140: Leishmaniasis | 1.22×10⁻⁴ | PTGS2, NCF2, C3,
FCGR2C, MAPK14, NCF4, TLR4, FCGR2A, FCGR3B, TAB2 |
|
hsa05120: Epithelial cell
signaling in Helicobacter pylori infection | 4.43×10⁻⁴ | ATP6V0C, LYN,
MAPK14, RAC1, MAP2K4, CXCL8, CXCR2, ATP6V1B2, ATP6V0D1 |
|
hsa04620: Toll-like receptor
signaling pathway | 6.03×10⁻⁴ | LY96, MAP2K2,
TOLLIP, MAPK14, TLR1, RAC1, MAP2K4, CXCL8, TLR4, TAB2, TLR8 |
|
hsa05133: Pertussis | 9.50×10⁻⁴ | CXCL5, C3, LY96,
MAPK14, RHOA, CXCL8, TLR4, CALML5, C1QC |
|
hsa04721: Synaptic vesicle
cycle | 1.55×10⁻³ | ATP6V0C, AP2B1,
STX3, AP2S1, NAPA, ATP6V1B2, ATP6V0D1, AP2M1 |
|
hsa05014: Amyotrophic lateral
sclerosis (ALS) | 2.26×10⁻³ | BID, TNFRSF1A,
MAPK14, RAC1, PPP3R1, CAT, BCL2L1 |
|
hsa05132: Salmonella
infection | 7.38×10⁻³ | CXCL1, DYNC1LI1,
RILP, MAPK14, RAC1, CXCL8, TLR4, RHOG |
|
hsa04611: Platelet
activation | 9.07×10⁻³ | TBXAS1, LYN,
MAPK14, PTGS1, RHOA, FCER1G, GUCY1B3, FCGR2A, VASP, BTK |
|
hsa04664: Fc epsilon RI
signaling pathway | 1.04×10⁻² | LYN, MAP2K2,
MAPK14, RAC1, MAP2K4, FCER1G, BTK |
|
hsa04062: Chemokine signaling
pathway | 1.28×10⁻² | CXCL1, CXCL5, LYN,
GNG10, CCR1, CXCL16, CCR10, RAC1, RHOA, CXCL8, CXCR2, STAT3 |
|
hsa05145: Toxoplasmosis | 1.53×10⁻² | PPIF, TNFRSF1A,
LY96, MAPK14, HSPA6, TLR4, BCL2L1, TAB2, STAT3 |
|
hsa04071: Sphingolipid
signaling pathway | 1.67×10⁻² | BID, TNFRSF1A,
MAP2K2, MAPK14, GNA12, RAC1, RHOA, FCER1G, CTSD |
|
hsa05200: Pathways in
cancer | 2.14×10⁻² | BID, E2F2, PTGS2,
MAP2K2, MMP9, GNA12, SPI1, CXCL8, EGLN1, BCL2L1, DAPK3, STAT3, MAX,
GNG10, RAC1, RHOA, RALB, CSF3R, CSF2RA |
|
hsa05219: Bladder cancer | 2.20×10⁻² | E2F2, MAP2K2, MMP9,
CXCL8, DAPK3 |
|
hsa04666: Fc gamma R-mediated
phagocytosis | 2.70×10⁻² | FCGR2B, LIMK2, LYN,
RAC1, MARCKS, FCGR2A, VASP |
|
hsa05323: Rheumatoid
arthritis | 3.30×10⁻² | ATP6V0C, TNFSF13B,
CXCL5, CXCL8, TLR4, ATP6V1B2, ATP6V0D1 |
|
hsa04610: Complement and
coagulation cascades | 3.99×10⁻² | THBD, F10, C5AR1,
C3, SERPINA1, C1QC |
|
hsa04662: B cell receptor
signaling pathway | 3.99×10⁻² | FCGR2B, LYN,
MAP2K2, RAC1, PPP3R1, BTK |
|
hsa04670: Leukocyte
transendothelial migration | 4.25×10⁻² | CLDN9, NCF2,
MAPK14, MMP9, NCF4, RAC1, RHOA, VASP |
|
hsa00030: Pentose phosphate
pathway | 4.37×10⁻² | G6PD, TALDO1, TKT,
RPIA |
|
hsa00760: Nicotinate and
nicotinamide metabolism | 4.37×10⁻² | NAMPT, NT5M, BST1,
NAPRT |
|
hsa05164: Influenza A | 4.89×10⁻² | TNFRSF1A,
TNFRSF10C, EIF2AK1, MAP2K2, MAPK14, MAP2K4, HSPA6, CXCL8, TLR4,
FURIN |
|
hsa05130: Pathogenic
Escherichia coli infection | 4.99×10⁻² | TUBB2A, LY96, RHOA,
TLR4, TUBB3 |
| Downregulated |
|
|
| GO:
0006355~regulation of transcription, DNA-templated | 1.89×10⁻⁵ | ZNF611, NACA,
ZNF823, ZNF558, HINT1, ZNF638, STAT4, ZNF776, ZNF738, ZNF300,
ZNF540, ZNF721, KRBOX4, ZNF493, MAP2K6, MLLT3, ZNF563, ZNF529,
ZNF548, ZNF566, ZNF565, ZNF354A, ZNF337, HACE1, ZFP3, HLTF, ZNF662,
ZNF585B, ZRANB2, ZZZ3, ZSCAN16, ZNF550, ZNF765, ZNF766, ZNF571,
PHF6 |
| GO:
0008380~RNA splicing | 9.84×10⁻⁵ | SNRNP48, RBM4,
SRSF11, ZRANB2, MPHOSPH10, SNRPD2, ZNF638, NSRP1, LUC7L3,
THOC1 |
| GO:
0006351~transcription, DNA-templated | 3.70×10⁻⁴ | ZNF611, NACA,
ZNF823, ZNF558, E2F6, HINT1, ZNF638, TCEAL1, ZXDA, STAT4, ZNF776,
ZNF738, ZNF300, ZNF540, ZNF721, ZNF493, MAP2K6, MLLT3, PLAG1,
ZNF563, NFKBIZ, ZNF529, ZNF548, ZNF566, TCF7, ZNF565, ZNF354A,
ZNF337, HACE1, ZFP3, ZNF662, ZNF585B, ZZZ3, ZSCAN16, ZNF550,
ZNF765, ZNF766, ZNF571, PHF6 |
| GO:
0000086~G2/M transition of mitotic cell cycle | 1.83×10⁻² | OFD1, BORA, HAUS1,
CEP290, ALMS1, MASTL |
| Upregulated |
|
|
|
GO:0006954~inflammatory
response | 9.36 ×10⁻⁹ | CXCL1, CXCL5,
PTGS2, TOLLIP, C3, CCR1, PTGS1, S100A9, F2RL1, TLR1, FPR1, CXCL8,
PRDX5, CXCR2, TLR4, FPR2, MMP25, TLR8, TNFRSF1A, RAC1, BCL6, C5AR1,
LYN, LY96, CHI3L1, ORM1, TNFAIP6, PROK2, TNFRSF10C, PTAFR |
|
GO:0006935~chemotaxis | 6.18 ×10⁻⁷ | CXCL1, PROK2,
CMTM2, C5AR1, RNASE2, CXCL5, CXCL16, CCR1, MAPK14, CCR10, FPR1,
CXCL8, CXCR2, FPR2, PTAFR |
|
GO:0032496~response to
lipopolysaccharide | 9.09 ×10⁻⁷ | CXCL1, ALPL, C5AR1,
CXCL5, PTGS2, LY96, SNCA, TLR4, SOD2, TNFRSF1A, TNFRSF10C, THBD,
ADM, JUND, CSF2RB, SLPI, AKIRIN2 |
|
GO:0006955~immune
response | 1.03 ×10⁻⁵ | CXCL1, IL1R2,
CXCL5, AQP9, IFITM2, C3, CCR1, TLR1, PGLYRP1, CXCL8, TLR4, C1QC,
TNFRSF1A, CCR10, FCGR1B, NFIL3, FCGR3B, C5AR1, NCF4, TNFRSF10C,
FCGR2B, TNFSF13B, FCGR2C, AIRE, SLPI, PTAFR |
|
GO:0050900~leukocyte
migration | 9.56 ×10⁻⁵ | BSG, THBD, C5AR1,
LYN, MMP9, F2RL1, FPR1, FCER1G, FPR2, TREM1, SLC7A5, SIRPA |
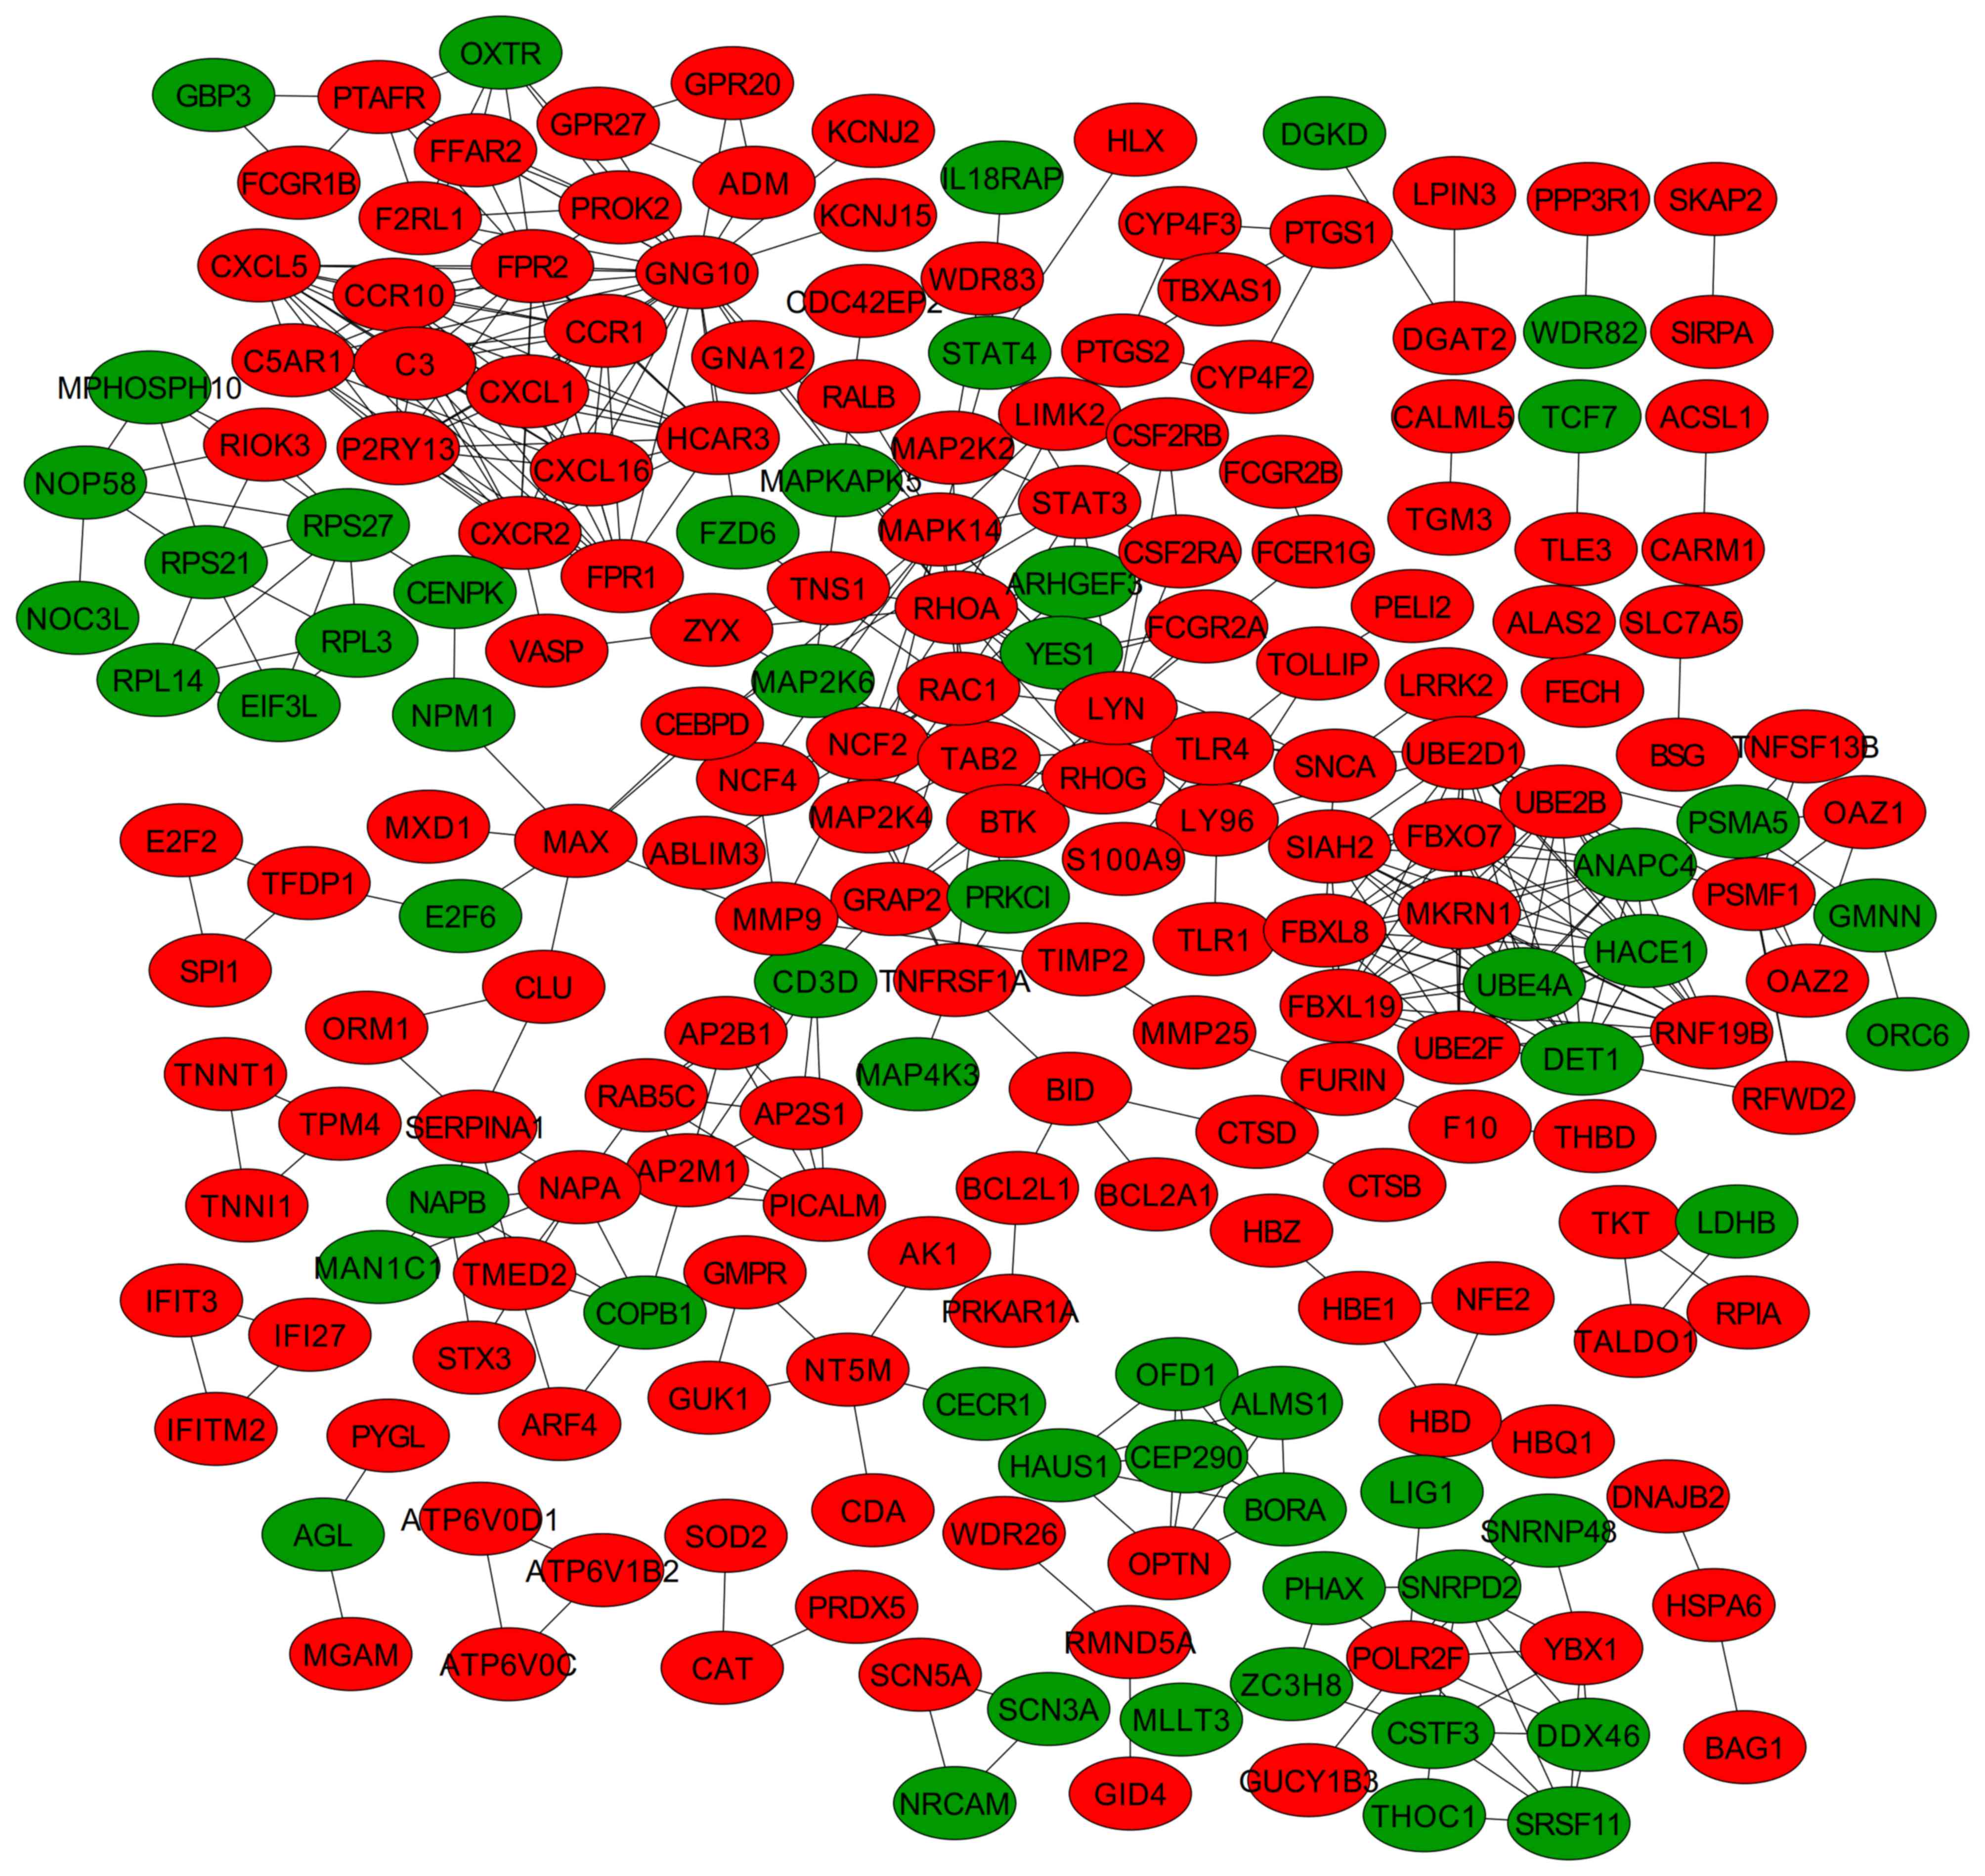
PPI network construction and module
analysis for DEGs
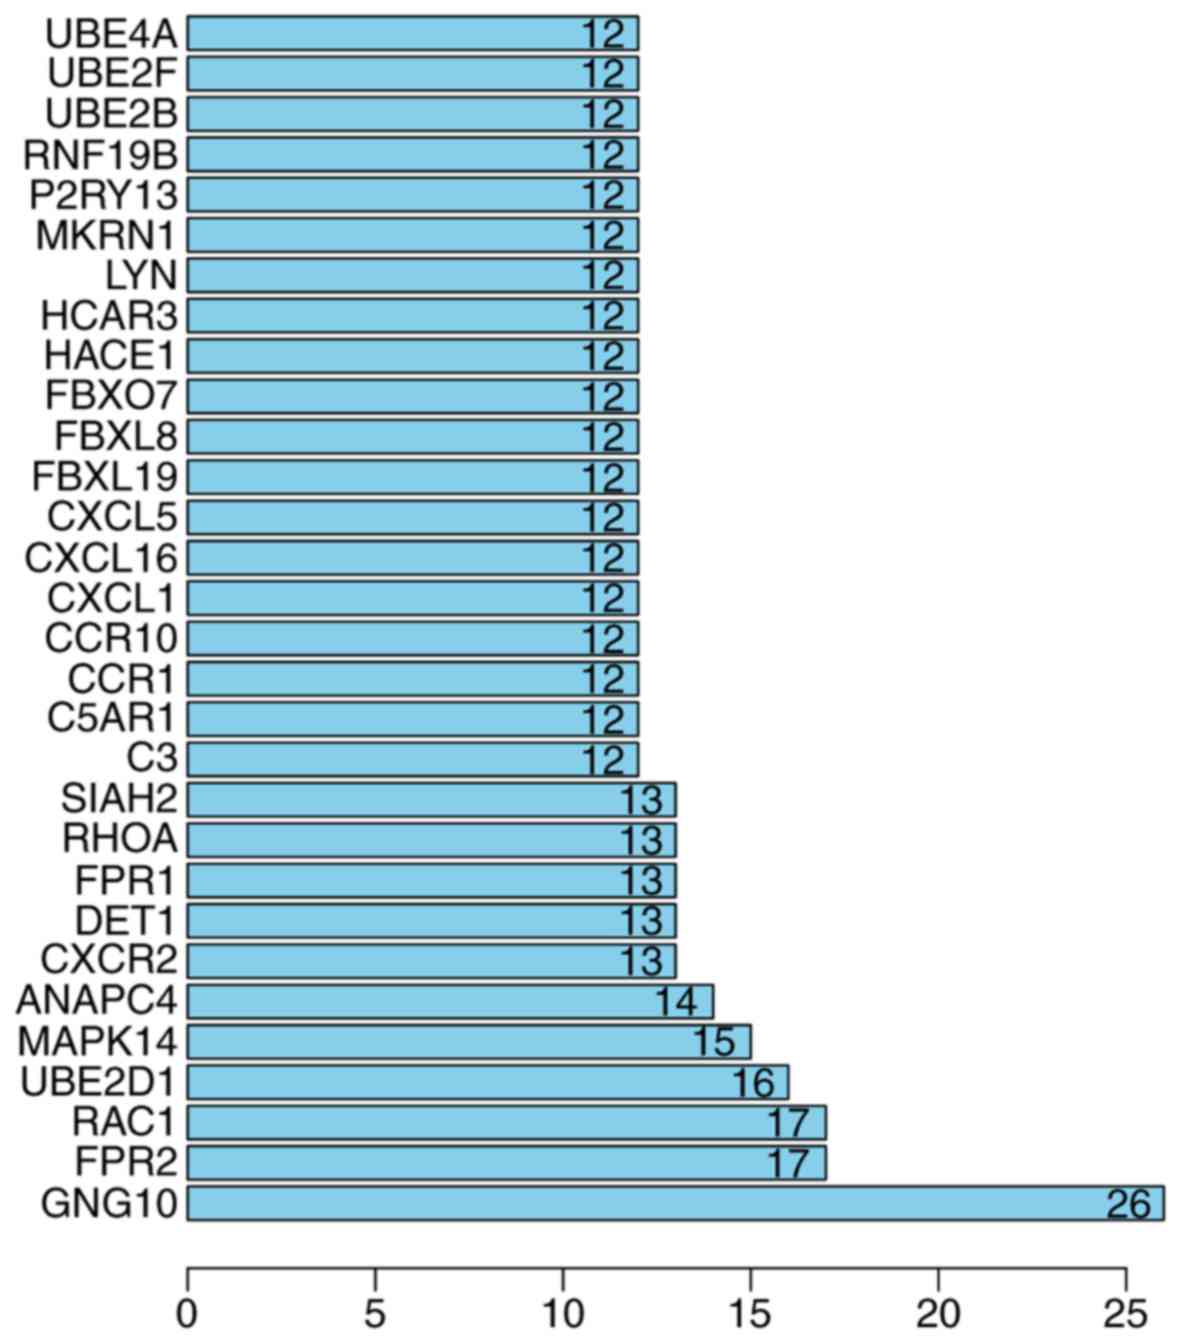
A PPI network was constructed once the DEGs were
mapped into the PPI data, including 218 nodes (162 upregulated and
56 downregulated) and 477 edges (Fig.
2). By calculating their degrees, GNG10 (degree, 26), RAC1
(degree, 17), ubiquitin conjugating enzyme E2 D1 (UBE2D1; degree,
16), CCR1 (degree, 12), and CCR10 (degree, 12) were determined to
be hub genes (Fig. 3).
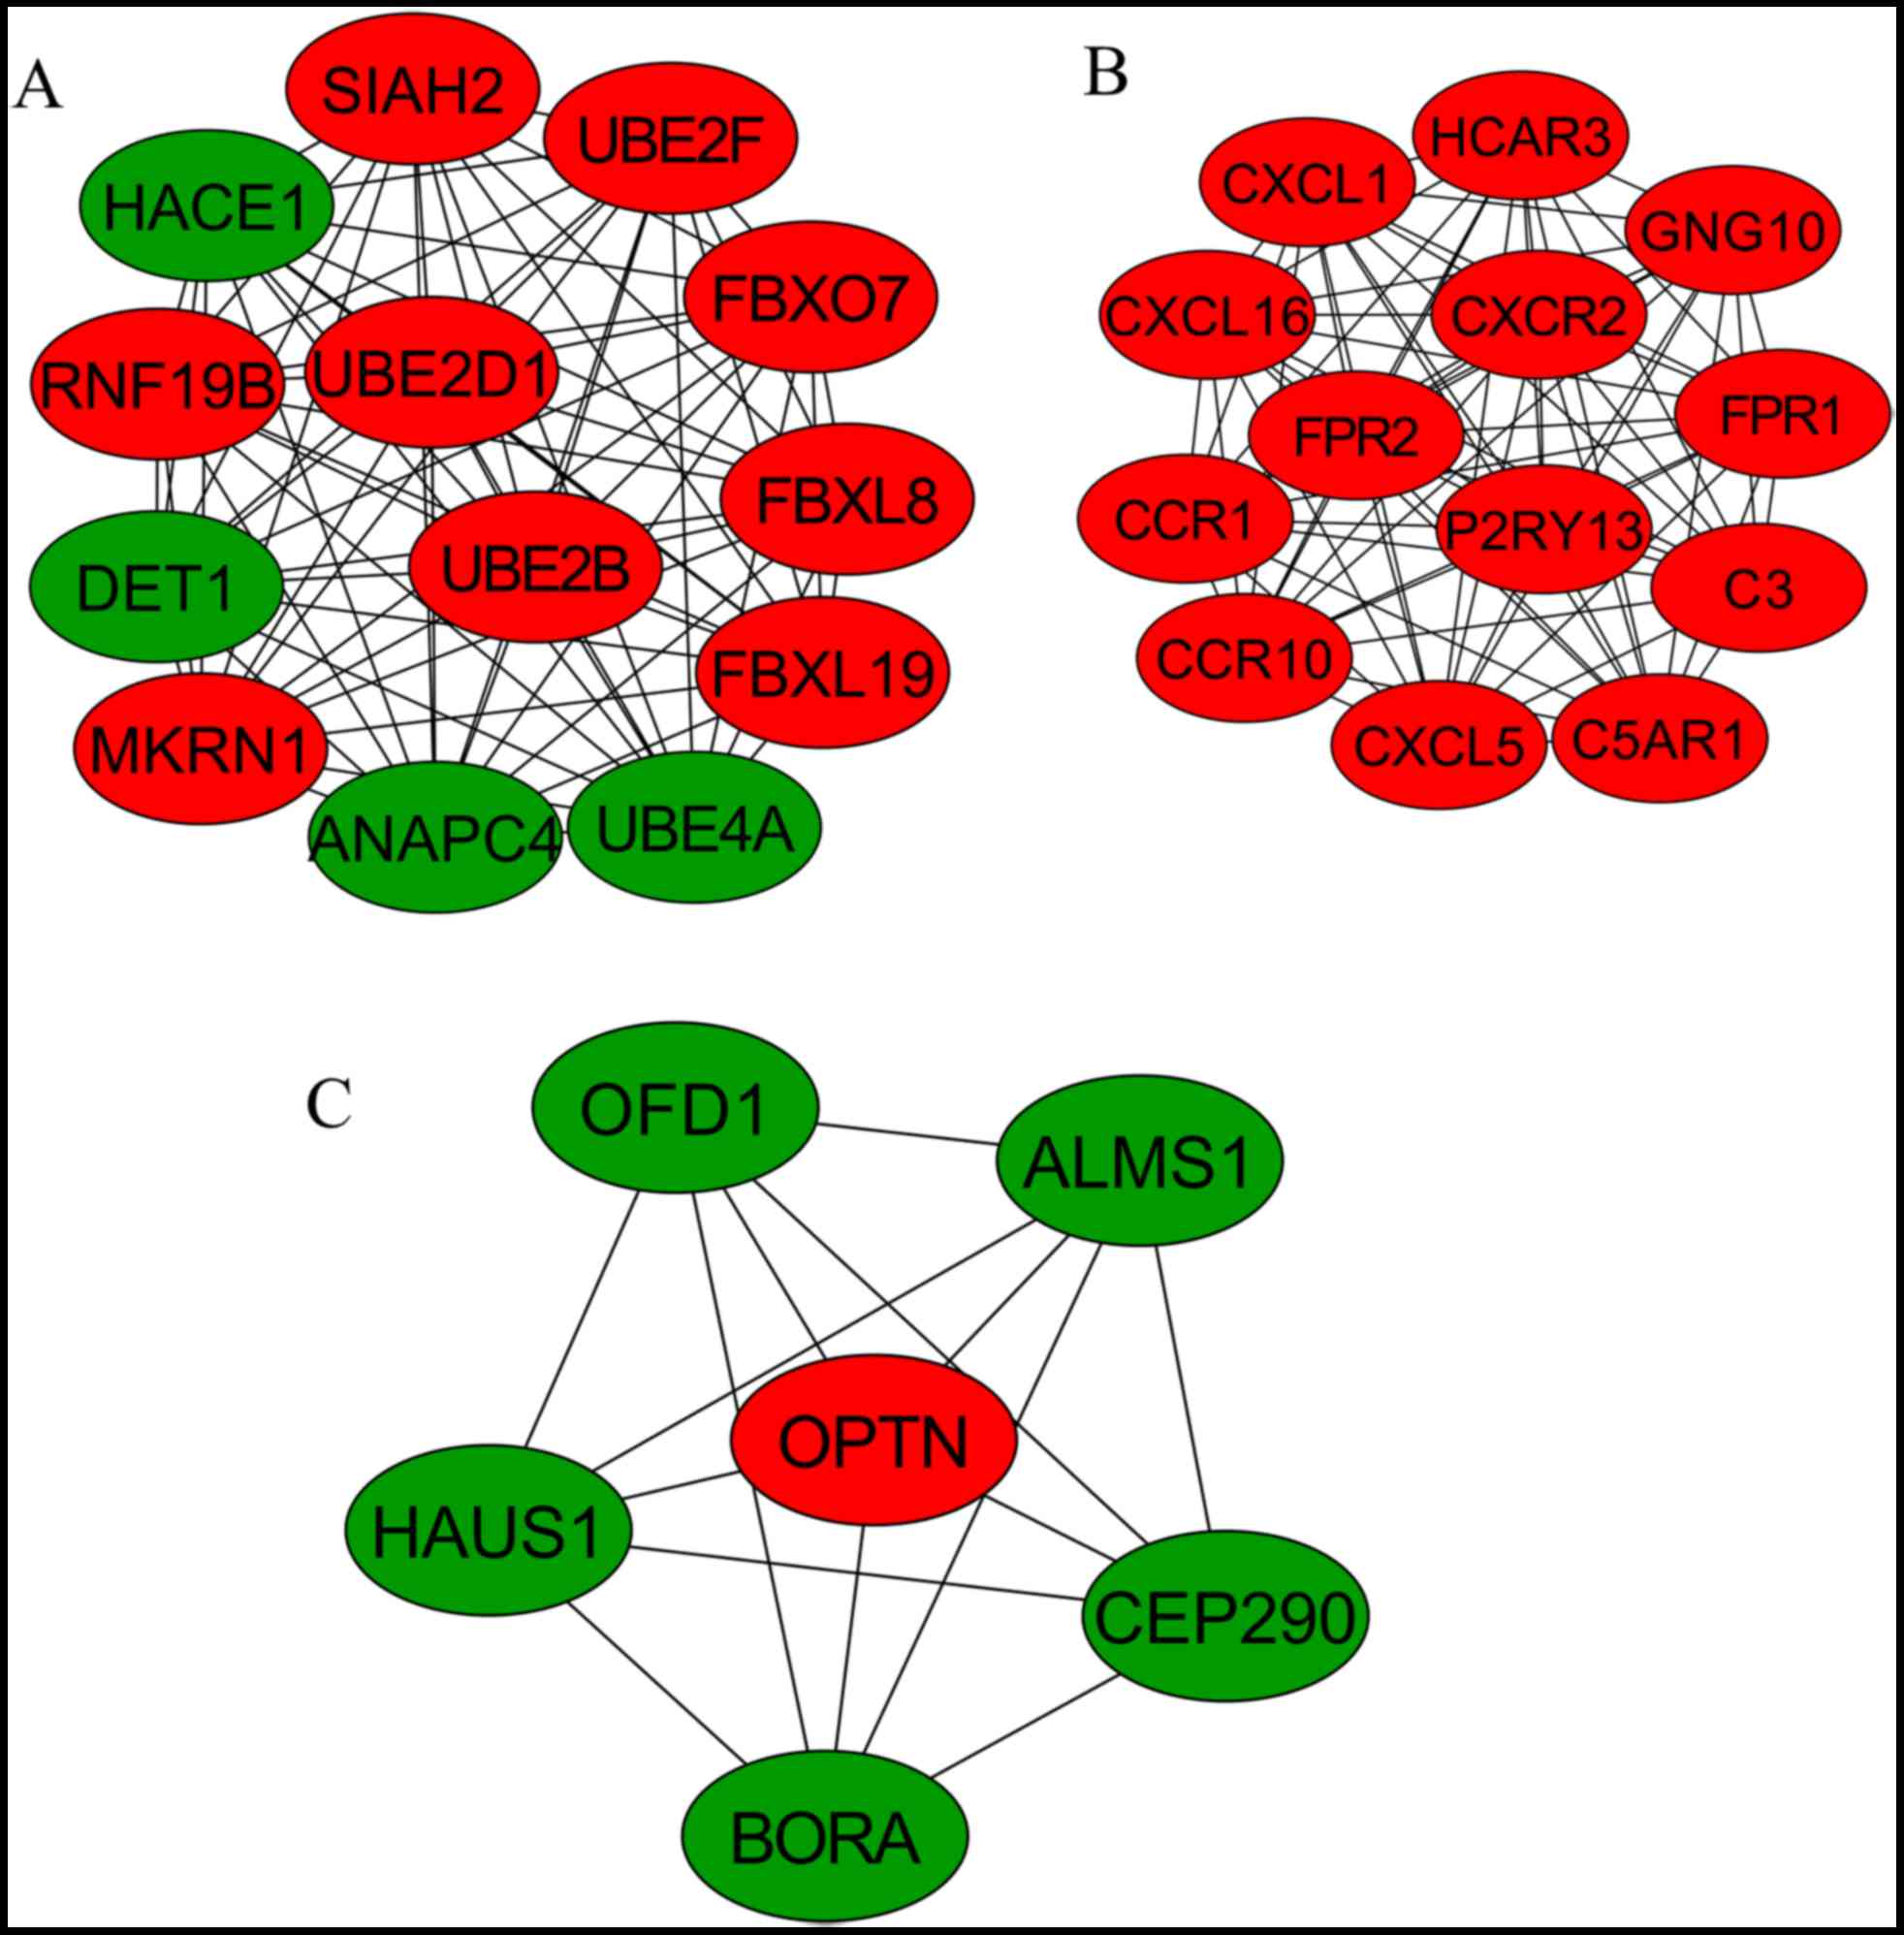
Furthermore, three significant modules were screened from the PPI
network (Fig. 4). Module 1 was
involved in ubiquitin-mediated proteolysis, including UBE2D1;
module 2 was the chemokine signaling pathway cytokine-cytokine
receptor interaction, including CCR1 and CCR10; and module 3 was
associated with the cell cycle, including ALMS1 (Table III).
| Table III.Significantly enriched functions for
module genes screened from the protein-protein interaction
network. |
Table III.
Significantly enriched functions for
module genes screened from the protein-protein interaction
network.
| Module | Term | P-value | Genes |
|---|
| 1 | hsa04120: Ubiquitin
mediated proteolysis | 2.85×10⁻⁹ | UBE4A, ANAPC4,
DET1, UBE2F, UBE2D1, UBE2B |
| 2 | hsa04062: Chemokine
signaling pathway | 2.84×10⁻⁷ | CXCL1, CXCL5,
GNG10, CCR1, CXCL16, CCR10, CXCR2 |
|
| hsa05150:
Staphylococcus aureus infection | 9.44×10⁻⁵ | C5AR1, C3, FPR1,
FPR2 |
|
| hsa04060:
Cytokine-cytokine receptor interaction | 6.401×10⁻³ | CCR1, CXCL16,
CCR10, CXCR2 |
|
| hsa04080:
Neuroactive ligand-receptor interaction | 1.07×10⁻² | P2RY13, C5AR1,
FPR1, FPR2 |
| 3 | GO: 0000086~G2/M
transition of mitotic cell cycle | 3.36×10⁻¹¹ | OFD1, BORA, HAUS1,
CEP290, ALMS1, OPTN |
|
| GO: 0007067~mitotic
nuclear division | 2.11×10⁻³ | OFD1, BORA,
HAUS1 |
|
| GO: 0042384~cilium
assembly | 3.64×10⁻² | CEP290, ALMS1 |
|
| GO: 0060271~cilium
morphogenesis | 3.98×10⁻² | OFD1, CEP290 |
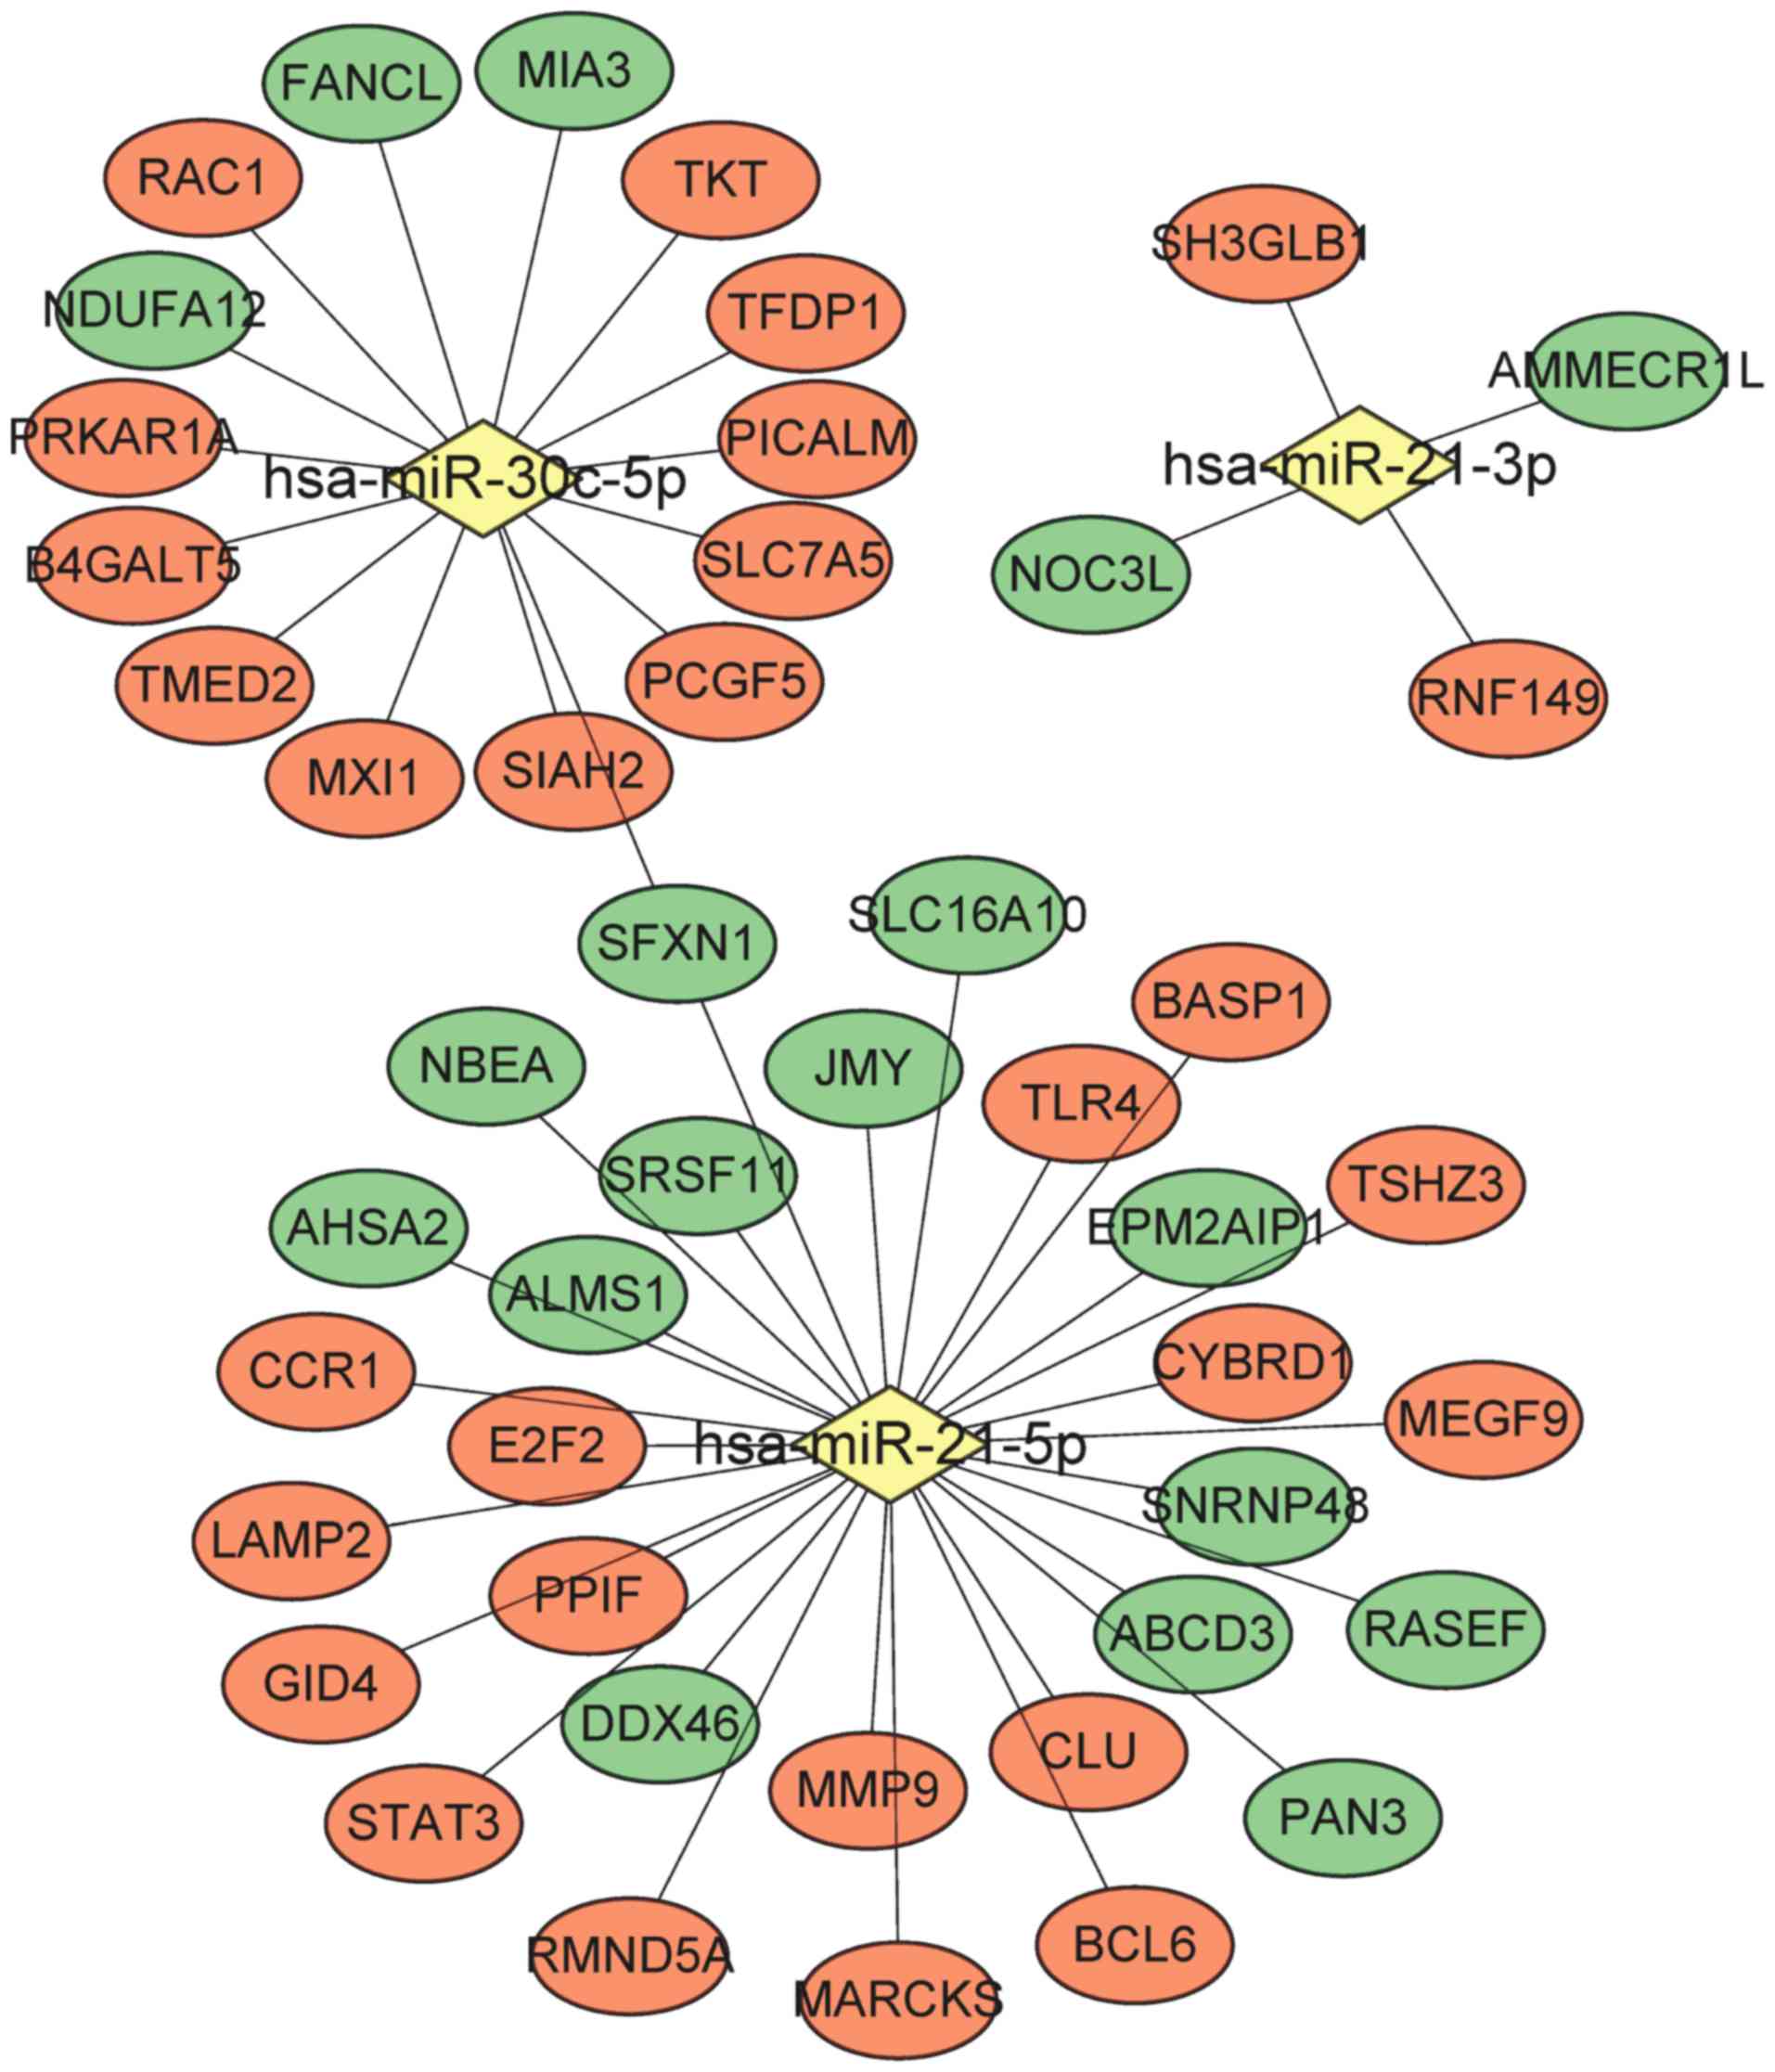
DEGs regulated by miRNA
By searching the mir2disease database, four miRNAs
associated with AMI were identified, including hsa-miR-21,
hsa-miR-133, hsa-miR-29 and hsa-miR-30c. A total of 1,134 genes
were predicted to be target genes of these four miRNAs using the
Mirwalk2 database, which were subsequently overlapped with the
DEGs. As a result, 48 miRNA-DEG interaction pairs were obtained to
construct a miRNA-DEG network that contained three miRNAs
(hsa-miR-21-3p, hsa-miR-21-5p and hsa-miR-30c-5p) as well as 29
upregulated and 18 downregulated DEGs (Fig. 5). Examples include MMP9, TLR4,
STAT3, CCR1 and ALMS1, which were regulated by hsa-miR-21-5p,
whereas RAC1 was one gene regulated by hsa-miR-30c-5p.
The functional enrichment analysis indicated that
the DEGs in the network were involved in Hepatitis B (including
TLR4 and STAT3), pancreatic cancer (including RAC1 and STAT3) and
the proteoglycans associated with cancer (including RAC1, TLR4 and
STAT3; Table IV).
| Table IV.Significantly enriched pathways for
genes in the microRNA-target gene network. |
Table IV.
Significantly enriched pathways for
genes in the microRNA-target gene network.
| Term | P-value | Genes |
|---|
| hsa05161: Hepatitis
B | 1.18×10⁻² | E2F2, MMP9, TLR4,
STAT3 |
| hsa05212:
Pancreatic cancer | 1.94×10⁻² | E2F2, RAC1,
STAT3 |
| hsa05205:
Proteoglycans in cancer | 2.76×10⁻² | MMP9, RAC1, TLR4,
STAT3 |
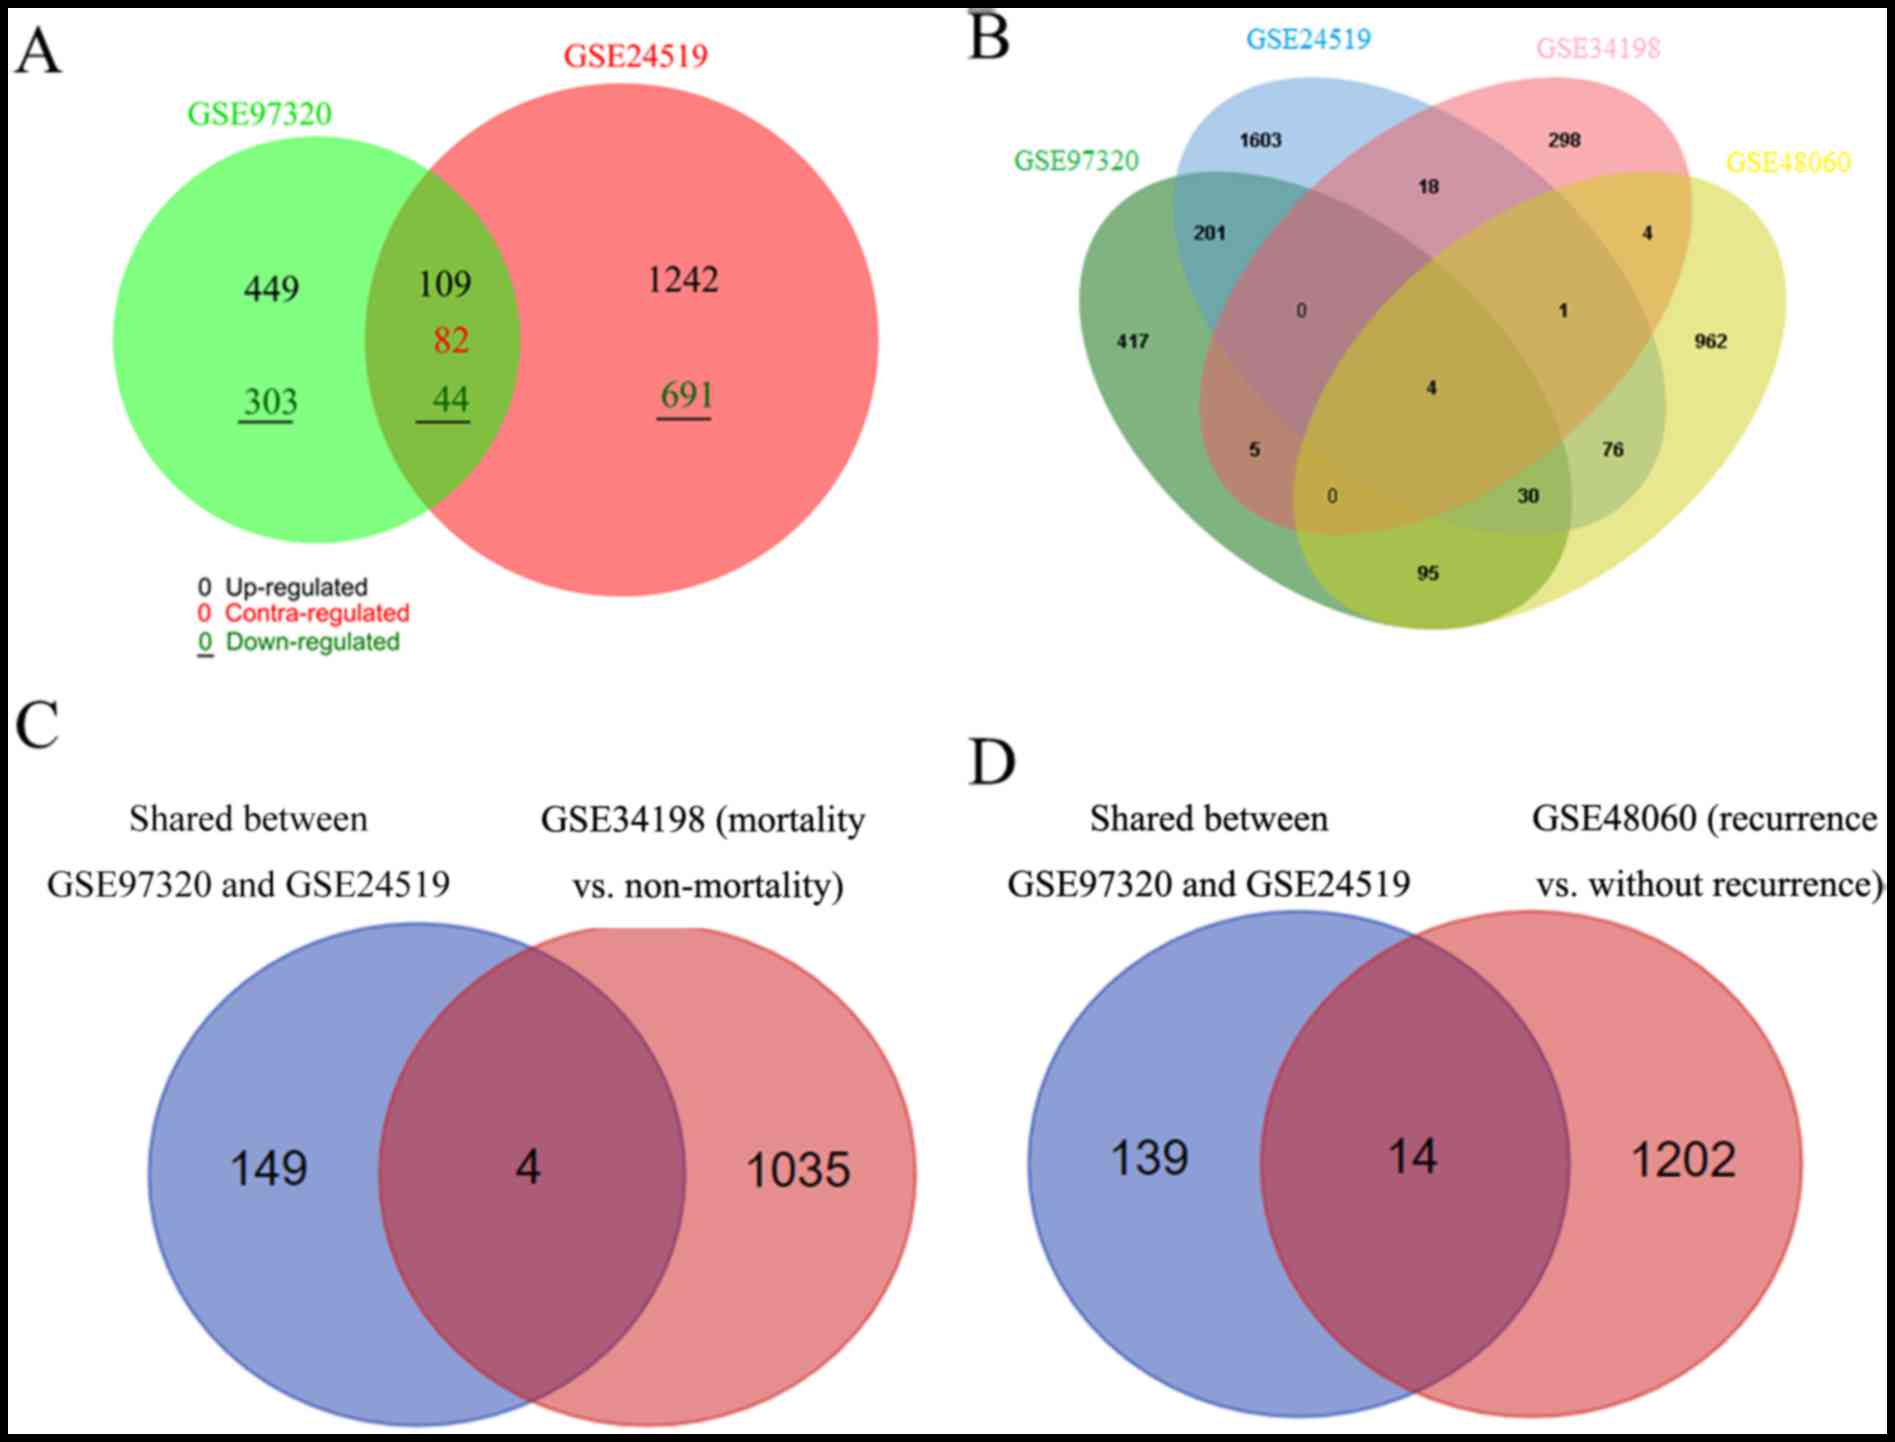
Validation analysis
Following data normalization of the GSE24519
dataset, 1,933 genes were identified as DEGs between patients with
AMI and controls, including 1,242 upregulated and 691 downregulated
genes. For GSE34198, 329 DEGs were screened, consisting of 166
upregulated and 163 downregulated genes; for GSE48060, 1,171 DEGs
were obtained, containing 236 upregulated and 935 downregulated
genes. A Venn diagram analysis indicated that there were 235
overlapped DEGs between GSE97320 and GSE24519, of which 153 had a
consistent expression trend (Fig.
6A). The DEGs of all four datasets were compared, only four
common genes were identified, including aldehyde dehydrogenase 8
family member A1 (ALDH8A1), CSF3R, regulator of G protein signaling
10, and CCR10 (Fig. 6B). Among
these, the expression levels of ALDH8A1, CSF3R and CCR10 were
consistent across the four datasets (Table V).
| Table V.Shared differentially expressed genes
among different datasets. |
Table V.
Shared differentially expressed genes
among different datasets.
| A, Differentially
expressed genes screened in four datasets |
|---|
|
|
GSE97320a |
GSE24519a |
GSE34198a |
GSE48060a |
|---|
|
|
|
|
|
|
|---|
| Gene | logFC | P-value | logFC | P-value | logFC | P-value | logFC | P-value |
| ALDH8A1 | −1.60 | 1.20×10⁻² | −2.67 | 2.94×10⁻⁴ | −1.94 | 1.03×10⁻² | −1.97 | 7.88×10⁻³ |
| CSF3R | 1.06 | 1.22×10⁻² | 1.11 | 3.38×10⁻³ | 1.59 | 1.85×10⁻² | 1.20 | 1.6×10⁻⁴ |
| CCR10 | 1.58 | 8.81×10⁻³ | 1.53 | 7.24×10⁻³ | 1.18 | 3.86×10⁻² | 1.95 | 2.4×10⁻² |
|
| B,
Mortality-related differentially expressed genes |
|
|
|
GSE97320a |
|
GSE24519a |
|
GSE34198b |
|
|
|
|
|
|
|
| Gene | logFC | P-value |
| logFC | P-value |
| logFC | P-value |
| EXTL2 | −2.17 | 3.54×10⁻² |
| −1.01 | 8.24×10⁻³ |
| −1.70 | 2.75×10⁻³ |
| C11orf80 | −1.35 | 1.50×10⁻² |
| −1.85 | 2.92×10⁻² |
| −1.98 | 2.31×10⁻⁴ |
| HTRA1 | 1.06 | 1.18×10⁻² |
| 1.11 | 6.42×10⁻³ |
| 2.56 | 1.09×10⁻² |
|
| C,
Recurrence-related differentially expressed genes |
|
|
|
GSE97320a |
|
GSE24519a |
|
GSE48060c |
|
|
|
|
|
|
|
| Gene | logFC | P-value |
| logFC | P-value |
| logFC | P-value |
| MAP2K2 | 1.17 | 1.74×10⁻² |
| 1.23 | 3.46×10⁻² |
| 1.10 | 2.65×10⁻² |
| HTRA1 | 1.06 | 1.18×10⁻² |
| 1.11 | 6.42×10⁻³ |
| 1.81 | 1.36×10⁻² |
| MAF1 | 1.05 | 6.78×10⁻³ |
| 1.10 | 9.42×10⁻³ |
| 1.84 | 1.42×10⁻² |
To investigate the relationship between the 153 DEGs
exhibiting a consistent expression trend and clinical
characteristics, a subgroup analysis of GSE34198 and GSE48060 was
also performed to screen for genes associated with mortality or
recurrence. As a result, 1,039 DEGs (864 downregulated and 175
upregulated) were identified between the mortality and
non-mortality groups. A total of 1,216 (629 downregulated and 587
upregulated) were screened between the recurrence and
non-recurrence groups. Considering the small number of common genes
obtained across the four datasets, the shared 153 genes between
GSE97320 and GSE24519 were used to overlap with the mortality- or
recurrence-associated genes screened in GSE34198 and GSE48060,
respectively. Consequently, four (Fig.
6C) and 14 (Fig. 6D) overlaps
were separately obtained. However, only three were ultimately
suggested as underlying biomarkers for the prediction of mortality
[exostosin like glycosyltransferase 2, chromosome 11 open reading
frame 80, HtrA serine peptidase 1 (HTRA1)] or recurrence (MAP2K2,
HTRA1, and MAF1, homolog, negative regulator of RNA polymerase III)
in Chinese patients with AMI, due to their consistent expression
trends with GSE97320 (Table
V).
Discussion
In the present study, several underlying biomarkers
for the diagnosis of AMI in Chinese people were suggested prior to
analyses. ALMS1 was demonstrated as a key gene in the PPI module
analysis and regulated by miRNAs associated with AMI hsa-miR-21-5p
(25,26). In addition, TLR4, MMP9, STAT3, CCR1
and RAC1 were likely important, as they are also known to be
regulated by miRNAs associated with AMI; hsa-miR-21-5p (25,26)
and hsa-miR-30c-5p (27,28). CSF3R and CCR10 were confirmed by
comparing Chinese data with international data, and HTRA1 was the
only gene associated with both mortality and recurrence.
ALMS1 is responsible for the initiation of Alström
syndrome when genetically mutated. Alström syndrome is
characterized by retinal degeneration, hearing loss, obesity,
diabetes mellitus and cardiomyopathy (29). Additional studies have suggested
that ALMS1 functions in the aforementioned diseases by interacting
with endosome recycling and/or centrosome-related proteins,
including α-actinin 1, α-actinin 4, myosin Vb, rad50 interacting 1
and huntingtin associated protein 1A, thereby influencing the
cell-cycle pathway (30).
ALMS1-deficient fibroblasts proliferate continuously and
overexpress extracellular matrix components; this effect likely
triggers the excessive remodeling of the normal tissue architecture
and results in fibrosis (31).
Given that atherosclerosis is associated with the development of
intravascular fibrous plaques, ALMS1 mutations may directly
contribute to multiorgan fibrotic alterations, ultimately leading
to AMI. A glutamic acid repeat polymorphism on exon 1 of the ALMS1
gene is significantly associated with early onset MI (32). Taken together, these studies
suggest that ALMS1 is an underlying biomarker for the early
diagnosis of AMI. However, no studies have confirmed this
hypothesis and additional research is required.
AMI may occur predominantly as a result of
atherosclerotic plaque rupture and thrombosis that occludes the
vessel lumen and significantly lowers the supply of oxygen and
metabolites to the myocardium, ultimately inducing cardiomyocyte
death (33,34). Inflammation due to bacterial
infection (35) or conditions
including hypercholesterolemia or hyperlipidemia, are important
contributors to atherosclerotic plaque rupture, including both
local and systemic inflammation (36). Ishikawa et al (37) performed immunostaining analysis and
demonstrated that TLR4 was positively expressed in infiltrated
macrophages in ruptured plaque material. In addition, local and
systemic levels of TLR4 and TLR2 were significantly higher in
patients with AMI, particularly those with cardiovascular events,
compared with patients with stable angina or controls (37,38).
Activated TLRs may weaken the fibrous cap and predispose the plaque
to rupture by mediating the high expression of inflammatory genes,
including interleukin (IL)-18 receptor (R)1, IL-18R2, IL-8, CCR1,
CCR10 and MMP9, via the myeloid differentiation primary response
protein MyD88/RAC1/NF-κB pathway (39–42).
Thus, TLRs and their downstream genes may be underlying biomarkers
for the early diagnosis of AMI. This theory is supported by the
current results and those of a previous study, that revealed the
extent of TLR activation and IL-18R1/2 expression in circulating
cells preceding the excessive release of troponin-T (39), which indicates a potential
advantage for their use as biomarkers for early diagnosis compared
with troponin-T. Furthermore, high serum MMP-9 levels are
associated with an increased risk of AMI (odds ratio, 1.06; 95% CI,
0.87–1.28) (43), and
significantly higher levels of CCR1 are detected in patients with
AMI compared with controls (3.76±0.85 vs. 0.66±0.19 ng/ml,
P<0.05) (44). In addition to
TLR, the activation of the tyrosine-protein kinase JAK1 (JAK)/STAT
signaling pathway has an important role in the onset of AMI by
transducing the intracellular signals of various cytokines, such as
tumor necrosis factor-α (TNF-α) (45). Inhibition of the JAK/STAT signaling
pathway by AG490 inhibits NF-κB protein expression in
cardiomyocytes and reduces plasma TNF-α concentrations to prevent
the development of AMI (45).
However, no studies have directly investigated the diagnostic
efficiency of STAT3 in patients with AMI, which may be a future
research direction.
Granulocyte colony-stimulating factor (G-CSF) is a
multifunctional cytokine that interacts with its receptor G-CSFR,
which is encoded by CSF3R. G-CSF promotes inflammation by enhancing
the function of mature granulocytes and increasing the number of
neutrophils (46). These effects
suggest that the expression levels of G-CSF and CSF3R increase with
disease progression. This hypothesis was supported by the current
study and Li et al (47),
who demonstrated that G-CSF and its receptor CSF3R were
significantly upregulated in patients with AMI compared with
controls and patients with stable angina. However, other studies
have suggested that G-CSF and CSF3R improve cardiac function and
reduce mortality following AMI by inducing the regeneration of
cardiac myocytes and blood vessels through the mobilization of bone
marrow stem cells (48), which
suggests that high CSF3R expression is a protective response.
HTRA1 is also a gene associated with to oxidative
stress and the inflammation response. HTRA1 is highly expressed in
activated macrophages and interacts with growth differentiation
factor 15 to mediate inflammation and promote cell senescence
through the p38 mitogen-activated protein kinase pathway,
ultimately predisposing the individual to high risk for the
development of age-related macular degeneration (49,50).
AMI is particularly prevalent in elderly people (51). Thus, HTRA1 may be important with
regard to AMI. In line with the above study, the present study
demonstrated that HTRA1 was significantly upregulated in the AMI
group, particularly in patients who succumbed to the disease
following a recurrence.
In conclusion, the present study preliminarily
suggests that inflammation markers, including STAT3, CCR1, RAC1,
MMP9, CCR10, CSF3R and HTRA1, as well as cell-cycle-associated
genes including ALMS1, have a potential role that is crucial for
the diagnosis and prognosis of AMI in Chinese people. However,
additional clinical studies are required to confirm the above
findings, which represents a limitation of the present study.
Acknowledgements
Not applicable.
Funding
No funding was received.
Availability of data and materials
The datasets generated and/or analyzed during the
current study are available in the NCBI database repository
[https://www.ncbi.nlm.nih.gov/geo/query/acc.cgi?acc=GSE97320;
https://www.ncbi.nlm.nih.gov/geo/query/acc.cgi?acc=GSE24519;
https://www.ncbi.nlm.nih.gov/geo/query/acc.cgi?acc=GSE34198;
https://www.ncbi.nlm.nih.gov/geo/query/acc.cgi?acc=GSE48060].
Author's contributions
JS and CG participated in the design of this study.
JS and CG performed the statistical and bioinformatics analyses.
RW, CX and MY contributed to the acquisition and interpretation of
data. JS and CG drafted and revised the manuscript. All authors
read and approved the final manuscript.
Ethics approval and consent to
participate
Not applicable.
Consent for publication
Not applicable.
Competing interests
The authors declare that they have no competing
interests.
References
|
1
|
Wang DZ, Shen CF, Zhang Y, Zhang H, Song
GD, Li W, Xue XD, Xu ZL, Zhang S and Jiang GH: Fifteen-year trend
in incidence of acute myocardial infarction in Tianjin of China.
Zhonghua Xin Xue Guan Bing Za Zhi. 45:154–159. 2017.(In Chinese).
PubMed/NCBI
|
|
2
|
Chang J, Liu X and Sun Y: Mortality due to
acute myocardial infarction in China from 1987 to 2014: Secular
trends and age-period-cohort effects. Int J Cardiol. 227:229–238.
2017. View Article : Google Scholar : PubMed/NCBI
|
|
3
|
Chen Y, Jiang L, Smith M, Pan H, Collins
R, Peto R and Chen Z: COMMIT/CCS-2 collaborative group: Sex
differences in hospital mortality following acute myocardial
infarction in China: Findings from a study of 45 852 patients in
the COMMIT/CCS-2 study. Heart Asia. 3:104–110. 2011.PubMed/NCBI
|
|
4
|
Reichlin T, Irfan A, Twerenbold R, Reiter
M, Hochholzer W, Burkhalter H, Bassetti S, Steuer S, Winkler K,
Peter F, et al: Utility of absolute and relative changes in cardiac
troponin concentrations in the early diagnosis of acute myocardial
infarction. Circulation. 124:136–145. 2011. View Article : Google Scholar : PubMed/NCBI
|
|
5
|
Gimenez Rubini M, Twerenbold R, Jaeger C,
Schindler C, Puelacher C, Wildi K, Reichlin T, Haaf P, Merk S,
Honegger U, et al: One-hour rule-in and rule-out of acute
myocardial infarction using high-sensitivity cardiac troponin I. Am
J Med. 128:861–870.e4. 2015. View Article : Google Scholar : PubMed/NCBI
|
|
6
|
McCann CJ, Glover BM, Menown IB, Moore MJ,
McEneny J, Owens CG, Smith B, Sharpe PC, Young IS and Adgey JA:
Novel biomarkers in early diagnosis of acute myocardial infarction
compared with cardiac troponin T. Eur Heart J. 29:2843–2850. 2008.
View Article : Google Scholar : PubMed/NCBI
|
|
7
|
Maznyczka A, Kaier T and Marber M:
Troponins and other biomarkers in the early diagnosis of acute
myocardial infarction. Postgrad Med J. 91:322–330. 2015. View Article : Google Scholar : PubMed/NCBI
|
|
8
|
Roongsritong C, Warraich I and Bradley C:
Common causes of troponin elevations in the absence of acute
myocardial infarction: Incidence and clinical significance. Chest.
125:1877–1884. 2004. View Article : Google Scholar : PubMed/NCBI
|
|
9
|
Mcmahon CG, Lamont JV, Curtin E, McConnell
RI, Crockard M, Kurth MJ, Crean P and Fitzgerald SP: Diagnostic
accuracy of heart-type fatty acid-binding protein for the early
diagnosis of acute myocardial infarction. Am J Emerg Med.
30:267–274. 2012. View Article : Google Scholar : PubMed/NCBI
|
|
10
|
Pyati AK, Devaranavadagi BB, Sajjannar SL,
Nikam SV, Shannawaz M and Sudharani: Heart-type fatty acid binding
protein: A better cardiac biomarker than CK-MB and myoglobin in the
early diagnosis of acute myocardial infarction. J Clin Diagn Res.
9:BC08–BC11. 2015.PubMed/NCBI
|
|
11
|
Wang J, Tang B, Liu X, Wu X, Wang H, Xu D
and Guo Y: Increased monomeric CRP levels in acute myocardial
infarction: A possible new and specific biomarker for diagnosis and
severity assessment of disease. Atherosclerosis. 239:343–349. 2015.
View Article : Google Scholar : PubMed/NCBI
|
|
12
|
Han QY, Wang HX, Liu XH, Guo CX, Hua Q, Yu
XH, Li N, Yang YZ, Du J, Xia YL and Li HH: Circulating E3 ligases
are novel and sensitive biomarkers for diagnosis of acute
myocardial infarction. Clin Sci (Lond). 128:751–760. 2015.
View Article : Google Scholar : PubMed/NCBI
|
|
13
|
Irizarry RA, Hobbs B, Collin F,
Beazer-Barclay YD, Antonellis KJ, Scherf U and Speed TP:
Exploration, normalization, and summaries of high density
oligonucleotide array probe level data. Biostatistics. 4:249–264.
2003. View Article : Google Scholar : PubMed/NCBI
|
|
14
|
R Development Core Team: R: A language and
environment for statistical computingThe R Foundation for
Statistical Computing. Vienna: 2009
|
|
15
|
Ritchie ME, Phipson B, Wu D, Hu Y, Law CW,
Shi W and Smyth GK: limma powers differential expression analyses
for RNA-sequencing and microarray studies. Nucleic Acids Res.
43:e472015. View Article : Google Scholar : PubMed/NCBI
|
|
16
|
Szklarczyk D, Franceschini A, Wyder S,
Forslund K, Heller D, Huerta-Cepas J, Simonovic M, Roth A, Santos
A, Tsafou KP, et al: STRING v10: Protein-protein interaction
networks, integrated over the tree of life. Nucleic Acids Res.
43:(Database Issue). D447–D452. 2015. View Article : Google Scholar : PubMed/NCBI
|
|
17
|
Kohl M, Wiese S and Warscheid B:
Cytoscape: Software for visualization and analysis of biological
networks. Methods Mol Biol. 696:291–303. 2011. View Article : Google Scholar : PubMed/NCBI
|
|
18
|
Bader GD and Hogue CW: An automated method
for finding molecular complexes in large protein interaction
networks. BMC Bioinformatics. 4:22003. View Article : Google Scholar : PubMed/NCBI
|
|
19
|
Jiang Q, Wang Y, Hao Y, Juan L, Teng M,
Zhang X, Li M, Wang G and Liu Y: miR2disease: A manually curated
database for microRNA deregulation in human disease. Nucleic Acids
Res. 37:(Database Issue). D98–D104. 2009. View Article : Google Scholar : PubMed/NCBI
|
|
20
|
Dweep H and Gretz N: miRWalk2.0: A
comprehensive atlas of microRNA-target interactions. Nat Methods.
12:6972015. View Article : Google Scholar : PubMed/NCBI
|
|
21
|
Ogata H, Goto S, Sato K, Fujibuchi W, Bono
H and Kanehisa M: KEGG: Kyoto encyclopedia of genes and genomes.
Nucleic Acids Res. 27:29–34. 1999. View Article : Google Scholar : PubMed/NCBI
|
|
22
|
Ashburner M, Ball CA, Blake JA, Botstein
D, Butler H, Cherry JM, Davis AP, Dolinski K, Dwight SS, Eppig JT,
et al: Gene ontology: Tool for the unification of biology. The gene
ontology consortium. Nat Genet. 25:25–29. 2000. View Article : Google Scholar : PubMed/NCBI
|
|
23
|
Zdeněk V, Ivan M M, Feglarová K, Peleška
P, Marie JT, Jan-Slovák K and Jana DZ: Determinants of excess
genetic risk of acute myocardial infarction-a matched case-control
study. Eur J Biomed Informatics. 8:34–43. 2012.
|
|
24
|
Suresh R, Li X, Chiriac A, Goel K, Terzic
A, Perez-Terzic C and Nelson TJ: Transcriptome from circulating
cells suggests dysregulated pathways associated with long-term
recurrent events following first-time myocardial infarction. J Mol
Cell Cardiol. 74:13–21. 2014. View Article : Google Scholar : PubMed/NCBI
|
|
25
|
Wang F, Long G, Zhao C, Li H, Chaugai S,
Wang Y, Chen C and Wang DW: Atherosclerosis-related circulating
miRNAs as novel and sensitive predictors for acute myocardial
infarction. PLoS One. 9:e1057342014. View Article : Google Scholar : PubMed/NCBI
|
|
26
|
Zhang Y, Liu YJ, Liu T, Zhang H and Yang
SJ: Plasma microRNA-21 is a potential diagnostic biomarker of acute
myocardial infarction. Eur Rev Med Pharmacol Sci. 20:323–329.
2016.PubMed/NCBI
|
|
27
|
Huang Y, Chen J, Zhou Y, Yu X, Huang C, Li
J and Feng Y: Circulating miR-30 is related to carotid artery
atherosclerosis. Clin Exp Hypertens. 38:489–494. 2016. View Article : Google Scholar : PubMed/NCBI
|
|
28
|
Irani S, Pan X, Peck BC, Iqbal J,
Sethupathy P and Hussain MM: MicroRNA-30c mimic mitigates
hypercholesterolemia and atherosclerosis in mice. J Biol Chem.
291:18397–18409. 2016. View Article : Google Scholar : PubMed/NCBI
|
|
29
|
Collin GB, Marshall JD, Ikeda A, So WV,
Russell-Eggitt I, Maffei P, Beck S, Boerkoel CF, Sicolo N, Martin
M, et al: Mutations in ALMS1 cause obesity, type 2 diabetes and
neurosensory degeneration in Alström syndrome. Nat Genet. 31:74–78.
2002. View Article : Google Scholar : PubMed/NCBI
|
|
30
|
Collin GB, Marshall JD, King BL, Milan G,
Maffei P, Jagger DJ and Naggert JK: The Alström syndrome protein,
ALMS1, interacts with α-actinin and components of the endosome
recycling pathway. PLoS One. 7:e379252012. View Article : Google Scholar : PubMed/NCBI
|
|
31
|
Zulato E, Favaretto F, Veronese C,
Campanaro S, Marshall JD, Romano S, Cabrelle A, Collin GB, Zavan B,
Belloni AS, et al: ALMS1-deficient fibroblasts over-express
extra-cellular matrix components, display cell cycle delay and are
resistant to apoptosis. PLoS One. 6:e190812011. View Article : Google Scholar : PubMed/NCBI
|
|
32
|
Ichihara S, Yamamoto K, Asano H, Nakatochi
M, Sukegawa M, Ichihara G, Izawa H, Hirashiki A, Takatsu F, Umeda
H, et al: Identification of a glutamic acid repeat polymorphism of
ALMS1 as a novel genetic risk marker for early-onset myocardial
infarction by genome-wide linkage analysis. Circ Cardiovasc Genet.
6:569–578. 2013. View Article : Google Scholar : PubMed/NCBI
|
|
33
|
Ojio S, Takatsu H, Tanaka T, Ueno K,
Yokoya K, Matsubara T, Suzuki T, Watanabe S, Morita N, Kawasaki M,
et al: Considerable time from the onset of plaque rupture and/or
thrombi until the onset of acute myocardial infarction in humans:
Coronary angiographic findings within 1 week before the onset of
infarction. Circulation. 102:2063–2069. 2000. View Article : Google Scholar : PubMed/NCBI
|
|
34
|
Park JS, Shin DG, Kim YJ, Hong GR and Cho
IH: Acute myocardial infarction as a consequence of stent fracture
and plaque rupture after sirolimus-eluting stent implantation. Int
J Cardiol. 134:e79–e81. 2009. View Article : Google Scholar : PubMed/NCBI
|
|
35
|
Ohki T, Itabashi Y, Kohno T, Yoshizawa A,
Nishikubo S, Watanabe S, Yamane G and Ishihara K: Detection of
periodontal bacteria in thrombi of patients with acute myocardial
infarction by polymerase chain reaction. Am Heart J. 163:164–167.
2012. View Article : Google Scholar : PubMed/NCBI
|
|
36
|
Tanaka A, Shimada K, Sano T, Namba M,
Sakamoto T, Nishida Y, Kawarabayashi T, Fukuda D and Yoshikawa J:
Multiple plaque rupture and C-reactive protein in acute myocardial
infarction. J Am Coll Cardiol. 45:1594–1599. 2005. View Article : Google Scholar : PubMed/NCBI
|
|
37
|
Ishikawa Y, Satoh M, Itoh T, Minami Y,
Takahashi Y and Akamura M: Local expression of Toll-like receptor 4
at the site of ruptured plaques in patients with acute myocardial
infarction. Clin Sci (Lond). 115:133–140. 2008. View Article : Google Scholar : PubMed/NCBI
|
|
38
|
Satoh S, Yada R, Inoue H, Omura S, Ejima
E, Mori T, Takenaka K, Kawamura N, Numaguchi K, Mori E, et al:
Toll-like receptor-4 is upregulated in plaque debris of patients
with acute coronary syndrome more than Toll-like receptor-2. Heart
Vessels. 31:1–5. 2016. View Article : Google Scholar : PubMed/NCBI
|
|
39
|
van der Pouw Kraan TC, Bernink FJ,
Yildirim C, Koolwijk P, Baggen JM, Timmers L, Beek AM, Diamant M,
Chen WJ, van Rossum AC, et al: Systemic toll-like receptor and
interleukin-18 pathway activation in patients with acute ST
elevation myocardial infarction. J Mol Cell Cardiol. 67:94–102.
2014. View Article : Google Scholar : PubMed/NCBI
|
|
40
|
Yang Y, Lv J, Jiang S, Ma Z, Wang D, Hu W,
Deng C, Fan C, Di S, Sun Y and Yi W: The emerging role of Toll-like
receptor 4 in myocardial inflammation. Cell Death Dis. 7:e22342016.
View Article : Google Scholar : PubMed/NCBI
|
|
41
|
Arbibe L, Mira JP, Teusch N, Kline L, Guha
M, Mackman N, Godowski PJ, Ulevitch RJ and Knaus UG: Toll-like
receptor 2-mediated NF-kappa B activation requires a Rac1-dependent
pathway. Nat Immunol. 1:533–540. 2000. View
Article : Google Scholar : PubMed/NCBI
|
|
42
|
Nie W, Lv Y, Yan L, Guan T, Li Q, Guo X,
Liu W, Feng M, Xu G, Chen X and Lv H: Discovery and
characterization of functional modules and pathogenic genes
associated with the risk of coronary artery disease. Rsc Adv.
5:26443–26451. 2015. View Article : Google Scholar
|
|
43
|
Buduneli E, Mäntylä P, Emingil G,
Tervahartiala T, Pussinen P, Barış N, Akıllı A, Atilla G and Sorsa
T: Acute myocardial infarction is reflected in salivary matrix
metalloproteinase-8 activation level. J Periodontol. 82:716–725.
2011. View Article : Google Scholar : PubMed/NCBI
|
|
44
|
Kang B and Mao Y: Detection of bilirubin,
CCR1, troponin I and IL-6 in patients with acute myocardial
infarction. Xi Bao Yu Fen Zi Mian Yi Xue Za Zhi. 30:1198–1200.
2014.(In Chinese). PubMed/NCBI
|
|
45
|
Zhang S, Liu X, Goldstein S, Li Y, Ge J,
He B, Fei X, Wang Z and Ruiz G: Role of the JAK/STAT signaling
pathway in the pathogenesis of acute myocardial infarction in rats
and its effect on NF-κB expression. Mol Med Rep. 7:93–98. 2013.
View Article : Google Scholar : PubMed/NCBI
|
|
46
|
Molineux G: Granulocyte colony-stimulating
factors. Cancer Treat Res. 157:33–53. 2011. View Article : Google Scholar : PubMed/NCBI
|
|
47
|
Li CR, Wang LM, Gong Z, Jiang JF, Duan QL,
Yan WW and Liu XH: Expression characteristics of neutrophil and
mononuclear-phagocyte related genes mRNA in the stable angina
pectoris and acute myocardial infarction stages of coronary artery
disease. J Geriatr Cardiol. 12:279–286. 2015.PubMed/NCBI
|
|
48
|
Takano H, Ohtsuka M, Akazawa H, Toko H,
Harada M, Hasegawa H, Nagai T and Komuro I: Pleiotropic effects of
cytokines on acute myocardial infarction: G-CSF as a novel therapy
for acute myocardial infarction. Curr Pharm Des. 9:1121–1127. 2003.
View Article : Google Scholar : PubMed/NCBI
|
|
49
|
Supanji, Shimomachi M, Hasan MZ, Kawaichi
M and Oka C: HtrA1 is induced by oxidative stress and enhances cell
senescence through p38 MAPK pathway. Exp Eye Res. 112:79–92. 2013.
View Article : Google Scholar : PubMed/NCBI
|
|
50
|
Stanton C, Kortvely E, Hayward C and
Ueffing M: Alan wright: The serine protease HTRA1 is a potential
regulator of the inflammatory cytokine GDF15. Invest Ophthalmol Vis
Sci. 54:50062013.
|
|
51
|
Damiani G, Salvatori E, Silvestrini G,
Ivanova I, Bojovic L, Iodice L and Ricciardi W: Influence of
socioeconomic factors on hospital readmissions for heart failure
and acute myocardial infarction in patients 65 years and older:
Evidence from a systematic review. Clin Interv Aging. 10:237–245.
2015. View Article : Google Scholar : PubMed/NCBI
|