Introduction
Alcoholic liver disease (ALD) has been one of the
leading causes of cirrhosis and liver-related mortality and
morbidity worldwide for many years (1,2). As
the ultimate outcome of heavy acute and/or chronic alcohol
drinking, ALD can lead to steatosis, steatohepatitis, alcoholic
fibrosis, cirrhosis and even hepatocellular carcinoma in certain
individuals (3,4). Many factors are thought to contribute
to the development and progression of ALD, particularly the
toxicity of alcohol and its metabolites, generation of reactive
oxygen species during alcohol metabolism, and endotoxin derived
from the gut (5,6). Although the factors that link ethanol
to the occurrence and development of liver injury have been widely
investigated, the underlying metabolic mechanisms involved in the
complicated pathological processes remain to be elucidated. Thus,
comprehensive research into the molecular characteristics and
mechanism of ALD is urgently required, to identify effective
treatment methods and improve the outcome of patients with ALD.
Label-free quantitative proteomics is a method that
aims to determine the relative amount of proteins, which is a novel
tool used for biomarker identification in various diseases, due to
the critical importance of protein-level measurements (7–9). In
the present study, label-free quantitative proteomics was used to
detect ALD in a rodent model, to explore the underlying
pathophysiological mechanism. It is hoped that the results of the
present study can improve knowledge of the molecular pathogenesis
of ALD and aid the search for biomarkers for early diagnosis and
treatment.
Materials and methods
Animal model
All procedures of animal care and treatment were
approved by the Institutional Animal Care and Use Committee of
Fudan University (Shanghai, China). Experiments were performed on
male specific-pathogen-free C57BL/6J mice (Laboratory Animal
Center, Fudan University, Shanghai, China) of 6 weeks old weighing
18–20 g. Environmental conditions were strictly controlled
(temperature 23±2°C, relative humidity 50–70% and 12 h light/dark
cycle) with ad libitum access to food and water. Following 1
week acclimation, all mice were randomly divided into two groups
based on diets as follows; the alcohol-feed (AF) and control
pair-feed (PF) groups.
Mice were administered 4% Lieber-Decarli ethanol
liquid diet (TP 4030B; Trophic Animal Feed High-Tech Co., Ltd.
Nantong, China) and control diet (TP 4030C; Trophic Animal Feed
High-Tech Co., Ltd.) respectively for 4 weeks with diets changed
daily at 5 pm (10). On the 29th
day at 9:00 am, mice were administered by gavage with a single dose
of maltose dextrin (control, 9 g maltose dextrin per kg of body
weight) or ethanol diet (5 g ethanol diet per kg of body weight),
respectively. At 9 h after the binge, the mice were anesthetized by
an intraperitoneal injection of 1% pentobarbital sodium (80 mg/kg
body weight) and the serum and liver were collected (11). There were 10 mice in each group.
All the non-alcoholic and alcoholic diets were provided throughout
the sample collection period following the binge. A dim red light
was used to collect tissues in dark conditions.
Histopathological examination
The liver tissues were resected and divided to three
parts and processed as follows: Paraffin embedded and stained with
hematoxylin/eosin (H&E); frozen sections (10 µm) and stained
with Oil Red O for 10–15 min at 37°C; and immediately frozen in
liquid nitrogen and stored at −80°C for further analysis. All
sections were analyzed by light microscopy by at least two
independent researchers.
Liquid chromatography-mass
spectrometry/mass spectrometry (LC-MS/MS) analysis
There were three samples in every group and every
sample (5 ul) was mixed from three mouse liver tissues. Each sample
was resuspended in buffer A (0.1% formic acid; FA). Separations
were performed with an UltiMate 3000 HPLC system (Thermo Fisher
Scientific, Inc., Waltham, MA, USA) and Q-Extractive HF HF-X Hybrid
Quadrupole-Orbitrap Mass Spectrometer (Thermo Fisher Scientific,
Inc.). The peptides were subjected to a C18 trap column (3 µm,
0.1×20 mm) at a flow rate of 0.6 µl/min. Peptides were desalted
online and loaded onto a C18 column (1.9, 150×120 mm) using a
gradient from 6–95% buffer B (0.08% FA and 80% acetonitrile) for 90
min. The mass spectrometer was operated in positive mode using a
data-dependent acquisition method.
A full MS scan (300–1,400 m/z) was acquired in the
mass spectrometer with the resolution set to a value of
120,000.
Identification of differently
expressed proteins (DEPs)
DEPs were identified according to the following
procedures. Only the FC value >1.5 or <0.667 were entered in
the following analyses. Then a random variance model t test was
performed using SPSS version 20.0 (IBM Corp., Armonk, NY, USA) to
filter the DEPs as it can effectively increase the statistical
effects in a small number of samples. Only proteins with P<0.05
and false discovery rate (FDR) <0.05 were considered to be
significantly differentially expressed, as previously reported
(12,13). A clustering analysis map was built
using Cluster 3.0 software version 2.3 (Bio-Fly Bioscience;
www.bangfeibio.com/company) to identify
DEPs efficiently with similar expression mode.
Reverse transcription-quantitative
polymerase chain reaction (RT-qPCR)
The relative mRNA level in the liver tissue (20 mg),
including thyroid hormone receptor interactor 12 (TRIP12), NADH
dehydrogenase (ubiquinone) 1 α subcomplex, assembly factor 3
(NDUFAF3) and guanine monophosphate synthetase (GMPS), in the AF
and PF groups were measured by RT-qPCR. Briefly, the total RNA was
isolated using TRIzol reagent (Thermo Fisher Scientific, Inc.)
according to the manufacturer's protocol and then RT was performed
using GeneAmp RNA PCR kits (Thermo Fisher Scientific, Inc.) with
the following parameters: 15 min at 37°C, 5 sec at 85°C, hold at
4°C. Primer sequences are listed in Table I. qPCR was performed on an ABI 7500
real-time PCR thermocycler using SYBR-Green PCR Master Mix kits
(Thermo Fisher Scientific, Inc.) with the following PCR cycling
parameters: 1 cycle of 30 sec at 95°C; 40 cycles of 5 sec at 95°C;
30 sec at 55°C; and, 30 sec at 72°C followed by a melting curve
analysis. The expression levels of target genes were calculated
from duplicate samples following normalization against the
housekeeping gene GAPDH. The 2−ΔΔCq method was used to
calculate the expression of these proteins (14).
 | Table I.Primer sequences for the targeted
proteins. |
Table I.
Primer sequences for the targeted
proteins.
| Gene name | Forward
(5′>3′) | Reverse
(5′>3′) |
|---|
| TRIP12 |
GTCTGTGACGCAGGACCTTG |
TGTGAACTGGCTTAGCTGTCCT |
| NDUFAF3 |
GTGGTCCAGTGGAACGTGG |
CTCCTGTCACTCGACCTTCG |
| KDSR |
GCTCCTCTACATGGTGTCGC |
CTCAATAGCAATGCACTTCCCA |
| SURF6 |
CTGAACGACAGAGGAGCACAT |
TTGGGCCTAGAAGAGGTAGGA |
| KIF5B |
GCGGAGTGCAACATCAAAGTG |
CATAAGGCTTGGACGCGATCA |
| GMPS |
GATGCAGTGGGAACTTTACTGT |
AGCACGATTTAGCAAAGCTGT |
| DDAH2 |
GCAGGTAGTAGAACGGAAGATCC |
CTGGTGACAATGGAAGGCTCA |
| SSRP1 |
CAGAGACATTGGAGTTCAACGA |
GCCCGTCTTGCTGTTCTTAAAG |
| HIST1HIC |
AACCCCAGGCTAAGAAGGC |
TGGCTTTACGGCTTTAGACGC |
| H1F0 |
CACGGACCACCCCAAGTATTC |
ACCCACCTTGTAGTGGCTCT |
Gene ontology (GO) and Kyoto
Encyclopedia of Genes and Genomes (KEGG) pathway analyses
GO and KEGG analyses were performed to investigate
significantly enriched function and signaling pathways of DEPs
based on the GO (geneontology.org/) and KEGG databases
(genome.jp/kegg/) as previously published (15,16).
Specifically, the GO and KEGG categories were classified using
Fisher's exact test and χ2 test and FDR calculated for
multiple testing corrections. Only GOs and signaling pathways with
P<0.05 and FDR <0.05 were considered statistically
significant. A GO map and a path-net were established to further
summarize the fundamental functional links among the significant
GOs and KEGG pathways, respectively.
Cluster of orthologous groups of
proteins analysis
The DEPs were compared based on the clusters of
orthologous groups (COGs) database (ncbi.nlm.nih.gov/COG/), to categorize the orthologous
and paralogs of protein. COGs category assignment was performed
using the local alignment tool BLASTP with an e-value cutoff of
<104. Only the categories that met a threshold of P<0.05 and
FDR<0.05 were considered statistically significant.
Results
Hepatic steatosis and
histopathological examination
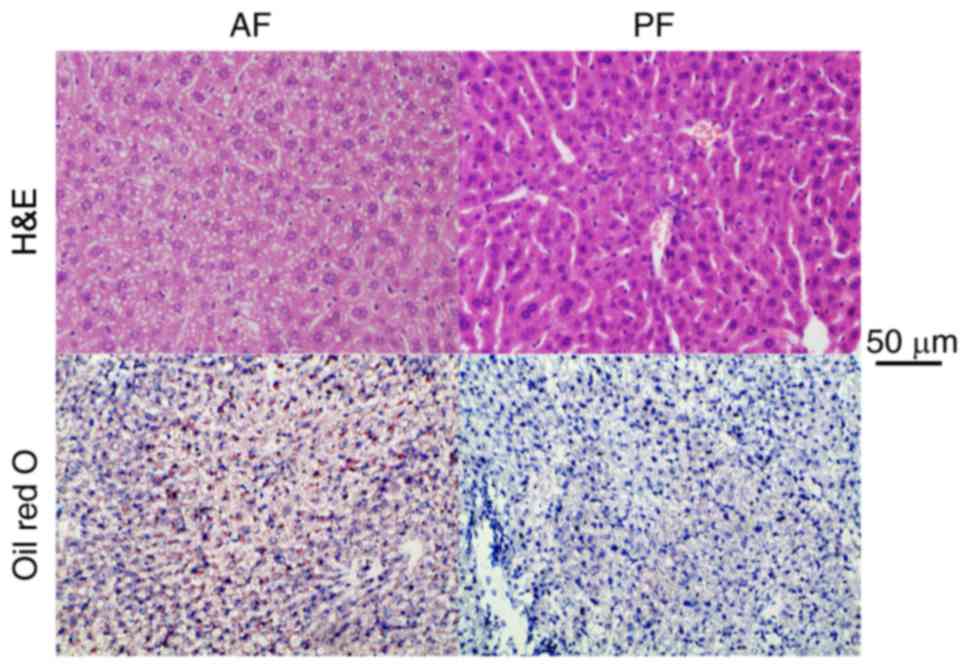
Compared with PF group, the AF mice exhibited marked
hepatic steatosis, even steatohepatitis, as evaluated by H&E
and Oil Red O (Fig. 1).
Histopathological examination revealed the accumulation of lipid
vacuoles and lipid droplets in the AF mice. This demonstrated the
animal model of the present study was successful.
DEPs between the AF and PF mice
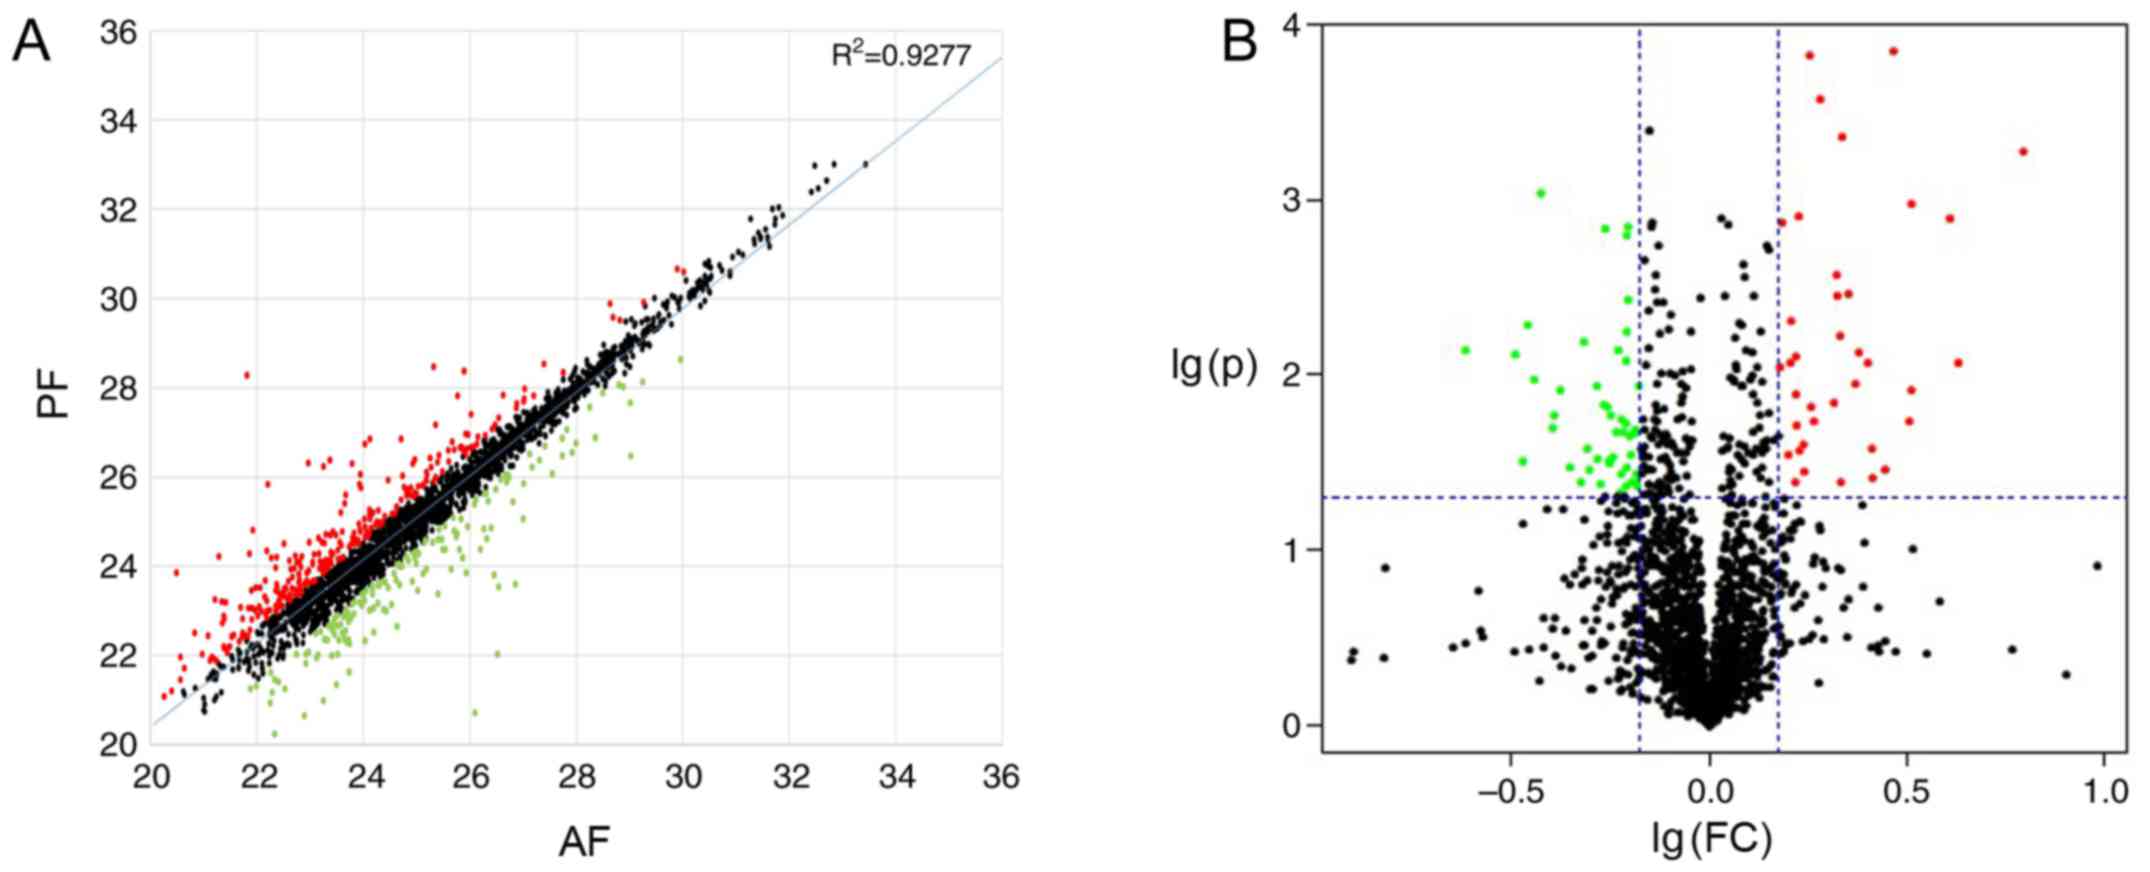
A total of 87 upregulated DEPs and 133 downregulated
DEPs were identified in the AF group compared with the PF group. A
scatter plot map and a volcano plot were established to demonstrate
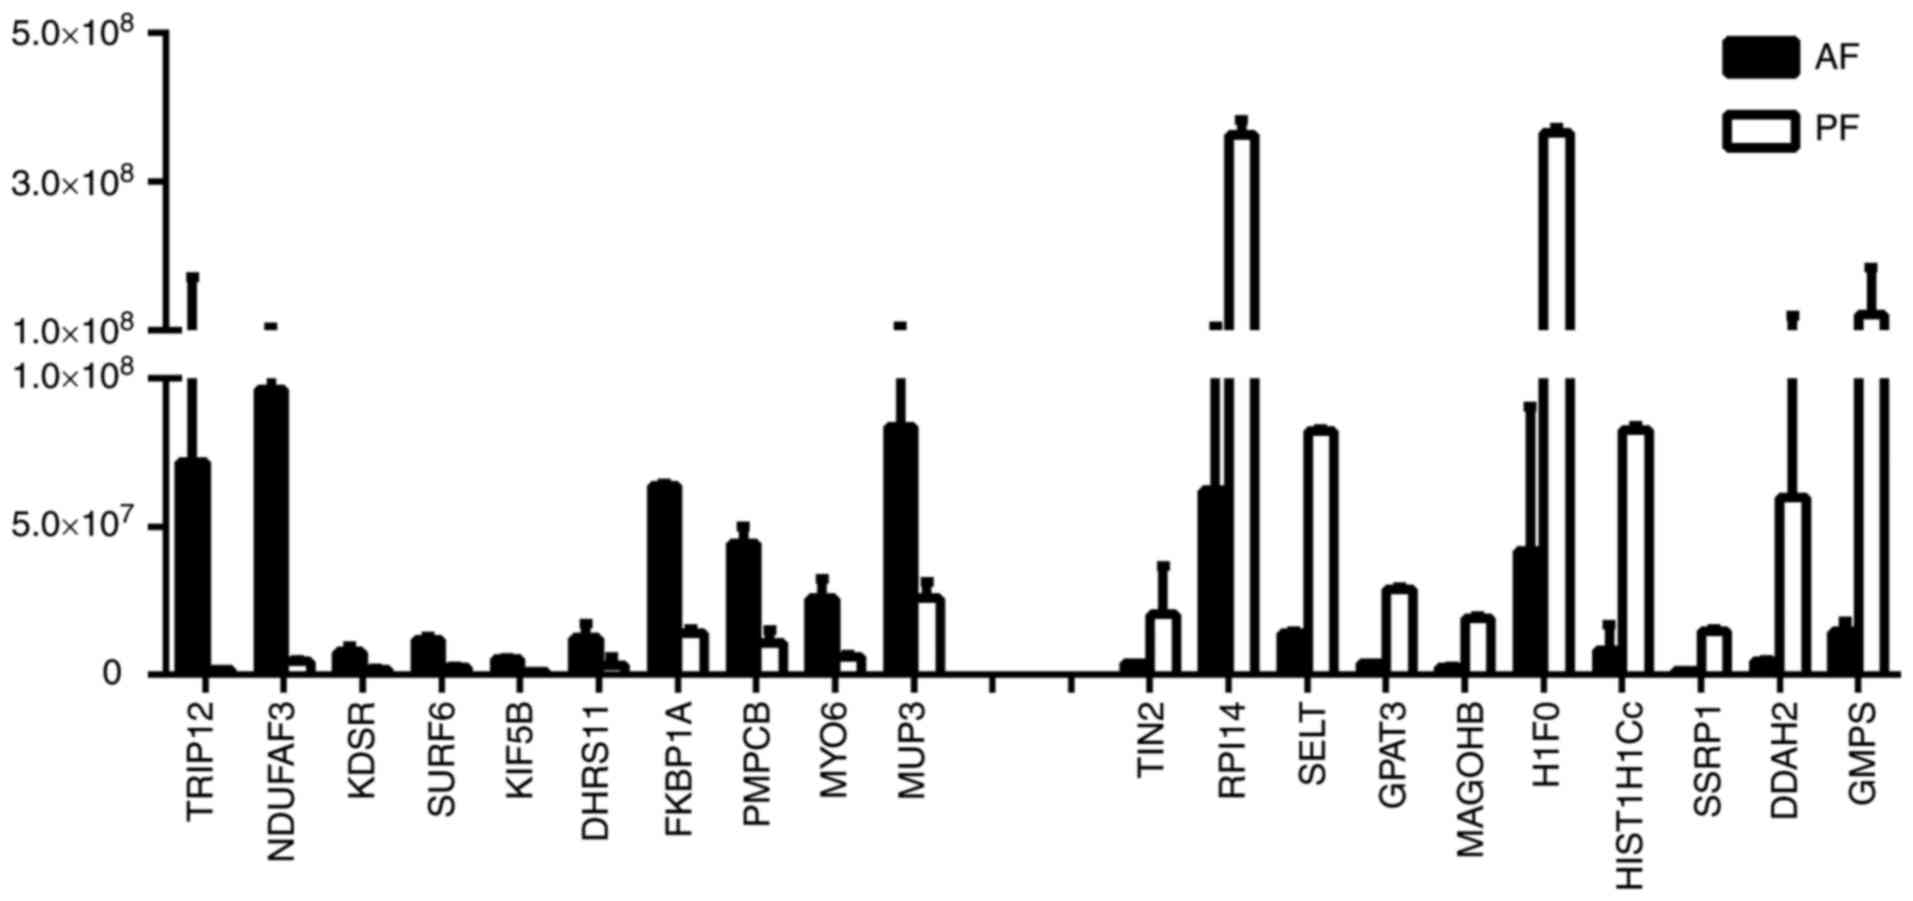
all differentially expressed proteins (Fig. 2). As Fig. 3 presents, marked differences
(>40-fold changes) were detected in the expression levels of
certain proteins, which may have potential to be used as biomarkers
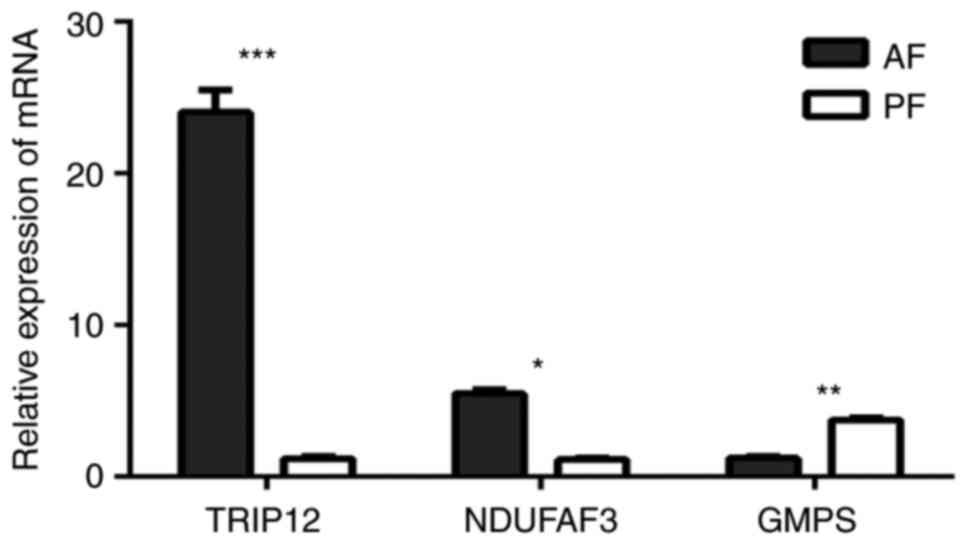
in the diagnosis, assessment and monitoring of ALD. Fig. 4 indicated that the relative mRNA
level of TRIP12, NDUFAF3 and GMPS were significantly different in
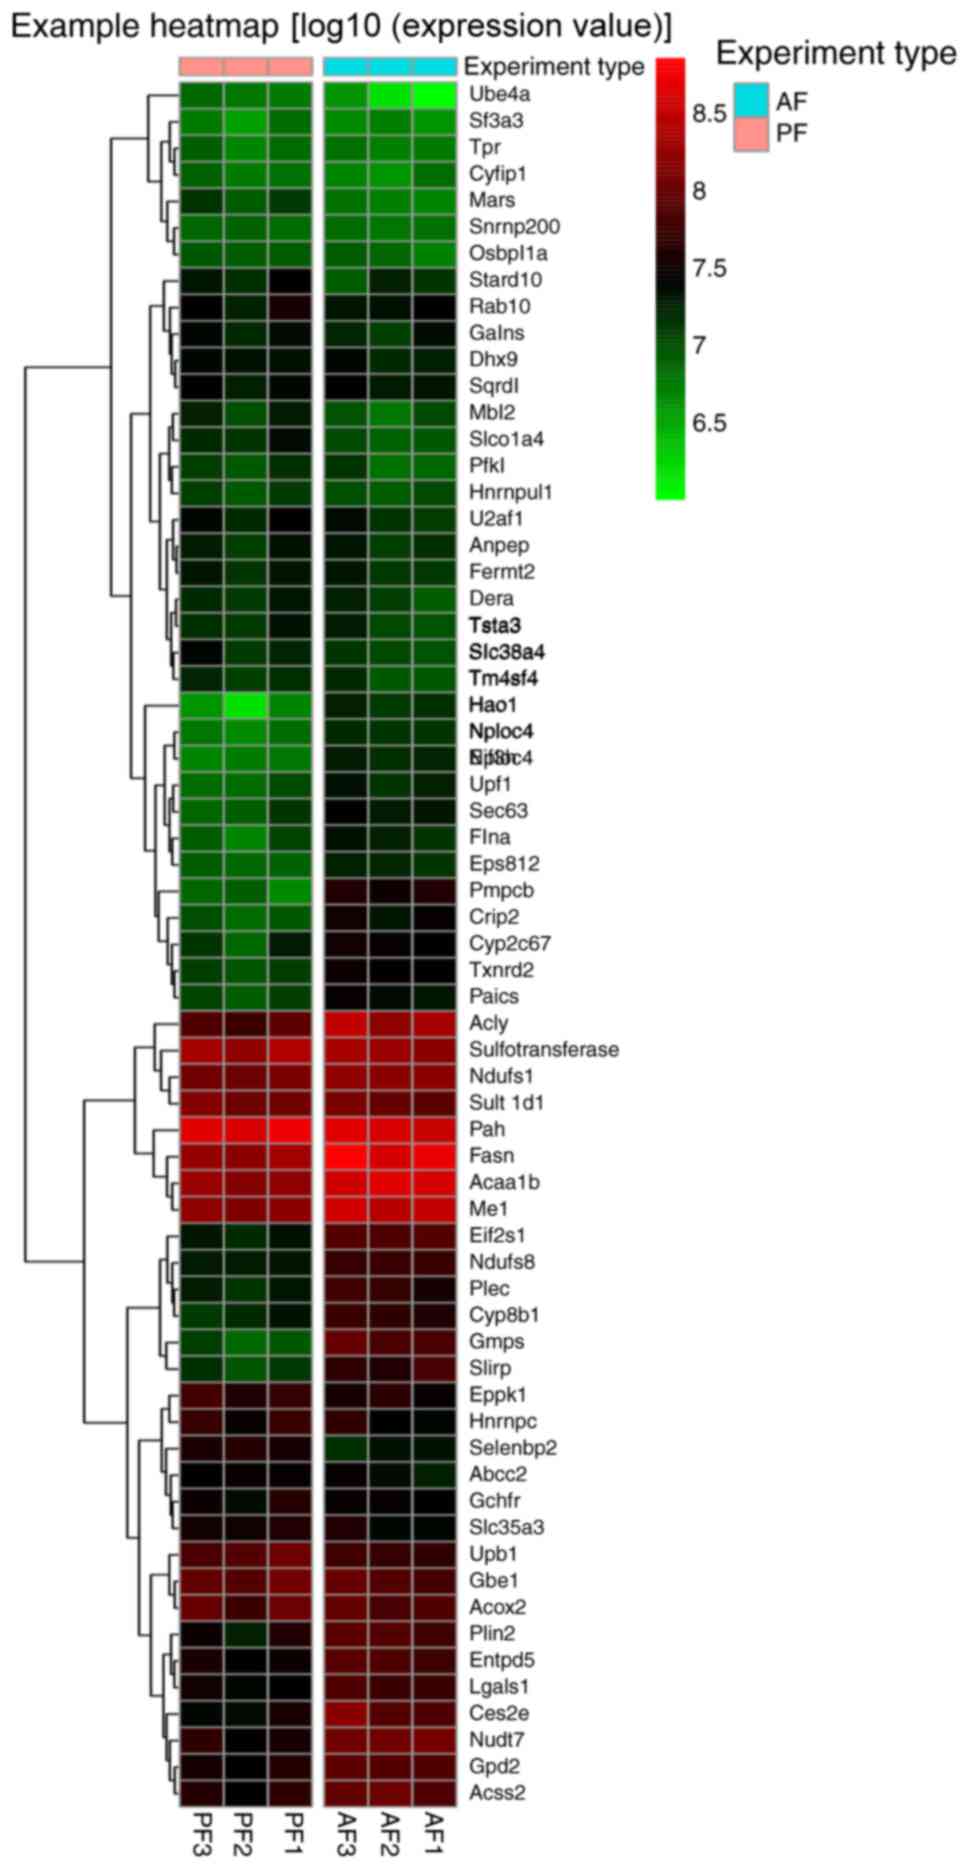
AF and PF. The expression of all 220 DEPs were listed in a
clustering map, to identify proteins with similar expression modes
between AF and PF groups (Fig.
5).
GO analysis
The significantly enriched GO terms (P<0.01 only)
are summarized in Table II. The
significant GOs were categorized according to molecular function,
biological processes and cellular component. When the molecular
function of these DEPs was analyzed, the majority of DEPs were
associated with binding functions, including protein binding, ion
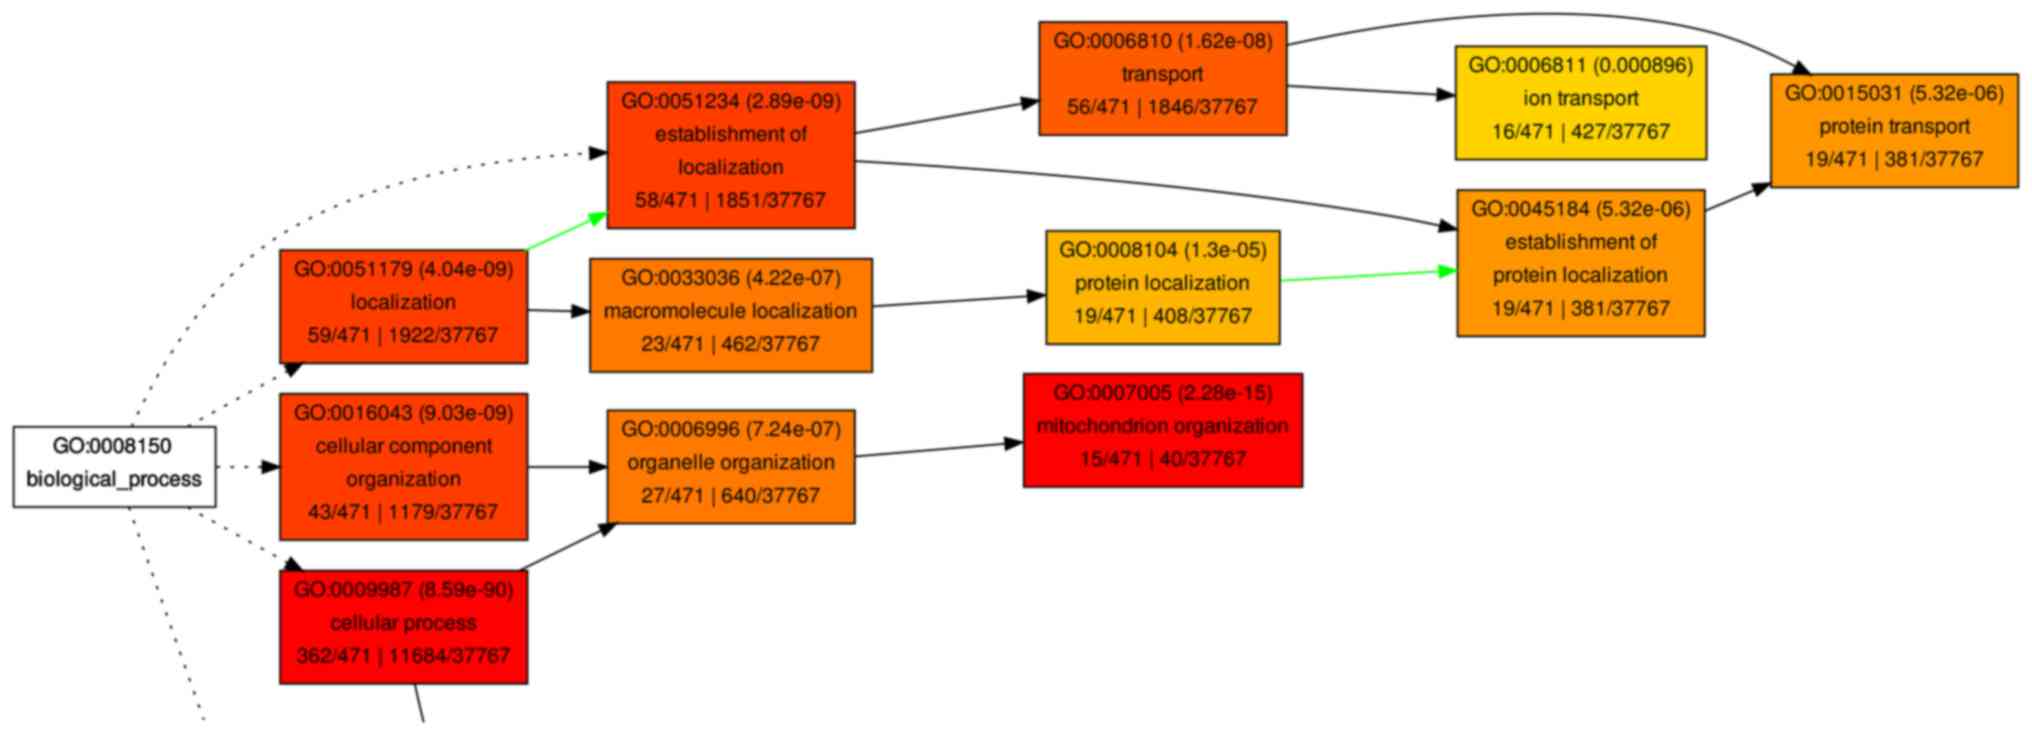
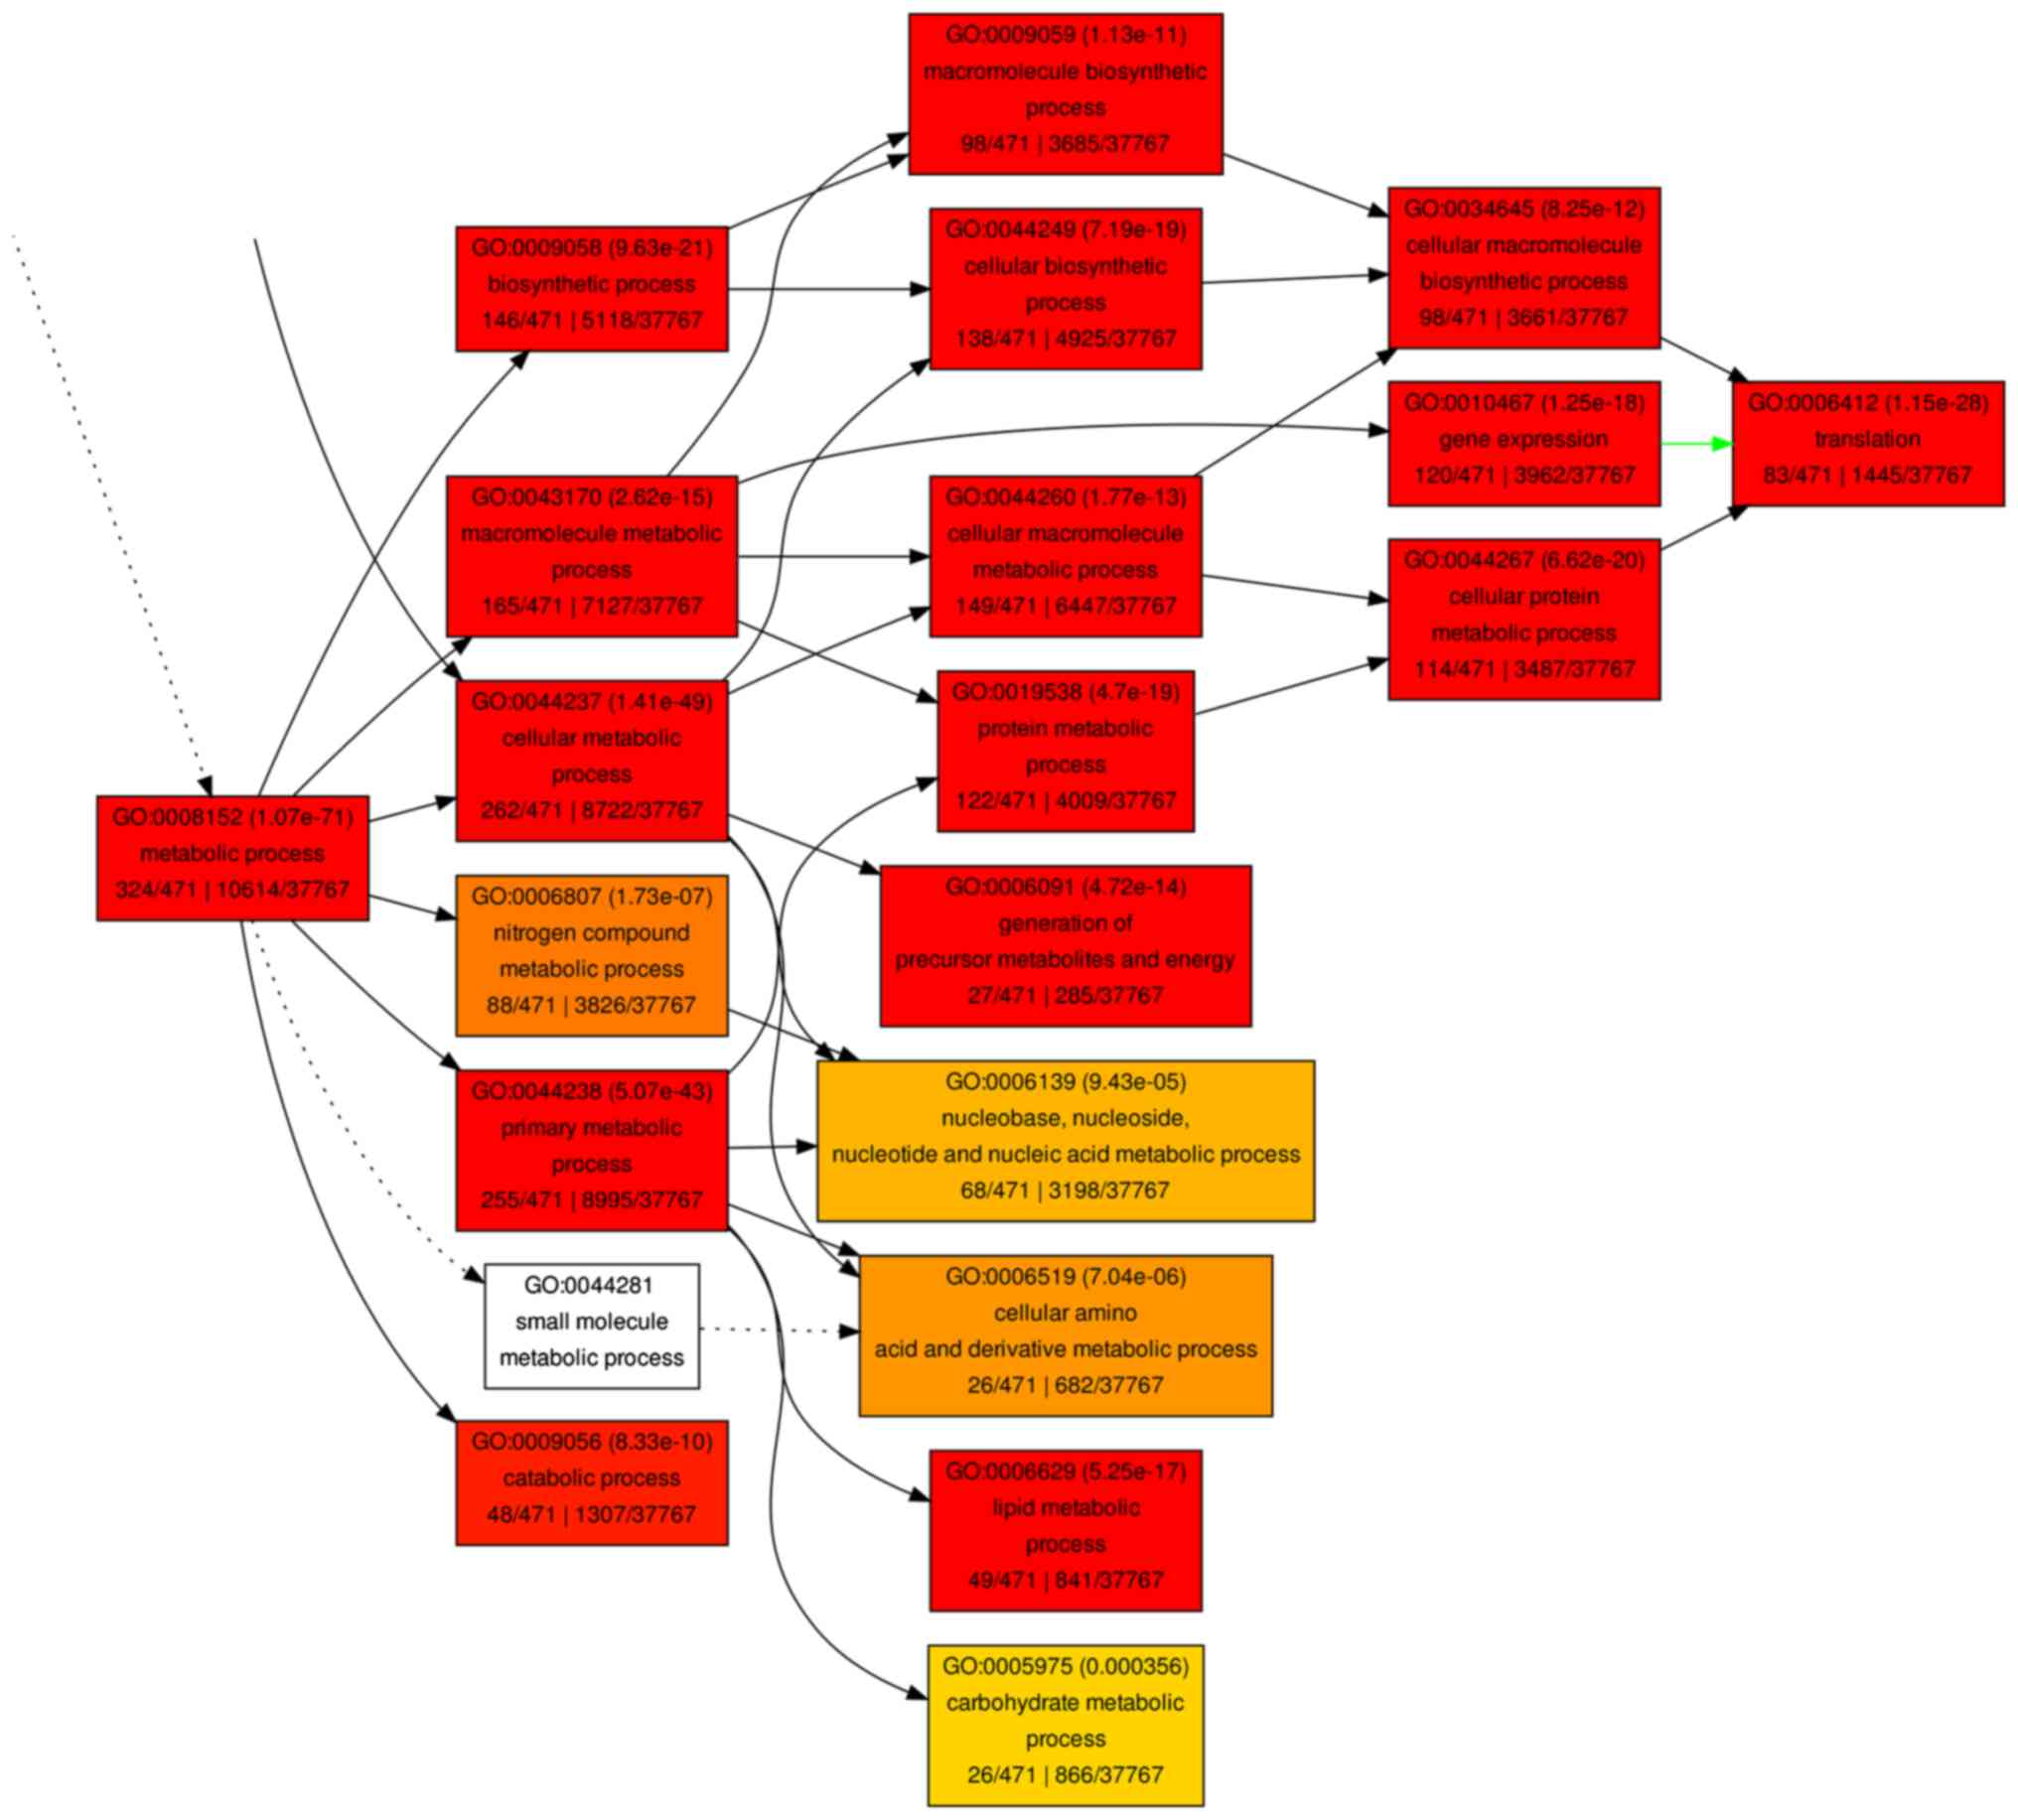
binding and nucleic acid binding. In the biological processes
analysis of GO, the majority of DEPs were associated with
‘metabolic process’, including the ‘macromolecule metabolic
process’, ‘primary metabolic process’ and ‘cellular metabolic
process’. In addition, when the DEPs were analyzed for cellular
components, they were enriched in mitochondria and ribosomes (data
not shown). A hierarchical tree of the GO terms was established
according to their associations (Figs.
6 and 7).
| Table II.Enriched GO terms in biological
process (P<0.01). |
Table II.
Enriched GO terms in biological
process (P<0.01).
| GO ID | Description | Input number | Input all | P-value |
|---|
| GO:0010467 | Gene
expression | 127 | 718 | 0.001414742 |
| GO:0090304 | Nucleic acid
metabolic process | 96 | 718 | 0.000287556 |
| GO:0016070 | RNA metabolic
process | 85 | 718 | 0.000248985 |
| GO:0003677 | DNA binding | 46 | 718 | 0.002166795 |
| GO:0007005 | Mitochondrion
organization | 46 | 718 | 0.002575995 |
| GO:0006351 | Transcription,
DNA-templated | 37 | 718 | 0.001753421 |
| GO:0032774 | RNA biosynthetic
process | 37 | 718 | 0.001753421 |
| GO:0097659 | Nucleic
acid-templated transcription | 37 | 718 | 0.001753421 |
| GO:0000313 | Organellar
ribosome | 22 | 718 | 7.62E-08 |
| GO:0005761 | Mitochondrial
ribosome | 22 | 718 | 7.62E-08 |
| GO:0045321 | Leukocyte
activation | 16 | 718 | 0.001056161 |
| GO:0044801 | Single-organism
membrane fusion | 11 | 718 | 0.001415192 |
| GO:0048284 | Organelle
fusion | 11 | 718 | 0.002478183 |
| GO:0000315 | Organellar large
ribosomal subunit | 10 | 718 | 0.000209737 |
| GO:0005762 | Mitochondrial large
ribosomal subunit | 10 | 718 | 0.000209737 |
| GO:0000149 | SNARE binding |
9 | 718 | 0.000643314 |
| GO:0005085 | Guanyl-nucleotide
exchange factor activity |
9 | 718 | 0.000643314 |
| GO:0000314 | Organellar small
ribosomal subunit |
9 | 718 | 0.001423751 |
| GO:0005763 | Mitochondrial small
ribosomal subunit |
9 | 718 | 0.001423751 |
| GO:0090174 | Organelle membrane
fusion |
8 | 718 | 0.000805555 |
| GO:0031201 | SNARE complex |
8 | 718 | 0.000805555 |
| GO:0005484 | SNAP receptor
activity |
7 | 718 | 0.000265346 |
| GO:0006906 | Vesicle fusion |
7 | 718 | 0.002514721 |
| GO:0005088 | Ras
guanyl-nucleotide exchange factor activity |
6 | 718 | 0.000988442 |
KEGG pathway analysis
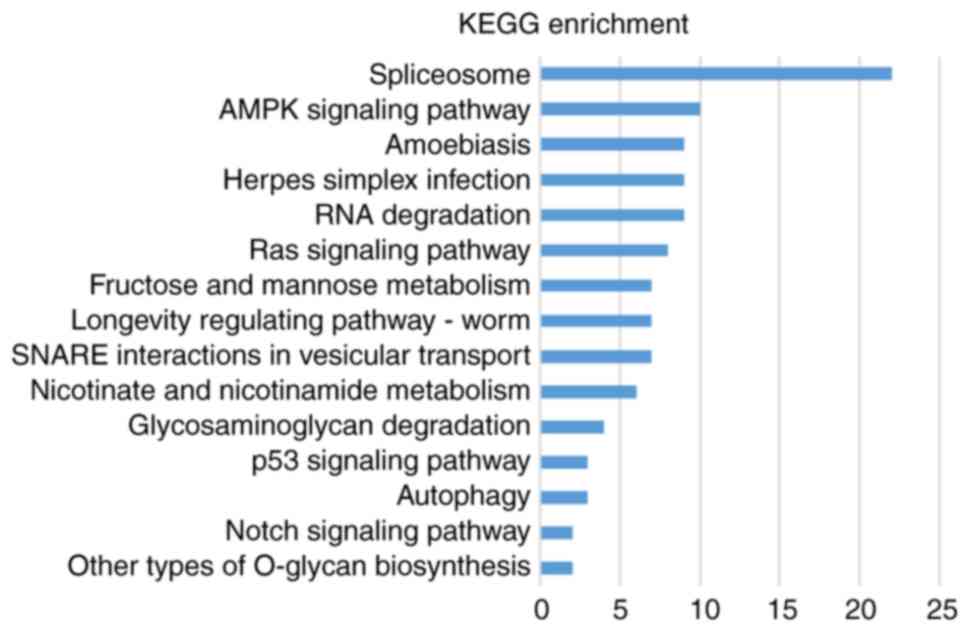
As demonstrated in Fig.
8, the KEGG analysis results demonstrated that the DEPs were
significantly enriched in ‘adenosine monophosphate activated
protein kinase (AMPK) signaling pathway’, ‘Ras signaling pathway’,
‘Notch signaling pathway’, ‘p53 signaling pathway’ and ‘autophagy’
(Fig. 8). These results indicated
that ALD was associated with several biological processes, such as
dysregulated lipid and glucose metabolism, catabolic processing,
cell-cell adhesion, cell amplification. Additionally, these data
indicated that the intervention of these pathways may provide ways
for molecular targeting therapies of ALD.
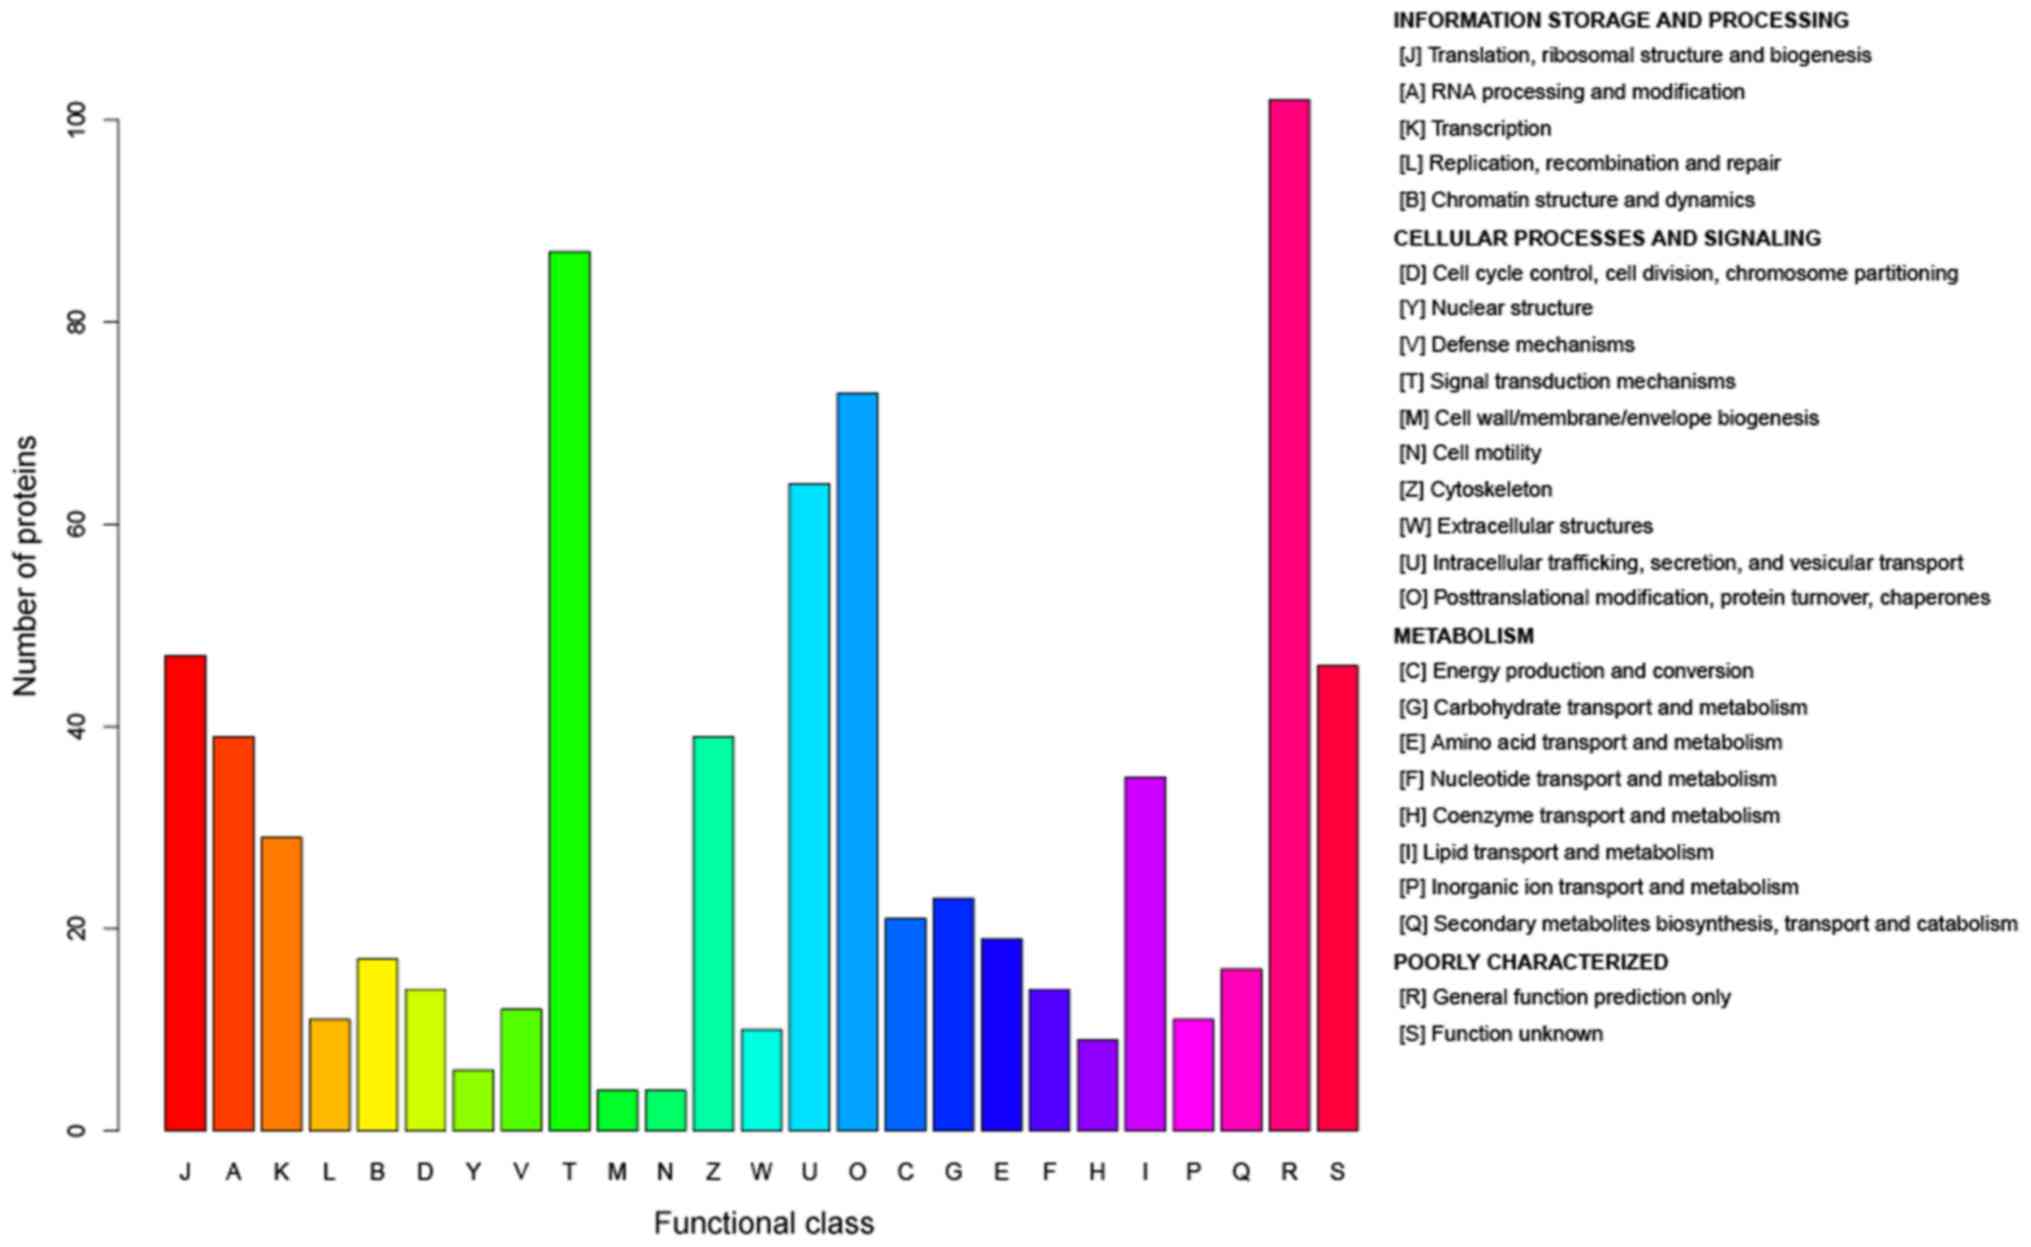
COGs analysis
According to the COGs analysis, the functions of the
DEPs were enriched in ‘information storage and processing’,
‘cellular processes and signaling’ and ‘metabolism’ (Fig. 9). The results indicated that these
processes, particularly the metabolism of lipids, amino acids and
nucleic acid, served important roles in the development of ALD.
Discussion
High-throughput quantitative proteomics has emerged
as a popular method in the search for disease-associated factors
using high-throughput analysis in recent years (12,17–19).
However, to the best of the authors' knowledge, the present study
is the first to use high-throughput quantitative proteomics
analysis in a mouse model of ALD to identify the core proteins
directly, rather than mRNAs. The chronic-plus-binge alcohol feeding
model in mice, which mimics the drinking pattern of patients with
alcoholic hepatitis with a background of drinking for a number of
years (chronic) and a history of recent excessive alcohol
consumption (binge), is now frequently used worldwide (20–23).
In the present study, the ALD model in mice with the liver
steatosis and inflammation was successfully established using this
method.
Label-free quantitative proteomics quantifies
peptides and proteins without the use of stable-isotope labels. It
directly uses a peptide's response (intensity) in the mass
spectrometer as a quantitative measure and infers quantity
indirectly from the number of peptide-to-spectrum matches obtained
for each protein (24,25). The present study identified 220
DEGs in the ALD mice. These DEPs may be used as characteristic
proteins in the diagnosis and treatment of ALD. Several of these
DEPs have been previously described in ALD progression. For
example, acyl-CoA dehydrogenase is involved in mitochondrial
b-oxidation of fatty acids in the ALD progress (26,27).
Glutathione-S-trans-ferases, which are responsible for the
detoxification of potentially toxic by-products of ethanol
metabolism, including acetaldehyde and reactive oxygen species
(ROS), were also identified as downregulated in the AF mice
(28). Eaton et al
(29) reported that chronic
alcohol ingestion leads to downregulation of NADH dehydrogenase
(ubiquinone), consistent with the findings of the present study.
Decreased amounts of ubiquinone can lead to fat accumulation and
increase in free radical damage, leading to liver injury (30,31).
In the present study, ATP-citrate synthase was upregulated, which
catalyzes the exchange of ADP and ATP across the mitochondrial
membrane and supports the increase in ATP generation during ALD
(32). The ubiquitin system has
been mechanistically implicated in a number of human diseases
including cancers and ALD (33).
The ubiquitin system protein E3 ubiquitin-protein ligases TRIP12,
deltex 3-like E3 ubiquitin ligase, HECT domain E3 ubiquitin protein
ligase 3 (HECTD3), HECTD1 and ring finger protein 114, which were
identified as differently expressed in the present study, were
associated with cellular response to DNA damage stimulus, a
ubiquitin-dependent protein catabolic process. This result
suggested that the ubiquitin system is worthy of more attention in
the exploration of ALD. The ethanol-inducible P450, a member of the
cytochrome P450 multifamily, is a major component of the microsomal
ethanol oxidizing system, which metabolizes a small portion of
ethanol (34,35). Previous studies have reported that
hepatic expression of the cytochrome P450 family 2 subfamily E
member 1 (CYP2E1) mRNA and/or expression of the CYP2E1 protein are
increased in different physiological or pathological conditions,
including fasting, a high fat diet, diabetes, obesity or ethanol
intoxication (36,37). Accumulation of ROS due to increased
hepatic CYP2E1 expression may lead to lipid peroxidation of
cellular membranes; antioxidant depletion also causes oxidative
stress then damage liver DNA and contributes to hepatic fibrosis
(38–40). The current study identified that
cytochrome P450, family 2, subfamily c, polypeptide 67 and CYP2E1
were all upregulated in the AF mice.
Using GO and KEGG analyses, the present study
identified various gene functions and signaling pathways that were
significantly altered in ALD, including lipid metabolism, inorganic
ion metabolism, and the AMPK and p53 signaling pathways. These GOs
and pathways may serve critical roles in ALD. Notably, it was
identified that a number of GO terms were associated with protein
and ion metabolism, including ‘iron transport’, ‘protein transport’
and ‘protein localization’. Particularly, 13 of the DEPs were
identified to be associated with the ‘iron ion binding’, including
the upregulated DEP, transferrin receptor 1, and downregulated DEP,
hepcidin, which has been reported to induce the overload of iron in
ALD in previous studies (41–43).
Additionally, it was identified that transferrin receptor protein 2
was increased and hepcidin-2 decreased in AF mice compared with PF
mice. Increasing evidence indicates that AMPK regulates sterol
regulatory element binding transcription factor 1, which is
involved in the control of glucose, lipid and cholesterol
metabolism and participates in the pathogenesis of hepatic
steatosis (44). The DEPs involved
in the AMPK signaling pathway, including fatty acid synthase,
ATP-dependent 6-phosphofructokinase, Acyl-CoA desaturase and
phosphatidylinositol 3-kinase regulatory subunit α, may be the core
proteins in the progression of ALD.
The system of COGs was designed to accommodate the
extremely different evolution rates observed for different genes
and to comprise a framework for functional and evolutionary genome
analysis (45). According to the
COGs analysis, the functions of the DEPs were predominantly
enriched in ‘information storage and processing’, ‘cellular
processes and signaling’, in addition to ‘metabolism’ including
‘lipid transport and metabolism’ and ‘inorganic ion transport and
metabolism’. The results COGs supported GO and pathway analyses,
revealing that proteins associated with metabolism had an important
role in ALD.
In conclusion, label-free quantitative proteomics
using LC-MS/MS was performed to identify DEPs between AF and
control PF mice livers. The present study suggested that certain
DEPs were involved in the response to alcohol and that the core
proteins identified the present study may be useful to predict the
development of ALD. It is hoped that the findings will be further
validated in other experiments in the near future.
Acknowledgements
Not applicable.
Funding
The present study was funded by the Science and
Technology Commission Foundation of Shanghai (grant no.
13DZ1930908).
Availability of data and materials
The datasets used or analyzed during the current
study are available from the corresponding author on reasonable
request.
Authors' contributions
JS and YZ conceived and designed the study. YZ, CZ
and GC performed the experiments. YZ and CZ wrote the paper. JS,
YZ, CZ and GC reviewed and edited the manuscript. All authors read
and approved the manuscript.
Ethics approval and consent to
participate
All procedures of animal care and treatment were
approved by the Institutional Animal Care and Use Committee of
Fudan University (Shanghai, China).
Patient consent for publication
Not applicable.
Competing interests
The authors declare that they have no competing
interests.
References
|
1
|
Rehm J, Samokhvalov AV and Shield KD:
Global burden of alcoholic liver diseases. J Hepatol. 59:160–168.
2013. View Article : Google Scholar : PubMed/NCBI
|
|
2
|
Allampati S and Mullen KD: Long-term
management of alcoholic liver disease. Clin Liver Dis. 20:551–562.
2016. View Article : Google Scholar : PubMed/NCBI
|
|
3
|
Dugum M and McCullough A: Diagnosis and
management of alcoholic liver disease. J Clin Transl Hepatol.
3:109–116. 2015. View Article : Google Scholar : PubMed/NCBI
|
|
4
|
Hoek JB, Cahill A and Pastorino JG:
Alcohol and mitochondria: A dysfunctional relationship.
Gastroenterology. 122:2049–2063. 2002. View Article : Google Scholar : PubMed/NCBI
|
|
5
|
Ceni E, Mello T and Galli A: Pathogenesis
of alcoholic liver disease: Role of oxidative metabolism. World J
Gastroenterol. 20:17756–17772. 2014. View Article : Google Scholar : PubMed/NCBI
|
|
6
|
Szabo G: Gut-liver axis in alcoholic liver
disease. Gastroenterology. 148:30–36. 2015. View Article : Google Scholar : PubMed/NCBI
|
|
7
|
Titz B, Elamin A, Martin F, Schneider T,
Dijon S, Ivanov NV, Hoeng J and Peitsch MC: Proteomics for systems
toxicology. Comput Struct Biotechnol J. 11:73–90. 2014. View Article : Google Scholar : PubMed/NCBI
|
|
8
|
Tzeng SC and Maier CS: Label-free
proteomics assisted by affinity enrichment for elucidating the
chemical reactivity of the liver mitochondrial proteome toward
adduction by the lipid electrophile 4-hydroxy-2-nonenal (HNE).
Front Chem. 4:22016. View Article : Google Scholar : PubMed/NCBI
|
|
9
|
Bantscheff M, Lemeer S, Savitski MM and
Kuster B: Quantitative mass spectrometry in proteomics: Critical
review update from 2007 to the present. Anal Bioanal Chem.
404:939–965. 2012. View Article : Google Scholar : PubMed/NCBI
|
|
10
|
Nan YM, Kong LB, Ren WG, Wang RQ, Du JH,
Li WC, Zhao SX, Zhang YG, Wu WJ, Di HL, et al: Activation of
peroxisome proliferator activated receptor alpha ameliorates
ethanol mediated liver fibrosis in mice. Lipids Health Dis.
12:112013. View Article : Google Scholar : PubMed/NCBI
|
|
11
|
Bailey SM, Andringa KK, Landar A and
Darley-Usmar VM: Proteomic approaches to identify and characterize
alterations to the mitochondrial proteome in alcoholic liver
disease. Methods Mol Biol. 447:369–380. 2008. View Article : Google Scholar : PubMed/NCBI
|
|
12
|
Zhan C, Yan L, Wang L, Jiang W, Zhang Y,
Xi J, Jin Y, Chen L, Shi Y, Lin Z and Wang Q: Landscape of
expression profiles in esophageal carcinoma by the cancer genome
atlas data. Dis Esophagus. 29:920–928. 2016. View Article : Google Scholar : PubMed/NCBI
|
|
13
|
Yan L, Zhan C, Wu J and Wang S: Expression
profile analysis of head and neck squamous cell carcinomas using
data from the cancer genome atlas. Mol Med Rep. 13:4259–4265. 2016.
View Article : Google Scholar : PubMed/NCBI
|
|
14
|
Livak KJ and Schmittgen TD: Analysis of
relative gene expression data using real-time quantitative PCR and
the 2(-Delta Delta C(T)) method. Methods. 25:402–408. 2001.
View Article : Google Scholar : PubMed/NCBI
|
|
15
|
Gene Ontology Consortium, . The Gene
Ontology (GO) project in 2006. Nucleic Acids Res. 34:D322–D326.
2006. View Article : Google Scholar : PubMed/NCBI
|
|
16
|
Kanehisa M, Goto S, Kawashima S, Okuno Y
and Hattori M: The KEGG resource for deciphering the genome.
Nucleic Acids Res. 32:D277–D280. 2004. View Article : Google Scholar : PubMed/NCBI
|
|
17
|
Kim DH, Lee EM, Do SH, Jeong DH and Jeong
KS: Changes of the cytoplasmic proteome in response to alcoholic
hepatotoxicity in rats. Int J Mol Sci. 16:18664–18682. 2015.
View Article : Google Scholar : PubMed/NCBI
|
|
18
|
Lee SJ, Lee DE, Kang JH, Nam MJ, Park JW,
Kang BS, Lee DS, Lee HS and Kwon OS: New potential biomarker
proteins for alcoholic liver disease identified by a comparative
proteomics approach. J Cell Biochem. 118:1189–11200. 2017.
View Article : Google Scholar : PubMed/NCBI
|
|
19
|
Tran M, Yang Z, Liangpunsakul S and Wang
L: Metabolomics analysis revealed distinct cyclic changes of
metabolites altered by chronic ethanol-plus-binge andshp
deficiency. Alcohol Clin Exp Res. 40:2548–2556. 2016. View Article : Google Scholar : PubMed/NCBI
|
|
20
|
Ki SH, Park O, Zheng M, Morales-Ibanez O,
Kolls JK, Bataller R and Gao B: Interleukin-22 treatment
ameliorates alcoholic liver injury in a murine model of
chronic-binge ethanol feeding: Role of signal transducer and
activator of transcription 3. Hepatology. 52:1291–1300. 2010.
View Article : Google Scholar : PubMed/NCBI
|
|
21
|
Bertola A, Mathews S, Ki SH, Wang H and
Gao B: Mouse model of chronic and binge ethanol feeding (the NIAAA
model). Nat Protoc. 8:627–637. 2013. View Article : Google Scholar : PubMed/NCBI
|
|
22
|
Choi G and Runyon BA: Alcoholic hepatitis:
A clinician's guide. Clin Liver Dis. 16:371–385. 2012. View Article : Google Scholar : PubMed/NCBI
|
|
23
|
Mathurin P and Lucey MR: Management of
alcoholic hepatitis. Drug Ther Bull. 56:S39–S45. 2012.
|
|
24
|
Patel VJ, Thalassinos K, Slade SE,
Connolly JB, Crombie A, Murrell JC and Scrivens JH: A comparison of
labeling and label-free mass spectrometry-based proteomics
approaches. J Proteome Res. 8:3752–3759. 2009. View Article : Google Scholar : PubMed/NCBI
|
|
25
|
Bantscheff M, Lemeer S, Savitski MM and
Kuster B: Quantitative mass spectrometry in proteomics: Critical
review update from 2007 to the present. Anal Bioanal Chem.
404:939–965. 2012. View Article : Google Scholar : PubMed/NCBI
|
|
26
|
Sprecher H: New advances in fatty-acid
biosynthesis. Nutrition. 12 1 Suppl:S5–S7. 1996. View Article : Google Scholar : PubMed/NCBI
|
|
27
|
Pace CP and Stankovich MT:
Oxidation-reduction properties of short-chain acyl-CoA
dehydrogenase: Effects of substrate analogs. Arch Biochem Biophys.
313:261–266. 1994. View Article : Google Scholar : PubMed/NCBI
|
|
28
|
Ladero JM, Martinez C, Garcia-Martin E,
Fernández-Arquero M, López-Alonso G, de la Concha EG, Díaz-Rubio M
and Agúndez JA: Polymorphisms of the glutathione S-transferases
mu-1 (GSTM1) and theta-1 (GSTT1) and the risk of advanced alcoholic
liver disease. Scand J Gastroenterol. 40:348–353. 2005. View Article : Google Scholar : PubMed/NCBI
|
|
29
|
Eaton S, Record CO and Bartlett K:
Multiple biochemical effects in the pathogenesis of alcoholic fatty
liver. Eur J Clin Invest. 27:719–722. 1997. View Article : Google Scholar : PubMed/NCBI
|
|
30
|
Cunningham CC and Bailey SM: Ethanol
consumption and liver mitochondria function. Biol Signals Recept.
10:271–282. 2001. View Article : Google Scholar : PubMed/NCBI
|
|
31
|
Chacko BK, Srivastava A, Johnson MS,
Benavides GA, Chang MJ, Ye Y, Jhala N, Murphy MP, Kalyanaraman B
and Darley-Usmar VM: Mitochondria-targeted ubiquinone (MitoQ)
decreases ethanol-dependent micro and macro hepatosteatosis.
Hepatology. 54:153–163. 2011. View Article : Google Scholar : PubMed/NCBI
|
|
32
|
Sugimoto K and Takei Y: Pathogenesis of
alcoholic liver disease. Hepatol Res. 47:70–79. 2016. View Article : Google Scholar : PubMed/NCBI
|
|
33
|
Williams JA, Ni H, Ding Y and Ding W:
Parkin regulates mitophagy and mitochondrial function to protect
against alcohol-induced liver injury and steatosis in mice. Am J
Physiol Gastrointest Liver Physiol. 309:G324–G340. 2015. View Article : Google Scholar : PubMed/NCBI
|
|
34
|
Lieber CS and DeCarli LM: Ethanol
oxidation by hepatic microsomes: Adaptive increase after ethanol
feeding. Science. 162:917–918. 1968. View Article : Google Scholar : PubMed/NCBI
|
|
35
|
Lieber CS and DeCarli LM: Hepatic
microsomal ethanol-oxidizing system. In vitro characteristics and
adaptive properties in vivo. J Biol Chem. 245:2505–2512.
1970.PubMed/NCBI
|
|
36
|
Robin M, Sauvage I, Grandperret T,
Descatoire V, Pessayre D and Fromenty B: Ethanol increases
mitochondrial cytochrome P450 2E1 in mouse liver and rat
hepatocytes. Febs Lett. 579:6895–6902. 2005. View Article : Google Scholar : PubMed/NCBI
|
|
37
|
Cieślak A, Kelly I, Trottier J, Verreault
M, Wunsch E, Milkiewicz P, Poirier G, Droit A and Barbier O:
Selective and sensitive quantification of the cytochrome P450 3A4
protein in human liver homogenates through multiple reaction
monitoring mass spectrometry. Proteomics. 16:2827–2837. 2016.
View Article : Google Scholar : PubMed/NCBI
|
|
38
|
Bradford BU, Kono H, Isayama F, Kosyk O,
Wheeler MD, Akiyama TE, Bleye L, Krausz KW, Gonzalez FJ, Koop DR
and Rusyn I: Cytochrome P450 CYP2E1, but not nicotinamide adenine
dinucleotide phosphate oxidase, is required for ethanol-induced
oxidative DNA damage in rodent liver. Hepatology. 41:336–344. 2005.
View Article : Google Scholar : PubMed/NCBI
|
|
39
|
Lieber CS: The discovery of the microsomal
ethanol oxidizing system and its physiologic and pathologic role.
Drug Metab Rev. 36:511–529. 2004. View Article : Google Scholar : PubMed/NCBI
|
|
40
|
Nieto N: Stimulation and proliferation of
primary rat hepatic stellate cells by cytochrome P450 2E1-derived
reactive oxygen species. Hepatology. 35:62–73. 2002. View Article : Google Scholar : PubMed/NCBI
|
|
41
|
Bridle K, Cheung TK, Murphy T, Walters M,
Anderson G, Crawford DG and Fletcher LM: Hepcidin is down-regulated
in alcoholic liver injury: Implications for the pathogenesis of
alcoholic liver disease. Alcohol Clin Exp Res. 30:106–112. 2006.
View Article : Google Scholar : PubMed/NCBI
|
|
42
|
Suzuki Y, Saito H, Suzuki M, Hosoki Y,
Sakurai S, Fujimoto Y and Kohgo Y: Up-regulation of transferrin
receptor expression in hepatocytes by habitual alcohol drinking is
implicated in hepatic iron overload in alcoholic liver disease.
Alcohol Clin Exp Res. 26:26S–31S. 2002. View Article : Google Scholar : PubMed/NCBI
|
|
43
|
Kohgo Y, Ohtake T, Ikuta K, Suzuki Y,
Torimoto Y and Kato J: Dysregulation of systemic iron metabolism in
alcoholic liver diseases. J Gastroenterol Hepatol. 23 Suppl
1:S78–S81. 2008. View Article : Google Scholar : PubMed/NCBI
|
|
44
|
Bai T, Yang Y, Yao YL, Sun P, Lian LH, Wu
YL and Nan JX: Betulin alleviated ethanol-induced alcoholic liver
injury via SIRT1/AMPK signaling pathway. Pharmacol Res. 105:1–12.
2016. View Article : Google Scholar : PubMed/NCBI
|
|
45
|
Angiuoli SV, Matalka M, Gussman A, Galens
K, Vangala M, Riley DR, Arze C, White JR, White O and Fricke WF:
CloVR: A virtual machine for automated and portable sequence
analysis from the desktop using cloud computing. BMC
Bioinformatics. 12:3562011. View Article : Google Scholar : PubMed/NCBI
|