Introduction
Glioma is the most common malignant brain tumor, and
inflicts personal distress and social and financial burdens
(1). The incidence of glioma is
increasing and the median survival rate for patients with
glioblastomas is <2 years (2,3).
Although certain techniques based on oncolytic viral therapy and
neural precursor cells are promising in the treatment of glioma,
their therapeutic effects are limited (4–6).
Despite improvements in current therapeutic strategies, the overall
prognosis for patients with glioma remains poor (7,8).
Therefore, novel therapies are required to specifically target
tumor cells, particularly cells that have important roles in the
potential pathogenesis of glioma.
Genes and genetic factors are strongly associated
with the development of glioma (9). Gene expression analyses may be used
to investigate the biomarkers and potential therapeutic targets for
glioma (10). Gene
expression-based classification of malignant glioma is thought to
be a better indicator of survival than histological classification
(11). A previous study
demonstrated that downregulation of cyclin-dependent kinase 1
(CDK1) expression may inhibit the proliferation of human malignant
glioma (12). In addition,
lentivirus-mediated knockdown of cyclin Y inhibits the
proliferation of glioma cells (13). Furthermore, large-scale gene
expression analysis and subset analysis of glioma revealed
unrecognized heterogeneity of tumors and were efficient methods of
predicting prognosis-associated genes (14).
A microRNA (miRNA/miR) is a small non-coding RNA
molecule that functions in RNA silencing and post-transcriptional
regulation of gene expression (15). In total, >50% of mRNAs are
regulated by miRNAs, and one miRNA may target hundreds of different
genes (16). Of all miRNA species,
~60% are present in the brain (17). As a result, miRNAs are reported to
be involved in various functions associated with the brain,
including learning, memory, neurological diseases (18) and neuroprotection (19). It was previously reported that the
dysregulation of miRNA-21 and miRNA-10b may disrupt the migration
of glioma cells and inhibit glioma cell migration and invasion
(20). In addition, miRNA-16 was
reported to suppress epithelial-mesenchymal transition-associated
gene expression in human glioma (21). Therefore, alterations in miRNA
expression may have an important role in glioma progression
(22). However, potential gene
markers associated with glioma based on gene or miRNA expression
remain unclear.
Sandberg et al (23) performed genome-wide analysis that
directly compared the gene expression profile of glioblastoma stem
cells from patients with glioma to stem cells from the normal
adult. The study revealed 30 signature genes that were associated
with clinical outcome and demonstrated the clinical relevance of
glioblastoma stem cells in glioma. However, based on the large
amount of information in the gene expression profile, the data
concerning the role of potential gene markers based on genes or
miRNAs in glioma were limited. In the present study, bioinformatics
analysis based on the microarray data deposited by Sandberg et
al (23) was performed.
Function and pathway analysis based on differentially expressed
genes (DEGs) between neural stem cell samples (control group) and
glioma samples (glioma group) was performed, followed by
protein-protein interaction (PPI) network analysis. Subsequently,
analysis was performed to identify potential miRNA-target
regulation in the process of glioma. The present study aimed to
determine a detailed mechanism of transcriptional regulation in
glioma, and provide a novel strategy for therapy based on a
comprehensive understanding of glioma progression.
Materials and methods
Samples
The gene expression profile of GSE31262 (23) was downloaded from the Gene
Expression Omnibus (http://www.ncbi.nlm.nih.gov/geo/), which was based on
the platform of GPL2986 ABI Human Genome Survey Microarray Version
2. In total, 5 neural stem cell samples (control group) and 9
glioma samples (glioma group) were included in this profile.
Annotation information of all probe sets was also downloaded from
the platform.
Data preprocessing and differential
expression analysis
Probe-level data in CEL files were converted into
expression values. In the case that >1 probe corresponded to one
single gene, the average value was considered as the final gene
expression. The missing values were imputed based on the estimation
method of Troyanskaya et al (24) and the complete data were
subsequently standardized (25).
The non-pairing t-test in the Linear Models for Microarray Data
(Limma; version 3.10.3; http://www.bioconductor.org/packages/release/bioc/html/limma.html)
package in R language (version 3.3.2) (26) was performed to calculate the
statistical significance for each gene. P<0.01 and
|log2 fold change (FC)| ≥2 were selected as the
threshold for the identification of DEGs. Hierarchical clustering
analysis of DEGs was conducted using pheatmap package (version
1.0.8; http://cran.r-project.org/web/packages/pheatmap/index.html)
in R (version 3.3.2) software (27).
Functional and pathway enrichment
analysis of DEGs
Based on the deficiency of individual gene analysis,
gene set enrichment analysis was performed to evaluate differential
expression patterns of gene groups. The Database for Annotation,
Visualization and Integrated Discovery (DAVID; version 6.8;
http://david.abcc.ncifcrf.gov/) is a
gene functional classification tool that provides a comprehensive
set of functional annotation tools for investigators to understand
the biological meaning behind large lists of genes (28,29).
Gene Ontology (GO) includes three functional categories: Molecular
function (MF); biological process (BP); and cellular component (CC)
(30). GO functional enrichment
(31) was performed based on
DAVID. The Kyoto Encyclopedia of Genes and Genomes (KEGG;
http://www.genome.jp/kegg/) pathway
database (32) comprises a
collection of manually drawn pathway maps concerning molecular
interaction and reaction networks. In the present study, KEGG
pathway enrichment analysis was performed based on DAVID. A count
(the number of DEGs associated with a target function or pathway)
≥2 and P<0.05 were selected as the cut-off criteria for
significant target functions and pathways.
PPI network and module network
analysis
The investigation of PPIs may aid the identification
of protein functions at the molecular level and improve the
understanding of various cellular activities, including growth,
development, metabolism, differentiation and apoptosis (33). The Search Tool for the Retrieval of
Interacting Genes (STRING; www.string-db.org/) is a database that provides
experimental and predicted interaction information (34). The proteins associated with DEGs
were selected according to the STRING database (version 10.0). When
the required confidence (score) was >0.4, there was a
protein-protein interaction, which was selected to establish the
PPI network. The network was visualized by Cytoscape (version
3.2.0) software (35).
Subsequently, the MCODE (version 1.4.2; http://apps.cytoscape.org/apps/MCODE) tool in
Cytoscape (36) was used to
analyze the clusters of the PPI network.
miRNA-target gene network
construction
The potential targets of miRNAs were investigated by
using WebGestal (http://www.webgestalt.org/option.php) (37,38)
software. The miRNA-target regulatory network was constructed with
miRNAs that were associated with the top15 upregulated and the
top15 downregulated DEGs, and was visualized by Cytoscape
software.
Validation of gene expression by
reverse transcription-quantitative polymerase chain reaction
(RT-qPCR)
Based on the results of bioinformatics analysis, the
major DEGs were validated by RT-qPCR. Normal human astrocytes
(HA1800) and U87 glioma cells were purchased from Cell Bank of
Chinese academy of science (Shanghai, China), and cultured in the
RPMI-1640 medium (Thermo Fisher Scientific, Inc., Waltham, MA, USA)
and Dulbecco's modified Eagle's medium (Thermo Fisher Scientific,
Inc.), respectively, supplemented with 10% fetal bovine serum (FBS;
Gibco, Carlsbad, CA, USA), 1% streptomycin and 1% penicillin
(Gibco; Thermo Fisher Scientific, Inc.) at 37°C in a humidified
incubator containing 5% CO2. Following the HA1800 and
U87 glioma cells being serially passaged for 3 generations, total
RNA was extracted from the cells using RNAiso Plus (Takara
Biotechnology Co., Ltd., Dalian, China) reagent to detect the mRNA
expression of DEGs. The total RNA was reversed transcribed using a
PrimeScript RT Master Mix (Perfect Real-Time; Takara Bio, Inc.,
Otsu, Japan) according to the following procedure: 37°C for 1 h and
85°C for 5 sec. Following cDNA synthesis, mRNA expression levels
were assessed using the Power SYBR Green PCR Master Mix (Applied
Biosystems; Thermo Fisher Scientific, Inc.) and the GAPDH
transcript was used as the reference gene. The qPCR protocol was:
Denaturation (95°C for 3 min), cycling (95°C for 10 sec), annealing
(60°C for 30 sec) for 40 cycles at a qPCR machine (model: ViiA7;
Applied Biosystems; Thermo Fisher Scientific, Inc.). All
experiments were carried out in triplicate. Relative gene
expression was calculated using the 2−ΔΔCq method
(39). The primer sequences for
the genes were as follows: CDK1, 5′-CCCTTTAGCGCGGATCTACC-3′
(forward) and 5′-ATGGCTACCACTTGACCTGT-3′ (reverse); cell division
cycle 20 (CDC20), 5′-CAGCATCAAGGGGCTGTCAA-3′ (forward) and
5′-GAGACCAGAGGATGGAGCAC-3′ (reverse); polo-like kinase 1 (PLK1),
5′-CTGCCTGACCATTCCACCAA-3′ (forward) and 5′-CCTCACCTGTCTCTCGAACC-3′
(reverse); aurora kinase A (AURKA), 5′-CTCCGTCCCTGAGTGTCCTT-3′
(forward) and 5′-AAATATCCCCGCACTCTGGC-3′ (reverse); cadherin 1
(CDH1), 5′-CGAGAGCTACACGTTCACGG-3′ (forward) and
5′-TTTGAATCGGGTGTCGAGGG-3′ (reverse); forkhead box O1 (FOXO1),
5′-TCAAGAGCGTGCCCTACTTC-3′ (forward) and 5′-TCTTGCCACCCTCTGGATTG-3′
(reverse); G-protein subunit αi1 (GNAI1),
5′-ACAGGGTTCTGTCTCCGCTG-3′ (forward) and
5′-TCCCCATAGCCCTAATGATAGC-3′ (reverse); and GAPDH,
5′-TGACAACTTTGGTATCGTGGAAGG-3′ (forward) and
5′-AGGCAGGGATGATGTTCTGGAGAG-3′ (reverse).
Statistical analysis
Data are presented as the mean ± standard deviation.
Differences between groups were analyzed statistically by Student's
t-test using SPSS 19.0 software (IBM Corp., Armonk, NY, USA).
P<0.05 was considered to indicate a statistically significant
difference.
Results
DEGs between glioma and control
groups
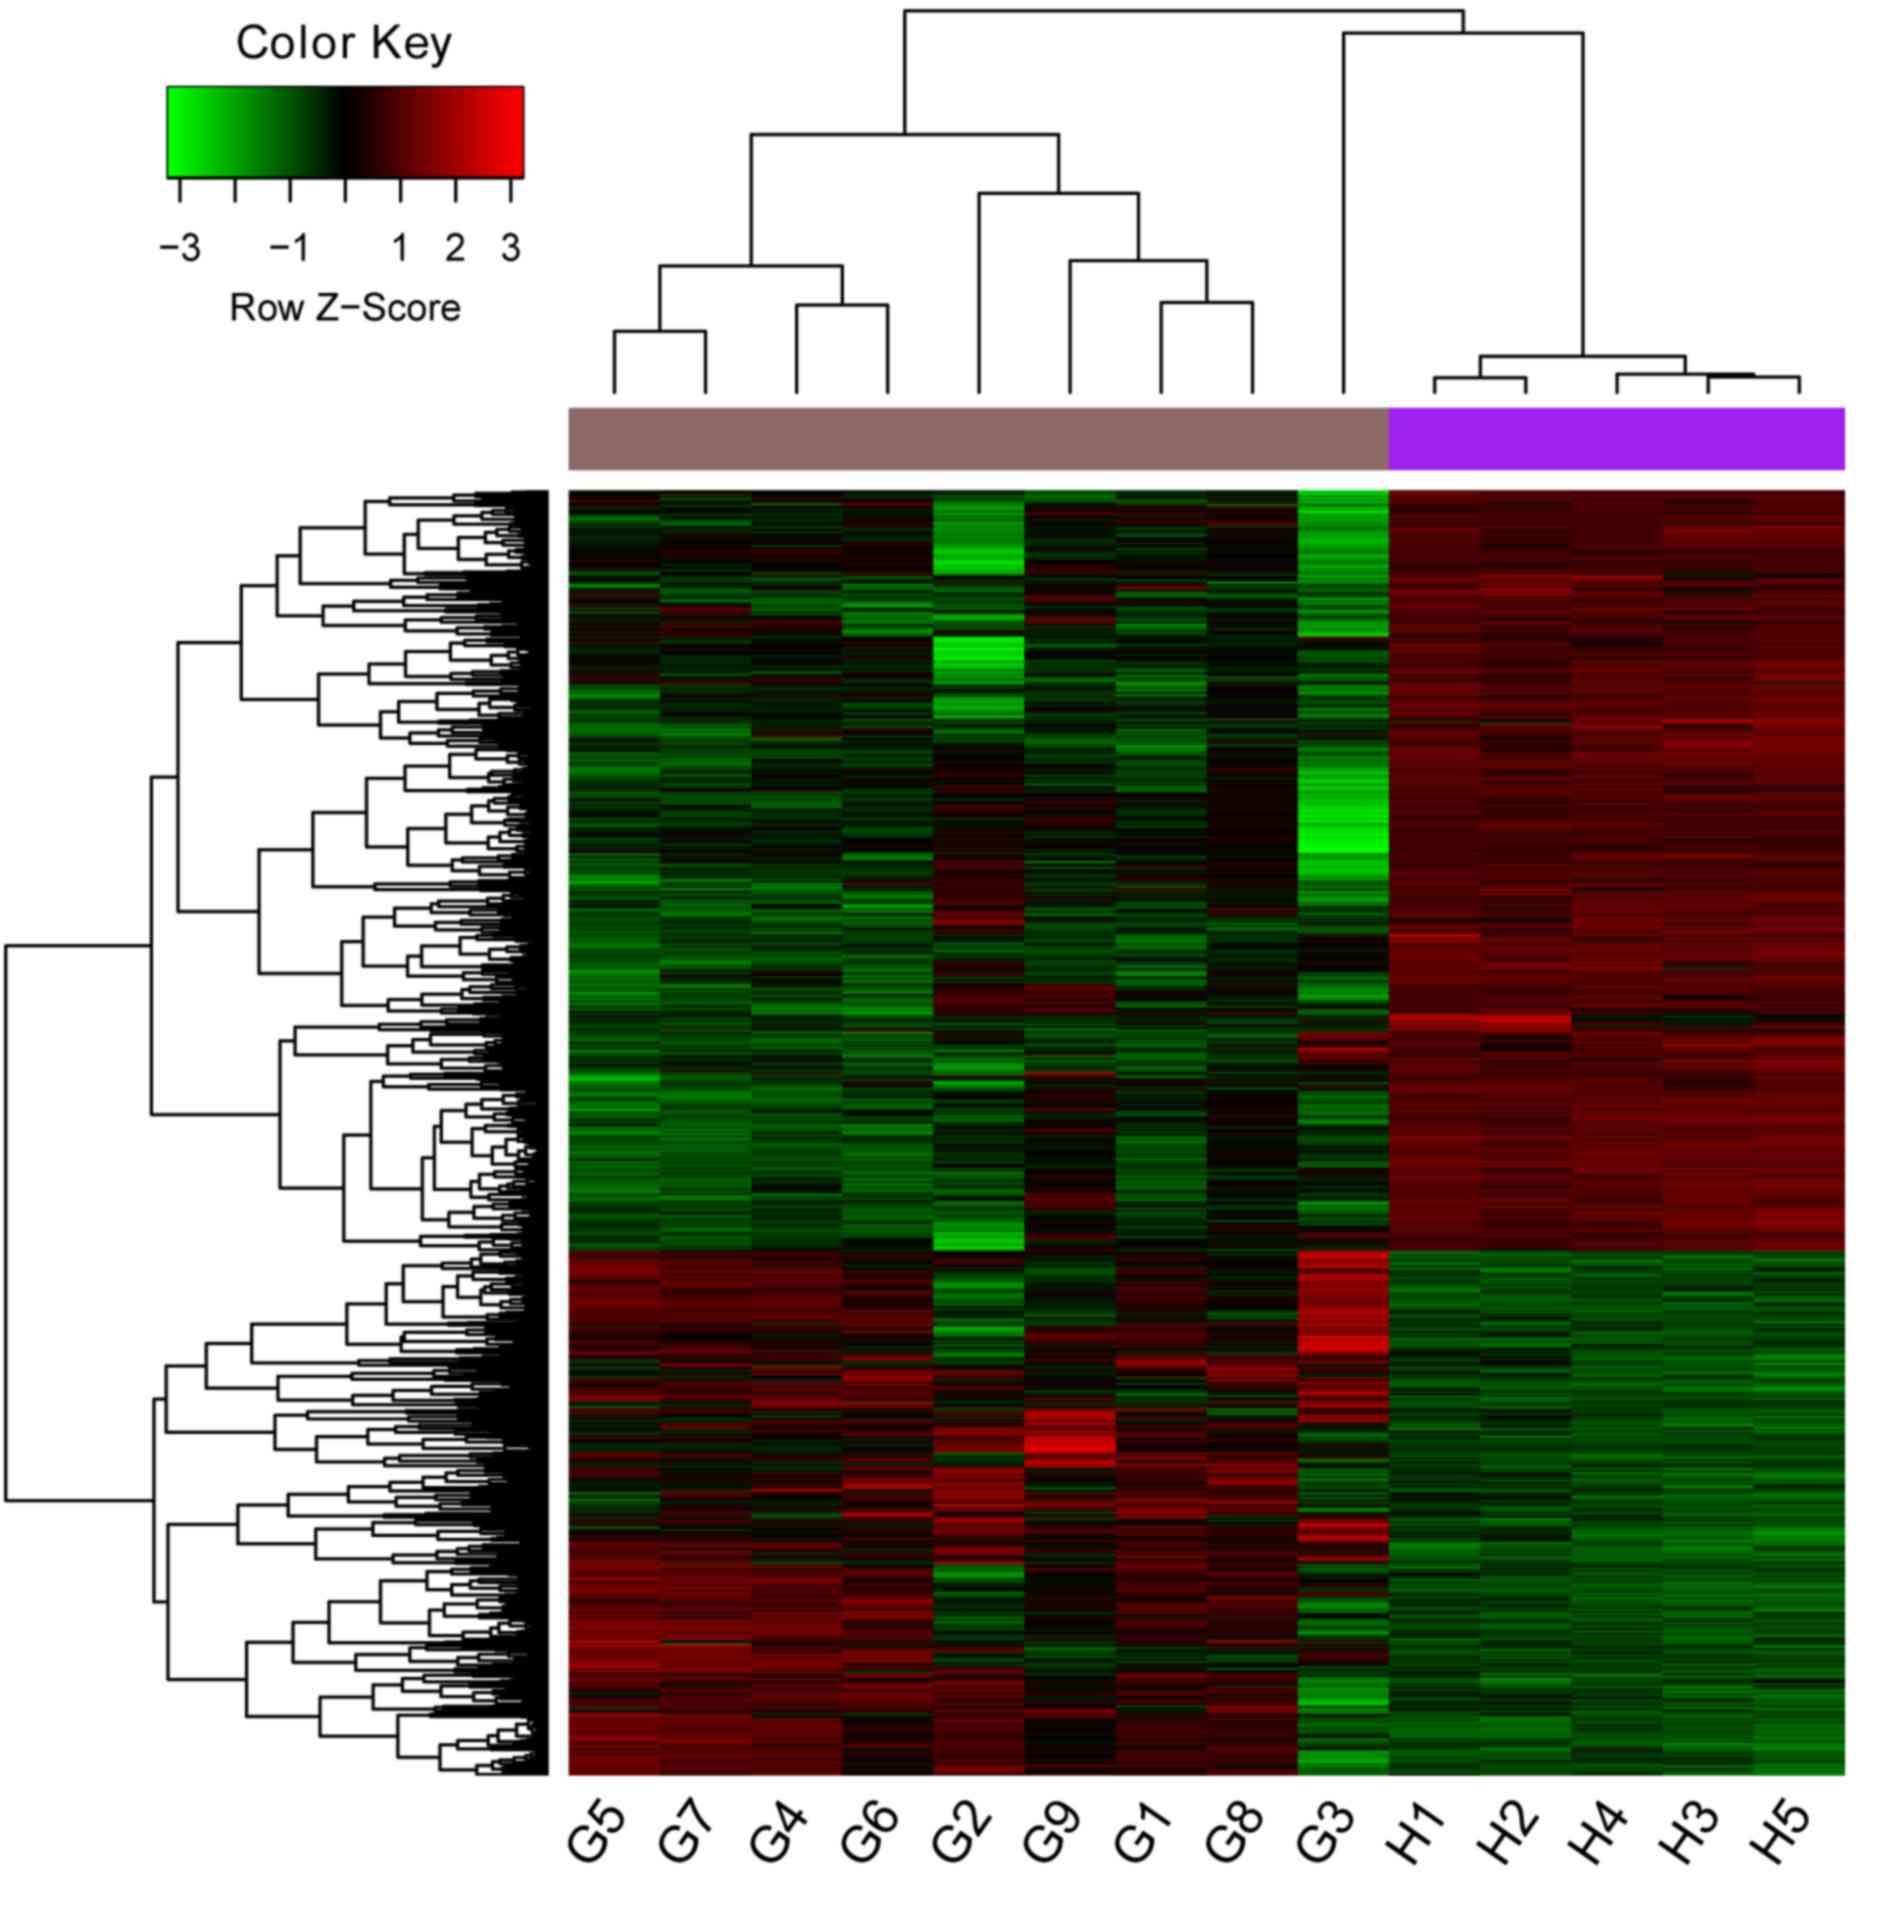
Under the conditions of P<0.01 and
|log2FC| ≥2, a total of 1377 DEGs, including 562
upregulated and 815 downregulated genes, were identified. The
heatmap constructed for DEGs in different samples is presented in
Fig. 1.
GO function and KEGG pathway
enrichment analyses
GO function and KEGG pathways enriched with DEGs
were investigated with DAVID. The results of GO analysis
demonstrated that upregulated DEGs were primarily associated with
functions that included M phase (P=4.94×10⁻³⁰), spindle
(P=1.73×10⁻¹⁷) and chromatin binding
(P=1.32×10⁻⁵; Table I).
Meanwhile, downregulated DEGs were primarily enriched in functions
such as transmission of nerve impulse (P=4.62×10⁻⁹),
plasma membrane part (P=5.97×10⁻¹⁰) and cytoskeletal
protein binding (P=8.21×10⁻⁷; Table I). Furthermore, the KEGG pathway
enrichment analysis indicated that upregulated DEGs were enriched
in pathways such as cell cycle (P=2.18×10⁻¹²), while
downregulated genes were enriched in axon guidance pathway
(P=1.16×10⁻²; Table
II). The DEGs listed in Tables
I and II were selected based
on P-value and |log2 FC| value of DEGs.
 | Table I.Top five significant BP, CC and MF
items associated with genes that were differentially expressed
between control and glioma samples in the GSE31262 microarray. |
Table I.
Top five significant BP, CC and MF
items associated with genes that were differentially expressed
between control and glioma samples in the GSE31262 microarray.
| A, Top 5 BP, CC and
MF items significantly associated with differentially expressed
genes (DEGs) that were upregulated in glioma samples compared with
controls |
|
| Item type | Function ID | Function name | Count | P-value | Gene |
|---|
| BP | GO:0000279 | M phase | 62 |
4.94×10⁻³⁰ | KIF23, PRC1, TTK,
PTTG2, AURKA |
|
| GO:0022403 | Cell cycle
phase | 68 |
2.81×10⁻²⁹ | KIF23, PRC1, DBF4,
TTK, AURKA |
|
| GO:0000280 | Nuclear
division | 49 |
4.88×10⁻²⁷ | KIF23, NEK2, AURKA,
PTTG2, AURKB |
|
| GO:0007067 | Mitosis | 49 |
4.88×10⁻²⁷ | KIF23, NEK2, AURKA,
PTTG2, AURKB. |
|
| GO:0007049 | Cell cycle | 89 |
9.74×10⁻²⁷ | GAS2L3, KIF23,
STEAP3, PRC1, ZAK |
| CC | GO:0005819 | Spindle | 31 |
1.73×10⁻¹⁷ | KIF23, KIF4A, PRC1,
NEK2, TTK |
|
| GO:0000793 | Condensed
chromosome | 29 |
3.84×10⁻¹⁷ | HMGB2, NEK2, CHEK1,
AURKB, RCC1 |
|
| GO:0005694 | Chromosome | 46 |
6.87×10⁻¹³ | HMGB2, HIST1H4K,
HMGB3, NEK2, CHEK1 |
|
| GO:0000775 | Chromosome,
centromeric region | 24 |
1.01×10⁻¹² | MKI67, NUF2, CENPF,
NDC80, CENPE |
|
| GO:0044427 | Chromosomal
part | 40 |
9.95×10⁻¹² | HIST1H4K, CHEK1,
AURKB, RCC1, CITED2 |
| MF | GO:0003682 | Chromatin
binding | 17 |
1.32×10⁻⁵ | CDC6, EZH2, CENPF,
GLI2, RCC1 |
|
| GO:0004674 | Protein
serine/threonine kinase activity | 29 |
1.30×10⁻⁴ | STK33, ZAK, NEK2,
TTK, CHEK1 |
|
| GO:0001882 | Nucleoside
binding | 75 |
1.67×10⁻⁴ | STEAP3, ACOX2,
KIF23, STK33, ZAK |
|
| GO:0001883 | Purine nucleoside
binding | 74 |
2.26×10⁻⁴ | STEAP3, ACOX2,
KIF23, STK33, ZAK |
|
| GO:0030554 | Adenyl nucleotide
binding | 73 |
2.43×10⁻⁴ | STEAP3, ACOX2,
KIF23, STK33, ZAK |
|
| B, Top 5 BP, CC
and MF items significantly associated with DEGs that were
downregulated in glioma samples compared with controls |
|
| Item
type | Function
ID | Function
name | Count | P-value | Gene |
|
| BP | GO:0019226 | Transmission of
nerve impulse | 41 |
4.62×10⁻⁹ | CAV2, KCNMB4,
SCN1B, AGTPBP1, SYT5 |
|
| GO:0007268 | Synaptic
transmission | 34 |
2.25×10⁻⁷ | KCNMB4, CAV2,
SCN1B, AGTPBP1, SYT5 |
|
| GO:0007155 | Cell adhesion | 56 |
2.89×10⁻⁶ | DLC1, EDIL3, AZGP1,
CD47, TYRO3 |
|
| GO:0022610 | Biological
adhesion | 56 |
2.92×10⁻⁶ | DLC1, EDIL3, AZGP1,
CD47, TYRO3 |
|
| GO:0001508 | Regulation of
action potential | 14 |
3.32×10⁻⁶ | KLK6, KCNMB4, PLP1,
GRIN2A, TAC1 |
| CC | GO:0044459 | Plasma membrane
part | 150 |
5.97×10⁻¹⁰ | DLC1, ATP1B1,
SEC31B, SYT5, EFNA1 |
|
| GO:0005886 | Plasma
membrane | 217 |
7.49×10⁻⁸ | DLC1, ATP1B1,
SEC31B, SYT5, EFNA1 |
|
| GO:0048471 | Perinuclear region
of cytoplasm | 33 |
5.51×10⁻⁷ | CAV2, SH3RF1,
PRKCZ, TF, SYT5 |
|
| GO:0030054 | Cell junction | 45 |
7.75×10⁻⁶ | DLC1, CAV2, PRKCZ,
SYT5, GABBR1 |
|
| GO:0016323 | Basolateral plasma
membrane | 22 |
1.38×10⁻⁴ | DLC1, TF, CAV2,
ATP1B1, ERBB4 |
| MF | GO:0008092 | Cytoskeletal
protein binding | 46 |
8.21×10⁻⁷ | NDN, ABLIM3, ALDOB,
SNCA, PXK |
|
| GO:0008289 | Lipid binding | 40 |
9.23×10⁻⁶ | PRKCZ, RBP7,
SNAP91, PREX1, SNCA |
|
| GO:0019899 | Enzyme binding | 39 |
4.89×10⁻⁴ | GLRX3, CAV2, PRKCZ,
PREX1, ALDOB |
|
| GO:0030695 | GTPase regulator
activity | 32 |
6.50×10⁻⁴ | DLC1, CYTH1, PREX1,
RASGEF1B, RTKN |
|
| GO:0019911 | Structural
constituent of myelin sheath | 4 |
6.54×10⁻⁴ | PLP1, MOBP, MAL,
MBP |
| Table II.Pathways that upregulated and
downregulated differentially expressed genes (DEGs) were
significantly enriched in. |
Table II.
Pathways that upregulated and
downregulated differentially expressed genes (DEGs) were
significantly enriched in.
| A, Pathways that
were significantly associated with DEGs that were upregulated in
glioma samples compared with controls in the GSE31262
microarray |
|---|
|
|---|
| Pathway ID | Pathway name | Count | P-value | Gene |
|---|
| hsa04110 | Cell cycle | 24 |
2.18×10⁻¹² | CDC6, CDK1, DBF4,
SKP2, TTK |
| hsa04115 | p53 signaling
pathway | 11 |
3.88×10⁻⁵ | STEAP3, CCNB1,
CDK1, CCNE1, CCNB2 |
| hsa04510 | Focal adhesion | 18 |
1.41×10⁻⁴ | EGFR, COL4A2, VAV3,
COL4A1, TNXB |
| hsa05200 | Pathways in
cancer | 24 |
1.68×10⁻⁴ | EGFR, CEBPA,
COL4A2, COL4A1, SKP2 |
| hsa05222 | Small cell lung
cancer | 10 |
1.08×10⁻³ | LAMA1, CCNE1,
COL4A2, COL4A1, SKP2 |
| hsa04512 | ECM-receptor
interaction | 10 |
1.08×10⁻³ | LAMA1, COL4A2,
TNXB, COL4A1, TNC |
| hsa04914 |
Progesterone-mediated oocyte
maturation | 10 |
1.27×10⁻³ | CCNB1, CDK1,
MAD2L1, CCNB2, PLK1 |
| hsa04114 | Oocyte meiosis | 11 |
2.04×10⁻³ | CCNB1, CDK1, CCNE1,
MAD2L1, CCNB2 |
| hsa04810 | Regulation of actin
cytoskeleton | 14 |
1.56×10⁻² | EGFR, VAV3, DIAPH1,
BAIAP2, DIAPH3 |
| hsa05212 | Pancreatic
cancer | 7 |
2.36×10⁻² | EGFR, VEGFA,
PIK3R3, EGF, TGFB1 |
| hsa04670 | Leukocyte
transendothelial migration | 9 |
2.97×10⁻² | VCAM1, CYBB, VAV3,
ACTN1, RAPGEF4 |
| hsa05219 | Bladder cancer | 5 |
4.02×10⁻² | EGFR, VEGFA, EGF,
MMP2, DAPK1 |
| hsa05210 | Colorectal
cancer | 7 |
4.55×10⁻² | EGFR, BIRC5, FZD3,
PIK3R3, FZD7 |
|
| B, Pathways that
were significantly enriched with DEGs that were downregulated in
glioma samples compared with controls in the GSE31262
microarray |
|
| Pathway
ID | Pathway
name | Count | P-value | Gene |
|
| hsa04360 | Axon guidance | 13 |
1.16×10⁻² | PLXNB1, GNAI1,
EFNA1, ABLIM3, PLXNB3 |
| hsa04514 | Cell adhesion
molecules (CAMs) | 13 |
1.38×10⁻² | MAG, PTPRM, SELL,
NRXN3, NFASC |
| hsa04144 | Endocytosis | 15 |
3.34×10⁻² | FGFR2, STAMBP,
SH3GL3, PRKCZ, PLD1 |
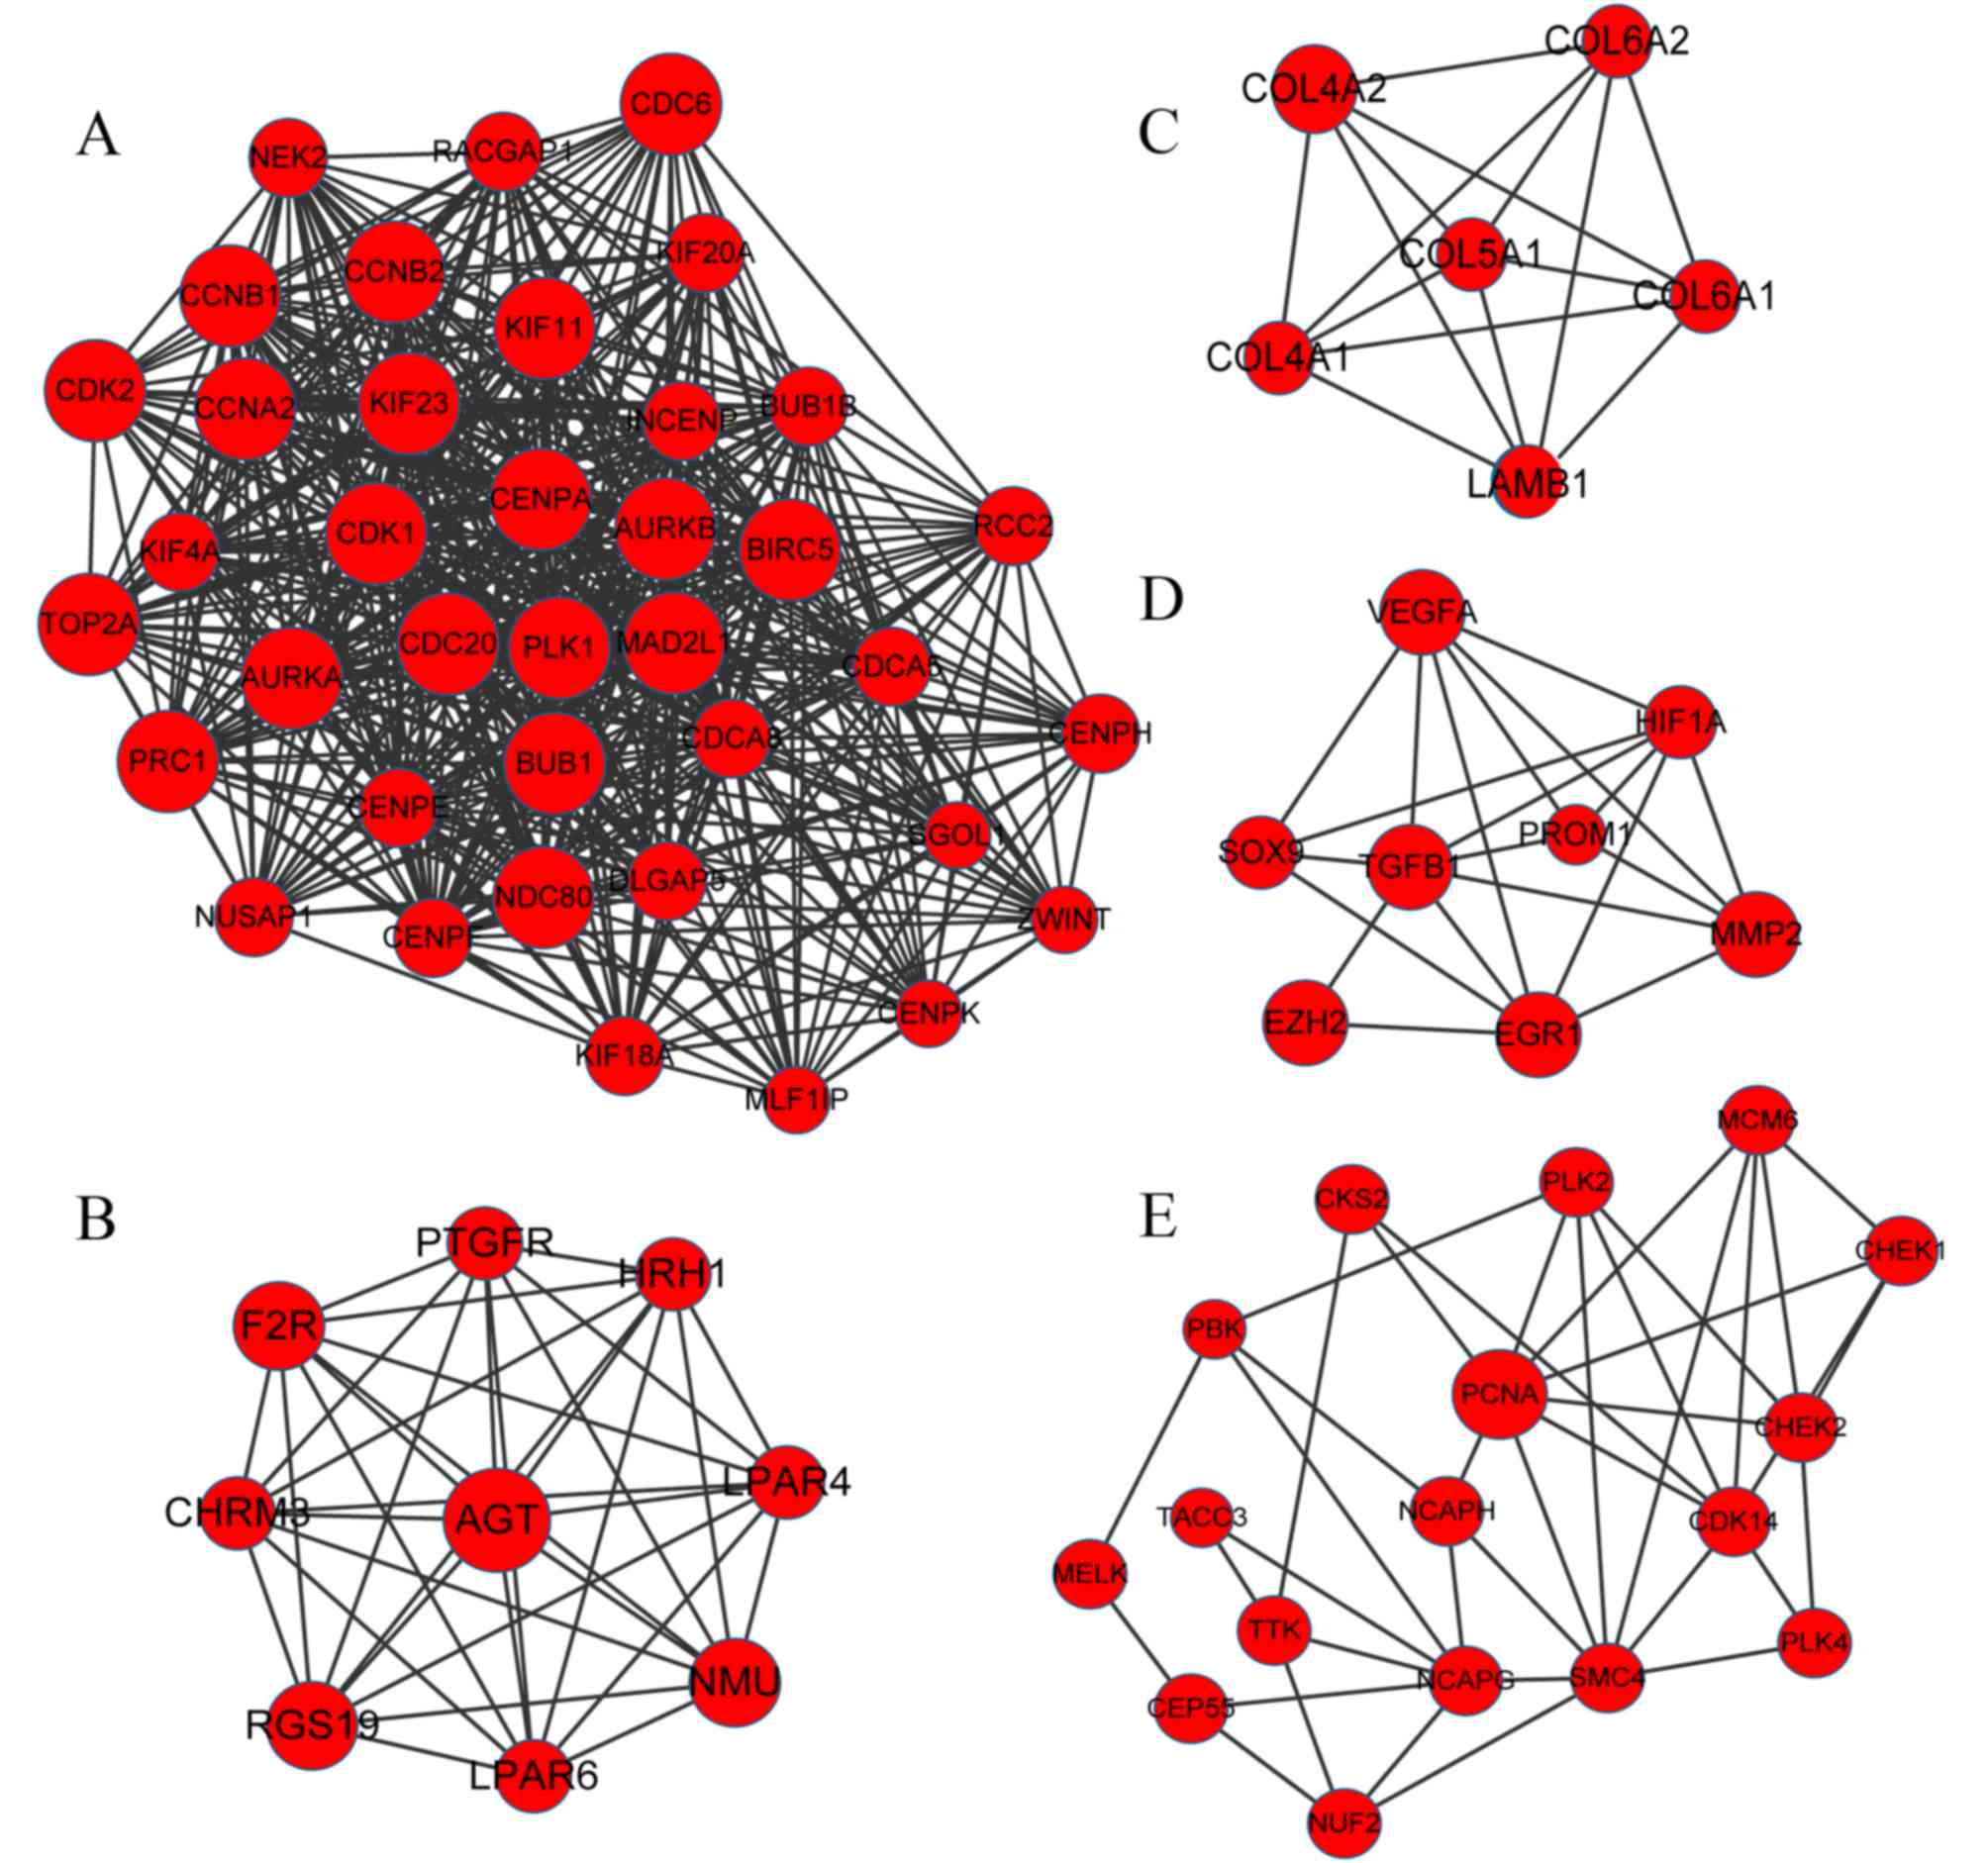
PPI network and module networks
A PPI network was constructed based on the
aforementioned selection criterion, which contained a total of 2422
protein interactions and 418 DEGs. Subsequently, the top 15 nodes,
including the upregulated CDK1 (degree=88) and downregulated CDH1
(degree=41), were highlighted in the PPI network (Table III). The MCODE tool in Cytoscape
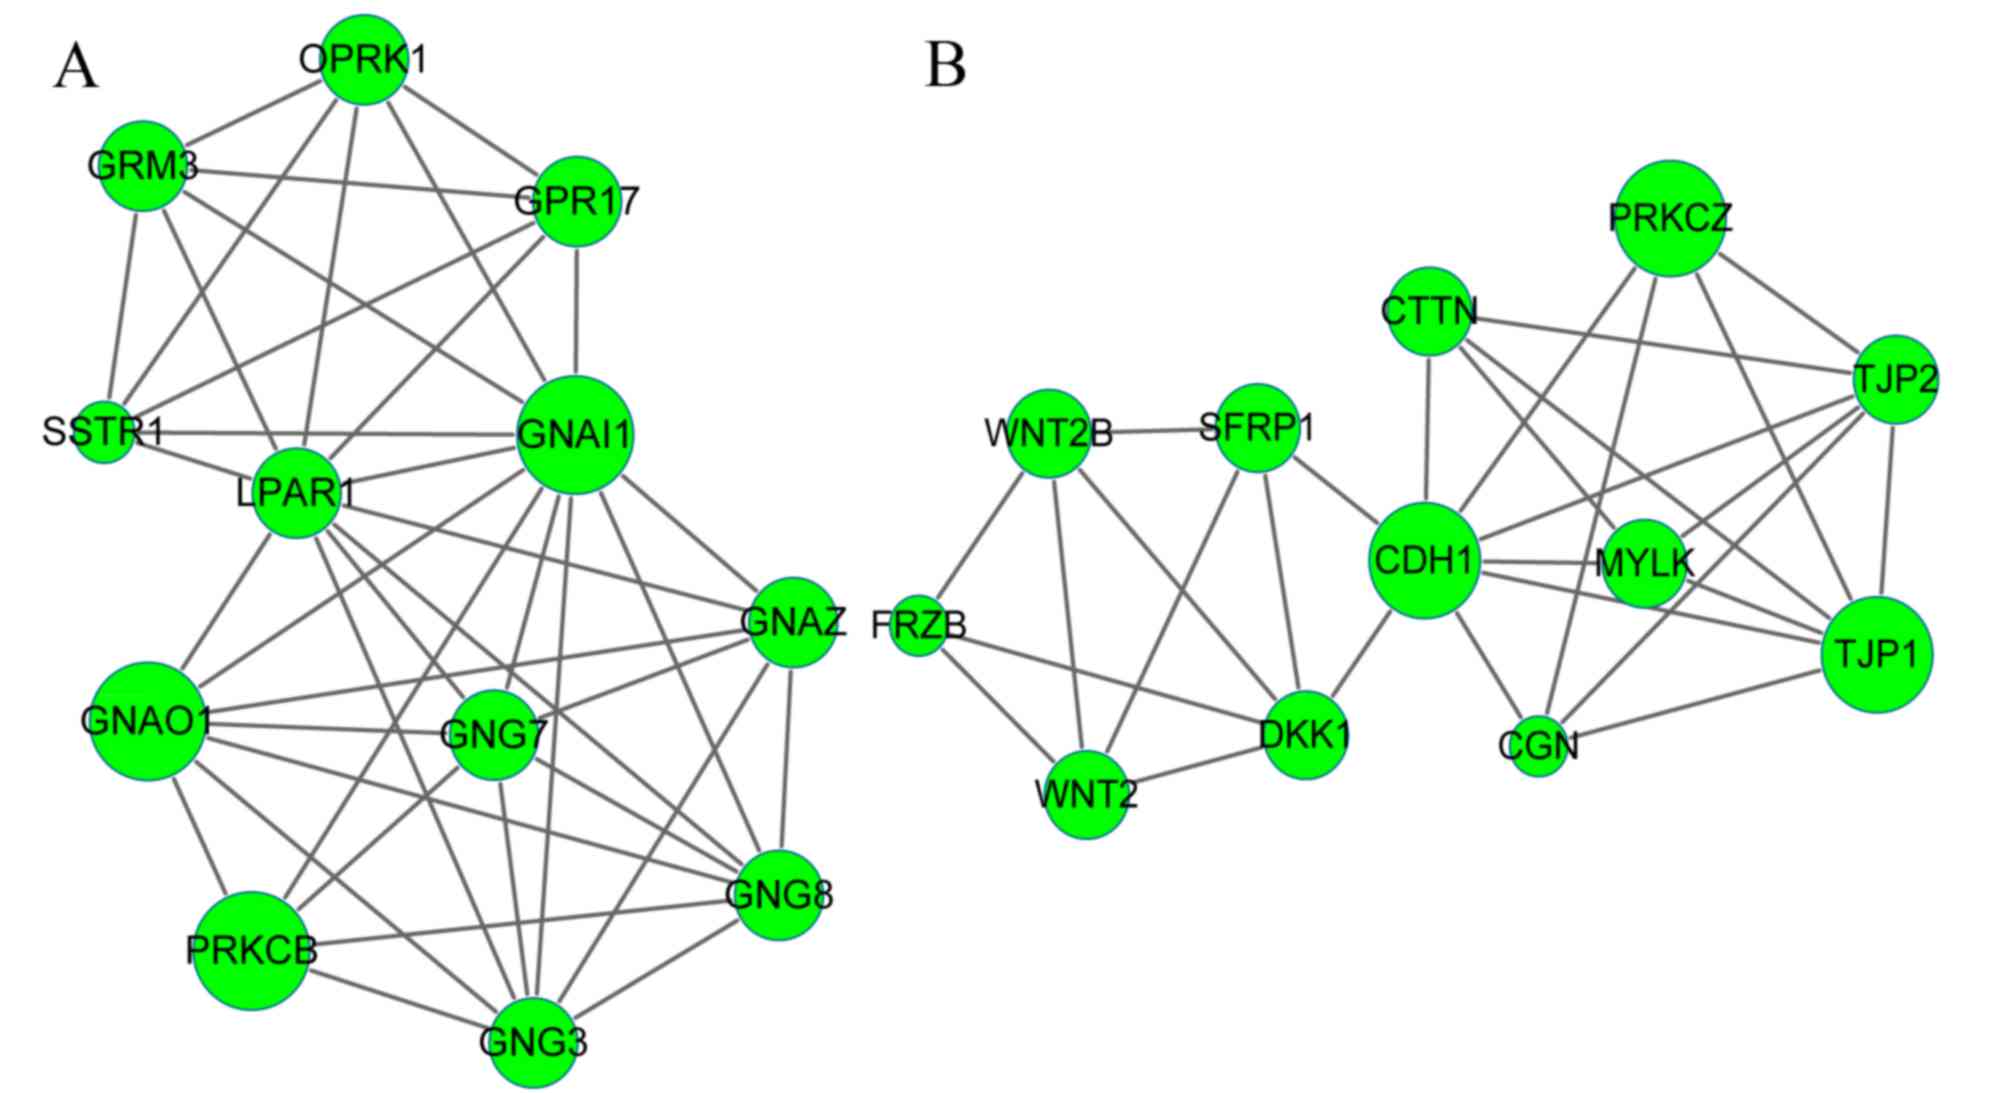
software subsequently revealed 5 upregulated modules (Fig. 2) and 2 downregulated modules
(Fig. 3). The results demonstrated
that in total, 78 upregulated genes, including angiotensinogen
(AGT), PLK1 and CDK1, were involved in the 5 upregulated modules,
while 24 downregulated genes, including CDH1, GNAI1 and G-protein
subunit αo1, were involved in the 2 downregulated modules.
| Table III.Top 15 gene nodes in the
protein-protein interaction network. |
Table III.
Top 15 gene nodes in the
protein-protein interaction network.
| A, Top nodes among
genes that were significantly upregulated in glioma samples
compared with controls in the GSE31262 microarray |
|---|
|
|---|
| Gene | Degree |
|---|
| CDK1 | 88 |
| CDC20, PLK1,
TOP2A | 77 |
| CDK2 | 74 |
| CCNB1 | 73 |
| AURKB | 72 |
| CCNB2 | 71 |
| BIRC5 | 69 |
| PCNA, MAD2L1 | 67 |
| BUB1 | 66 |
| AURKA | 65 |
| CCNA2 | 60 |
| KIF11 | 56 |
|
| B, Top nodes
among genes that were downregulated in glioma samples compared with
controls in the GSE31262 microarray |
|
| Gene | Degree |
|
| CDH1 | 41 |
| DLG2 | 30 |
| RHOG, ERBB4 | 25 |
| ERBB3 | 23 |
| MBP | 22 |
| GNAI1, SOX10,
NGFR | 21 |
| RHOU, FOXO1 | 20 |
| TUBB4A, TJP1 | 19 |
| PRKCZ | 18 |
| PRKCB | 17 |
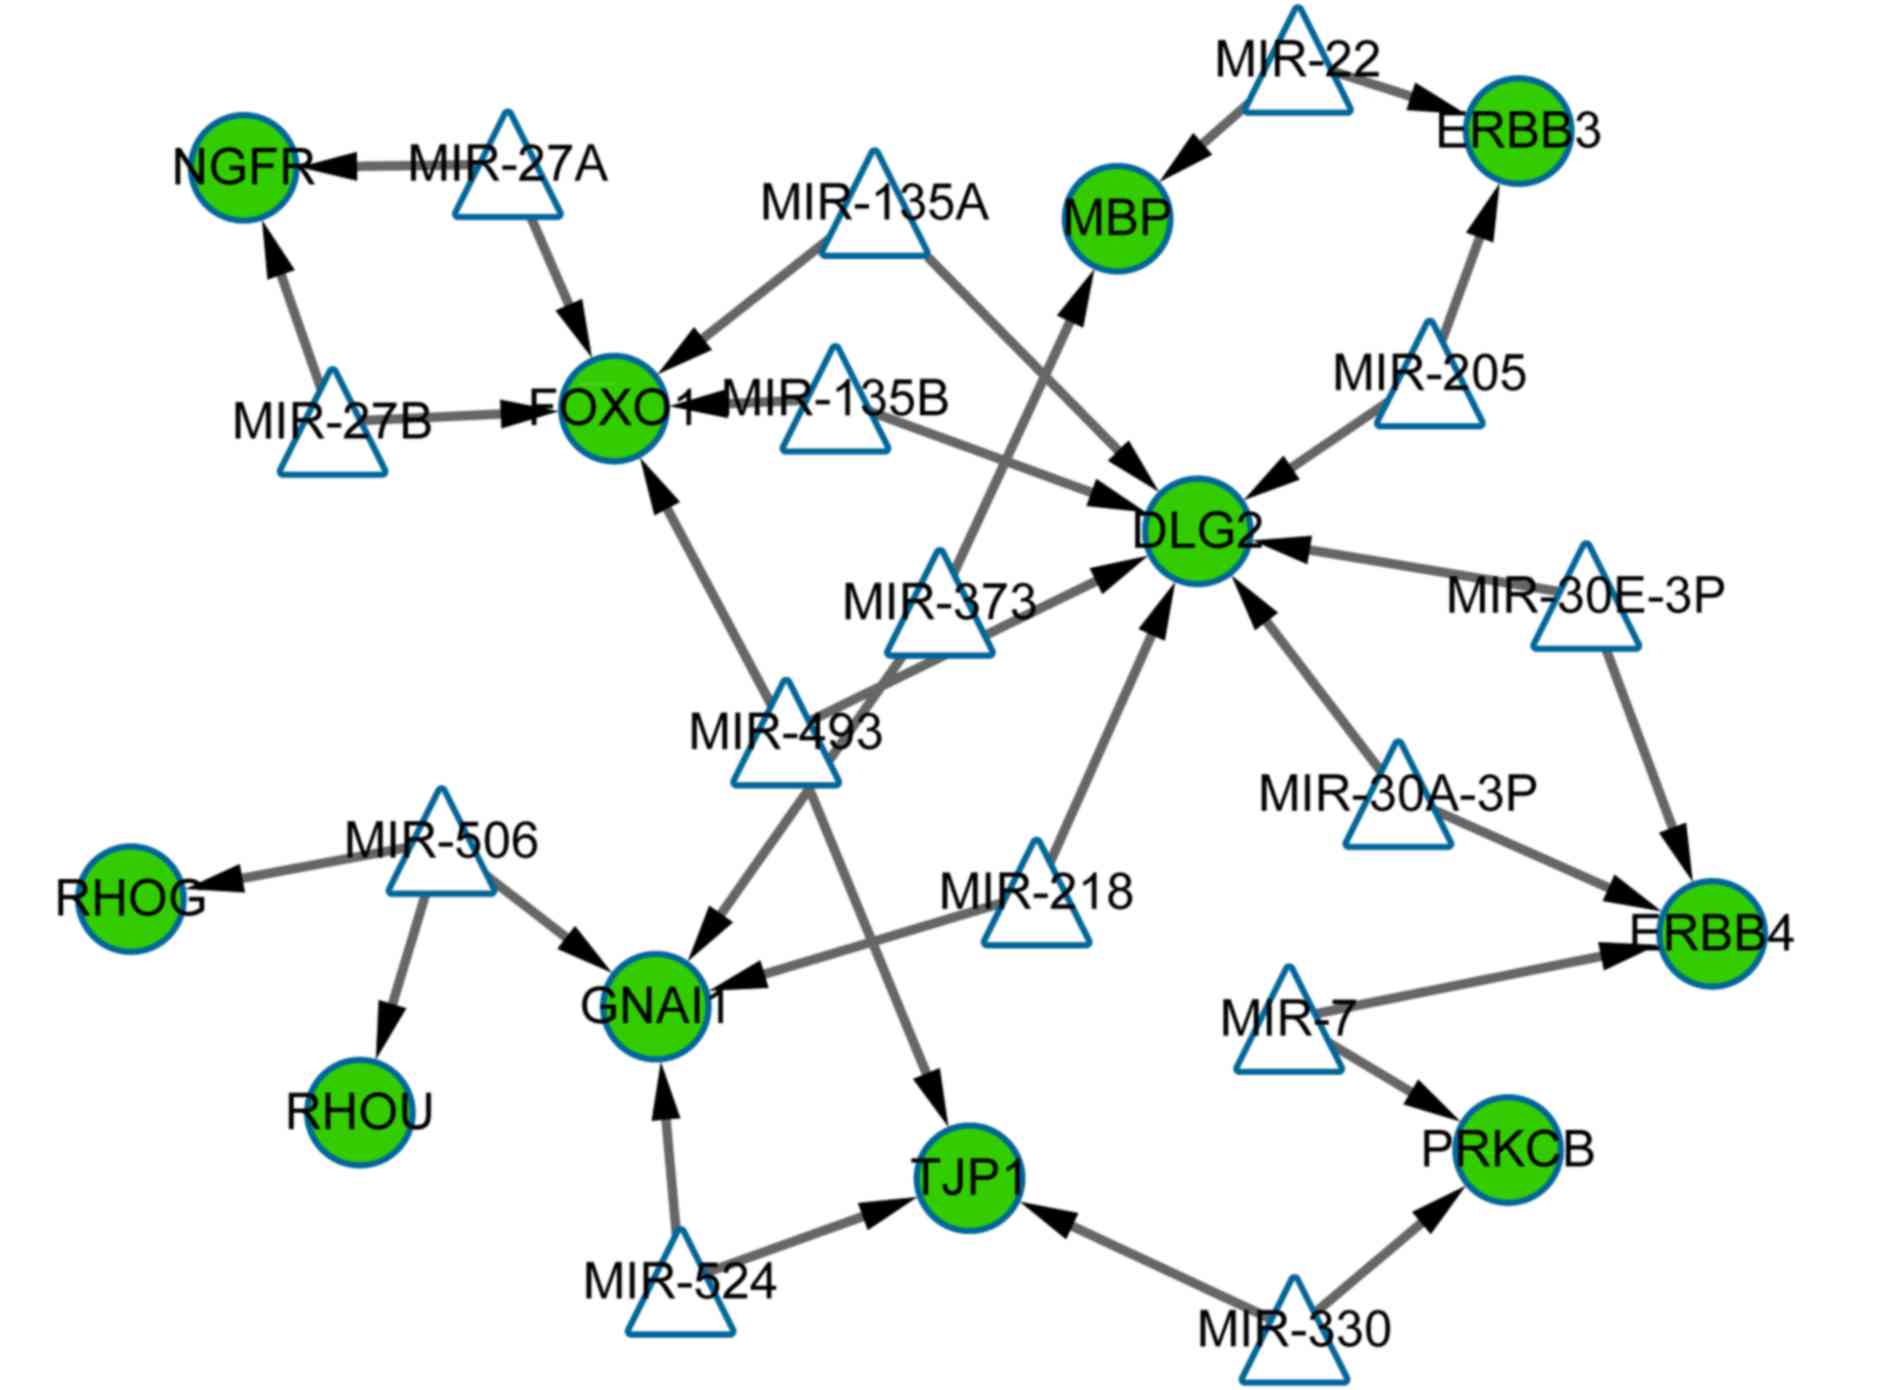
miRNA-target regulatory network
analysis
The miRNA-target regulatory network was constructed
with miRNA that were associated with upregulated and downregulated
DEGs (top 15 according to the degree). The results demonstrated
that in total, 15 miRNA and 11 downregulated genes were present in
the network (26 nodes and 32 interactions; Fig. 4). The genes in the transcriptional
regulatory network were all downregulated. Discs large MAGUK
scaffold protein 2 (DLG2; targeted by miRNAs including miR-218,
miR-135A and miR-135B), FOXO1 (targeted by miRNAs including
miR-135A, miR-135B and miR-493) and GNAI1 (targeted by miRNAs
including miR-218, miR-524 and miR-506) were 3 notable genes with
the highest number of interactions (Fig. 4).
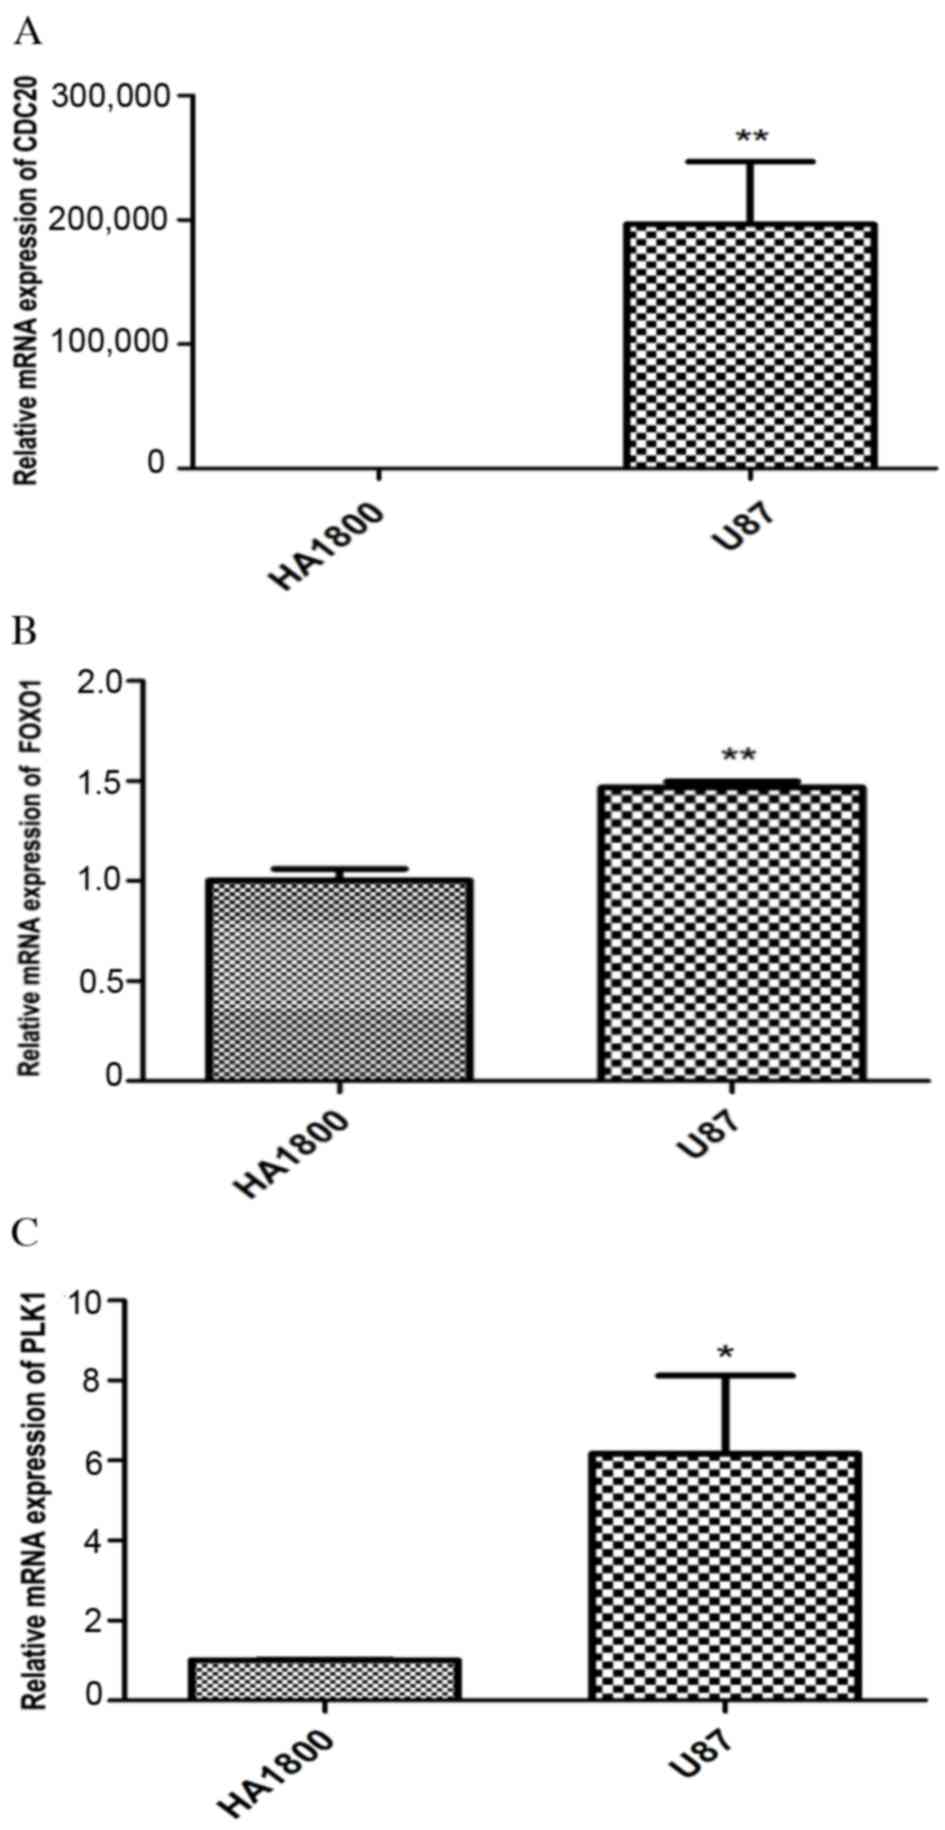
Validation of gene expression
Based on the results of bioinformatics analysis,
CDK1, CDC20, PLK1, AURKA, CDH1, FOXO1 and GNAI1 were selected to
confirm the mRNA expression in U87 glioma cells and HA1800 by
RT-qPCR. The mRNA expression of CDC20 (P<0.01), FOXO1
(P<0.01) and PLK1 (P<0.05) was significantly upregulated in
the U87 glioma cells compared with control cells (Fig. 5). Meanwhile, the expression of
CDK1, AURKA, CDH1 and GNAI1 were detected in HA1800 cells and not
in U87 glioma cells, which indicated that CDK1, AURKA, CDH1 and
GNAI1 were downregulated in U87 glioma cells (data not shown). The
upregulation of CDC20, PLK1 and FOXO1 detected by RT-qPCR in the
present study was consistent with the results of the bioinformatics
analysis.
Discussion
Glioma is responsible for a substantial number of
mortalities worldwide, however, the potential molecular mechanism
is not fully understood and effective therapeutic strategies are
limited (40). The present
bioinformatics study revealed 1377 DEGs between the control and the
glioma groups. The upregulated and downregulated DEGs were
primarily associated with mitotic (M) phase and transmission of
nerve impulse functions, respectively, while the major pathways
associated with upregulated and downregulated genes were cell cycle
and axon guidance, respectively. Certain DEGs, including CDK1 and
CDH1, were highly involved in the PPI network. A total of 5
upregulated modules and 2 downregulated modules were identified
based on the PPI network. DLG2, FOXO1 and GNAI1 were the three
genes with the highest number of interaction in the transcription
regulatory network that consisted of DEGs and miRNAs. In addition,
CDC20 and FOXO1 were confirmed to be upregulated in U87 glioma
cells compared with control cells by RT-qPCR, which was consistent
with the results of the bioinformatics analysis.
Mitosis and cytokinesis comprise the M phase of an
animal cell cycle (41). Through
the use of mitosis-specific phosphorylated antibodies, Maeda et
al (42) demonstrated that
morphological assessment is important to identify the development
of multinucleated giant cells in glioma. Conde et al
(43) reported that the
overexpression of survivin contributed to chromosomal instability,
and the understanding of this biological mechanism may promote
further study for anti-cancer therapeutic approaches in glioma. In
addition, glioma tumor progression was reduced by blocking mitosis
via mitotic spindle catastrophe (44). In the present study, the genes that
were upregulated in glioma samples were primarily enriched in M
phase. Meanwhile, pathway analysis revealed that the upregulated
genes were primarily enriched in cell cycle, which was consistent
with the functional analysis. Notably, CDK1 was a common key point
gene in M phase and cell cycle. CDK1 is a highly conserved protein
that has key functions in cell cycle regulation (45). A previous study demonstrated that
the differential expression or silencing of CDK1 was associated
with the malignant phenotype of glioma cells (12). Therefore, CDK1 in glioma may be
useful in estimating the malignant degree of glioma (46). The PPI network analysis in the
present study revealed that CDK1 was the most significantly
upregulated gene, with the highest degree, which indicated that it
may be a key target gene for further investigation in glioma.
Therefore, we hypothesized that the upregulation genes such as CDK1
in M phase function and cell cycle pathway may have important roles
in the process of glioma. Furthermore, various neurological
disorders are characterized by structural alterations in neuronal
connections, which range from presymptomatic synaptic alterations
to the loss or rewiring of whole axon bundles (47). A previous study indicated that
re-expression of the leucine-rich glioma inactivated 1 gene in
glioma cells resulted in the dysregulation of genes implicated in
the canonical axon guidance pathway (48). In the current study, the
downregulated genes were primarily enriched in axon guidance
pathway, which indicates that this pathway may be vital for glioma
progression. Although the downregulation of CDH1, which was
demonstrated to be important based on the PPI network, was not
enriched in the axon guidance pathway, CDH1 is an important tumor
suppressor gene (49). A
retrospective study concerning the protein expression and
epigenetic inactivation of CDH1 in patients with low-grade glioma
reported that hypermethylation of the CDH1 promoter was
significantly associated with reduced E-cadherin expression and the
survival of patients with glioma (50). Furthermore, Yang et al
(51) demonstrated that
alterations in the expression of transforming growth factor-β1 and
E-cadherin were associated with the emergence and development of
glioma. As CDH1 was the most significantly downregulated gene in
the PPI network, CDH1 may be another key target gene that warrants
further investigation in glioma.
FOXO1 has functions in the regulation of
gluconeogenesis and glycogenolysis by insulin signaling (52). Cheng et al (53) reported that curcumin induced G2/M
cell cycle arrest and apoptosis by increasing FOXO1 expression.
Negative regulation of glioma stem cells may occur via a
FOXO1-associated pathway (54).
Meanwhile, DLG2 belongs to the membrane-associated guanylate kinase
family (55). In the present
study, the miRNA-target gene analysis demonstrated that FOXO1 and
DLG2 were the genes with the highest number of connections in the
process of glioma. Furthermore, the mRNA expression of FOXO1 was
upregulated in U87 glioma cells compared with control cells, as
determined by RT-qPCR. Notably, FOXO1 and DLG2 were both targeted
by miR-135A and miR-135B. A previous study reported an important
role for miR-135A in glioma etiology (56), and Zhang et al (57) demonstrated that reactive oxygen
species-upregulated miR-135a had a pivotal role in glioma cell
apoptosis. Although miR-135A has been widely reported in previous
studies, studies associating miR-135B with glioma are rare. Based
on the results of miRNA-target gene analysis in the current study,
we hypothesized that miRNA-target gene regulation is vital for the
progression of glioma, including the interactions between FOXO1 and
miRNAs such as miR-135A/B. These miRNAs and associated target genes
may be potential therapy targets for glioma. However, the
identification of the functions of these genes is required to
confirm this speculation.
In conclusion, the results of the present study
indicate that M phase function and axon guidance pathway may be
vital for glioma progression, and CKD1 and CDH1 genes may be
associated with the process of glioma. Furthermore, FOXO1, and the
miRNAs that target FOXO1, including miR-135A/B, may serve as
potential therapy targets for glioma.
Acknowledgements
This study was funded by Research of Education
Department of Heilongjiang Province (grant no. 12531394), Research
of Health Department of Heilongjiang Province (grant no. 2013102)
and Provincial Natural Science Foundation of Heilongjiang (grant
no. H2016032).
References
|
1
|
Behin A, Hoang-Xuan K, Carpentier AF and
Delattre JY: Primary brain tumours in adults. Lancet. 361:323–331.
2003. View Article : Google Scholar : PubMed/NCBI
|
|
2
|
Goodenberger ML and Jenkins RB: Genetics
of adult glioma. Cancer Genet. 205:613–621. 2012. View Article : Google Scholar : PubMed/NCBI
|
|
3
|
Claus EB, Walsh KM, Wiencke JK, Molinaro
AM, Wiemels JL, Schildkraut JM, Bondy ML, Berger M, Jenkins R and
Wrensch M: Survival and low-grade glioma: The emergence of genetic
information. Neurosurgi Focus. 38:E62015. View Article : Google Scholar
|
|
4
|
Gage FH: Mammalian neural stem cells.
Science. 287:1433–1438. 2000. View Article : Google Scholar : PubMed/NCBI
|
|
5
|
Snyder EY and Macklis JD: Multipotent
neural progenitor or stem-like cells may be uniquely suited for
therapy for some neurodegenerative conditions. Clin Neurosci.
3:310–316. 1995.PubMed/NCBI
|
|
6
|
Ourednik J, Ourednik V, Lynch WP,
Schachner M and Snyder EY: Neural stem cells display an inherent
mechanism for rescuing dysfunctional neurons. Nat Biotechnol.
20:1103–1110. 2002. View
Article : Google Scholar : PubMed/NCBI
|
|
7
|
Shah K, Bureau E, Kim DE, Yang K, Tang Y,
Weissleder R and Breakefield XO: Glioma therapy and real-time
imaging of neural precursor cell migration and tumor regression.
Ann Neurol. 57:34–41. 2005. View Article : Google Scholar : PubMed/NCBI
|
|
8
|
Yamanaka R, Yajima N, Abe T, Tsuchiya N,
Homma J, Narita M, Takahashi M and Tanaka R: Dendritic cell-based
glioma immunotherapy (Review). Int J Oncol. 23:5–15.
2003.PubMed/NCBI
|
|
9
|
Luo Y, Zhu D, Dang DH, Huang J, Tang Y,
Luo X and Wang S: A double-switch cell fusion-inducible transgene
expression system for neural stem cell-based antiglioma gene
therapy. Stem Cell Int. 2015:6490802015.
|
|
10
|
Wang L, Wei B, Hu G, Wang L, Jin Y and Sun
Z: Gene expression analyses to explore the biomarkers and
therapeutic targets for gliomas. Neurol Sci. 36:403–409. 2015.
View Article : Google Scholar : PubMed/NCBI
|
|
11
|
Gravendeel LA, Kouwenhoven MC, Gevaert O,
Rooi JJ, Stubbs AP, Duijm JE, Daemen A, Bleeker FE, Bralten LB,
Kloosterhof NK, et al: Intrinsic gene expression profiles of
gliomas are a better predictor of survival than histology. Cancer
Res. 69:9065–9072. 2009. View Article : Google Scholar : PubMed/NCBI
|
|
12
|
Chen H, Huang Q, Zhai DZ, Dong J, Wang AD
and Lan Q: CDK1 expression and effects of CDK1 silencing on the
malignant phenotype of glioma cells. Zhonghua Zhong Liu Za Zhi.
29:484–488. 2007.(In Chinese). PubMed/NCBI
|
|
13
|
Xu Y, Wang Z, Wang J, Li J, Wang H and Yue
W: Lentivirus-mediated knockdown of cyclin Y (CCNY) inhibits glioma
cell proliferation. Oncol Res. 18:359–364. 2010. View Article : Google Scholar : PubMed/NCBI
|
|
14
|
Freije WA, Castrovargas FE, Fang Z,
Horvath S, Cloughesy T, Liau LM, Mischel PS and Nelson SF: Gene
expression profiling of gliomas strongly predicts survival. Cancer
Res. 64:6503–6510. 2004. View Article : Google Scholar : PubMed/NCBI
|
|
15
|
Bartel DP: MicroRNAs: Genomics,
biogenesis, mechanism, and function. Cell. 116:281–297. 2004.
View Article : Google Scholar : PubMed/NCBI
|
|
16
|
Ebert MS and Sharp PA: Roles for microRNAs
in conferring robustness to biological processes. Cell.
149:515–524. 2012. View Article : Google Scholar : PubMed/NCBI
|
|
17
|
Sempere LF, Freemantle S, Pitha-Rowe I,
Moss E, Dmitrovsky E and Ambros V: Expression profiling of
mammalian microRNAs uncovers a subset of brain-expressed microRNAs
with possible roles in murine and human neuronal differentiation.
Genome Biol. 5:R132004. View Article : Google Scholar : PubMed/NCBI
|
|
18
|
Wang W, Kwon EJ and Tsai LH: MicroRNAs in
learning, memory and neurological diseases. Learn Mem. 19:359–368.
2012. View Article : Google Scholar : PubMed/NCBI
|
|
19
|
Saugstad JA: MicroRNAs as effectors of
brain function with roles in ischemia and injury, neuroprotection
and neurodegeneration. J Cereb Blood Flow Metab. 30:1564–1576.
2010. View Article : Google Scholar : PubMed/NCBI
|
|
20
|
Gabriely G, Wurdinger T, Kesari S, Esau
CC, Burchard J, Linsley PS and Krichevsky AM: MicroRNA 21 promotes
glioma invasion by targeting matrix metalloproteinase regulators.
Mol Cell Biol. 28:5369–5380. 2008. View Article : Google Scholar : PubMed/NCBI
|
|
21
|
Wang Q, Li X, Zhu Y and Yang P:
MicroRNA-16 suppresses epithelial-mesenchymal transition-related
gene expression in human glioma. Mol Med Rep. 10:3310–3314. 2014.
View Article : Google Scholar : PubMed/NCBI
|
|
22
|
Malzkorn B, Wolter M, Liesenberg F,
Grzendowski M, Stühler K, Meyer HE and Reifenberger G:
Identification and functional characterization of microRNAs
involved in the malignant progression of gliomas. Brain Pathol.
20:539–550. 2010. View Article : Google Scholar : PubMed/NCBI
|
|
23
|
Sandberg CJ, Altschuler G, Jeong J,
Strømme KK, Stangeland B, Murrell W, Grasmo-Wendler UH, Myklebost
O, Helseth E, Vik-Mo EO, et al: Comparison of glioma stem cells to
neural stem cells from the adult human brain identifies
dysregulated Wnt-signaling and a fingerprint associated with
clinical outcome. Exp Cell Res. 319:2230–2243. 2013. View Article : Google Scholar : PubMed/NCBI
|
|
24
|
Troyanskaya O, Cantor M, Sherlock G, Brown
P, Hastie T, Tibshirani R, Botstein D and Altman RB: Missing value
estimation methods for DNA microarrays. Bioinformatics. 17:520–525.
2001. View Article : Google Scholar : PubMed/NCBI
|
|
25
|
Fujita A, Sato JR, Lde Rodrigues O,
Ferreira CE and Sogayar MC: Evaluating different methods of
microarray data normalization. BMC Bioinformatics. 7:4692006.
View Article : Google Scholar : PubMed/NCBI
|
|
26
|
Smyth GK: Limma: Linear models for
microarray dataBioinformatics and computational biology solutions
Using R, Bioconductor. Gentleman R, Carey VJ, Huber W, Irizarry RA
and Dudoit S: Springer New York; New York, NY: pp. 397–420. 2005,
View Article : Google Scholar
|
|
27
|
Ritchie ME, Phipson B, Wu D, Hu Y, Law CW,
Shi W and Smyth GK: Limma powers differential expression analyses
for RNA-sequencing and microarray studies. Nucleic Acids Res.
43:e472015. View Article : Google Scholar : PubMed/NCBI
|
|
28
|
Huang W, Sherman BT and Lempicki RA:
Systematic and integrative analysis of large gene lists using DAVID
bioinformatics resources. Nat Protoc. 4:44–57. 2009. View Article : Google Scholar : PubMed/NCBI
|
|
29
|
Huang DW, Sherman BT and Lempicki RA:
Bioinformatics enrichment tools: Paths toward the comprehensive
functional analysis of large gene lists. Nucleic Acids Res.
37:1–13. 2009. View Article : Google Scholar : PubMed/NCBI
|
|
30
|
Dennis G Jr, Sherman BT, Hosack DA, Yang
J, Gao W, Lane HC and Lempicki RA: DAVID: Database for annotation,
visualization, and integrated discovery. Genome Biol. 4:P32003.
View Article : Google Scholar : PubMed/NCBI
|
|
31
|
Sherlock G: Gene ontology: Tool for the
unification of biology. Canadian Inst Food Sci Technol J.
22:4152009.
|
|
32
|
Ogata H, Goto S, Sato K, Fujibuchi W, Bono
H and Kanehisa M: KEGG: Kyoto encyclopedia of genes and genomes.
Nucleic Acids Res. 27:29–34. 1999. View Article : Google Scholar : PubMed/NCBI
|
|
33
|
Giot L, Bader JS, Brouwer C, Chaudhuri A,
Kuang B, Li Y, Hao YL, Ooi CE, Godwin B, Vitols E, et al: A protein
interaction map of Drosophila melanogaster. Science. 302:1727–1736.
2003. View Article : Google Scholar : PubMed/NCBI
|
|
34
|
Szklarczyk D, Franceschini A, Kuhn M,
Simonovic M, Roth A, Minguez P, Doerks T, Stark M, Muller J, Bork
P, et al: The STRING database in 2011: Functional interaction
networks of proteins, globally integrated and scored. Nucleic Acids
Res. 39:D561–D568. 2011. View Article : Google Scholar : PubMed/NCBI
|
|
35
|
Shannon P, Markiel A, Ozier O, Baliga NS,
Wang JT, Ramage D, Amin N, Schwikowski B and Ideker T: Cytoscape: A
software environment for integrated models of biomolecular
interaction networks. Genome Res. 13:2498–2504. 2003. View Article : Google Scholar : PubMed/NCBI
|
|
36
|
Bader GD and Hogue CW: An automated method
for finding molecular complexes in large protein interaction
networks. BMC Bioinformatics. 4:22003. View Article : Google Scholar : PubMed/NCBI
|
|
37
|
Wang J, Duncan D, Shi Z and Zhang B:
WEB-based GEne SeT analysis toolkit (WebGestalt): Update 2013.
Nucleic Acids Res. 41:W77–W83. 2013. View Article : Google Scholar : PubMed/NCBI
|
|
38
|
Zhang B, Kirov S and Snoddy J: WebGestalt:
An integrated system for exploring gene sets in various biological
contexts. Nucleic Acids Res. 33:W741–W748. 2005. View Article : Google Scholar : PubMed/NCBI
|
|
39
|
Livak KJ and Schmittgen TD: Analysis of
relative gene expression data using real-time quantitative PCR and
the 2(-Delta Delta C(T)) method. Methods. 25:402–408. 2001.
View Article : Google Scholar : PubMed/NCBI
|
|
40
|
Ostrom QT, Bauchet L, Davis FG, Deltour I,
Fisher JL, Langer CE, Pekmezci M, Schwartzbaum JA, Turner MC, Walsh
KM, et al: The epidemiology of glioma in adults: A ‘state of the
science’ review. Neuro Oncol. 17:896–913. 2014. View Article : Google Scholar
|
|
41
|
Cattin CJ, Düggelin M, Martinez-Martin D,
Gerber C, Müller DJ and Stewart MP: Mechanical control of mitotic
progression in single animal cells. Proc Natl Acad Sci USA.
112:11258–11263. 2015. View Article : Google Scholar : PubMed/NCBI
|
|
42
|
Maeda K, Mizuno M, Wakabayashi T, Takasu
S, Nagasaka T, Inagaki M and Yoshida J: Morphological assessment of
the development of multinucleated giant cells in glioma by using
mitosis-specific phosphorylated antibodies. J Neurosurg.
98:854–859. 2003. View Article : Google Scholar : PubMed/NCBI
|
|
43
|
Conde M, Wiedemuth R, Schackert G and
Temme A: Overexpression of Survivin causes aneuploidy, DNA damage
and defective mitosis in glioma cells. The 65th Annual Meeting of
the German Society of Neurosurgery (DGNC). 11–14–May;2014.
|
|
44
|
Santra M, Santra S and Chopp M:
Doublecortin reduces glioma tumor progression via blocking mitosis
by mitotic spindle catastrophe and inhibition of glioma cell
invasion by depolymerization of actin. Cell Mol Tum Biol.
16:354–360. 2007.
|
|
45
|
Castedo M, Perfettini JL, Roumier T and
Kroemer G: Cyclin-dependent kinase-1: Linking apoptosis to cell
cycle and mitotic catastrophe. Cell Death Differ. 9:1287–1293.
2002. View Article : Google Scholar : PubMed/NCBI
|
|
46
|
Chen QF: Expressions of Cyclin B1, CDK1
and 14-3-3 protein in human gliomas and their significance. Sichuan
Med J. 2009.
|
|
47
|
Battum EY, Brignani S and Pasterkamp RJ:
Axon guidance proteins in neurological disorders. Lancet Neurol.
14:532–546. 2015. View Article : Google Scholar : PubMed/NCBI
|
|
48
|
Kunapuli P, Lo K, Hawthorn L and Cowell
JK: Reexpression of LGI1 in glioma cells results in dysregulation
of genes implicated in the canonical axon guidance pathway.
Genomics. 95:93–100. 2010. View Article : Google Scholar : PubMed/NCBI
|
|
49
|
Wong AS and Gumbiner BM:
Adhesion-independent mechanism for suppression of tumor cell
invasion by E-cadherin. J Cell Biol. 161:1191–1203. 2003.
View Article : Google Scholar : PubMed/NCBI
|
|
50
|
D'Urso PI, D'Urso OF, Storelli C, Catapano
G, Gianfreda CD, Montinaro A, Muscella A and Marsigliante S:
Retrospective protein expression and epigenetic inactivation
studies of CDH1 in patients affected by low-grade glioma. J
Neurooncol. 104:113–118. 2011. View Article : Google Scholar : PubMed/NCBI
|
|
51
|
Yang L, Liu M, Deng C, Gu Z and Gao Y:
Expression of transforming growth factor-β1 (TGF-β1) and E-cadherin
in glioma. Tumour Biol. 33:1477–1484. 2012. View Article : Google Scholar : PubMed/NCBI
|
|
52
|
Nakae J, Kitamura T, Kitamura Y, Biggs WH
III, Arden KC and Accili D: The forkhead transcription factor foxo1
regulates adipocyte differentiation. Dev Cell. 4:119–129. 2003.
View Article : Google Scholar : PubMed/NCBI
|
|
53
|
Cheng C, Jiao JT, Qian Y, Guo XY, Huang J,
Dai MC, Zhang L, Ding XP, Zong D and Shao JF: Curcumin induces G2/M
arrest and triggers apoptosis via FoxO1 signaling in U87 human
glioma cells. Mol Med Rep. 13:3763–3770. 2016. View Article : Google Scholar : PubMed/NCBI
|
|
54
|
Zhao X, Liu Y, Jian Z, Liu X, Chen J, Liu
L, Ping W and Xue Y: GAS5 suppresses malignancy of human glioma
stem cells via a miR-196a-5p/FOXO1 feedback loop. Biochimica et
biophysica acta. 1864:16052017. View Article : Google Scholar : PubMed/NCBI
|
|
55
|
Kuo DH, Robinson KG, Layton AC, Meyers AJ
and Sayler GS: Transcription levels (amoA mRNA-based) and
population dominance (amoA gene-based) of ammonia-oxidizing
bacteria. J Indust Microbiol Biotechnol. 37:751–757. 2010.
View Article : Google Scholar
|
|
56
|
Wu S, Lin Y, Xu D, Chen J, Shu M, Zhou Y,
Zhu W, Su X, Zhou Y, Qiu P and Yan G: MiR-135a functions as a
selective killer of malignant glioma. Oncogene. 31:3866–3874. 2012.
View Article : Google Scholar : PubMed/NCBI
|
|
57
|
Zhang T, Shao Y, Chu TY, Huang Hs, Liou
YL, Li Q and Zhou H: Reactive oxygen species-upregulated miR-135a
plays a pivotal role in phenethyl isothiocyanate-induced rat C6
glioma cell apoptosis. Int J Clin Exp Pathol. 9:112016.
|