Introduction
Ovarian cancer (OC), which frequently occurs in
postmenopausal women (1), is a
cancer with no apparent symptoms until it reaches an advanced
stage. The symptoms include bloating, abdominal swelling, pelvic
pain and loss of appetite (2). The
three most common OC subtypes are high-grade serous carcinomas, sex
cord stromal tumors and germ cell tumors (3), which may metastasize to the
peritoneum, liver, lungs or lymph nodes (4). OC is difficult to detect and
metastasizes early in disease progression; therefore, patients with
OC frequently have a poor prognosis (5). Globally, OC affects 1.2 million women
and led to 161,100 mortalities in 2015 (6,7).
Thus, obtaining an improved understanding of OC progression and
recurrence is of great importance for improving its prognosis.
Previously, genes affecting OC were identified,
including p21-activated kinase 4 (Pak4), cyclin E1
(CCNE1), RNA binding motif protein 3 (RBM3), YY1
associated protein 1 (YAP) and prominin-1 (CD133).
Pak4 overexpression has been reported to contribute to OC
cell migration, invasion and proliferation, thus making it a
promising prognostic indicator and therapeutic target (8). CCNE1 amplification has been
demonstrated to markedly reduce disease-free survival and overall
survival, thus indicating that CCNE1-targeted treatment may
benefit patients with OC who have upregulated CCNE1
expression (9,10). In epithelial ovarian cancer,
RBM3 expression has been associated with cisplatin
sensitivity and correlated with a positive patient prognosis
(11). Furthermore, YAP has
been associated with cell growth and tumorigenesis, and its
coexpression with TEA domain transcription factor 4 serves as a
predictor of a poor outcome (12,13).
CD133 also serves as a predictor of poor OC patient survival, thus
suggesting that it may serve as a biomarker of cancer stem cells
during disease (14). However, the
further identification of prognostic indicators and their potential
uses is required.
In recent years, bioinformatics analysis of
expression profile data has been gradually used to examine the
pathogenesis of human diseases (15). It is known that the progress of a
disease is usually mediated by multiple relevant genes and not by a
single gene (16,17). Therefore, the present study was
designed to mine subnetwork features and build a model to assess OC
recurrence risk. In the present study, OC expression profiles were
downloaded from a public database, and differentially expressed
genes (DEGs) were analyzed and functionally enriched. Following
identification of a functional subnetwork, a random forest
classifier was constructed and validated. It was considered that
this constructed classifier may provide an improved approach for
predicting the prognoses of patients with OC.
Materials and methods
Data source
RNA sequence data from 307 OC samples and their
corresponding clinical data (including patient vital status and
overall survival) were downloaded from The Cancer Genome Atlas
(TCGA; http://cancergenome.nih.gov)
database. Based on patient vital status, 180 recurrent samples and
72 disease-free samples were identified. Additionally, the GSE44104
dataset [including 20 recurrent and 40 non-recurrent OC samples;
platform, (HG-U133_Plus_2) Affymetrix Human Genome U133 Plus 2.0
Array, Affymetrix; Thermo Fisher Scientific, Inc., Waltham, MA,
USA] and the GSE49997 dataset (including 204 OC samples; platform,
GPL2986 ABI Human Genome Survey Microarray version 2, Applied
Biosystems; Thermo Fisher Scientific, Inc.) were obtained from the
Gene Expression Omnibus (http://www.ncbi.nlm.nih.gov/geo) database and utilized
as validation sets.
Data preprocessing and DEG
screening
Using a z-score algorithm (18), the expression value of each gene
was normalized to a normal distribution (mean=0; variance=1). The
samples were subsequently analyzed using the differential
expression via distance synthesis (DEDS) algorithm, which may be
applied to obtain differential expression levels via the distance
synthesis of relevant data (19).
This approach was used to screen DEGs in the recurrent samples
relative to the disease-free samples.
Functional enrichment analysis
Gene ontology (GO; http://www.geneontology.org) analysis may be used to
predict the potential functions of gene products (20). Using GO Term Finder (http://search.cpan.org/dist/GO-TermFinder/) as
previously described (21),
upregulated and downregulated genes were separately enriched.
Functional terms with P<0.05 and an association with at least
three genes were selected as significant terms.
Weighted gene coexpression network
analysis (WGCNA)
Genes may jointly influence alterations in
functional terms through their interactions, with functional
consistencies between genes also confirmed by significant
expression level correlations. To systematically analyze how DEGs
with similar expression profiles co-affect OC prognosis, WGCNA
(22) was performed. Based on the
obtained weighted gene coexpression levels, DEG coexpression was
suggested to be significantly associated with OC prognosis. To
further identify the genes that were able to differentiate between
patients with OC with different prognoses, the verified DEG
protein-protein interaction (PPI) pairs were used to construct a
PPI network using BioNet 1.24.1 package (http://www.bioconductor.org/packages/release/bioc/html/BioNet.html).
Subnetwork analysis and classifier
construction
The BioNet package (http://bionet.bioapps.biozentrum.uni-wuerzburg.de)
provides an extensive framework that enables functional subnetworks
to be isolated from biological networks. Using the BioNet package
in R 3.1.0 (23), as previously
described (24), subnetwork
analysis was conducted for the PPI network with the P-value/false
discovery rate set to 0.01. With the subnetwork nodes as feature
genes, a random forest classifier (25) was constructed. For sample labels
(recurrence/no recurrence), true and false positive rates were
calculated and combined with leave-one-out cross validation
(26). Additionally, a receiver
operating characteristic (ROC) curve was constructed (27) to evaluate the classification
efficiency of the random forest classifier.
Validation using other independent datasets. To
confirm that the subnetwork nodes were able to effectively
differentiate between patients with OC with different prognoses,
the classification efficiency of the random forest classifier for
the validation set (GSE44104) was analyzed and presented using a
confusion matrix. Additionally, a Kaplan-Meier (KM) survival
analysis (28) was performed and
combined with the clinical information belonging to the TCGA
dataset.
Results
DEG screening
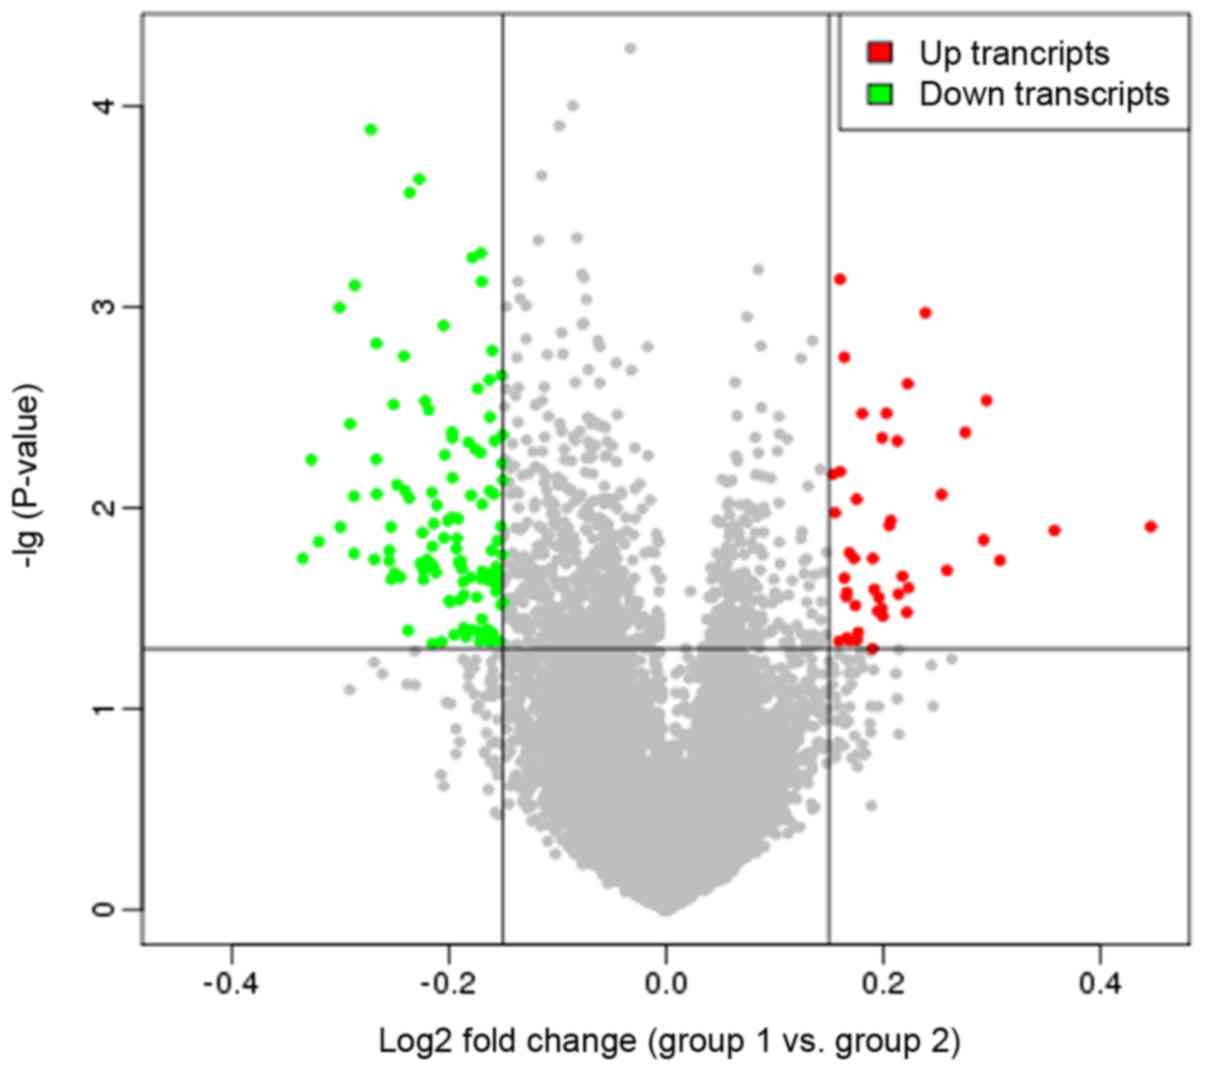
Following implementation of the DEDS algorithm, a
total of 44 upregulated and 117 downregulated genes were identified
in the recurrent samples relative to the non-recurrent samples,
with more downregulated genes identified compared with upregulated
genes. Additionally, a volcano plot was constructed to examine DEG
expression distributions (Fig.
1).
Functional enrichment analysis
Using the GO Term Finder, significant GO terms were
enriched for the upregulated and downregulated genes separately.
For the upregulated genes, the enriched GO terms were primarily
associated with the ‘regulation of synapse assembly’
(P=1.04×10⁻⁷), ‘regulation of synapse organization’
(P=5.26×10⁻⁷), and ‘regulation of synapse structure or
activity’ (P=5.71×10⁻⁷; Table IA). The downregulated genes were
associated with ‘single-multicellular organism process’
(P=4.11×10⁻⁵), ‘multicellular organismal process’
(P=5.14×10⁻⁵) and ‘positive regulation of steroid
hormone biosynthetic process’ (P=3.83×10⁻³; Table IB), which included cytochrome P450
family 17 subfamily A member 1 (CYP17A1).
 | Table I.Significant functional terms enriched
for the upregulated and downregulated genes. |
Table I.
Significant functional terms enriched
for the upregulated and downregulated genes.
| A, Upregulated
genes |
|---|
|
|---|
| Term | Corrected
P-value | Count | Genes |
|---|
| Regulation of
synapse assembly |
1.04×10⁻⁷ | 5 | DKK1, LINGO2,
TPBG, SLITRK5, SLITRK3 |
| regulation of
synapse organization |
5.26×10⁻⁷ | 5 | DKK1, LINGO2,
TPBG, SLITRK5, SLITRK3 |
| regulation of
synapse structure or activity |
5.71×10⁻⁷ | 5 | DKK1, LINGO2,
TPBG, SLITRK5, SLITRK3 |
| synapse
assembly |
2.08×10⁻⁶ | 5 | DKK1, LINGO2,
TPBG, SLITRK5, SLITRK3 |
| positive regulation
of synapse assembly |
6.78×10⁻⁶ | 4 | LINGO2, TPBG,
SLITRK5, SLITRK3 |
| synapse
organization |
2.23×10⁻⁵ | 5 | DKK1, LINGO2,
TPBG, SLITRK5, SLITRK3 |
| regulation of
nervous system development |
2.72×10⁻⁴ | 6 | LRRC7, DKK1,
LINGO2, TPBG, SLITRK5, SLITRK3 |
| positive regulation
of nervous system development |
4.44×10⁻⁴ | 5 | LRRC7, LINGO2,
TPBG, SLITRK5, SLITRK3 |
| regulation of
developmental process |
1.131×10⁻³ | 8 | LRRC7, DKK1,
SLITRK3, BVES, LINGO2, MEGF10, SLITRK5, TPBG |
| regulation of
multicellular organismal development |
1.96×10⁻³ | 7 | LRRC7, DKK1,
LINGO2, MEGF10, TPBG, SLITRK5, SLITRK3 |
| positive regulation
of developmental process |
2.64×10⁻³ | 6 | LRRC7, DKK1,
LINGO2, TPBG, SLITRK5, SLITRK3 |
| system
development |
2.84×10⁻³ | 10 | LRRC7, DKK1,
SLITRK3, WDR69, BVES, C8orf85, LINGO2, MEGF10, TPBG,
SLITRK5 |
| regulation of
multicellular organismal process |
3.63×10⁻³ | 8 | LRRC7, DKK1,
SLITRK3, BVES, LINGO2, MEGF10, SLITRK5, TPBG |
| single-organism
developmental process |
5.75×10⁻³ | 11 | LRRC7, DKK1,
SLITRK3, WDR69, BVES, C8orf85, LINGO2, MEGF10, MMP7, TPBG,
SLITRK5 |
| developmental
process |
6.65×10⁻³ | 11 | LRRC7, DKK1,
SLITRK3, WDR69, BVES, C8orf85, LINGO2, MEGF10, MMP7, TPBG,
SLITRK5 |
|
single-multicellular organism process |
8.10×10⁻³ | 11 | LRRC7, DKK1,
SLITRK3, WDR69, BVES, C8orf85, LINGO2, MEGF10, MMP7, TPBG,
SLITRK5 |
| positive regulation
of multicellular organismal process |
8.16×10⁻³ | 6 | LRRC7, DKK1,
LINGO2, TPBG, SLITRK5, SLITRK3 |
| multicellular
organism development |
9.65×10⁻³ | 10 | LRRC7, DKK1,
SLITRK3, WDR69, BVES, C8orf85, LINGO2, MEGF10, TPBG,
SLITRK5 |
| regulation of
cellular component biogenesis |
9.92×10⁻³ | 5 | DKK1, LINGO2,
TPBG, SLITRK5, SLITRK3 |
|
| B, Downregulated
genes |
|
| Terms | Corrected
P-value | Count | Genes |
|
|
single-multicellular organism process |
4.11×10⁻⁵ | 23 | GJA8, TRIM71,
TCF23, FOXL2, SCNN1G, CPNE5, ARX, CACNA2D2, SLC32A1, AQP5, CCR4,
SPTB, HOXC5, RD3, FGF9, PDZD7, PROK1, IL33, WNT6, CYP17A1, BMP6,
LGI1, COLEC11 |
| multicellular
organismal process |
5.14×10⁻⁵ | 25 | GJA8, TRIM71,
TCF23, FOXL2, SCNN1G, CPNE5, ARX, CACNA2D2, SLC32A1, AQP5, CCR4,
TAS1R3, SPTB, HOXC5, RD3, FGF9, PDZD7, PROK1, IL33, WNT6, ACCN3,
CYP17A1, BMP6, LGI1, COLEC11 |
| eye
development |
5.32×10⁻⁵ | 7 | RD3, GJA8, FGF9,
BMP6, AQP5, FOXL2, WNT6 |
| sensory organ
development |
7.88×10⁻⁵ | 8 | RD3, GJA8, FGF9,
BMP6, PDZD7, AQP5, FOXL2, WNT6 |
| multicellular
organism development |
1.86×10⁻⁴ | 20 | GJA8, TRIM71,
TCF23, FOXL2, CPNE5, ARX, SLC32A1, AQP5, CCR4, SPTB, HOXC5, FGF9,
RD3, PDZD7, PROK1, WNT6, CYP17A1, BMP6, LGI1, COLEC11 |
| anatomical
structure development |
1.87×10⁻⁴ | 21 | GJA8, TRIM71,
TCF23, FOXL2, CPNE5, ARX, CACNA2D2, SLC32A1, AQP5, CCR4, SPTB,
HOXC5, FGF9, RD3, PDZD7, PROK1, WNT6, CYP17A1, BMP6, LGI1,
COLEC11 |
| single-organism
developmental process |
5.26×10⁻⁴ | 21 | GJA8, TRIM71,
TCF23, FOXL2, CPNE5, ARX, CACNA2D2, SLC32A1, AQP5, CCR4, SPTB,
HOXC5, FGF9, RD3, PDZD7, PROK1, WNT6, CYP17A1, BMP6, LGI1,
COLEC11 |
| system
development |
5.74×10⁻⁴ | 18 | GJA8, TRIM71,
TCF23, FOXL2, CPNE5, ARX, SLC32A1, AQP5, CCR4, SPTB, FGF9, RD3,
PDZD7, PROK1, WNT6, CYP17A1, BMP6, LGI1 |
| developmental
process |
6.76×10⁻⁴ | 21 | GJA8, TRIM71,
TCF23, FOXL2, CPNE5, ARX, CACNA2D2, SLC32A1, AQP5, CCR4, SPTB,
HOXC5, FGF9, RD3, PDZD7, PROK1, WNT6, CYP17A1, BMP6, LGI1,
COLEC11 |
| positive regulation
of steroid hormone biosynthetic process |
3.83×10⁻³ | 2 | BMP6,
CYP17A1 |
| positive regulation
of growth |
4.05×10⁻³ | 5 | CACNA2D2, FGF9,
LGI1, CPNE5, ARX |
| nervous system
development |
4.48×10⁻³ | 12 | FGF9, PDZD7,
TRIM71, WNT6, CPNE5, CYP17A1, ARX, BMP6, LGI1, SLC32A1, CCR4,
SPTB |
| positive regulation
of organ growth |
7.93×10⁻³ | 3 | CACNA2D2, FGF9,
ARX |
| camera-type eye
development |
8.92×10⁻³ | 5 | RD3, GJA8, AQP5,
FOXL2, WNT6 |
| anatomical
structure morphogenesis |
9.15×10⁻³ | 12 | FGF9, PROK1,
PDZD7, TRIM71, FOXL2, WNT6, CPNE5, ARX, BMP6, LGI1, AQP5,
SPTB |
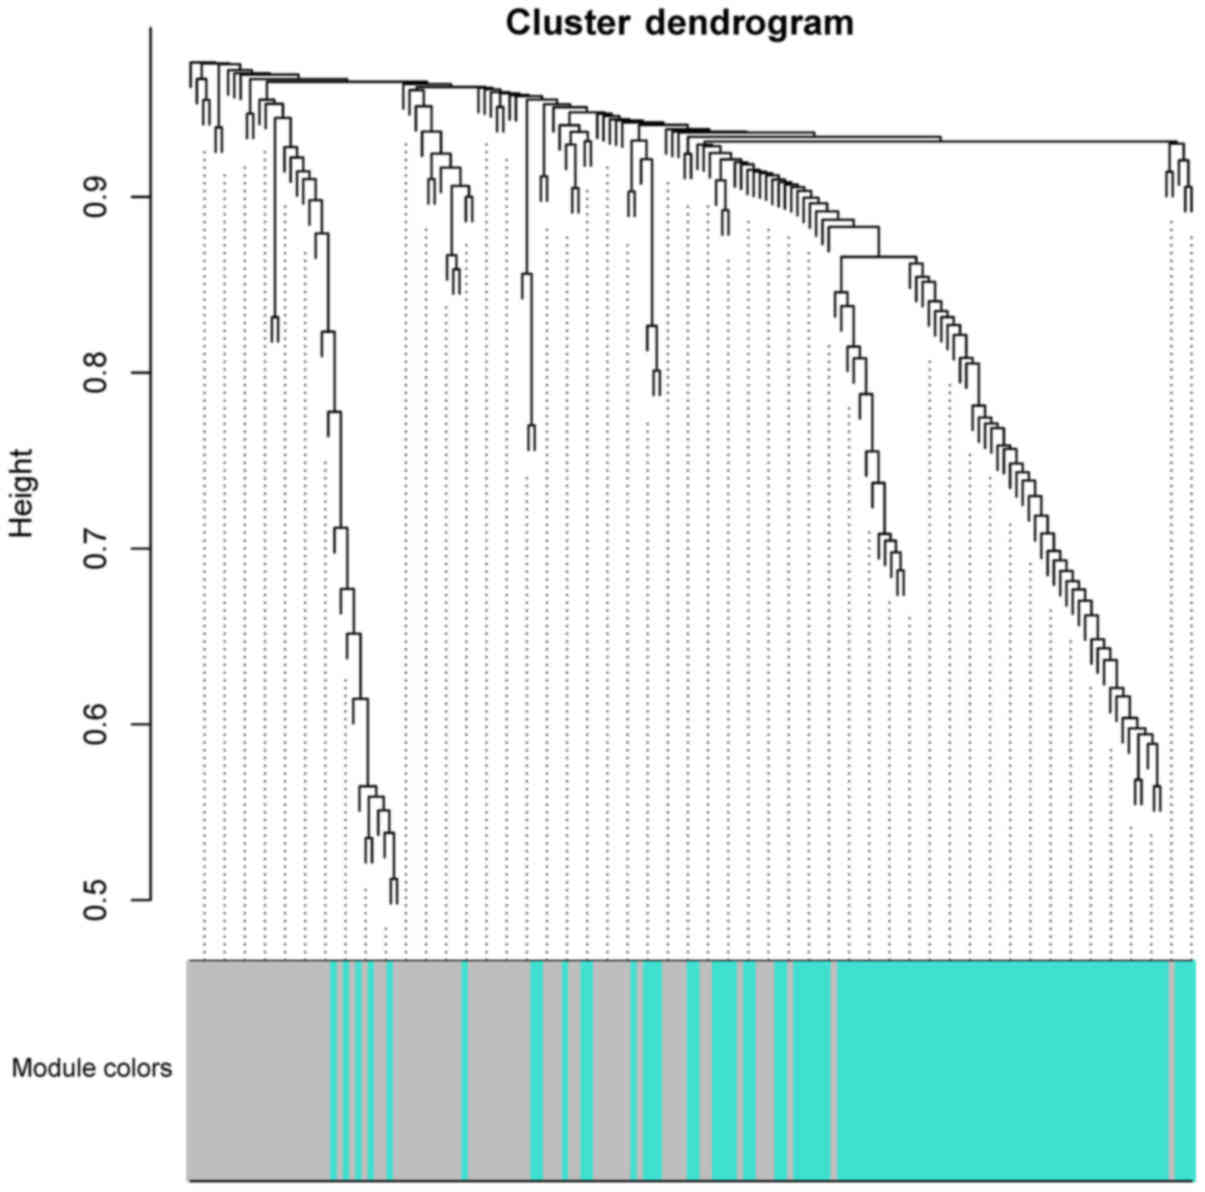
WGCNA
WGCNA was performed and turquoise and grey modules
were identified within the cluster dendrogram (Fig. 2). Within the turquoise module, 87
genes were identified (14 upregulated and 73 downregulated), while
in the grey module, 74 were identified (30 upregulated and 44
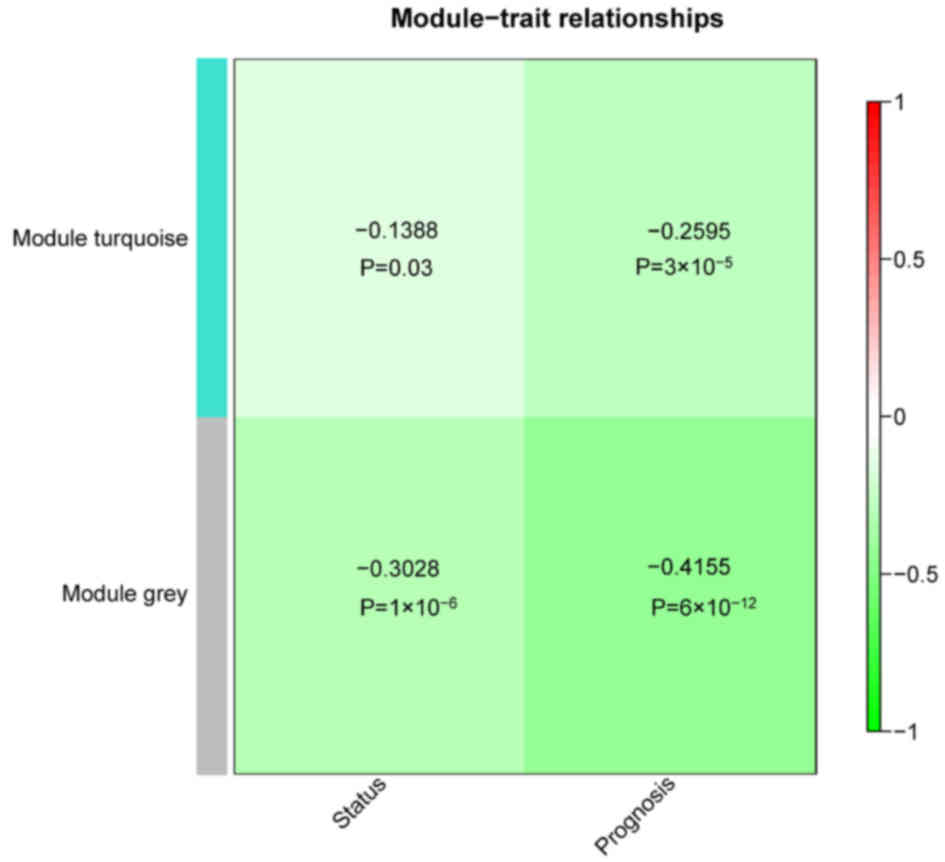
downregulated). Correlations between the two modules regarding
status/prognosis were also analyzed. The results demonstrated that
the two modules had significant correlations with status and
prognosis (P<0.05; Fig. 3).
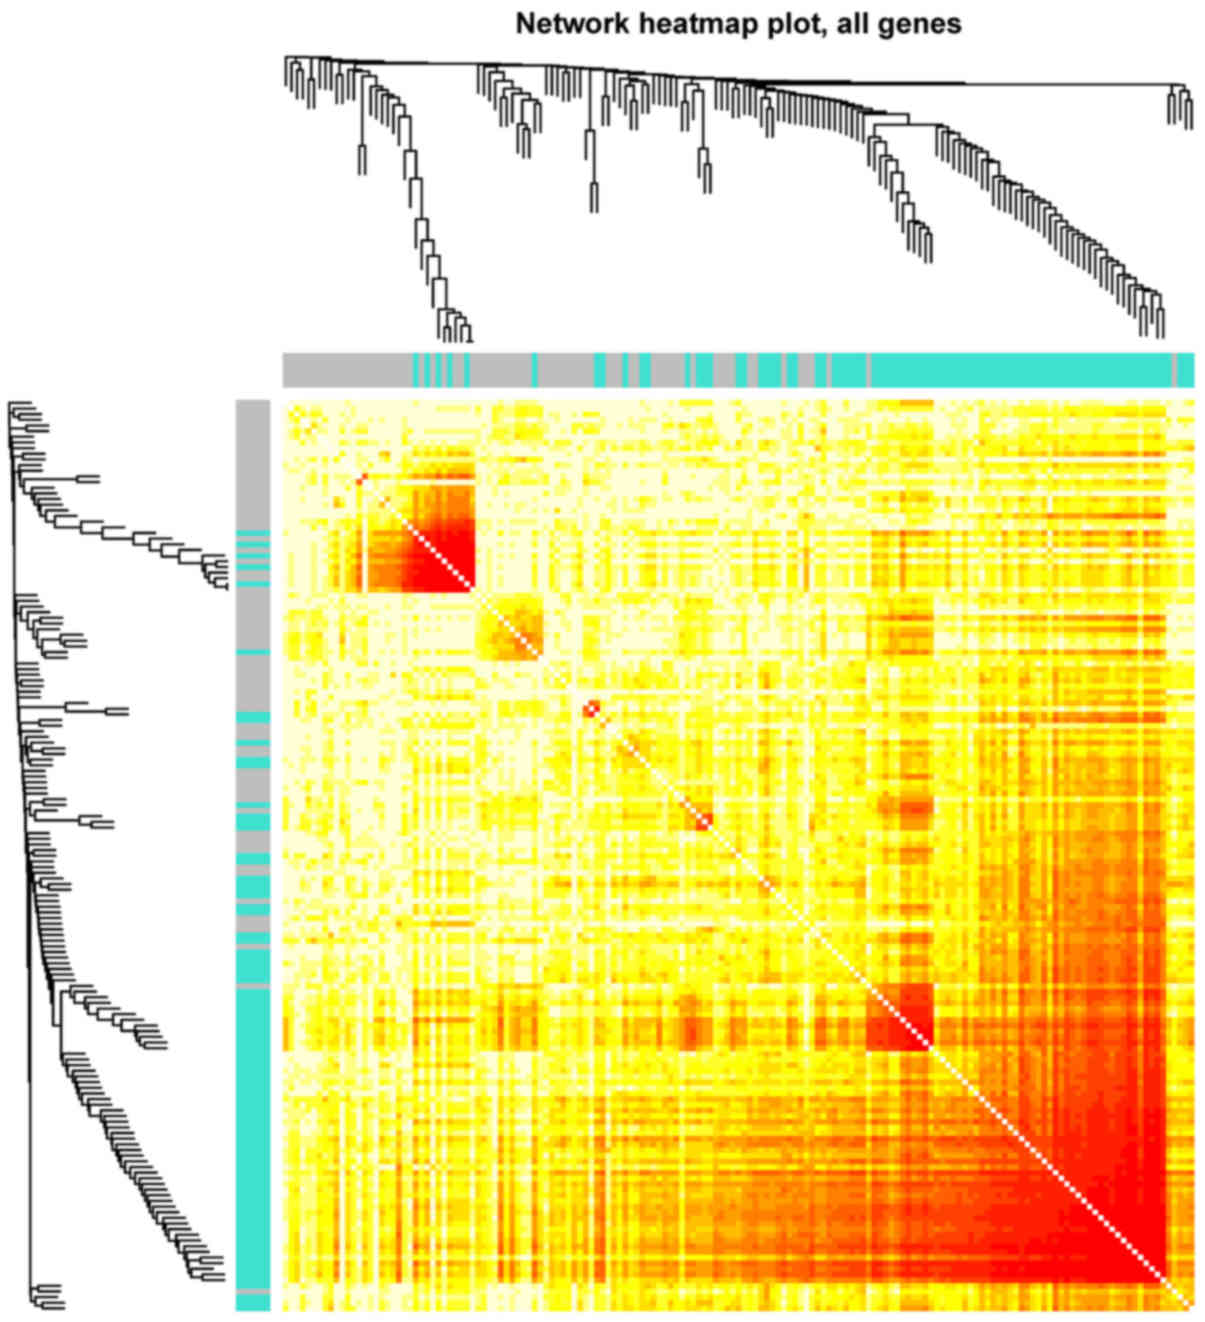
Furthermore, sample correlations were further examined via heatmap
analysis, and it was indicated that the samples in the turquoise
module were more strongly correlated when compared with those in
the grey module (Fig. 4).
Subnetwork analysis and classifier
construction
Following building of the PPI network, subnetwork
analysis was performed and a significant subnetwork was identified
(Fig. 5). The importance scores
for the 16 subnetwork nodes [transcription factor GATA-4 (GATA4);
fibroblast growth factor 9 (FGF9); aromatase (CYP19A1);
3β-hydroxysteroid dehydrogenase/δ5-4-isomerase type 2 (HSD3B2);
corticosteroid 11β-dehydrogenase isozyme 1 (HSD11B1); CYP17A1;
pituitary homeobox 2 (PITX2); left-right determination factor 1
(LEFTY1); homeobox protein ARX (ARX); estrogen receptor β (ESR2);
steroidogenic factor 1 (NR5A1); forkhead box protein L2 (FOXL2);
myocardin (MYOCD); steroidogenic acute regulatory protein
mitochondrial (STAR); vesicular inhibitory amino acid transporter
(SLC32A1); and twist-related protein 1 (TWIST1)] are listed in
Table II. There were multiple
interactions among these subnetwork nodes, including HSD3B2-NR5A1,
HSD11B1-HSD3B2, CYP17A1-GATA4, ARX-FOXL2, MYOCD-GATA4, STAR-FGF9
and SLC32A1-PITX2. The subnetwork nodes were taken as feature genes
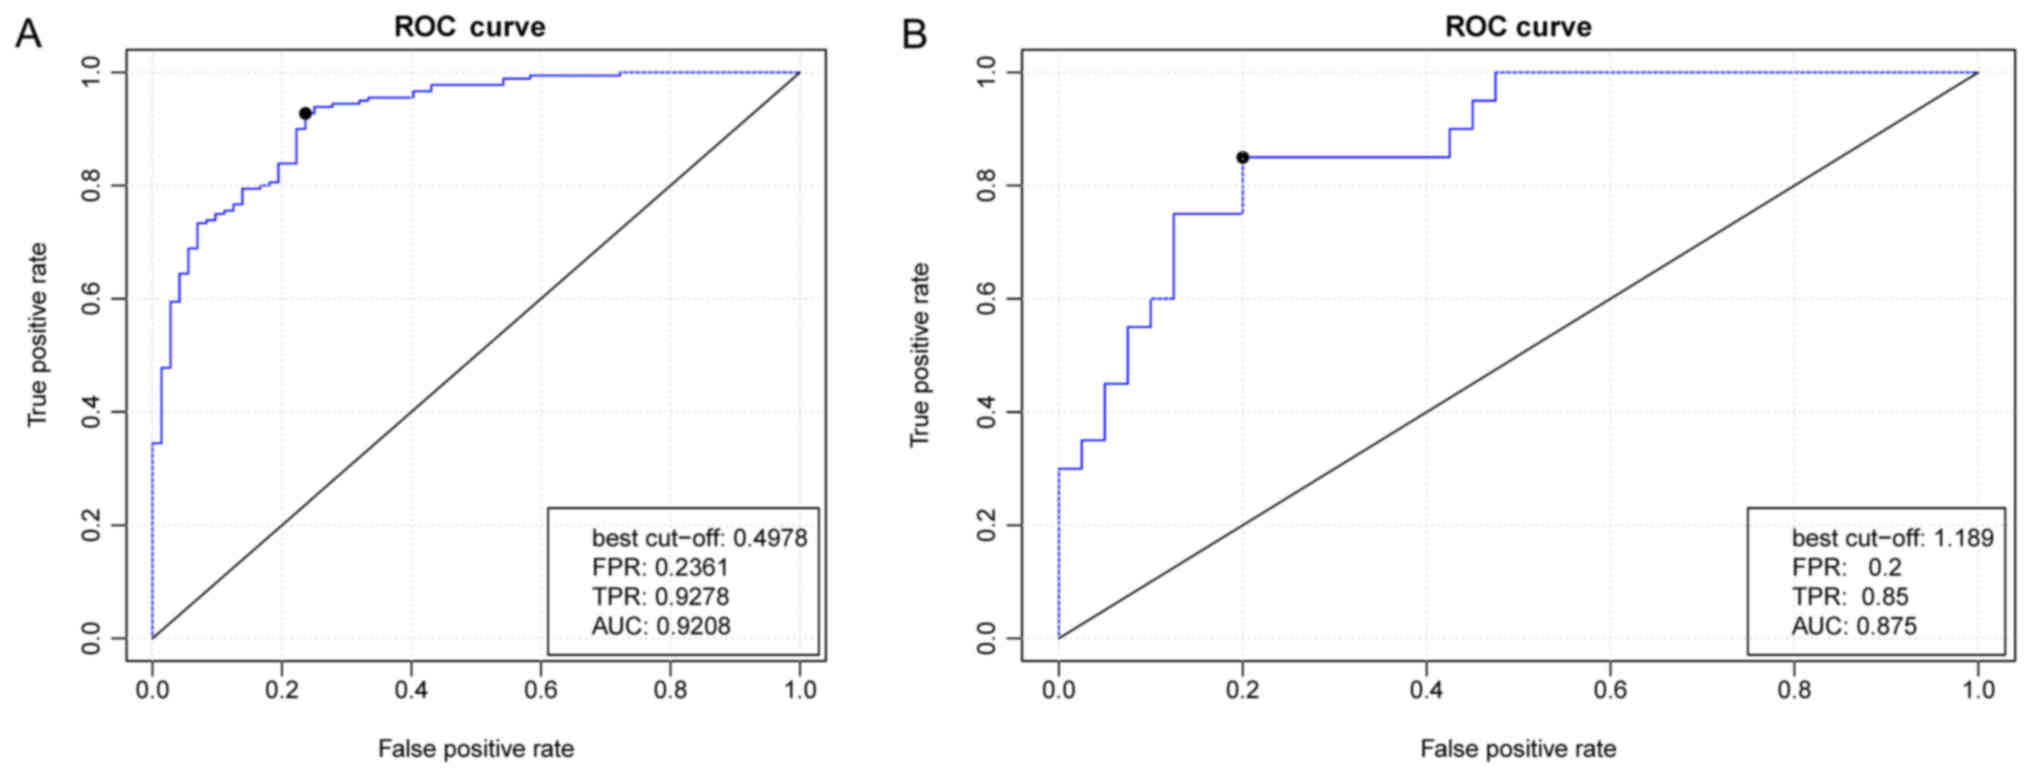
and a random forest classifier was constructed. The generated ROC
curve demonstrated that the true and false positive rates
separately were 92 and 23% when classifying the recurrent and
non-recurrent OC samples (Fig.
6A).
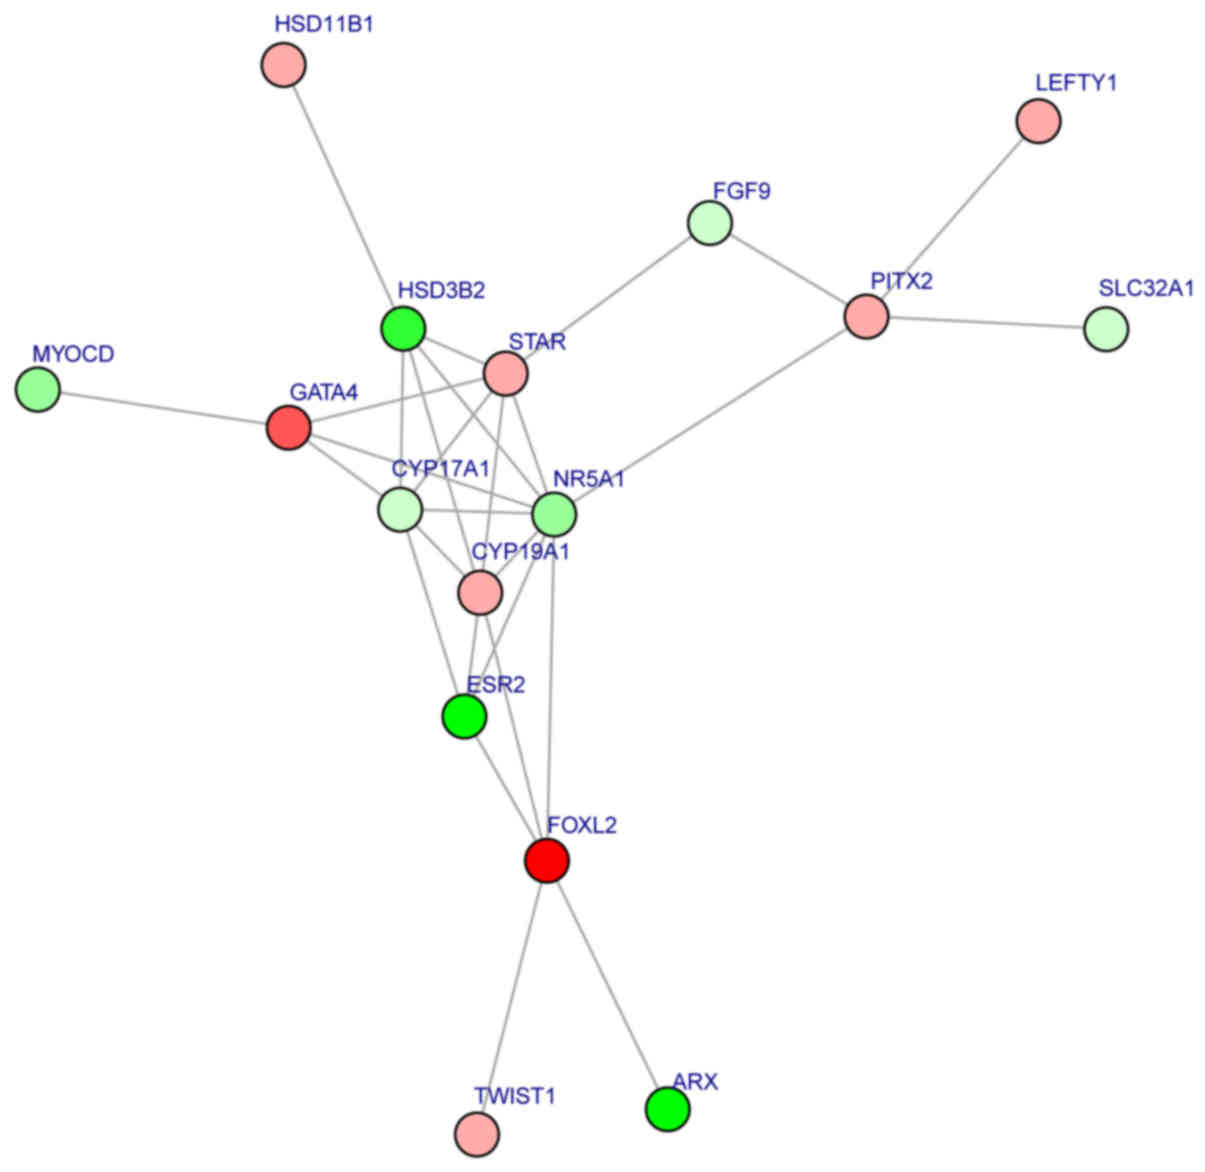 | Figure 5.Significant subnetwork identified
within the protein-protein interaction network. Upregulated genes
are denoted in red and downregulated in green. GATA4, transcription
factor GATA-4; FGF9, fibroblast growth factor 9; CYP19A1,
aromatase; HSD3B2, 3β-hydroxysteroid dehydrogenase/δ5-4-isomerase
type 2; HSD11B1, corticosteroid 11β-dehydrogenase isozyme 1;
CYP17A1, cytochrome P450 family 17 subfamily A member 1; PITX2,
pituitary homeobox 2; LEFTY1, left-right determination factor 1;
ARX, homeobox protein ARX; ESR2, estrogen receptor β; NR5A1,
steroidogenic factor 1; FOXL2, forkhead box protein L2; MYOCD,
myocardin; STAR, steroidogenic acute regulatory protein
mitochondrial; SLC32A1, vesicular inhibitory amino acid
transporter; TWIST1, twist-related protein 1. |
| Table II.Importance scores of the subnetwork
nodes. |
Table II.
Importance scores of the subnetwork
nodes.
| Node | Score |
|---|
| ARX | 15.203 |
| CYP17A1 | 10.956 |
| CYP19A1 | 10.902 |
| ESR2 | 10.537 |
| FGF9 | 10.148 |
| FOXL2 | 9.827 |
| GATA4 | 9.786 |
| HSD11B1 | 9.223 |
| HSD3B2 | 9.196 |
| LEFTY1 | 8.259 |
| MYOCD | 7.867 |
| NR5A1 | 7.634 |
| SLC32A1 | 6.367 |
| STAR | 6.167 |
| PITX2 | 5.094 |
| TWIST1 | 4.708 |
Validation using other independent
datasets
The random forest classifier was used to
differentiate between samples in the GSE44104 validation set, and
the prediction accuracies for the non-recurrence and recurrence
groups were 87.5 and 85%, respectively (Fig. 6B). These findings indicated that
the subnetwork nodes were important in predicting OC prognosis.
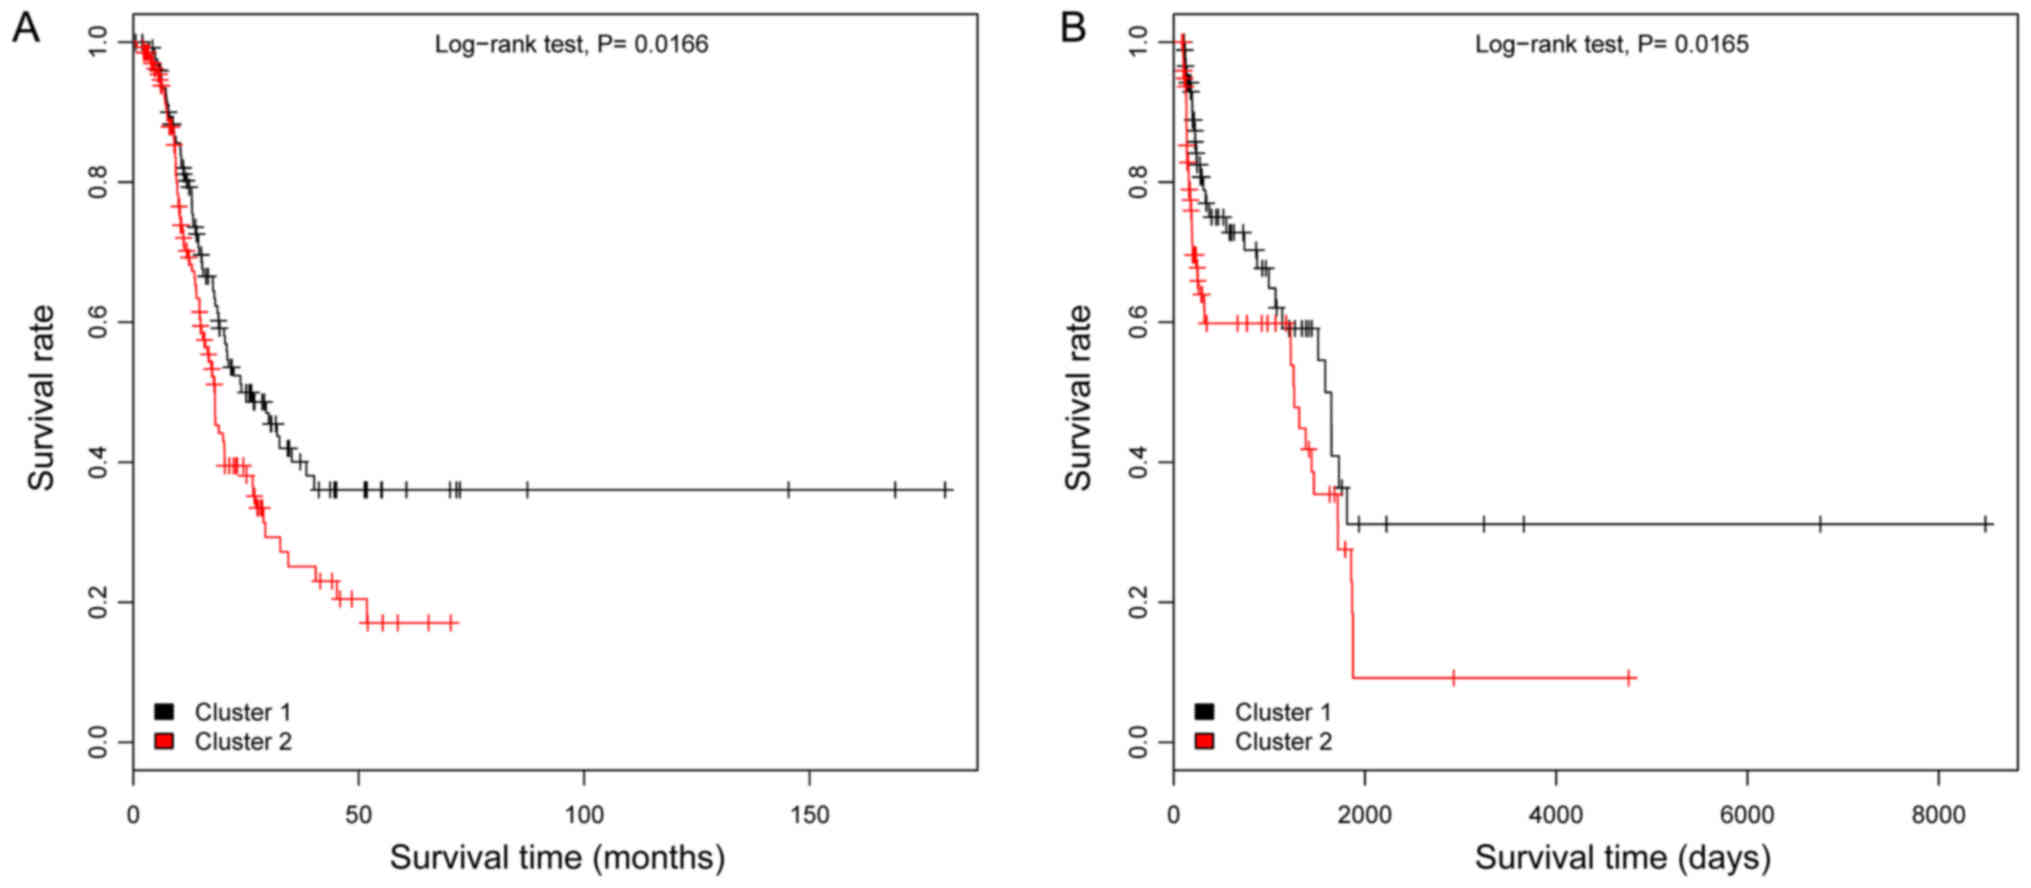
Of the 307 OC samples in the TCGA dataset, only 262
samples remained upon removal of samples without follow-up or
survival time information. These 262 samples were divided into
high- and low-risk groups using the random forest classifier, and
further examined using KM survival analysis. The results
demonstrated that the low risk group had a significantly longer
survival time compared with the high-risk group (P=0.0166; Fig. 7A). Subsequently, the samples from
the second validation set (GSE49997) were divided into high- and
low-risk groups using the random forest classifier. Following
analysis using a KM survival curve, a significant difference was
noted in survival time between the low- and high-risk groups
(P=0.0165; Fig. 7B). These
findings suggested that the random forest classifier had
portability and repeatability.
Discussion
In the present study, 44 upregulated and 117
downregulated genes were identified in the recurrent samples
relative to the non-recurrent samples. When performing WGCNA,
turquoise and grey modules were identified that had significant
correlations with status and prognosis. Furthermore, a significant
subnetwork was identified from the PPI network, with the subnetwork
nodes (including GATA4, FGF9, CYP19A1, HSD3B2, HSD11B1, CYP17A1,
PITX2, LEFTY1, ARX, ESR2, NR5A1, FOXL2, MYOCD, STAR, SLC32A1 and
TWIST1) being utilized as feature genes for constructing a random
forest classifier. Moreover, the classification efficiency of the
random forest classifier was validated and confirmed.
Of the identified nodes, previous studies have
reported that GATA4 overexpression, in conjunction with
human epidermal growth factor receptor 2, may predict a shorter
disease-free survival time and may be utilized as a prognostic
marker in patients with ovarian granulosa cell tumor to optimize
follow-up management in the early stages (29,30).
In OC, GATA4 and transcription factor GATA-6 expression is
frequently lost, with this feature specifying the histological
subtype prior to tumorigenic transition of the ovarian surface
epithelium (31). The upregulation
of FGF9 has been detected in primary ovarian endometrioid
adenocarcinomas carrying a defective Wnt/β-catenin pathway and
serves an important role in promoting the cancer phenotype
(32,33). The aromatase enzyme encoded by the
CYP19A1 gene acts in the conversion of androgen to estrogen,
with CYP19A1 variants potentially able to influence OC
susceptibility (34). Thus, GATA4,
FGF9 and CYP19A1 appear to be implicated in the
mechanisms of OC pathogenesis. Enrichment analysis demonstrated
that CYP17A1, which is involved in ‘positive regulation of
steroid hormone biosynthetic processes’, was downregulated. A
previous study demonstrated that steroid hormones serve a role in
OC pathogenesis, and their receptors influence OC patient survival
(35). Therefore, CYP17A1
may affect OC patient prognoses through the positive regulation of
steroid hormones.
The overexpression of PITX2 has been
implicated in OC progression by facilitating cell growth, migration
and invasion, and thus may potentially serve as a therapeutic
target for patients with high-grade OC (36,37).
PITX2 has also been demonstrated to promote OC cell
proliferation through the Wnt pathway, which is closely associated
with ovarian development and OC (38). In ovarian clear cell carcinoma, the
overexpression of LEFTY, a transforming growth factor-β
superfamily member, exhibits an anti-tumor effect by affecting cell
proliferation and cellular susceptibility to apoptotic signals
(39). Estrogen receptor β, which
is encoded by the ESR2 gene, has been suggested to serve as
a critical factor during OC carcinogenesis (40). Furthermore, within the ESR2
promoter region, the genotypic and allelic frequencies of the
single nucleotide polymorphism (SNP) rs3020449 have been
demonstrated to exhibit significant differences based on OC stage,
thus indicating that SNP rs3020449 may be associated with OC
progression (41). These findings
suggest that PITX2, LEFTY1 and ESR2 may also serve
roles in OC pathogenesis.
NR5A1 serves an important role in ovarian
function and development, with an NR5A1 mutation reported to
induce 46 XY disorders of sex development (42). FOXL2 is critical for GC
(granulosa cell) differentiation during the process of
folliculogenesis, with its downregulation potentially serving as an
ovarian granulosa cells tumor prognostic factor (43). TWIST1, which may induce
epithelial-mesenchymal transition and contribute to tumor
metastasis, has been demonstrated to be associated with poor
survival in patients with cancer (44,45).
Thus, NR5A1, FOXL2 and TWIST1 may be associated with
patient survival in OC. Moreover, the multiple interactions within
the PPI subnetwork (including HSD3B2-NR5A1, HSD11B1-HSD3B2,
CYP17A1-GATA4, ARX-FOXL2, MYOCD-GATA4, STAR-FGF9 and SLC32A1-PITX2)
indicate that HSD3B2, HSD11B1, CYP17A1, ARX, MYOCD, STAR and
SLC32A1 may also function in OC by interacting with other
genes.
However, the present study has several limitations
to note. First, the datasets used in the present study had sample
size differences, platform differences and data heterogeneities
that may affect the prediction accuracy of the random forest
classifier. Second, the smaller patient numbers and analytical
methods may limit the predictive capability of the present model.
Finally, only bioinformatics analyses were conducted in the present
study, and no direct experimental validation was performed.
Therefore, further analyses are required to validate the obtained
results.
In conclusion, 44 upregulated and 117 downregulated
genes associated with OC recurrence were identified. Furthermore,
the 16 subnetwork node genes that were identified may be critical
molecules associated with OC recurrence.
Acknowledgements
Not applicable.
Funding
The present study was supported by grants from the
Hubei Province's Outstanding Medical Academic Leader Program and
the Hubei Province Health and Family Planning Scientific Research
Project (grant no. WJ2015MA024) and the Natural Science Foundation
of Hubei Province (grant no. 2017CFB335).
Availability of data and materials
The datasets used and/or analysed during the current
study are available from the corresponding author on reasonable
request.
Authors' contributions
LC and LL performed data analyses and wrote the
manuscript. LW, XL and HX contributed significantly in data
analyses and manuscript revision. JZ conceived and designed the
study. All authors read and approved the final manuscript.
Ethics approval and consent to
participate
Not applicable.
Consent for publication
Not applicable.
Competing interests
The authors declare that they have no competing
interests.
References
|
1
|
Jayson GC, Kohn EC, Kitchener HC and
Ledermann JA: Ovarian cancer. Lancet. 384:1376–1388. 2014.
View Article : Google Scholar : PubMed/NCBI
|
|
2
|
Ebell MH, Culp MB and Radke TJ: A
systematic review of symptoms for the diagnosis of ovarian cancer.
Am J Prev Med. 50:384–394. 2016. View Article : Google Scholar : PubMed/NCBI
|
|
3
|
McGuire S: World Cancer Report 2014.
Geneva, Switzerland: World Health Organization, International
Agency for Research on Cancer, WHO Press, 2015. Adv Nutr.
7:418–419. 2016. View Article : Google Scholar : PubMed/NCBI
|
|
4
|
Lengyel E: ovarian cancer development and
metastasis. Am J Pathol. 177:1053–1064. 2010. View Article : Google Scholar : PubMed/NCBI
|
|
5
|
Cree IA: Cancer biology. Methods Mol Biol.
731:1–11. 2011. View Article : Google Scholar : PubMed/NCBI
|
|
6
|
Holschneider CH and Berek JS: Ovarian
cancer: Epidemiology, biology, and prognostic factors. Semin Surg
Oncol. 19:3–10. 2000. View Article : Google Scholar : PubMed/NCBI
|
|
7
|
Tworoger SS and Doherty JA: Epidemiologic
paradigms for progress in ovarian cancer research. Cancer Causes
Control. 28:361–364. 2017. View Article : Google Scholar : PubMed/NCBI
|
|
8
|
Siu MK, Chan HY, Kong DS, Wong ES, Wong
OG, Ngan HY, Tam KF, Zhang H, Li Z, Chan QK, et al: p21-activated
kinase 4 regulates ovarian cancer cell proliferation, migration,
and invasion and contributes to poor prognosis in patients. Proc
Natl Acad Sci USA. 107:18622–18627. 2010. View Article : Google Scholar : PubMed/NCBI
|
|
9
|
Nakayama N, Nakayama K, Shamima Y,
Ishikawa M, Katagiri A, Iida K and Miyazaki K: Gene amplification
CCNE1 is related to poor survival and potential therapeutic target
in ovarian cancer. Cancer. 116:2621–2634. 2010.PubMed/NCBI
|
|
10
|
Etemadmoghadam D, George J, Cowin PA,
Cullinane C and Kansara M: Australian Ovarian Cancer Study Group,
Gorringe KL, Smyth GK and Bowtell DD: Amplicon-dependent CCNE1
expression is critical for clonogenic survival after cisplatin
treatment and is correlated with 20q11 gain in ovarian cancer. PLoS
One. 5:e154982010. View Article : Google Scholar : PubMed/NCBI
|
|
11
|
Ehlén Å, Brennan DJ, Nodin B, O'Connor DP,
Eberhard J, Alvarado-Kristensson M, Jeffrey IB, Manjer J,
Brändstedt J, Uhlén M, et al: Expression of the RNA-binding protein
RBM3 is associated with a favourable prognosis and cisplatin
sensitivity in epithelial ovarian cancer. J Transl Med. 8:782010.
View Article : Google Scholar : PubMed/NCBI
|
|
12
|
Xia Y, Chang T, Wang Y, Liu Y, Li W, Li M
and Fan HY: YAP promotes ovarian cancer cell tumorigenesis and is
indicative of a poor prognosis for ovarian cancer patients. PLoS
One. 9:e917702014. View Article : Google Scholar : PubMed/NCBI
|
|
13
|
Zhang X, George J, Deb S, Degoutin JL,
Takano EA and Fox SB: AOCS Study group, Bowtell DD and Harvey KF:
The Hippo pathway transcriptional co-activator, YAP, is an ovarian
cancer oncogene. Oncogene. 30:2810–2822. 2011. View Article : Google Scholar : PubMed/NCBI
|
|
14
|
Zhang J, Guo X, Chang DY, Rosen DG,
Mercado-Uribe I and Liu J: CD133 expression associated with poor
prognosis in ovarian cancer. Mod Pathol. 25:456–464. 2012.
View Article : Google Scholar : PubMed/NCBI
|
|
15
|
Servant N, Roméjon J, Gestraud P, La Rosa
P, Lucotte G, Lair S, Bernard V, Zeitouni B, Coffin F,
Jules-Clément G, et al: Bioinformatics for precision medicine in
oncology: Principles and application to the SHIVA clinical trial.
Front Genet. 5:1522014. View Article : Google Scholar : PubMed/NCBI
|
|
16
|
Altshuler D, Daly MJ and Lander ES:
Genetic mapping in human disease. Science. 322:881–888. 2008.
View Article : Google Scholar : PubMed/NCBI
|
|
17
|
Chen JM, Cooper DN, Chuzhanova N, Férec C
and Patrinos GP: Gene conversion: Mechanisms, evolution and human
disease. Nat Rev Genet. 8:762–775. 2007. View Article : Google Scholar : PubMed/NCBI
|
|
18
|
Segundo ES, Tsanas A and Gómez-Vilda P:
Euclidean distances as measures of speaker dissimilarity including
identical twin pairs: A forensic investigation using source and
filter voice characteristics. Forensic Sci Int. 270:25–38. 2017.
View Article : Google Scholar : PubMed/NCBI
|
|
19
|
Yang YH, Xiao Y and Segal MR: Identifying
differentially expressed genes from microarray experiments via
statistic synthesis. Bioinformatics. 21:1084–1093. 2005. View Article : Google Scholar : PubMed/NCBI
|
|
20
|
Tweedie S, Ashburner M, Falls K, Leyland
P, McQuilton P, Marygold S, Millburn G, Osumi-Sutherland D,
Schroeder A, Seal R, et al: FlyBase: Enhancing Drosophila gene
ontology annotations. Nucleic Acids Res. 37:(Database issue).
D555–D559. 2009. View Article : Google Scholar : PubMed/NCBI
|
|
21
|
Lässer C, O'Neil SE, Shelke GV, Sihlbom C,
Hansson SF, Gho YS, Lundbäck B and Lötvall J: Exosomes in the nose
induce immune cell trafficking and harbour an altered protein cargo
in chronic airway inflammation. J Transl Med. 14:1812016.
View Article : Google Scholar : PubMed/NCBI
|
|
22
|
Iancu OD, Colville A, Oberbeck D,
Darakjian P, Mcweeney SK and Hitzemann R: Cosplicing network
analysis of mammalian brain RNA-Seq data utilizing WGCNA and Mantel
correlations. Front Genet. 6:1742015. View Article : Google Scholar : PubMed/NCBI
|
|
23
|
RC Team: R: A language and environment for
statistical computingR Foundation for Statistical Computing.
Vienna, Austria: 2016
|
|
24
|
Beisser D, Klau GW, Dandekar T, Müller T
and Dittrich MT: BioNet: An R-Package for the functional analysis
of biological networks. Bioinformatics. 26:1129–1130. 2010.
View Article : Google Scholar : PubMed/NCBI
|
|
25
|
Ma X, Guo J and Sun X: DNABP:
Identification of DNA-binding proteins based on feature selection
using a random forest and predicting binding residues. PLoS One.
11:e01673452016. View Article : Google Scholar : PubMed/NCBI
|
|
26
|
Mikshowsky A, Weigel KA and Gianola D:
0294 Assessing genomic prediction accuracy for Holstein sires using
bootstrap aggregation sampling and leave-one-out cross validation.
J Anim Sci. 94:139–140. 2016. View Article : Google Scholar
|
|
27
|
Thomas M: ROC curve comparison of ICNARC
and POSSUM in a UK critical care unit. Br J Anaesth. 117:6672016.
View Article : Google Scholar : PubMed/NCBI
|
|
28
|
May WL: Kaplan-Meier survival
analysisEncyclopedia of Cancer. Schwab M: Springer; Berlin: pp.
1934–1937. 2011, View Article : Google Scholar
|
|
29
|
Färkkilä A, Andersson N, Bützow R, Leminen
A, Heikinheimo M, Anttonen M and Unkila-Kallio L: HER2 and GATA4
are new prognostic factors for early-stage ovarian granulosa cell
tumor-a long-term follow-up study. Cancer Med. 3:526–536. 2014.
View Article : Google Scholar : PubMed/NCBI
|
|
30
|
Anttonen M, Pihlajoki M, Andersson N,
Georges A, L'hôte D, Vattulainen S, Färkkilä A1, Unkila-Kallio L,
Veitia RA and Heikinheimo M: FOXL2, GATA4, and SMAD3 co-operatively
modulate gene expression, cell viability and apoptosis in ovarian
granulosa cell tumor cells. PLoS One. 9:e855452014. View Article : Google Scholar : PubMed/NCBI
|
|
31
|
Cai KQ, Caslini C, Capo-Chichi CD, Slater
C, Smith ER, Wu H, Klein-Szanto AJ, Godwin AK and Xu XX: Loss of
GATA4 and GATA6 expression specifies ovarian cancer histological
subtypes and precedes neoplastic transformation of ovarian surface
epithelia. PLoS One. 4:e64542009. View Article : Google Scholar : PubMed/NCBI
|
|
32
|
Hendrix ND, Wu R, Kuick R, Schwartz DR,
Fearon ER and Cho KR: Fibroblast growth factor 9 has oncogenic
activity and is a downstream target of Wnt signaling in ovarian
endometrioid adenocarcinomas. Cancer Res. 66:1354–1362. 2006.
View Article : Google Scholar : PubMed/NCBI
|
|
33
|
Drummond AE, Tellbach M, Dyson M and
Findlay JK: Fibroblast growth factor-9, a local regulator of
ovarian function. Endocrinology. 148:3711–3721. 2007. View Article : Google Scholar : PubMed/NCBI
|
|
34
|
Goodman MT, Lurie G, Thompson PJ, Mcduffie
KE and Carney ME: Association of two common single-nucleotide
polymorphisms in the CYP19A1 locus and ovarian cancer risk. Endocr
Relat Cancer. 15:1055–1060. 2008. View Article : Google Scholar : PubMed/NCBI
|
|
35
|
Jönsson JM, Arildsen NS, Malander S,
Måsbäck A, Hartman L, Nilbert M and Hedenfalk I: Sex steroid
hormone receptor expression affects ovarian cancer survival. Transl
Oncol. 8:424–433. 2015. View Article : Google Scholar : PubMed/NCBI
|
|
36
|
Fung FK, Chan DW, Liu VW, Leung TH, Cheung
AN and Ngan HY: Increased expression of PITX2 transcription factor
contributes to ovarian cancer progression. PLoS One. 7:e370762012.
View Article : Google Scholar : PubMed/NCBI
|
|
37
|
Basu M, Bhattacharya R, Ray U,
Mukhopadhyay S, Chatterjee U and Roy SS: Invasion of ovarian cancer
cells is induced byPITX2-mediated activation of TGF-β and
Activin-A. Mol Cancer. 14:1622015. View Article : Google Scholar : PubMed/NCBI
|
|
38
|
Basu M and Roy SS: Wnt/β-catenin pathway
is regulated by PITX2 homeodomain protein and thus contributes to
the proliferation of human ovarian adenocarcinoma cell, SKOV-3. J
Biol Chem. 288:4355–4367. 2013. View Article : Google Scholar : PubMed/NCBI
|
|
39
|
Akiya M, Yamazaki M, Matsumoto T,
Kawashima Y, Oguri Y, Kajita S, Kijima D, Chiba R, Yokoi A,
Takahashi H, et al: Identification of LEFTY as a molecular marker
for ovarian clear cell carcinoma. Oncotarget. 8:63646–63664. 2017.
View Article : Google Scholar : PubMed/NCBI
|
|
40
|
Pearce Leigh C, Near AM, Butler JL, Van
Den Berg D, Bretsky P, Conti DV, Stram DO, Pike MC, Hirschhorn JN
and Wu AH: Comprehensive evaluation of ESR2 variation and ovarian
cancer risk. Cancer Epidemiol Biomarkers Prev. 17:393–396. 2008.
View Article : Google Scholar : PubMed/NCBI
|
|
41
|
Schüler S, Lattrich C, Skrzypczak M, Fehm
T, Ortmann O and Treeck O: Polymorphisms in the promoter region of
ESR2 gene and susceptibility to ovarian cancer. Gene. 546:283–287.
2014. View Article : Google Scholar : PubMed/NCBI
|
|
42
|
Lourenço D, Brauner R, Lin L, De Perdigo
A, Weryha G, Muresan M, Boudjenah R, Guerra-Junior G, Maciel-Guerra
AT, Achermann JC, et al: Mutations in NR5A1 Associated with Ovarian
Insufficiency. N Engl J Med. 360:1200–1210. 2009. View Article : Google Scholar : PubMed/NCBI
|
|
43
|
Kalfa N, Philibert P, Patte C, Ecochard A,
Duvillard P, Baldet P, Jaubert F, Fellous M and Sultan C:
Extinction of FOXL2 expression in aggressive ovarian granulosa cell
tumors in children. Fertil Steril. 87:896–901. 2007. View Article : Google Scholar : PubMed/NCBI
|
|
44
|
Wushou A, Hou J, Zhao YJ and Shao ZM:
Twist-1 up-regulation in carcinoma correlates to poor survival. Int
J Mol Sci. 15:21621–21630. 2014. View Article : Google Scholar : PubMed/NCBI
|
|
45
|
Yin G, Alvero AB, Craveiro V, Holmberg JC,
Fu HH, Montagna MK, Yang Y, Chefetz-Menaker I, Nuti S, Rossi M, et
al: Constitutive proteasomal degradation of TWIST-1 in
epithelial-ovarian cancer stem cells impacts differentiation and
metastatic potential. Oncogene. 32:39–49. 2013. View Article : Google Scholar : PubMed/NCBI
|