Introduction
Ewing sarcoma (ES) is an aggressive sarcoma of bone
and/or soft tissue with a peak incidence in children and young
adults, it is the third most common malignant primary bone tumor,
following osteosarcoma and chondrosarcoma (1,2).
Over the past decades, efforts have been made to maximize the
chance of cure and pathogenesis of ES through collaboration among
clinicians, pathologists, and biologists (3). The overall survival (OS) for ES
patients with localized disease is ~70%, but the OS of patients
with metastatic disease is only ~30% (4). Further efforts should be made to
improve these outcomes, especially for patients with metastatic and
recurrent ES.
Efforts of researchers and clinicians have advanced
the understanding of ES oncogenesis and the genetic predisposition
for developing ES (5). ES is
defined by a balanced translocation that involves the Ewing sarcoma
breakpoint region 1 (EWSR1) gene located on chromosome 22,
and a member of the E26 transformation-specific (ETS) family
of transcription factors that mainly contain the friend leukemia
integration 1 (FLI1) and EST-related gene (ERG) genes
(6). Two types of translocation
are generally observed on the molecular analysis of ES samples. The
first most common type, accounting for 85% of the translocations,
occurs when the EWSR1 fuse to the FLI1 gene which is
located on chromosome 11, resulting in an EWSR1-FLI1 fusion
gene (7). The second most common
translocation in ES, occurs when the EWS gene fuses to
another member of the ETS transcription factor family,
ERG, located on chromosome 21, resulting in an
EWSR1-ERG fusion gene (8,9).
Besides FLI1 and ERG, other members of the ETS
transcription factor family that can act as partners for
EWSR1 are ETV, ETV4, and FEV (10–12).
These fusion oncoproteins might serve as potential diagnostic
markers and therapeutic targets for ES. However, several reports
demonstrated that in addition to the expression of FLI1 in
ES, it can also be detected in other neoplasms including
lymphoblastic lymphomas, Merkel cell carcinoma, desmoplastic small
round cell tumor, and synovial sarcoma, endothelial cells and
lymphocytes also normally express FLI1 (13–15).
To date, no specific and accurate molecular markers have been
established for the early diagnosis and treatment of ES, and
therefore identification of new molecular markers is urgently
needed.
In the present study, a meta-analysis of several ES
transcriptome datasets from the Gene Expression Omnibus (GEO) was
performed. Differential expressed genes (DEGs) in ES compared with
normal tissues were identified and subjected to network analysis. A
Kaplan-Meier analysis of core genes networks was performed and
several survival-associated genes were identified that could act as
potential markers for the prognosis of patients with ES.
Materials and methods
Datasets
With the keyword of ‘Ewing Sarcoma’ and restriction
of organism=‘Homo sapiens’, platform=‘GPL570’ and
attribute=‘Tissue’, a total of three datasets with the accession
number of GSE34620 (5), GSE17618
(16) and GSE17674 (16) were obtained from the GEO
(www.ncbi.nlm.nih.gov/geo/). There are
117 ES tissue samples in GSE34620 and 44 ES tissue samples in
GSE17618 and without normal samples aside from the 18 in GSE17674.
For GSE17674, a total of 44 ES tissue samples and 18 normal
skeletal muscle samples were included. Table I demonstrates detailed information
of datasets used in the present study.
 | Table I.Microarray experiments used for
meta-analysis. |
Table I.
Microarray experiments used for
meta-analysis.
|
|
| Characteristic |
|
|
|---|
|
|
|
|
|
|
|---|
| GEO ID | Sample size
used/total | Case | Control | Platform | PMID |
|---|
| GSE34620 | 117/117 | Ewing sarcoma
(117) | NA | GPL570 | 22327514 |
| GSE17618 | 44/55 (exclude cell
line) | Ewing sarcoma
(44) | NA | GPL570 | 22084725 |
| GSE17674 | 62/62 | Ewing sarcoma
(44) | Skeletal muscle
(18) | GPL570 | 22084725 |
Microarray preprocessing
The raw datasets were firstly normalized prior to
differential expression analysis. In brief, the CEL files were
imported into R (www.r-project.org/), a free access statistics
software, to conduct batch normalization with the sva
package (17). Probe level
expression values were transformed to gene level based on the
microarray annotation file. For genes corresponding to multi
probes, the mean expression value was used.
Differential expression analysis
The limma package (18) was used for the identification of
genes with aberrant expression profiles in ES compared with normal
tissues. The t-test and FDR correction were used to test
significance of expression differences between ES and normal
tissues, and only those genes with adjusted P<0.05 and |log2Fold
Change|>1 (fold change >2 or <0.5) were considered with a
significantly differential expression.
Functional enrichment analysis
To explore functions involved in differential
expression genes (DEGs) in ES samples, the Database for Annotation,
Visualization and Integrated Discovery (DAVID, david.ncifcrf.gov/) (19) was used for the functional
enrichment analysis, and Gene Ontology (GO) terms and Kyoto
Encyclopedia of Genes and Genome (KEGG) pathways with P-value
<0.05 were screened out. In addition, to interpret associations
among those functions, the enrichmentMap plug-in (20) of Cytoscape software (21) was used to perform crosstalk
analysis of Biological Process (BP) terms.
Network analysis
By combining the network deposited in Protein
Interaction Network Analysis (PINA, cbg.garvan.unsw.edu.au/pina/) (22) and Menche's study (23), interaction pairs among DEGs were
screened. Additionally, the MCODE plug-in of Cytoscape software was
used to conducted modular analysis of the whole network.
Kaplan-Meier analysis
Hub network genes (genes with high degree) should
serve an important role in ES progression for the high number genes
directly interacting with them. In the present study, a
Kaplan-Meier analysis for hub network genes was conducted based on
another ES-associated dataset downloaded from The Cancer Genome
Atlas (TCGA; cancergenome.nih.gov/) to identify genes significantly
associated with ES overall survival (OS).
Reverse transcription-quantitative
polymerase chain reaction (RT-qPCR)
Total RNA was isolated from ES cell lines A673 and
normal mesenchymal stem cells (MSC, from Cyagen Biosciences,
Guangzhou, China) using an RNeasy® Mini kit (Qiagen
GmbH, Hilden, Germany) according to the manufacturer's protocol.
First-strand cDNA was synthesized from 11 µg of total RNA using the
Transcript or First Strand cDNA Synthesis kit (Roche Diagnostics,
GmbH, Mannheim, Germany) according to the manufacturer's protocol.
RT-qPCR reactions were performed on an ABI 7500 real-time PCR
system (Applied Biosystems; Thermo Fisher Scientific, Inc.,
Waltham, MA, USA) using the following procedure: 95°C for 10 min,
followed by 40 cycles of 95°C for 30 sec and 60°C for 1 min.
Primers used for glycogen phosphorylase (PYGM) are
(5′->3′): Forward primer, 5-TTTCACACTCGTAAAGGACCGCAAT-3, and
reverse primer, 5-TGTTCTGTAGCGTCCGTCCCATATA-3. Primers used for
myocyte-specific enhancer factor (MEF)2C are (5′->3′):
Forward primer, 5-TGGGTTGATGAAGAAGGCTTATGAG-3, and reverse primer,
5-TAAGGCCCTTCTTTCTCAACGTCTC-3. Primers used for Tripartite Motif
Containing (TRIM)63 are (5′->3′): Forward primer,
5-AAGCCAGTGGTCATCTTGCCGT-3, and reverse primer,
5-CGTACACTCCGTGACGATCCATGA-3. Primers used for BUB1B, budding
uninhibited by benzimidazoses (BUB1B) are (5′->3′):
Forward primer, 5-GTATAAACCACATCCTAAGCACCAG-3, and reverse primer,
5-CTCTGCACTGGTCAATAGCTCGGCT-3. Primers used for Ras
GTPase-activating protein (RACGAP)1 are (5′->3′): Forward
primer, 5-TGGCAAATTATCTCTGAAGTGTCGA-3, and reverse primer,
5-CTCTTTGCTCAATCTCATTTACACA-3. GAPDH was used as an internal
control. The 2−ΔΔCq method was used for data analysis
(24).
Results
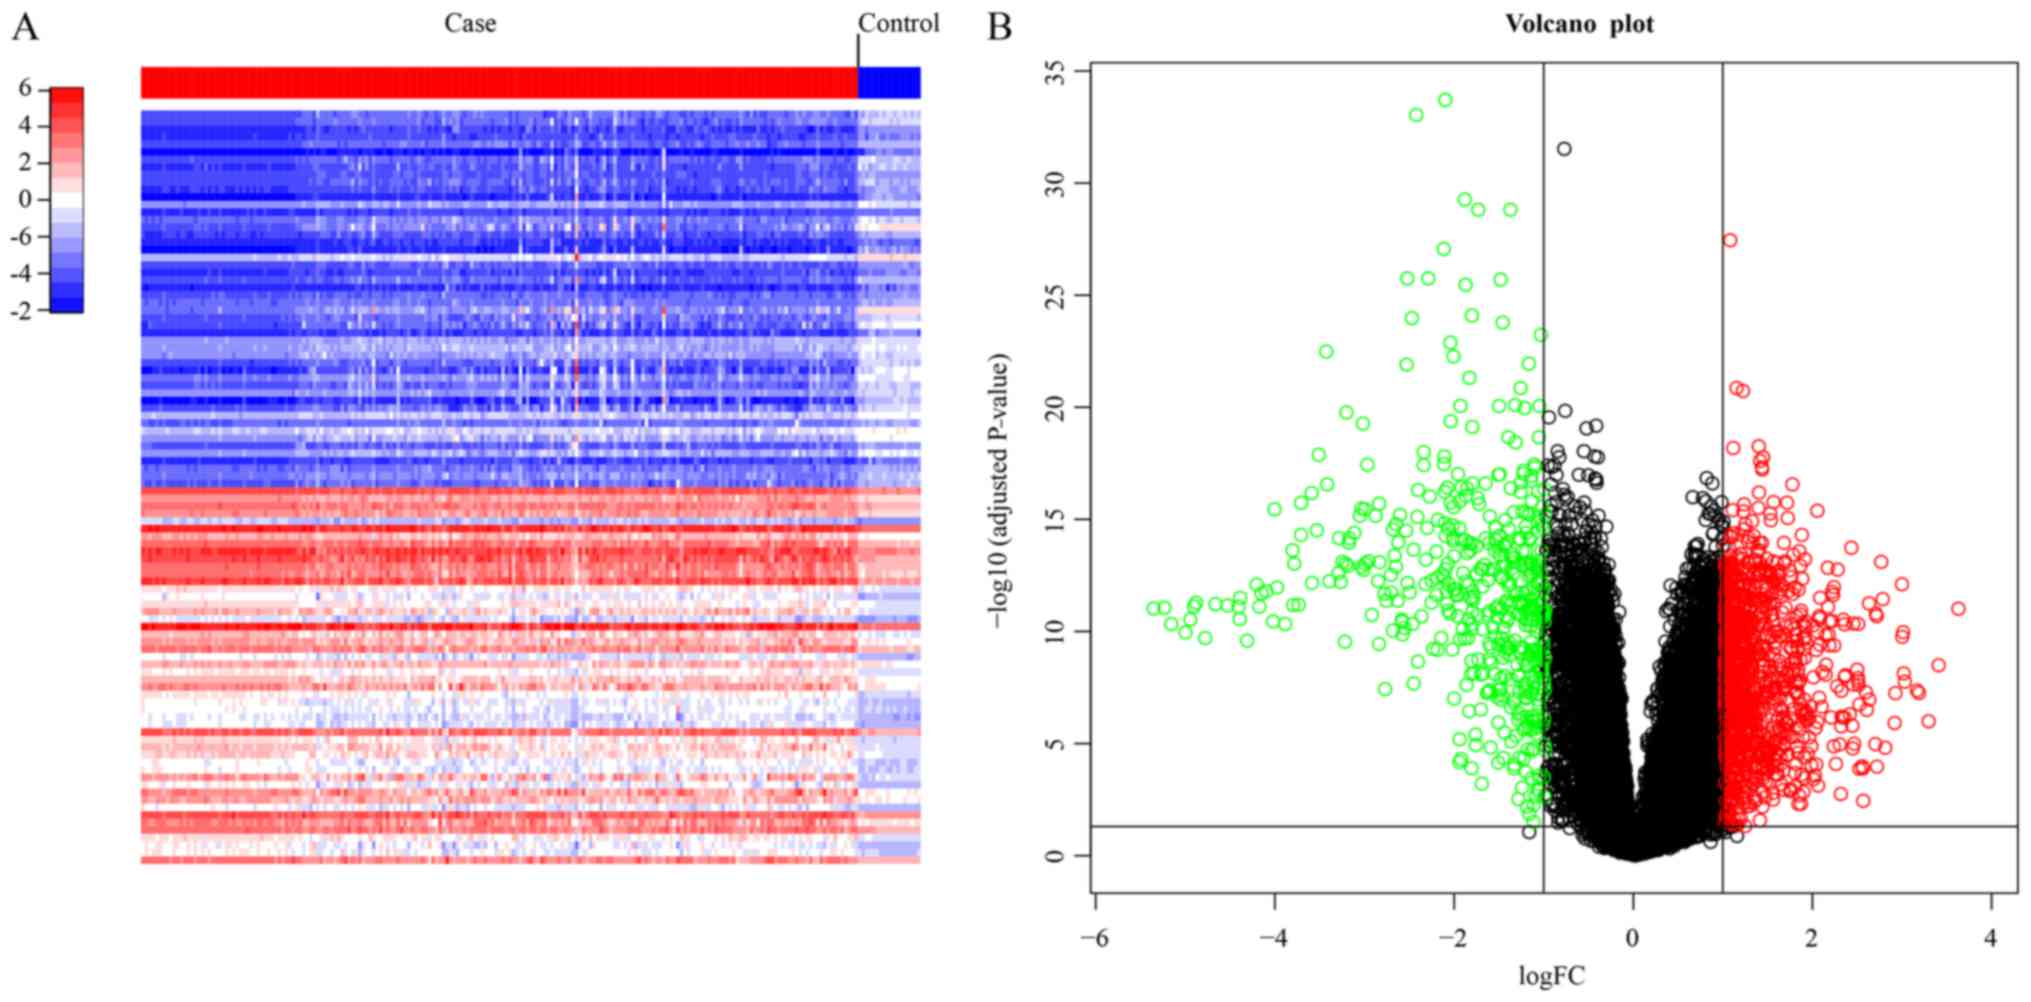
DEGs
Through the thresholds of adjusted P<0.05 and
|log2Fold Change|>1, a total of 1,470 DEGs were obtained in ES
samples compared to normal samples with 984 upregulated and 486
downregulated genes. Fig. 1A shows
the heatmap of the top 100 most significant genes with green and
red color representing low and high expression levels,
respectively. Fig. 1B shows the
distribution of DEGs with the green and red dots indicating down-
and upregulated genes and the black dots indicating the
non-differentially expressed genes.
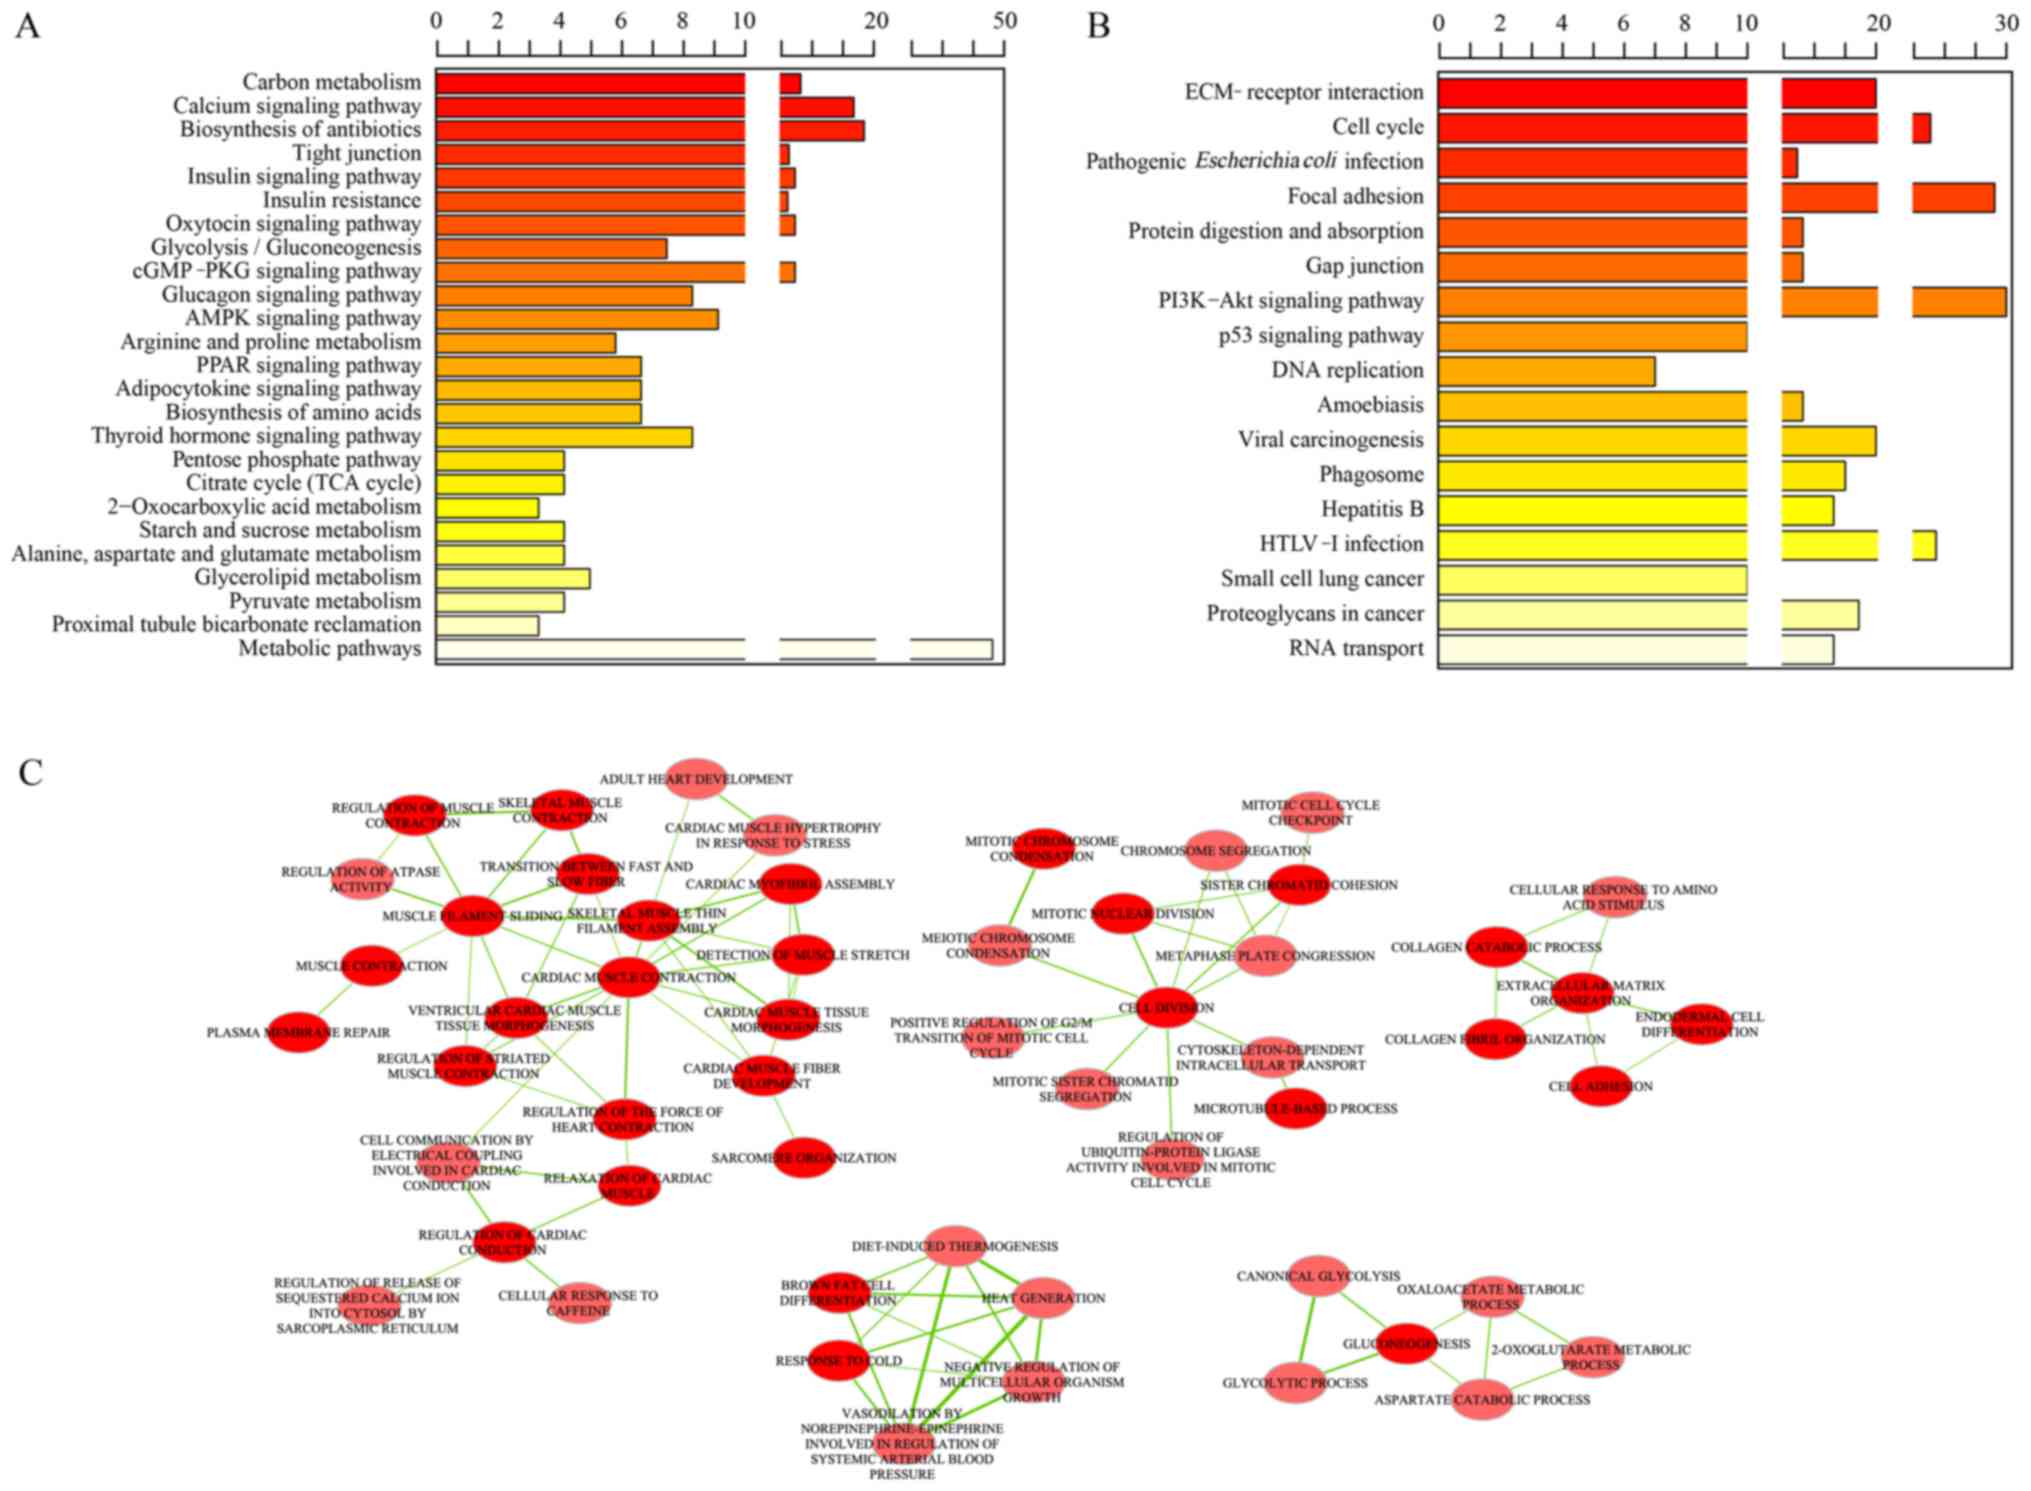
Functional enrichment analysis
The significantly enriched KEGG pathways of down-
and upregulated genes were separately analyzed. As a result, a
total of 25 KEGG pathways that significantly associated with
substance metabolism, such as insulin signaling pathway,
2-Oxocarboxylic acid metabolism were significantly enriched in
downregulated genes (Fig. 2A).
However, upregulated genes were demonstrated to be involved in 17
KEGG pathways associated with cancer development and cell activity,
including the p53 signaling pathway, and cell cycle (Fig. 2B).
GO terms enrichment analysis for DEGs was performed
and 173 significantly enriched GO terms were identified. For BP
terms, their association through the enrichment Map plug-in of
Cytoscape software was explored. As a result, five clusters were
obtained, which were associated with muscle contraction, cell
division, extracellular matrix organization, response to stimuli
and metabolism, respectively (Fig.
2C).
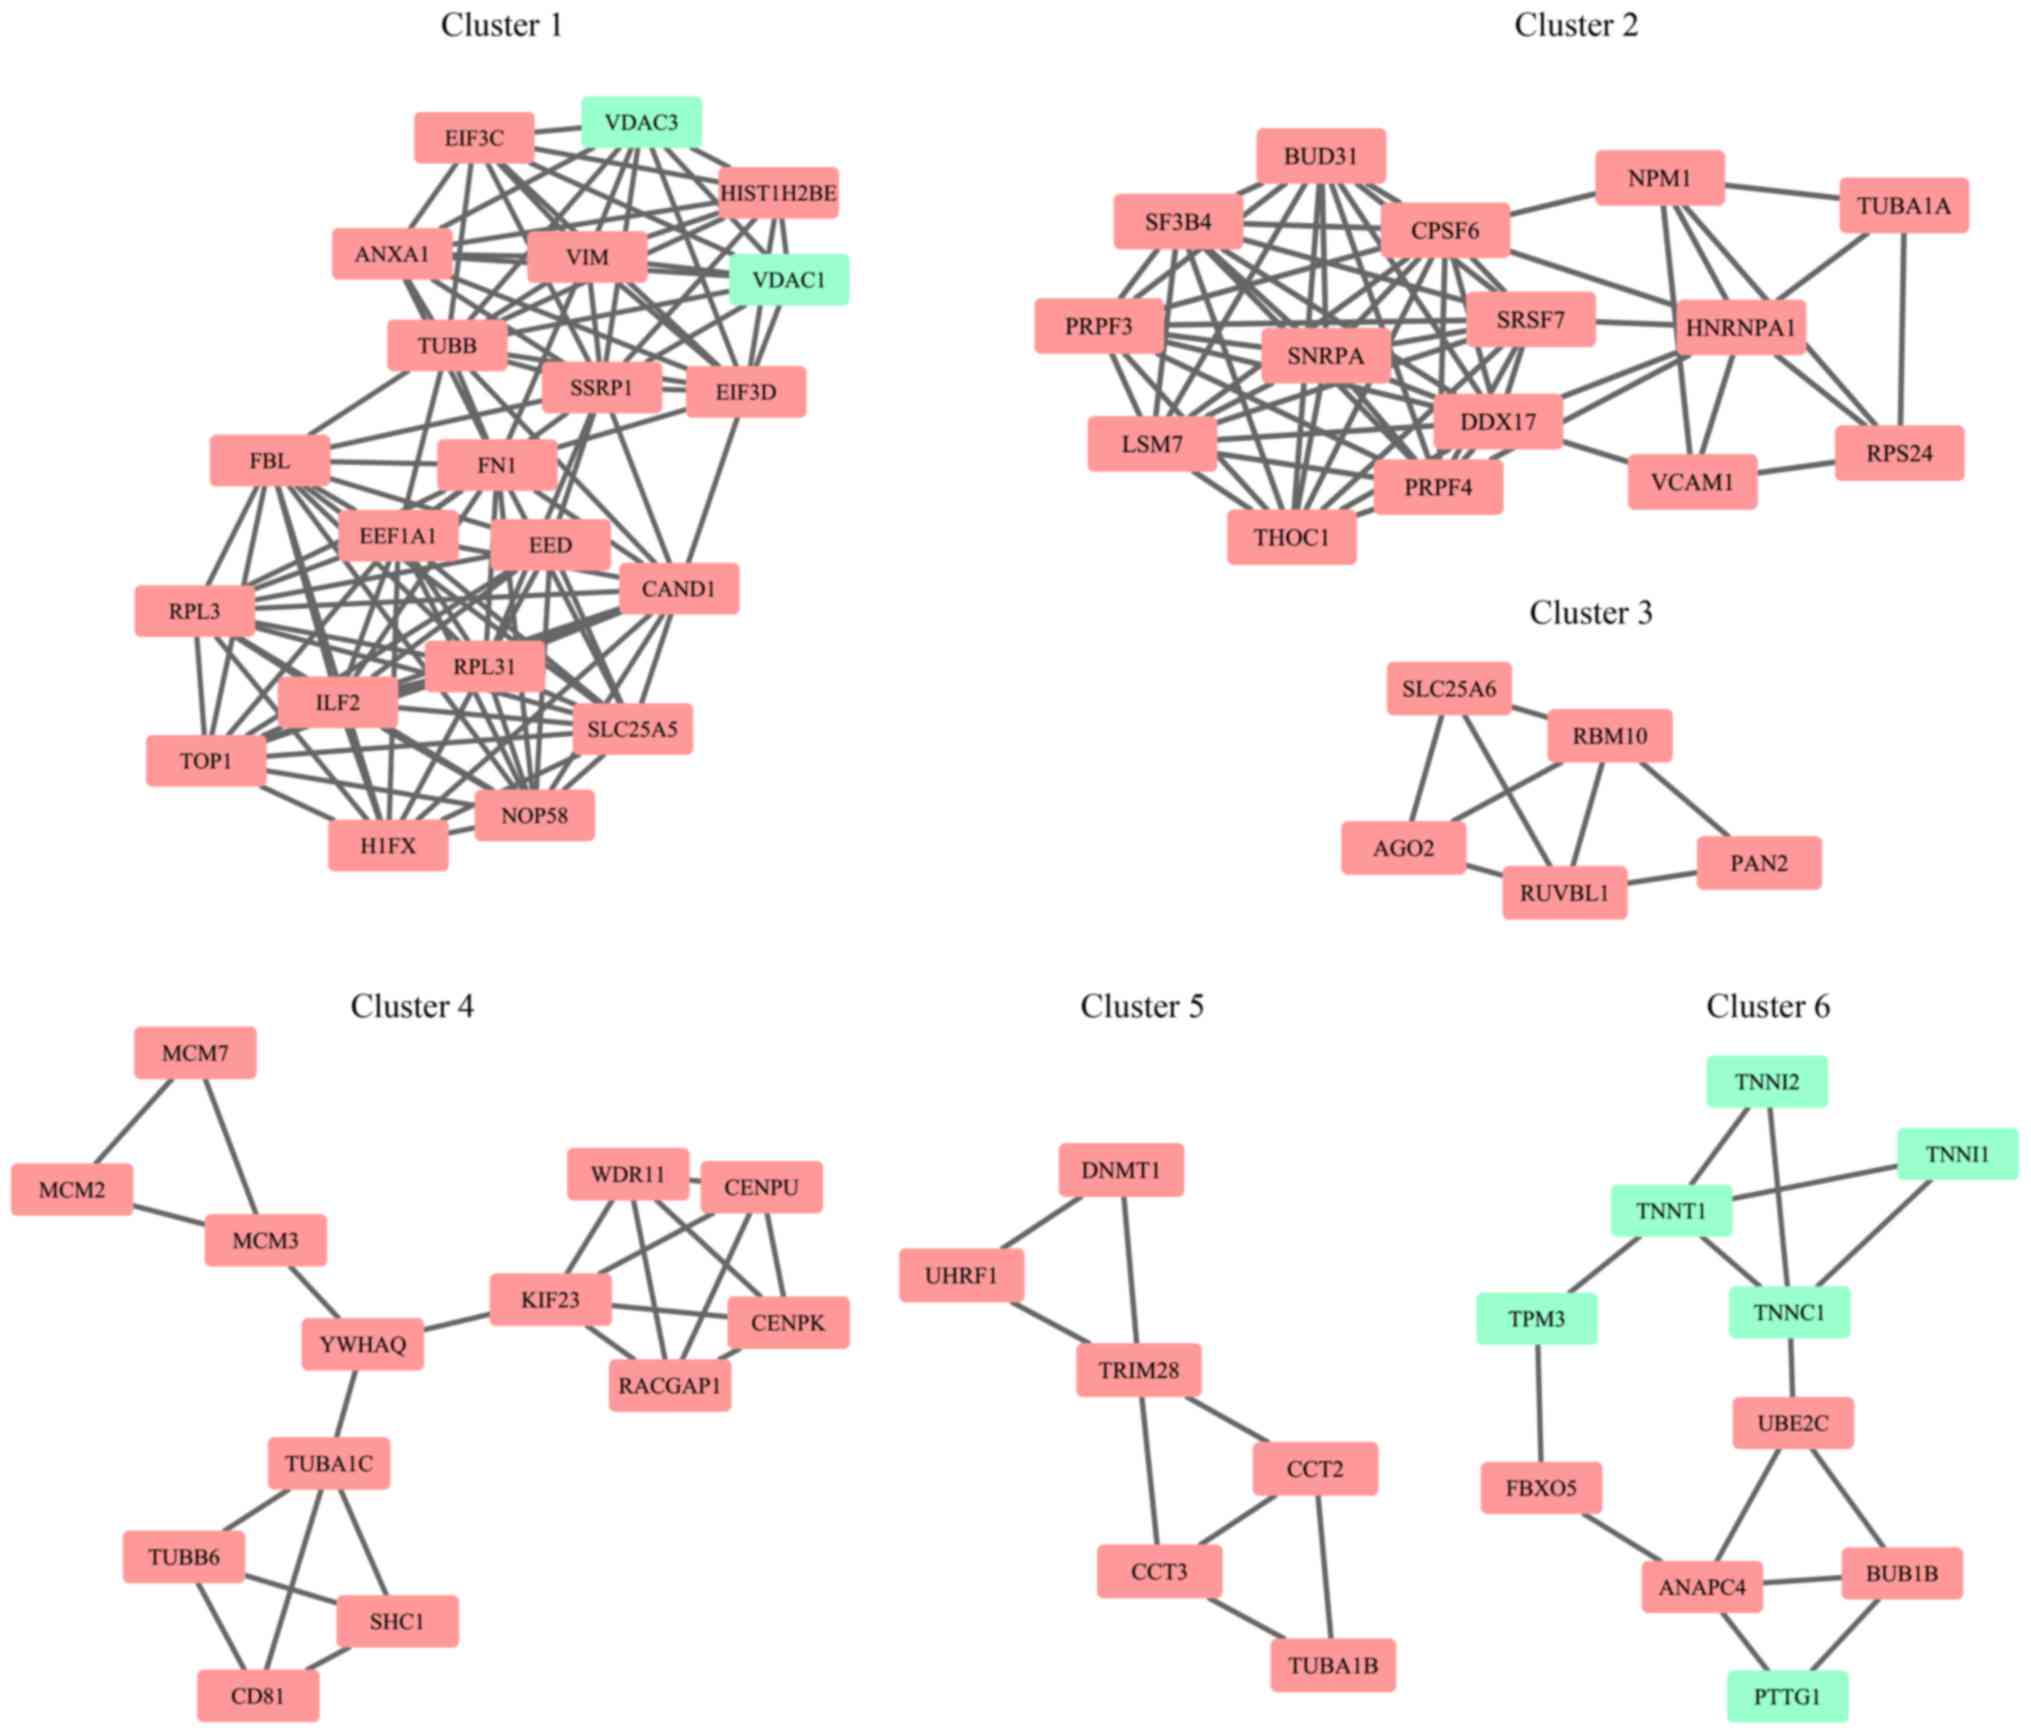
Network analysis
Combined analysis of network of PINA and a study by
Menche et al (23)
identified 13,259 interaction pairs among the 1,470 DEGs. Modular
analysis obtained a total of six network modules contained five
upregulated and one downregulated module as shown in Fig. 3. For interpretation of the
biological processes of every module, KEGG pathway analysis for
module genes through KOBAS online tool (kobas.cbi.pku.edu.cn/) was conducted (25). As a result, besides
cancer-associated pathways, KEGG pathways associated with nervous
system diseases, such as Parkinson's disease, Huntington's disease,
were also significantly enriched in several network modules
(Table II).
| Table II.Significantly enriched KEGG pathways
of the six network modules. |
Table II.
Significantly enriched KEGG pathways
of the six network modules.
| A, Module
1 |
|---|
|
|---|
| Pathway | Pathway ID | P-value | FDR |
|---|
| Parkinson's
disease | hsa05012 |
6.01×10⁻⁵ |
8.51×10⁻⁴ |
| cGMP-PKG signaling
pathway | hsa04022 |
9.64×10⁻⁵ |
8.51×10⁻⁴ |
| RNA transport | hsa03013 |
1.05×10⁻⁴ |
8.51×10⁻⁴ |
| Calcium signaling
pathway | hsa04020 |
1.20×10⁻⁴ |
8.51×10⁻⁴ |
| Huntington's
disease | hsa05016 |
1.47×10⁻⁴ |
8.51×10⁻⁴ |
| HTLV-I
infection | hsa05166 |
3.44×10⁻⁴ |
1.66×10⁻³ |
| Ribosome biogenesis
in eukaryotes | hsa03008 |
1.06×10⁻³ |
4.38×10⁻³ |
| Ribosome | hsa03010 |
2.47×10⁻³ |
8.96×10⁻³ |
| Viral
carcinogenesis | hsa05203 |
5.30×10⁻³ |
1.71×10⁻² |
|
| B, Module
2 |
|
|
Spliceosome |
hsa03040 |
3.82×10⁻¹⁹ |
6.87×10⁻¹⁸ |
|
| African
trypanosomiasis | hsa05143 |
1.35×10⁻² |
6.87×10⁻² |
| Malaria | hsa05144 |
1.87×10⁻² |
6.87×10⁻² |
| Pathogenic
Escherichia coli infection | hsa05130 |
2.09×10⁻² |
6.87×10⁻² |
| RNA
degradation | hsa03018 |
2.90×10⁻² |
6.87×10⁻² |
| Gap junction | hsa04540 |
3.30×10⁻² |
6.87×10⁻² |
| mRNA surveillance
pathway | hsa03015 |
3.45×10⁻² |
6.87×10⁻² |
| NF-kappa B
signaling pathway | hsa04064 |
3.49×10⁻² |
6.87×10⁻² |
| AGE-RAGE signaling
pathway in diabetic complications | hsa04933 |
3.78×10⁻² |
6.87×10⁻² |
| TNF signaling
pathway | hsa04668 |
4.11×10⁻² |
6.87×10⁻² |
| Leukocyte
transendothelial migration | hsa04670 |
4.40×10⁻² |
6.87×10⁻² |
|
| C, Module
3 |
|
| RNA
degradation |
hsa03018 |
9.77×10⁻³ |
2.76×10⁻² |
|
| Parkinson's
disease | hsa05012 |
1.79×10⁻² |
2.76×10⁻² |
| Wnt signaling
pathway | hsa04310 |
1.80×10⁻² |
2.76×10⁻² |
| cGMP-PKG signaling
pathway | hsa04022 |
2.09×10⁻² |
2.76×10⁻² |
| Influenza A | hsa05164 |
2.21×10⁻² |
2.76×10⁻² |
| Calcium signaling
pathway | hsa04020 |
2.26×10⁻² |
2.76×10⁻² |
| Huntington's
disease | hsa05016 |
2.42×10⁻² |
2.76×10⁻² |
| HTLV-I
infection | hsa05166 |
3.23×10⁻² |
3.23×10⁻² |
|
| D, Module
4 |
|
| Cell
cycle |
hsa04110 |
7.15×10⁻⁸ |
2.29×10⁻⁶ |
|
| DNA
replication | hsa03030 |
2.48×10⁻⁷ |
3.96×10⁻⁶ |
| Pathogenic
Escherichia coli infection | hsa05130 |
8.33×10⁻⁷ |
8.88×10⁻⁶ |
| Gap junction | hsa04540 |
3.89×10⁻⁴ |
3.11×10⁻³ |
| Phagosome | hsa04145 |
1.17×10⁻³ |
7.51×10⁻³ |
| MicroRNAs in
cancer | hsa05206 |
4.21×10⁻³ |
2.25×10⁻² |
|
| E, Module
5 |
|
| Cysteine and
methionine metabolism |
hsa00270 |
6.92×10⁻³ |
2.95×10⁻² |
|
| Pathogenic
Escherichia coli infection | hsa05130 |
8.42×10⁻³ |
2.95×10⁻² |
| Gap junction | hsa04540 |
1.34×10⁻² |
3.12×10⁻² |
| Apoptosis | hsa04210 |
2.11×10⁻² |
3.26×10⁻² |
| Phagosome | hsa04145 |
2.33×10⁻² |
3.26×10⁻² |
|
| F, Module
6 |
|
| Pathway | Pathway
ID | P-value | FDR |
|
| Oocyte meiosis | hsa04114 |
3.67×10⁻⁶ |
2.25×10⁻⁵ |
| Cell cycle | hsa04110 |
3.75×10⁻⁶ |
2.25×10⁻⁵ |
| HTLV-I
infection | hsa05166 |
3.28×10⁻⁵ |
1.31×10⁻⁴ |
| Ubiquitin mediated
proteolysis | hsa04120 |
5.36×10⁻⁴ |
9.19×10⁻⁴ |
| Thyroid cancer | hsa05216 |
7.52×10⁻³ |
1.00×10⁻² |
|
Progesterone-mediated oocyte
maturation | hsa04914 |
2.46×10⁻² |
2.95×10⁻² |
| Calcium signaling
pathway | hsa04020 |
4.46×10⁻² |
4.86×10⁻² |
| Pathways in
cancer | hsa05200 |
9.57×10⁻² |
9.57×10⁻² |
Kaplan-Meier analysis
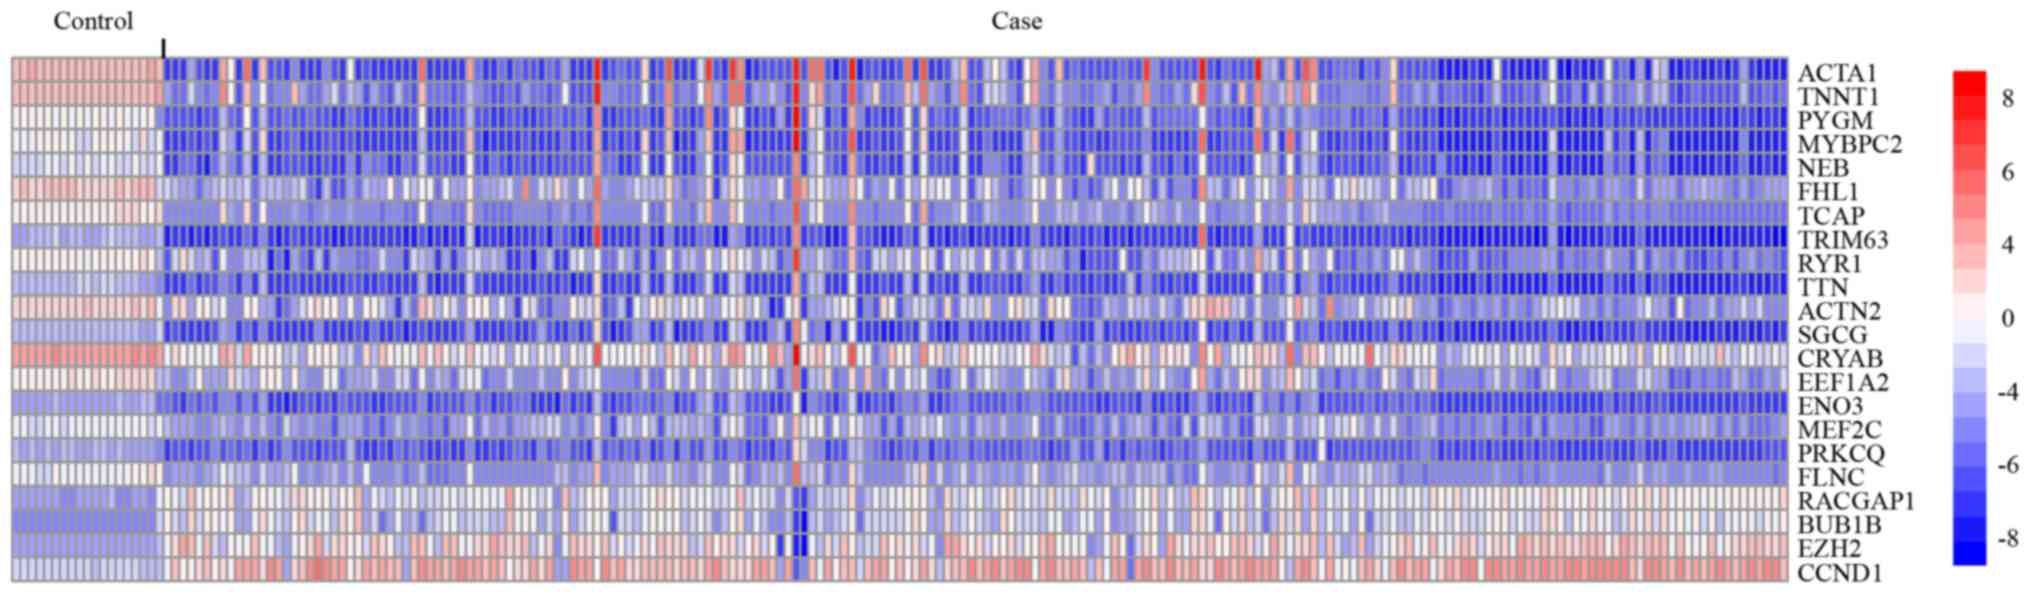
To identify potential biomarkers involved in ES
progression, simultaneously with network degree >10 (genes that
directly interact with ≥10 other genes in the network) and
|log2Fold Change|>2 were screened. As a result, 22 genes were
obtained (Table III) which
contained 18 down- and 4 upregulated genes Fig. 4 demonstrates their expression
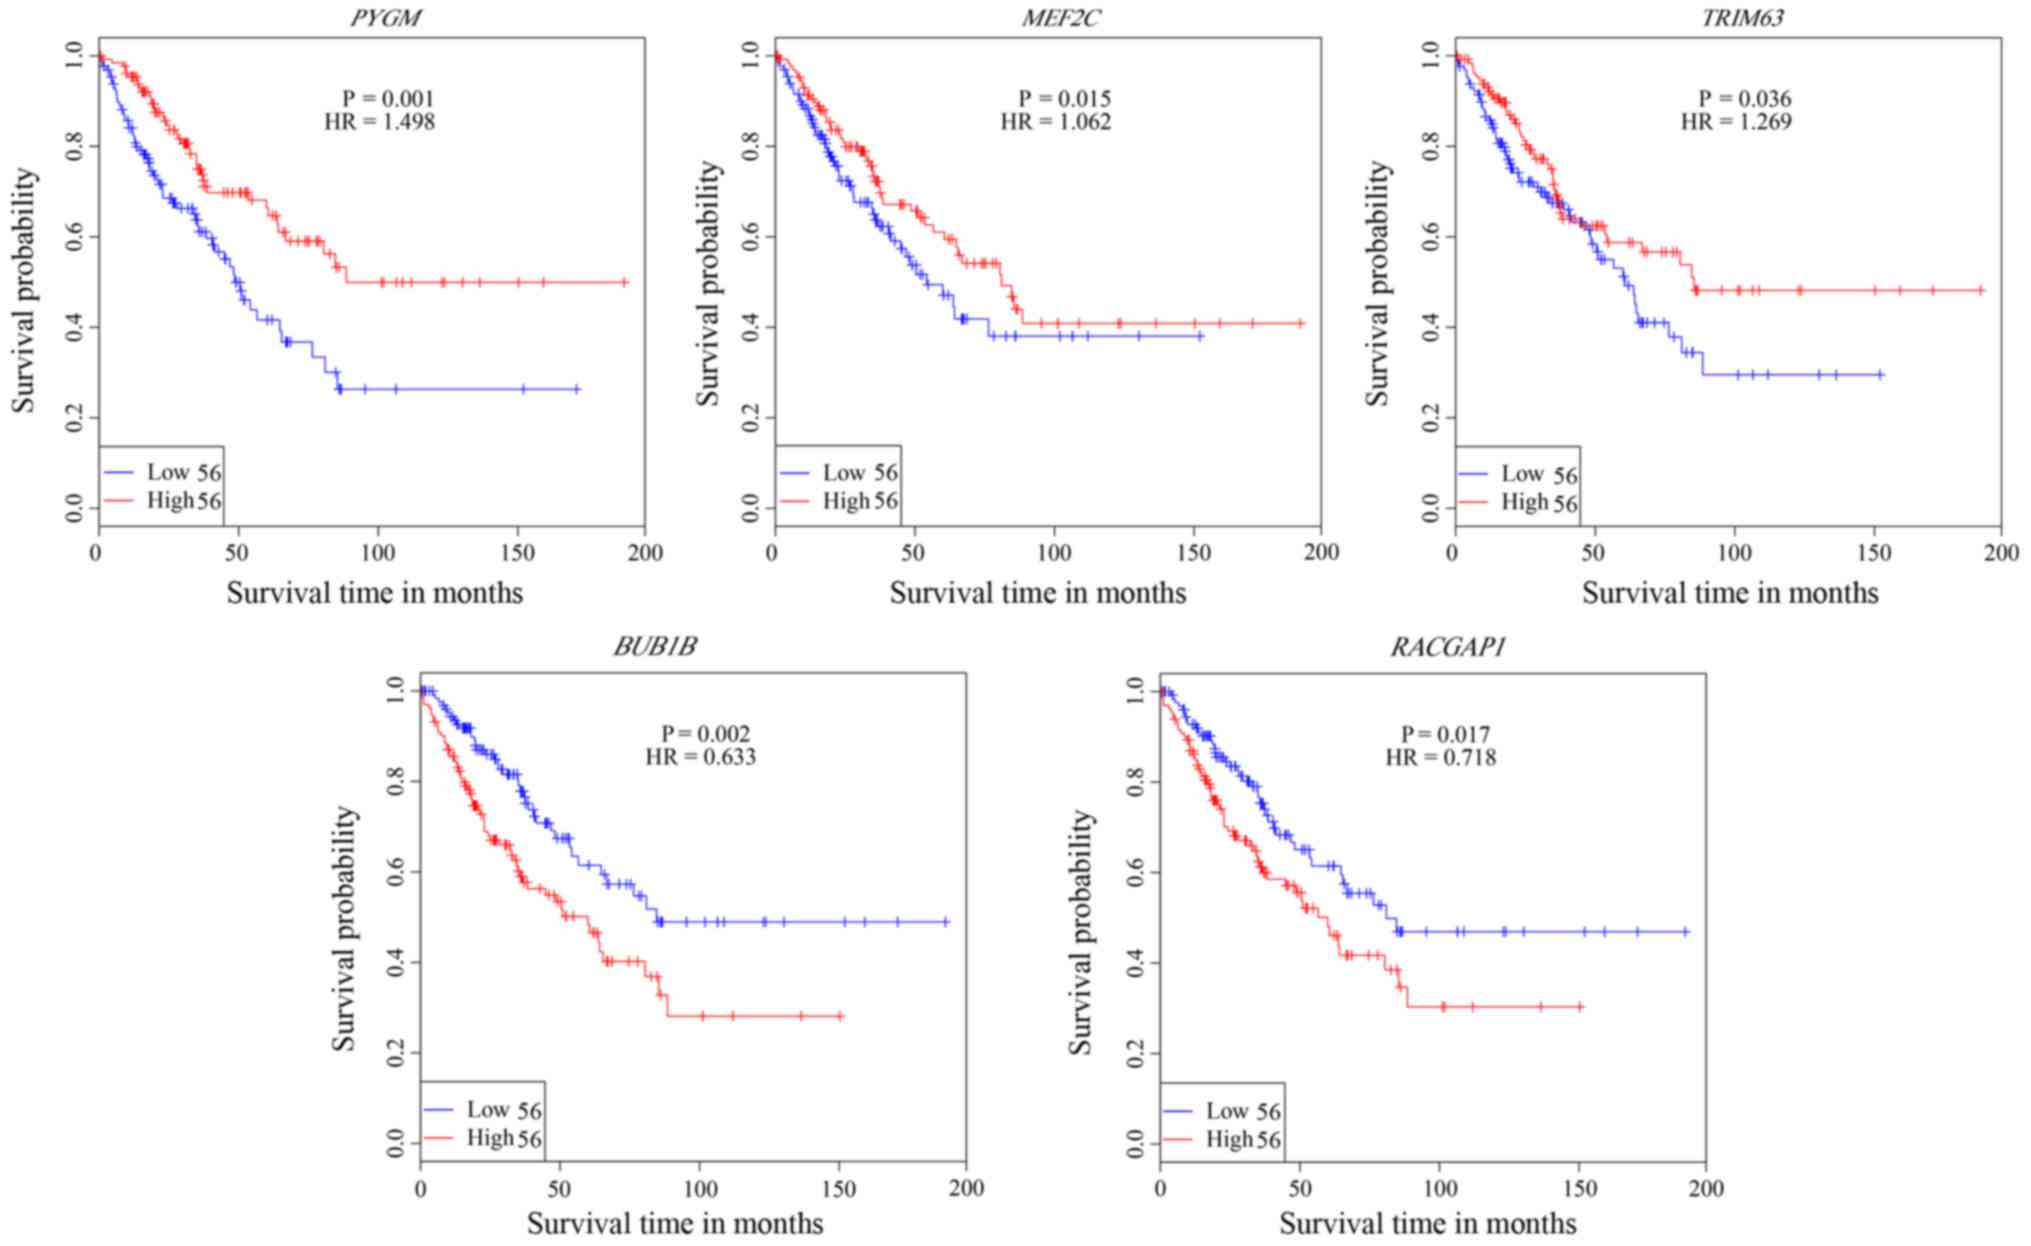
profiles in normal and ES samples. Kaplan-Meier analysis of the 22
genes based on the ES dataset from TCGA identified five genes,
including PYGM, MEF2C, TRIM63, BUB1B and RACGAP1,
which are significantly associated with ES OS (Fig. 5; P<0.05) in the present study.
Consistent with the differential expression analysis, upregulation
of the three downregulated genes, PYGM, MEF2C, TRIM63, is
associated with good ES prognosis, while, upregulation of the two
upregulated genes, i.e., BUB1B and RACGAP1, are
associated with poor ES prognosis (Fig. 5), which should provide valuable
diagnosis and treatment biomarkers for ES.
| Table III.A total of 22 genes with degree>10
and |log2(Fold-change)|>2. |
Table III.
A total of 22 genes with degree>10
and |log2(Fold-change)|>2.
| Gene symbol | Full name | logFC | Degree |
|---|
| ACTA1 | Actin, α 1,
skeletal muscle | −5.18 | 31 |
| TNNT1 | Troponin T1, slow
skeletal type | −4.19 | 15 |
| PYGM | Glycogen
phosphorylase, muscle associated | −4.02 | 15 |
| MYBPC2 | Myosin binding
protein C, fast type | −3.91 | 13 |
| NEB | Nebulin | −3.31 | 14 |
| FHL1 | Four and A half LIM
domains 1 | −3.23 | 11 |
| TCAP | Titin-Cap | −3.13 | 11 |
| TRIM63 | Tripartite motif
containing 63 | −3.01 | 27 |
| RYR1 | Ryanodine receptor
1 | −2.94 | 10 |
| TTN | Titin | −2.90 | 36 |
| ACTN2 | Actinin α 2 | −2.86 | 16 |
| SGCG | Sarcoglycan γ | −2.68 | 14 |
| CRYAB | Crystallin α B | −2.59 | 14 |
| EEF1A2 | Eukaryotic
translation elongation factor 1 α 2 | −2.57 | 11 |
| ENO3 | Enolase 3 | −2.13 | 11 |
| MEF2C | Myocyte enhancer
factor 2C | −2.06 | 10 |
| PRKCQ | Protein kinase C
θ | −2.06 | 19 |
| FLNC | Filamin C | −2.02 | 16 |
| RACGAP1 | Ras GTPase
activating protein 1 | 2.15 | 10 |
| BUB1B | BUB1 mitotic
checkpoint serine/threonine kinase B | 2.20 | 12 |
| EZH2 | Enhancer of zeste 2
polycomb repressive complex 2 subunit | 2.61 | 31 |
| CCND1 | Cyclin D1 | 2.75 | 16 |
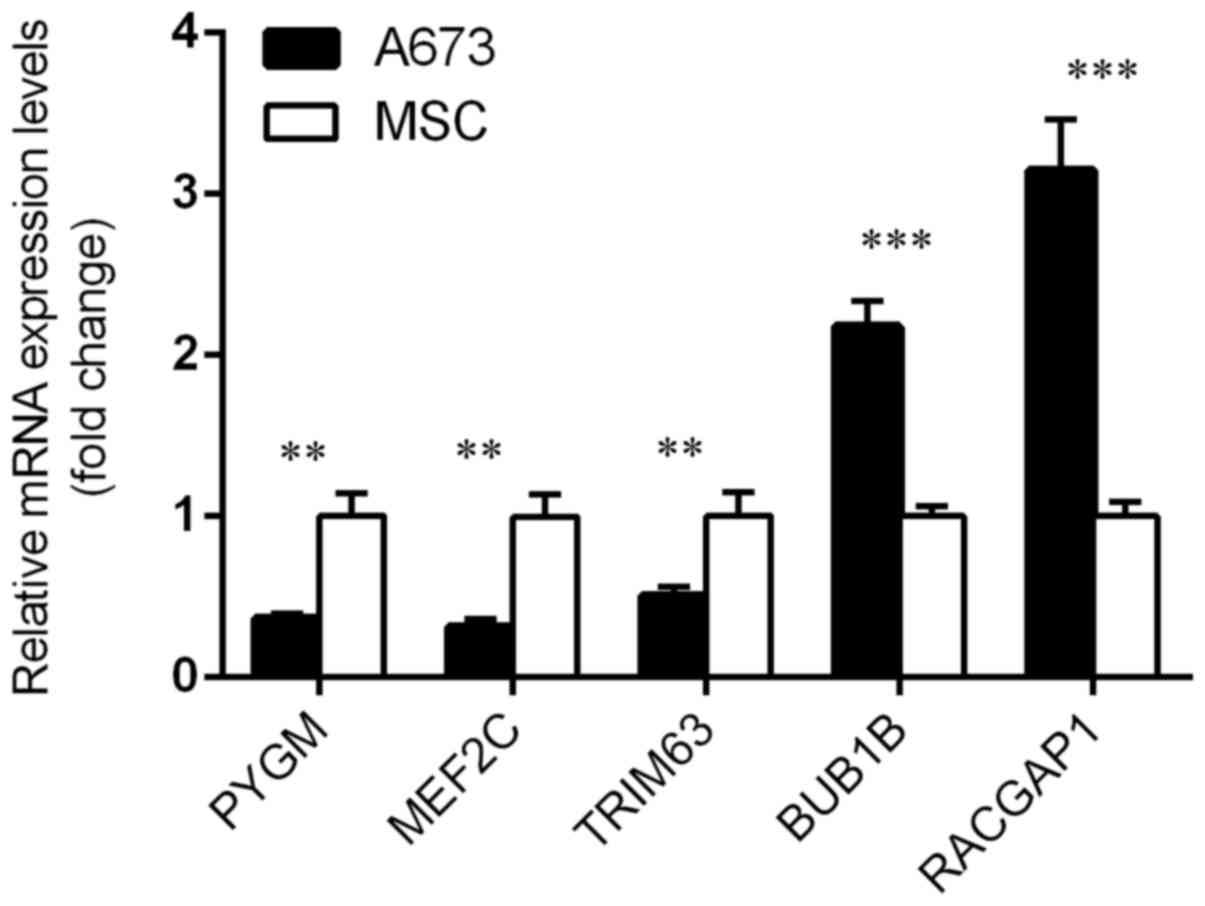
RT-qPCR
Expression differences of PYGM, MEF2C, TRIM63,
BUB1B and RACGAP1 between the ES cell lines A673 and
normal cell lines MSC were investigated using RT-qPCR for their
significant associations with OSCC's OS. Consistent with results
from the microarray analysis, PYGM, MEF2C and TRIM63
were downregulated, and BUB1B and RACGAP1 were
upregulated in the ES cell line compared with the normal cells
(Fig. 6).
Discussion
Ewing sarcoma is the second most frequent bone
malignancy in children and adolescents (26). Chemotherapy and surgery are
currently the main therapeutic modalities for ES (27). Despite aggressive therapy, the OS
of ES patients is still dismal. The cure rate could be notably
improved by the identification of molecular markers to aid the
effective early diagnosis of malignancy and the prevention of tumor
metastasis. In the present study, a meta-analysis of the
transcriptomes of ES samples from three gene expression microarray
datasets was performed, and 1,470 DEGs were identified, consisting
of 984 up- and 486 downregulated genes. Using the DEGs, an ES
disease network was constructed and six ES-associated disease
clusters were obtained. Survival analysis identified five genes
that were significantly associated with the survival rate of
patients with ES.
GO term enrichment and clustering analysis were
conducted for the 1,470 DEGs, and the GO terms were divided into
five groups according to their biological roles in cell metabolism.
The five groups are involved in the following physiological
processes: Muscle contraction and morphogenesis, cell mitotic
nuclear division and microtubule-based process, cell adhesion, heat
generation process, and gluconeogenesis. Advanced malignancies that
are often associated with bone metastasis can cause skeletal muscle
weakness; the skeletal muscle quality is associated with muscle
contraction and morphogenesis (28). A previous study demonstrated that
metastasis-induced transforming growth factor (TGF)-β release from
bone contributes to muscle weakness by decreasing
Ca2+-induced muscle force production (29). Cell mitosis is closely associated
with tumor progression and metastasis; there, microtubules have
been a major target for anticancer drugs development (30). Physiological thermogenesis is
beneficial for damaging tumor tissues and improving the clinical
outcomes of patients with cancer, while hyperthermia has a direct
killing effect on tumor cells and can have an inhibitory effect on
tumor metastasis (31).
Gluconeogenesis is a metabolic process whereby the body generates
glucose from non-carbohydrate carbon source and provides energy for
the growth and survival of cells (32). Studies have suggested that
gluconeogenesis could cause a metabolic stress and therefore
disrupt the metabolic rewiring of cancer cells (33,34).
The five GO term groups identified in the present study, are all
involved in cancer progression and metastasis, representing the
typical ES progression-associated biological processes (35,36).
As previously stated, based on the 1,470 DEGs, an ES
disease network was constructed, and six disease clusters were
ultimately identified. Several cancer-associated signaling pathways
and metabolic processes were observed by enrichment analysis for
the DEGs in each cluster. The cGMP-PKG signaling pathway was
significantly enriched in the DEGs of clusters 1 and 3 and proved
to be closely associated with tumor progression. Upregulated cGMP
and its downstream protein kinase G (PKG) are known to inhibit the
proliferation and induce the apoptosis of colon cancer cells, and
activated intracellular cGMP-PKG pathway is known to enhance the
degradation of β-catenin in SW480 colon cancer cells (37–39).
Calcium signaling pathways were observed in clusters 1, 3 and 6;
these signaling pathways serve a significant role in the cell
apoptosis process (35). Under
pathological conditions, the Ca2+ level is markedly
increased in many types of cells, resulting in the enhanced
expression of pro-apoptotic factors (40). Curcumin, a traditional Chinese
medicine, may induce cell apoptosis through upregulating the
Ca2+ level in lung cancer cells (35,41,42).
Certain disease-type markers, including Parkinson's disease (PD)
associated genes [VDAC1 (43),
VDAC3 (44)], were observed in
clusters 1 and 3. Many studies have demonstrated that the cancer
incidence in patients with PD is significantly lower than in the
patients without PD, but the detailed mechanism remains to be
explored (45). Many DEGs involved
in the cell cycle process were in clusters 4 and 6. Cell
proliferation is an essential mechanism for the growth, development
and regeneration of eukaryotic organisms. Therefore, targeting the
cell cycle process to regulate cell proliferation has been one of
the most effective approaches to treat cancers (46). Other signaling pathways or
metabolic processes such as the mRNA surveillance pathway, the
AGE-RAGE signaling pathway in diabetic complications, RNA
degradation, cysteine and methionine metabolism and others were
also observed in certain clusters. These signaling pathways or
metabolic processes observed by enrichment analysis of the DEGs may
participate in the progression and metastasis of ES and could also
be considered potential molecular targets for early diagnosis and
therapy (35,36).
Survival analysis revealed that five DEGs were
significantly associated with the survival rates of ES patients.
BUB1B and RACGAP1 were markedly upregulated in the ES
samples. BUB1B, a member of the spindle assembly checkpoint
protein family, has been associated with many types of cancer
(47,48). Upregulated expression of
BUB1B enhanced the proliferation, migration, and invasion
ability of prostate cancer cell lines (48). RACGAP1 is a component of the
central spindle and essential for the induction of cytokinesis.
Overexpressed RACGAP1 was associated with poor disease-free
and overall survival, and may act as an independent predictive
marker for lymph node metastasis, recurrence and poor prognosis of
colorectal cancer (49–51). The present results demonstrated
that the expression of BUB1B and RACGAP1 in ES
samples is negatively associated with the survival rates of ES
patients. In addition, the downregulated expression of PYGM,
MEF2C, and TRIM63 was also observed in the present
study, with their expression being positively associated with the
survival rates of ES patients. The present results suggest that
BUB1B, RACGAP1, PYGM, MEF2C, and TRIM63 may be
considered potential markers for the prognosis of ES, but this
needs to be investigated further.
In summary, the transcriptomes of ES samples from
three independent gene expression chips was investigated and six
disease clusters based on the 1,470 DEGs was constructed. Several
cancer-associated signaling pathways, metabolic processes, or
disease types were identified by the enrichment analysis, that
could act as potential markers for early diagnosis and as targets
for therapy. Survival analysis revealed that five DEGs were
significantly associated with the survival rates of ES patients and
could be considered predictive markers for the prognosis of ES, but
this needs to be investigated further.
In the present study, a comprehensive analysis of
three ES-associated microarray datasets was conducted and several
KEGG pathways and GO term clusters that may be involved in ES
progression were obtained. Additionally, five genes that are
significantly associated with OS of patients with ES were
identified, which may be helpful for ES early diagnosis and
treatment, but this needs to be validated in future studies.
Acknowledgements
Not applicable.
Funding
No funding was received.
Availability of data and materials
The datasets generated and/or analyzed during the
current study are available in the NCBI repository: https://www.ncbi.nlm.nih.gov/geo/query/acc.cgi?acc=GSE34620;
https://www.ncbi.nlm.nih.gov/geo/query/acc.cgi?acc=GSE17618;
https://www.ncbi.nlm.nih.gov/geo/query/acc.cgi?acc=GSE17674.
Authors' contributions
YXQ put forward the ideas of this article, wrote
this article and analyzed the data. SJB helped revise the
manuscript, analyzed the data and put forward ideas for the
article. ZHY helped with acquisition of data, and analysis and
interpretation of data. WS provided valuable instructions and the
figure combinations, analyzed the data and study design, and helped
revising the manuscript. All authors read and approved the final
manuscript.
Ethics approval and consent to
participate
Not applicable.
Patient consent for publication
Not applicable.
Competing interests
The authors declare that they have no competing
interests.
References
|
1
|
Balamuth NJ and Womer RB: Ewing's sarcoma.
Lancet Oncol. 11:184–192. 2010. View Article : Google Scholar : PubMed/NCBI
|
|
2
|
Sand LG, Szuhai K and Hogendoorn PC:
Sequencing overview of ewing sarcoma: A journey across genomic,
epigenomic and transcriptomic landscapes. Int J Mol Sci.
16:16176–16215. 2015. View Article : Google Scholar : PubMed/NCBI
|
|
3
|
Kovar H, Alonso J, Aman P, Aryee DN, Ban
J, Burchill SA, Burdach S, De Alava E, Delattre O, Dirksen U, et
al: The first European interdisciplinary ewing sarcoma research
summit. Front Oncol. 2:542012. View Article : Google Scholar : PubMed/NCBI
|
|
4
|
Paulussen M, Ahrens S, Burdach S, Craft A,
Dockhorn-Dworniczak B, Dunst J, Fröhlich B, Winkelmann W, Zoubek A
and Jürgens H: Primary metastatic (stage IV) Ewing tumor: Survival
analysis of 171 patients from the EICESS studies. European
intergroup cooperative ewing sarcoma studies. Ann Oncol. 9:275–281.
1998. View Article : Google Scholar : PubMed/NCBI
|
|
5
|
Postel-Vinay S, Veron AS, Tirode F,
Pierron G, Reynaud S, Kovar H, Oberlin O, Lapouble E, Ballet S,
Lucchesi C, et al: Common variants near TARDBP and EGR2 are
associated with susceptibility to Ewing sarcoma. Nat Genet.
44:323–327. 2012. View
Article : Google Scholar : PubMed/NCBI
|
|
6
|
Delattre O, Zucman J, Plougastel B,
Desmaze C, Melot T, Peter M, Kovar H, Joubert I, de Jong P, Rouleau
G, et al: Gene fusion with an ETS DNA-binding domain caused by
chromosome translocation in human tumours. Nature. 359:162–165.
1992. View
Article : Google Scholar : PubMed/NCBI
|
|
7
|
Delattre O, Zucman J, Melot T, Garau XS,
Zucker JM, Lenoir GM, Ambros PF, Sheer D, Turc-Carel C, Triche TJ,
et al: The Ewing family of tumors-a subgroup of small-round-cell
tumors defined by specific chimeric transcripts. N Engl J Med.
331:294–299. 1994. View Article : Google Scholar : PubMed/NCBI
|
|
8
|
Sorensen PH, Lessnick SL, Lopez-Terrada D,
Liu XF, Triche TJ and Denny CT: A second Ewing's sarcoma
translocation, t(21;22), fuses the EWS gene to another ETS-family
transcription factor, ERG. Nat Genet. 6:146–151. 1994. View Article : Google Scholar : PubMed/NCBI
|
|
9
|
Potratz J, Dirksen U, Jurgens H and Craft
A: Ewing sarcoma: Clinical state-of-the-art. Pediatr Hematol Oncol.
29:1–11. 2012. View Article : Google Scholar : PubMed/NCBI
|
|
10
|
Jeon IS, Davis JN, Braun BS, Sublett JE,
Roussel MF, Denny CT and Shapiro DN: A variant Ewing's sarcoma
translocation (7;22) fuses the EWS gene to the ETS gene ETV1.
Oncogene. 10:1229–1234. 1995.PubMed/NCBI
|
|
11
|
Kaneko Y, Yoshida K, Handa M, Toyoda Y,
Nishihira H, Tanaka Y, Sasaki Y, Ishida S, Higashino F and Fujinaga
K: Fusion of an ETS-family gene, EIAF, to EWS by t(17;22)(q12;q12)
chromosome translocation in an undifferentiated sarcoma of infancy.
Genes Chromosomes Cancer. 15:115–121. 1996. View Article : Google Scholar : PubMed/NCBI
|
|
12
|
Peter M, Couturier J, Pacquement H, Michon
J, Thomas G, Magdelenat H and Delattre O: A new member of the ETS
family fused to EWS in Ewing tumors. Oncogene. 14:1159–1164. 1997.
View Article : Google Scholar : PubMed/NCBI
|
|
13
|
Folpe AL, Hill CE, Parham DM, O'Shea PA
and Weiss SW: Immunohistochemical detection of FLI-1 protein
expression: A study of 132 round cell tumors with emphasis on
CD99-positive mimics of Ewing's sarcoma/primitive neuroectodermal
tumor. Am J Surg Pathol. 24:1657–1662. 2000. View Article : Google Scholar : PubMed/NCBI
|
|
14
|
Rossi S, Orvieto E, Furlanetto A, Laurino
L, Ninfo V and Dei Tos AP: Utility of the immunohistochemical
detection of FLI-1 expression in round cell and vascular neoplasm
using a monoclonal antibody. Mod Pathol. 17:547–552. 2004.
View Article : Google Scholar : PubMed/NCBI
|
|
15
|
Lin O, Filippa DA and Teruya-Feldstein J:
Immunohistochemical evaluation of FLI-1 in acute lymphoblastic
lymphoma (ALL): A potential diagnostic pitfall. Appl
Immunohistochem Mol Morphol. 17:409–412. 2009. View Article : Google Scholar : PubMed/NCBI
|
|
16
|
Savola S, Klami A, Myllykangas S, Manara
C, Scotlandi K, Picci P, Knuutila S and Vakkila J: High expression
of complement component 5 (C5) at tumor site associates with
superior survival in Ewing's sarcoma family of tumour patients.
ISRN Oncol. 2011:1687122011.PubMed/NCBI
|
|
17
|
Leek JT, Johnson WE, Parker HS, Jaffe AE
and Storey JD: The sva package for removing batch effects and other
unwanted variation in high-throughput experiments. Bioinformatics.
28:882–883. 2012. View Article : Google Scholar : PubMed/NCBI
|
|
18
|
Diboun I, Wernisch L, Orengo CA and
Koltzenburg M: Microarray analysis after RNA amplification can
detect pronounced differences in gene expression using limma. BMC
Genomics. 7:2522006. View Article : Google Scholar : PubMed/NCBI
|
|
19
|
Huang da W, Sherman BT and Lempicki RA:
Systematic and integrative analysis of large gene lists using DAVID
bioinformatics resources. Nat Protoc. 4:44–57. 2009. View Article : Google Scholar : PubMed/NCBI
|
|
20
|
Merico D, Isserlin R, Stueker O, Emili A
and Bader GD: Enrichment map: A network-based method for gene-set
enrichment visualization and interpretation. PLoS One.
5:e139842010. View Article : Google Scholar : PubMed/NCBI
|
|
21
|
Kohl M, Wiese S and Warscheid B:
Cytoscape: Software for visualization and analysis of biological
networks. Methods Mol Biol. 696:291–303. 2011. View Article : Google Scholar : PubMed/NCBI
|
|
22
|
Cowley MJ, Pinese M, Kassahn KS, Waddell
N, Pearson JV, Grimmond SM, Biankin AV, Hautaniemi S and Wu J: PINA
v2.0: Mining interactome modules. Nucleic Acids Res. 40(Database
Issue): D862–D865. 2012. View Article : Google Scholar : PubMed/NCBI
|
|
23
|
Menche J, Sharma A, Kitsak M, Ghiassian
SD, Vidal M, Loscalzo J and Barabási AL: Disease networks.
Uncovering disease-disease relationships through the incomplete
interactome. Science. 347:12576012015. View Article : Google Scholar : PubMed/NCBI
|
|
24
|
Livak KJ and Schmittgen TD: Analysis of
relative gene expression data using real-time quantitative PCR and
the 2(-Delta Delta C(T)) method. Methods. 25:402–408. 2001.
View Article : Google Scholar : PubMed/NCBI
|
|
25
|
Xie C, Mao X, Huang J, Ding Y, Wu J, Dong
S, Kong L, Gao G, Li CY and Wei L: KOBAS 2.0: A web server for
annotation and identification of enriched pathways and diseases.
Nucleic Acids Res. 39:W316–W322. 2011. View Article : Google Scholar : PubMed/NCBI
|
|
26
|
Hamanoue S and Makimoto A: Ewing sarcoma.
Gan To Kagaku Ryoho. 34:175–180. 2007.(In Japanese). PubMed/NCBI
|
|
27
|
Ray-Coquard I and Le Cesne A: A role for
maintenance therapy in managing sarcoma. Cancer Treat Rev.
38:368–378. 2012. View Article : Google Scholar : PubMed/NCBI
|
|
28
|
Fearon KC, Glass DJ and Guttridge DC:
Cancer cachexia: Mediators, signaling, and metabolic pathways. Cell
Metab. 16:153–166. 2012. View Article : Google Scholar : PubMed/NCBI
|
|
29
|
Waning DL, Mohammad KS, Reiken S, Xie W,
Andersson DC, John S, Chiechi A, Wright LE, Umanskaya A, Niewolna
M, et al: Excess TGF-β mediates muscle weakness associated with
bone metastases in mice. Nat Med. 21:1262–1271. 2015. View Article : Google Scholar : PubMed/NCBI
|
|
30
|
He Y, Yan D, Zheng D, Hu Z, Li H and Li J:
Cell division cycle 6 promotes mitotic slippage and contributes to
drug resistance in paclitaxel-treated cancer cells. PLoS One.
11:e01626332016. View Article : Google Scholar : PubMed/NCBI
|
|
31
|
Yan B, Ouyang R, Huang C, Liu F, Neill D,
Li C and Dewhirst M: Heat induces gene amplification in cancer
cells. Biochem Biophys Res Commun. 427:473–477. 2012. View Article : Google Scholar : PubMed/NCBI
|
|
32
|
Rui L: Energy metabolism in the liver.
Compr Physiol. 4:177–197. 2014. View Article : Google Scholar : PubMed/NCBI
|
|
33
|
Ma R, Zhang W, Tang K, Zhang H, Zhang Y,
Li D, Li Y, Xu P, Luo S, Cai W, et al: Switch of glycolysis to
gluconeogenesis by dexamethasone for treatment of hepatocarcinoma.
Nat Commun. 4:25082013. View Article : Google Scholar : PubMed/NCBI
|
|
34
|
Khan MW and Chakrabarti P: Gluconeogenesis
combats cancer: Opening new doors in cancer biology. Cell Death
Dis. 6:e18722015. View Article : Google Scholar : PubMed/NCBI
|
|
35
|
Xu X, Chen D, Ye B, Zhong F and Chen G:
Curcumin induces the apoptosis of non-small cell lung cancer cells
through a calcium signaling pathway. Int J Mol Med. 35:1610–1616.
2015. View Article : Google Scholar : PubMed/NCBI
|
|
36
|
Ventura S, Aryee DN, Felicetti F, De Feo
A, Mancarella C, Manara MC, Picci P, Colombo MP, Kovar H, Carè A
and Scotlandi K: CD99 regulates neural differentiation of Ewing
sarcoma cells through miR-34a-Notch-mediated control of NF-kB
signaling. Oncogene. 35:3944–3954. 2016. View Article : Google Scholar : PubMed/NCBI
|
|
37
|
Tetsu O and McCormick F: Beta-catenin
regulates expression of cyclin D1 in colon carcinoma cells. Nature.
398:422–426. 1999. View
Article : Google Scholar : PubMed/NCBI
|
|
38
|
Li H, Liu L, David ML, Whitehead CM, Chen
M, Fetter JR, Sperl GJ, Pamukcu R and Thompson WJ: Pro-apoptotic
actions of exisulind and CP461 in SW480 colon tumor cells involve
beta-catenin and cyclin D1 down-regulation. Biochem Pharmacol.
64:1325–1336. 2002. View Article : Google Scholar : PubMed/NCBI
|
|
39
|
Ren Y, Zheng J, Yao X, Weng G and Wu L:
Essential role of the cGMP/PKG signaling pathway in regulating the
proliferation and survival of human renal carcinoma cells. Int J
Mol Med. 34:1430–1438. 2014. View Article : Google Scholar : PubMed/NCBI
|
|
40
|
Lv Y, Fang M, Zheng J, Yang B, Li H,
Xiuzigao Z, Song W, Chen Y and Cao W: Low-intensity ultrasound
combined with 5-aminolevulinic acid administration in the treatment
of human tongue squamous carcinoma. Cell Physiol Biochem.
30:321–333. 2012. View Article : Google Scholar : PubMed/NCBI
|
|
41
|
Seo SR and Seo JT: Calcium overload is
essential for the acceleration of staurosporine-induced cell death
following neuronal differentiation in PC12 cells. Exp Mol Med.
41:269–276. 2009. View Article : Google Scholar : PubMed/NCBI
|
|
42
|
Ma TS: Sarcoplasmic reticulum calcium
ATPase overexpression induces cellular calcium overload and cell
death. Ann N Y Acad Sci. 853:325–328. 1998. View Article : Google Scholar : PubMed/NCBI
|
|
43
|
Narendra D, Kane LA, Hauser DN, Fearnley
IM and Youle RJ: p62/SQSTM1 is required for Parkin-induced
mitochondrial clustering but not mitophagy; VDAC1 is dispensable
for both. Autophagy. 6:1090–1106. 2010. View Article : Google Scholar : PubMed/NCBI
|
|
44
|
Shamir R, Klein C, Amar D, Vollstedt EJ,
Bonin M, Usenovic M, Wong YC, Maver A, Poths S, Safer H, et al:
Analysis of blood-based gene expression in idiopathic Parkinson
disease. Neurology. 89:1676–1683. 2017. View Article : Google Scholar : PubMed/NCBI
|
|
45
|
Bajaj A, Driver JA and Schernhammer ES:
Parkinson's disease and cancer risk: A systematic review and
meta-analysis. Cancer Causes Control. 21:697–707. 2010. View Article : Google Scholar : PubMed/NCBI
|
|
46
|
Diaz-Moralli S, Tarrado-Castellarnau M,
Miranda A and Cascante M: Targeting cell cycle regulation in cancer
therapy. Pharmacol Ther. 138:255–271. 2013. View Article : Google Scholar : PubMed/NCBI
|
|
47
|
Ding Y, Hubert CG, Herman J, Corrin P,
Toledo CM, Skutt-Kakaria K, Vazquez J, Basom R, Zhang B, Risler JK,
et al: Cancer-Specific requirement for BUB1B/BUBR1 in human brain
tumor isolates and genetically transformed cells. Cancer Discov.
3:198–211. 2013. View Article : Google Scholar : PubMed/NCBI
|
|
48
|
Fu X, Chen G, Cai ZD, Wang C, Liu ZZ, Lin
ZY, Wu YD, Liang YX, Han ZD, Liu JC and Zhong WD: Overexpression of
BUB1B contributes to progression of prostate cancer and predicts
poor outcome in patients with prostate cancer. Onco Targets Ther.
9:2211–2220. 2016.PubMed/NCBI
|
|
49
|
Zhao WM and Fang G: MgcRacGAP controls the
assembly of the contractile ring and the initiation of cytokinesis.
Proc Natl Acad Sci USA. 102:13158–13163. 2005. View Article : Google Scholar : PubMed/NCBI
|
|
50
|
Kitamura T, Kawashima T, Minoshima Y,
Tonozuka Y, Hirose K and Nosaka T: Role of MgcRacGAP/Cyk4 as a
regulator of the small GTPase Rho family in cytokinesis and cell
differentiation. Cell Struct Funct. 26:645–651. 2001. View Article : Google Scholar : PubMed/NCBI
|
|
51
|
Imaoka H, Toiyama Y, Saigusa S, Kawamura
M, Kawamoto A, Okugawa Y, Hiro J, Tanaka K, Inoue Y, Mohri Y and
Kusunoki M: RacGAP1 expression, increasing tumor malignant
potential, as a predictive biomarker for lymph node metastasis and
poor prognosis in colorectal cancer. Carcinogenesis. 36:346–354.
2015. View Article : Google Scholar : PubMed/NCBI
|